A Primordial Origin for the Gas-Rich Debris Disks Around Intermediate-Mass Stars
Abstract
While most debris disks consist of dust with little or no gas, a fraction has significant amounts of gas detected via emission lines of CO, ionized carbon, and/or atomic oxygen. Almost all such gaseous debris disks known are around A-type stars with ages up to 50 Myr. We show, using semi-analytic disk evolution modeling, that this can be understood if the gaseous debris disks are remnant protoplanetary disks that have become depleted of small grains compared to the interstellar medium. Photoelectric heating by the A-stars’ FUV radiation is then inefficient, while the stars’ EUV and X-ray emissions are weak owing to a lack of surface convective zones capable of driving magnetic activity. In this picture, stars outside the range of spectral types from A through early B are relatively hard to have such long-lived gas disks. Less-massive stars have stronger magnetic activity in the chromosphere, transition region, and corona with resulting EUV and X-ray emission, while more-massive stars have photospheres hot enough to produce strong EUV radiation. In both cases, primordial disk gas is likely to photoevaporate well before 50 Myr. These results come from 0D disk evolution models where we incorporate internal accretion stresses, MHD winds, and photoevaporation by EUV and X-ray photons with luminosities that are functions of the stellar mass and age. A key issue this work leaves open is how some disks become depleted in small dust so that FUV photoevaporation slows. Candidates include grains’ growth, settling, radial drift, radiation force, and incorporation into planetary systems.
1 Introduction
A fundamental goal of planet formation research is to learn the evolutionary pathways that protoplanetary disks (PPDs) follow to become planetary systems and their associated debris disks. Classically the PPD lifetime is estimated to be no longer than , based on near- and mid-infrared (IR) observations which trace the inner hot dust (; Haisch et al., 2001; Meyer et al., 2007; Hernández et al., 2007; Mamajek, 2009; Ribas et al., 2014, 2015) and ultraviolet (UV) and H observations tracing accreting gas (e.g., Kennedy & Kenyon, 2009; Fedele et al., 2010; Sicilia-Aguilar et al., 2010). Ten Myr is thus considered a typical timescale on which gas-rich PPDs evolve into gas-free debris disks.
An explanation is therefore needed for the more than 20 gaseous debris disks observed around stars older than (e.g., Kóspál et al., 2013; Marino et al., 2016; Lieman-Sifry et al., 2016; Moór et al., 2017; Hughes et al., 2017; Higuchi et al., 2017, 2019b, 2019a; Kral et al., 2020). Two hypotheses have been proposed for the origins of this gas. In the primordial-origin scenario, the gas is a remnant of the PPD. In the secondary-origin scenario, the gas was released more recently from volatiles in planetesimals associated with the dust in the debris disks.
While the secondary-origin scenario has been extensively examined through modeling (Kral et al., 2016, 2019; Moór et al., 2019; Matrà et al., 2019; Marino et al., 2020; Cataldi et al., 2020; Marino et al., 2022), less attention has been paid to the primordial-origin scenario (Nakatani et al., 2021; Smirnov-Pinchukov et al., 2022; Iwasaki et al., 2023). A primordial origin has been considered unlikely because of the short canonical PPD gas disk lifetime. However, hydrodynamical modeling by Nakatani et al. (2021) shows that if the PPD around an intermediate-mass star () is depleted in submicron grains, including polycyclic aromatic hydrocarbons (PAHs), then the photoelectric heating produced when FUV photons strike grains is weak enough to slow photoevaporation so the gas could survive well past and into the debris disk stage — without small-grain depletion, the gas lifetimes are most likely regardless of stellar masses (Komaki et al., 2023). Primordial origins thus have the potential to account for the occurrence of gaseous debris disks around A stars (Lieman-Sifry et al., 2016; Moór et al., 2017; Hughes et al., 2018).
The outstanding questions include what gas lifetimes to expect quantitatively in the primordial origin scenario, how these depend on the stellar mass, and whether the results are consistent with the observed occurrence rates of gaseous debris disks. We here address these issues by constructing disk evolution models using a semi-analytic, 0D approach.
2 Overall picture of gas disk evolution
Theoretical works indicate the gas disks are dispersed by accretion onto the central star (Shakura & Sunyaev, 1973; Lynden-Bell & Pringle, 1974) and by ejection in winds, launched either by magnetic forces (e.g., Suzuki & Inutsuka, 2009; Bai & Stone, 2013a, b) or by photoevaporation (e.g., Shu et al., 1993; Hollenbach et al., 1994; Richling & Yorke, 1998). These three processes’ relative importance varies over the course of disk evolution: accretion and/or magnetohydrodynamic (MHD) winds dominate the mass loss in the early stage when the disk is relatively massive, while photoevaporation dominates later when the disk mass decreases to at ages of 1–10 (e.g., Clarke et al., 2001; Gorti et al., 2015; Carrera et al., 2017; Kunitomo et al., 2020, 2021; Weder et al., 2023; Komaki et al., 2023).
This picture of time-varying disk dispersal processes is consistent with several observational facts. For instance, class 0/I jets have much larger mass-loss rates () than photoevaporation can provide, implying the ejection is driven by MHD effects in these early stages. For another example, the luminosity of a photoevaporative wind tracer, the [Ne II] 12.8 low-velocity component, is higher for more evolved disks, i.e., slow accretors () and inner-dust-depleted disks (Pascucci et al., 2020).
Jet and wind mass-loss rates in the upper end of the range imply possibly enough material crossing the lines of sight between star and disk to block much of the stellar ultraviolet (UV) and X-ray radiation. This can slow or stop the disk’s photoevaporation (for a recent review, see Pascucci et al., 2022). In 3D MHD modeling by Takasao et al. (2022), the outflow from the disk around a solar-mass star has a column density high enough to attenuate the UV and X-ray photons at accretion rates . Overall, a fairly advanced age and low rates of accretion and outflow appear necessary before photoevaporation can dominate gas disk dispersal.
3 Gas Lifetime Estimate
For the primordial-origin hypothesis to be a possible scenario, one of the critical necessary conditions PPDs must meet is to retain a mass reservoir beyond , especially at outer radii () where gaseous debris disks are detected. This study’s primary objective is to demonstrate its feasibility, which was previously considered implausible. Our model will be tailored for this purpose, as will described below.
We focus on the disks where PAH and small grains () are depleted compared to the interstellar medium. These are the systems that potentially meet the necessary condition; otherwise, the disks dissipating through rapid photoelectric heating most likely have short lifetimes (Gorti et al., 2009, 2015; Komaki et al., 2021, 2023); we ignore this population. Thus, we here derive the lifetime for the sub-population of PPDs where the gas is the longest-lived. The estimated lifetime is distinct from the average gas lifetime, which depends on the still-unknown probability of achieving a small-grain-depleted state.
We do not specify here the processes responsible for grain depletion. Instead, we simply assume the disks reach a small-grain-depleted state before photoevaporation begins to dominate disk dispersal, regardless of the stellar mass. Several effects can deplete the dust, especially for intermediate-mass stars: Grain growth and radial drift reduce the local dust-to-gas ratio (e.g., Sellek et al., 2020). The drift is likely especially rapid around young intermediate-mass stars (Pinilla et al., 2022). The intense radiation force from intermediate-mass stars can also blow out small dust (Owen & Kollmeier, 2019; Nakatani et al., 2021).
The specific level of small-grain depletion needed to inhibit FUV photoevaporation remains uncertain. Nakatani et al. (2018a, b) explored FUV photoevaporation varying disk metallicity and demonstrated that strong FUV photoevaporation demands small grain abundance exceeding of the ISM level. However, these investigations focus on a star with extremely high FUV luminosity, lowering oxygen and carbon abundances with metallicity, which limits the results’ general applicability. The critical small-grain abundance depends on stellar mass and FUV/X-ray luminosities, yet prior studies explored a limited parameter space. Further investigations are warranted. Nevertheless, it is likely that critical small-grain abundances exist, below which FUV photoevaporation becomes negligible. We anticipate this threshold to be around of the ISM level, following Nakatani et al. (2018a, b).
Observations suggest the PAH abundance in PPDs is at least ten times less than the interstellar value (e.g., Geers et al., 2007; Oliveira et al., 2010; Vicente et al., 2013). The hybrid disk HD 141569A is depleted to a level where photoelectric heating may drive only weak photoevaporation (Li & Lunine, 2003; Thi et al., 2014). Non-detection of PAHs occur with a reasonable fraction in Herbig disks, where the detection rate is (e.g., Acke et al., 2010), or in T Tauri disks, where it is ; (e.g., Geers et al., 2006). Such non-detection hints at abundances potentially over 100 times lower than interstellar levels. This significant depletion in the disk atmosphere is also indicated from mid-IR spectra (e.g, Furlan et al., 2006, 2011) and implied from IR scattered-light imaging (e.g., Mulders et al., 2013). These findings lead us to infer that these disks might be in the small-grain-depleted state.
3.1 Semi-Analytic Model
Our model employs a 0D approach, following the disk’s mass decrease from accretion and wind mass loss in the early stage and from photoevaporation in the late stage. It is based on the analytic lifetime estimate from the UV-switch model (Clarke et al., 2001, detailed in Appendix A). In their model, the major dispersal process is viscous accretion at the early stage and switches to photoevaporation beginning at the “switching time” , which defines the transition point into the late stage. Thereafter, it disperses the remaining disk mass of . This model returns , , and the gas disk lifetime analytically (cf. Eqs.A5–A7) once the disk mass (cf. Eq.(A4)) and photoevaporation rate are given as functions of time.
The original UV-switch model uses purely viscous disks, but here we consider disks evolving under angular momentum and mass extraction through a magnetically-driven wind alongside the internal angular momentum redistribution by turbulent stresses. Observational evidence that PPDs appear to evolve by driving magnetized winds is discussed by Rafikov (2017), Manara et al. (2022), and Pascucci et al. (2022). We adopt the analytic disk evolution model of Chambers (2019) for , as set out in §B. We first derive and by finding the time when the disk mass loss and photoevaporation rates equal; we will define later. is then the time till the remaining mass is photoevaporated, found by numerically integrating
The resulting is insensitive to the choice of the threshold mass to define “dispersal”, as falls rapidly after . The disk’s initial mass is taken as proportional to the stellar mass with (e.g., Williams & Cieza, 2011; Andrews et al., 2013, however a steeper scaling is found by Pascucci et al. (2016); Ansdell et al. (2016, 2017); see Manara et al. (2022) for a recent review). We explore ’s dependence on and the scaling in Appendix D.
Photoevaporation is generally driven by far-ultraviolet (FUV), extreme-ultraviolet (EUV), and X-ray radiation. However, as stated above, we here consider only cases where FUV grain photoelectric heating is negligible, and the photoevaporative winds are driven solely by the EUV and X-ray heating associated with photoionization. We also assume that the disks are isolated from massive stars, so external photoevaporation is negligible. We use the EUV photoevaporation rate estimate
| (1) |
(Hollenbach et al., 1994; Clarke et al., 2001) since it agrees well with the mass-loss rates derived by radiation hydrodynamics simulations (Nakatani et al., 2021). Based on 1+1-D modeling, EUV photoevaporation rates were thought to increase about tenfold after the disk center is cleared out, letting the stellar EUV field dominate over the diffuse EUV from recombining ions. However, 2D axisymmetric radiative transfer showed that the direct stellar component dominates even in disks without central cavities (Tanaka et al., 2013). Additionally, radiation hydrodynamics modeling found no significant difference in photoevaporation rates with and without cavities of various sizes (Owen et al., 2010; Picogna et al., 2019; Nakatani et al., 2021). Hence, we apply the Eq.(1) photoevaporation rates uniformly throughout disk evolution.
The stellar EUV emission rate can be decomposed into photospheric, chromospheric (), transition regional (), and coronal () components. We shall refer to the last three jointly as magnetic-origin EUV, . For the photospheric EUV component, we use Kunitomo et al. (2021) Table 1 results from long-term stellar evolution calculations for . We estimate the magnetic-origin EUV emission rate from the X-ray luminosity using the relation of Shoda & Takasao (2021),
| (2) |
Strictly, this relation applies to solar-type stars, but we apply it to all the stars considered here (). Since the theoretical and observational uncertainties in are large, we believe this estimate is a reasonable first-order approximation.
We follow Kunitomo et al. (2021) for time evolution, excluding the floor applied to intermediate-mass stars in the original paper. We expect the floor not to apply universally, given that most Herbig stars do not present X-ray emissions detected at this level (e.g., Hamaguchi et al., 2005; Stelzer et al., 2006). Instead, we employ , where represents the Rossby number (Mangeney & Praderie, 1984; Noyes et al., 1984) defined as with and being the rotational period and the convective turnover timescale. Kunitomo et al. (2021) set to 3 days and calculate from the stellar evolution model. The rotational period can range between 1–10 days in general, but the qualitative trend in the time evolution of is independent of (see Section 5.2 of Kunitomo et al. (2021)). Thus, the variation of would have a limited impact on our results. The total EUV emission rate is . We omit accretion-generated EUV and X-ray here but address their influence on in Appendix C.
Stellar/interstellar Lyman-Werner (LW) radiation-driven photoevaporation might be important for small-grain-depleted disks around stars with (hereafter late intermediate-mass stars). However, our radiation hydrodynamics simulations indicate that LW photoevaporation is negligible even for late intermediate-mass stars (Nakatani et al. in prep.). Thus, we do not consider LW photoevaporation in this study. The dependence of LW photoevaporation on stellar mass and luminosity is currently unknown but warrants investigation in future research.
For X-ray photoevaporation, the mass-loss rate is still under debate. Some studies obtained large mass-loss rates (Ercolano et al., 2009; Owen et al., 2010; Picogna et al., 2019), while others found weaker mass loss (Gorti et al., 2009; Wang & Goodman, 2017; Nakatani et al., 2018b; Komaki et al., 2021). The different conclusions likely originate from the adopted X-ray spectra — mass-loss rates are high if the spectrum has a certain level of soft X-rays (, Ercolano et al., 2009; Gorti et al., 2009; Nakatani et al., 2018b; Sellek et al., 2022), from the incorporated cooling processes — the studies with large X-ray photoevaporation rates neglect important cooling processes, and from the adopted numerical methods. To cover the uncertainty of X-ray photoevaporation rates, we estimate the lifetimes with and without X-ray photoevaporation.
For X-ray photoevaporation rates, we use the formula of Owen et al. (2012),
| (3) |
(Using the formula of Picogna et al. (2019) instead results in very similar lifetimes.) Given the disagreement over X-ray photoevaporation rates discussed above, Eq.(3) must be considered an upper limit, so the corresponding is a lower limit. The total photoevaporation rate is
We calculate the lifetimes for two cases: (i) EUV only and (ii) EUV + X-ray with Eqs.(1) and (3). In Appendix E, we additionally discuss how the observed spread in (e.g., Güdel et al., 2007) can affect . Note that using the sum instead of does not make a difference, as dominates significantly.
3.2 Results
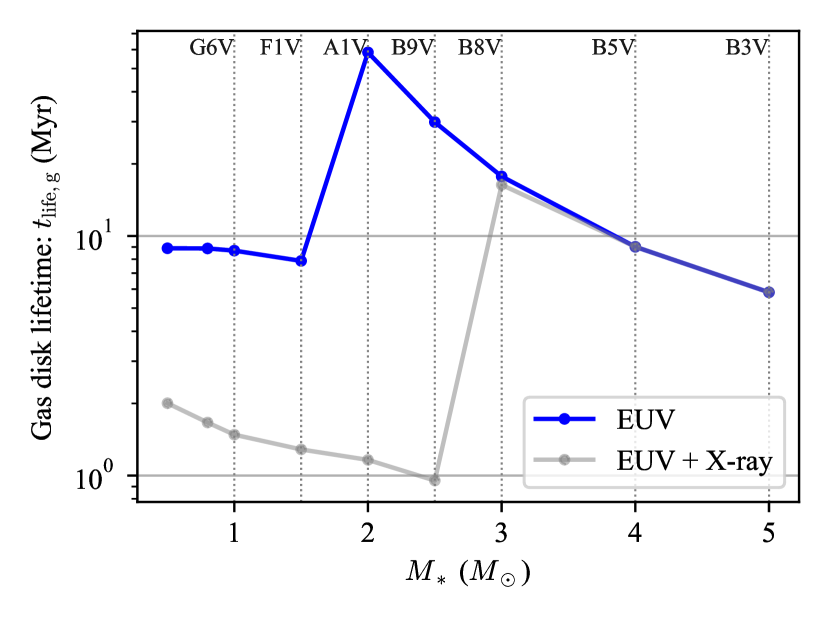
To provide an overview, we start with Figure 1, the estimated as a function of using the Chambers (2019) model for disks dominated by slow winds. Here the accretion is predominantly driven by the wind, which also extracts a significant fraction of the disk’s mass (see Section 4.3 of the original paper for details). The figure shows the corresponding spectral type at each determined by when the stars reach the zero-age-main-sequence (ZMAS) in the table of Kunitomo et al. (2021). The relation between the spectral type and is taken from Pecaut & Mamajek (2013). The table of Kunitomo et al. (2021) ends before stars with reach the ZAMS. Thus, for , we used the last value in the table to determine the spectral type; the spectral types of stars are undetermined, so not specified in Figure 1.
In the EUV-only case (blue), the lifetime peaks at , or equivalently spectral types around A0. Lifetimes longer than are found only around the late intermediate-mass stars (), corresponding to spectral types between F0 and B8. The surface convective zones of these stars disappear at –, and the magnetic-origin EUV emission is already weak by the time photoevaporation comes to dominate mass loss. The results indicate that primordial gas disks relatively easily survive to the ages of young debris disks around A- and late B-type stars.
Stars with (hereafter early intermediate-mass stars) produce much stronger photospheric EUV emission owing to their high , leading to shorter . For stars of Solar mass and below, the magnetic-origin EUV emission remains strong throughout the disk dispersal.
X-ray photoevaporation (gray line in Figure 1) reduces the lifetime by 1–2 orders of magnitude for compared to the EUV-only case. This is because is kept high at , corresponding to , until the disk completely disperses. However, as mentioned above, the adopted X-ray photoevaporation rates might be overestimated. While X-ray photoevaporation can explain observational wind diagnostics (e.g., Weber et al., 2020; Rab et al., 2022), such high X-ray photoevaporation rates are also known to be unfavorable for explaining the observed disk mass and accretion rates with viscous disk models (Sellek et al., 2020; Alexander et al., 2023) and magnetized disk models (Weder et al., 2023); smaller mass-loss rates as EUV photoevaporation alone are preferred. However, we do not rule out the effectiveness of X-rays in driving photoevaporation, as they indeed deposit energy to the gas, but with somewhat much smaller mass-loss rates than Eq.(3). If so, the lifetimes of the EUV models set upper limits for low-mass stars. For the early intermediate-mass stars (), matches the EUV-only case since the convective zone disappears before .
We then explore the dependence on the parameters of the MHD wind-driven accretion and mass loss across the fast-wind and laminar-disk regimes in Chambers (2019). In the fast-wind case, the wind mass loss is negligible, and most of the accretion is driven by the wind, while in the laminar case, wind mass loss is substantial, and the wind drives almost all the accretion (Sections 4.2 and 4.4 of the original paper).
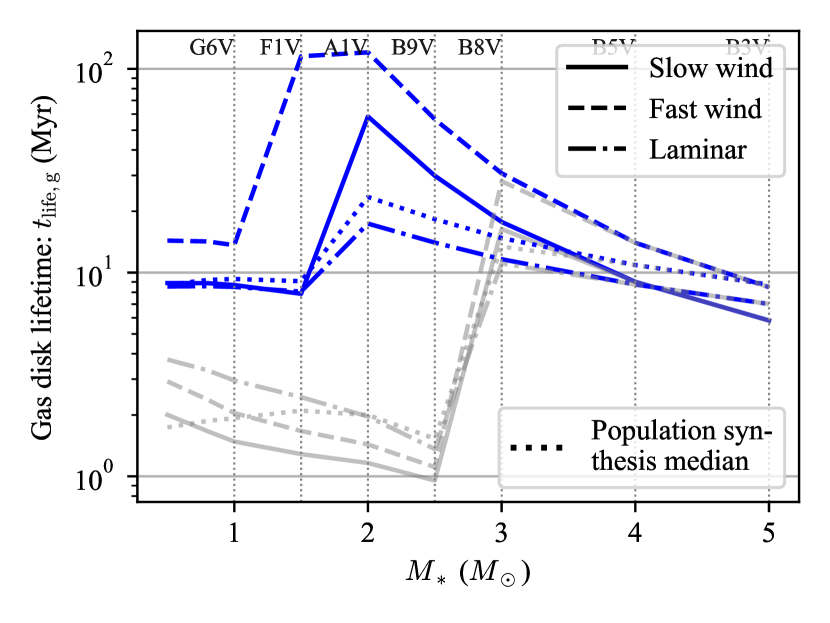
The resulting – relation (Figure 2) is essentially the same as Figure 1, consistently peaking at . Small differences are that in the fast-wind model, at becomes comparable to , and in the laminar model, the peak lifetime at is reduced to . However, the assumption of no wind mass loss in the fast-wind model seems difficult to reconcile with the high detection rate of [O I] low-velocity component (; Nisini et al., 2018), making it an unfavored PPD evolution scenario. The stellar-mass-dependent trends are consistent across a wide parameter space, as shown by the population synthesis median in Figure 2 (cf. Appendix D). Overall, varying the disk and wind parameters yields a wide range of possible lifetimes, especially near . We conclude that the average lifetime peaks at early A-type stars with for small-grain-depleted disks.
We emphasize that the lifetimes derived here apply only to small-grain-depleted disks. Figures 1 and 2 neglect any short-lived disks that might be dispersed by FUV photoevaporation. To quantify the general frequency of gas disks, it would be necessary to estimate PPDs’ probability of becoming depleted in small grains. This is an issue for future studies.
We attribute the stellar mass dependence of mostly to the variation with in the EUV and X-ray luminosities and thus the photoevaporation rates. However, the variation of MHD effects with stellar mass may also play a role. The hard X-rays from low-mass stars () can ionize the disk atmosphere to increase the local effective . This enhances MHD winds’ effects, shortening the disk lifetime. The soft X-rays due to shocks originating from line-driven winds of early B- and O-type stars could have a similar effect and can also directly drive soft X-ray photoevaporation. Both these effects would strengthen the gas lifetime difference between the late intermediate-mass stars and the rest.
Currently, no evidence supports the presence of companions in known gas-rich debris disks, but the possibility still remains that they could harbor unseen low-mass, close-in companions. In these scenarios, the EUV and X-ray emission may be dominated by these companions, boosting photoevaporation rates. Thus, to yield long-lived gas disks, late intermediate-mass stars should not have such companions.
4 Comparison with detection rate of gaseous debris disks
We now compare the modeled lifetimes from §3 with the population of debris disks detected in the CO millimeter, [C II] , or [O I] lines, focusing on the dependence on host star spectral type. The detections come from Supplemental Table 1 of Hughes et al. (2018). Only 3 out of 152 sources listed in the table have ages of , with all being A0 stars. The age of HD 166191 (F star) is presented as , but we adopt an updated value of (Potravnov et al., 2018; Su et al., 2022). As they discussed, this sample combines studies with diverse sensitivity limits and selection criteria and thus is not well-suited for determining quantitative occurrence rates. However, the spectral-type dependence resembles that in a more-uniform sampling by Moór et al. (2017).
Keeping this limitation in mind, we replot the detections compiled by Hughes et al. (2018) versus stellar type in Figure 3. We show not only the detections in CO but also those in C II and O I, since the disks may retain these species mixed with hydrogen even in the absence of CO.
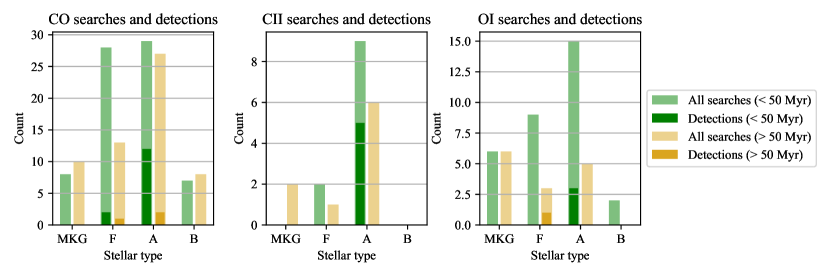
We note that nine of twelve young CO-detected sources have CO mass (cf. Table A1 of Marino et al., 2020; Moór et al., 2017, 2019). The three sources below this threshold are likely better explained by secondary origins, based on the short photodissociation lifetimes for primordial CO at such low gas masses. For F stars, one of the two young CO-detected sources is above this mass threshold and is early F (F2/3V); the one below the threshold is late F (F5/6V). The decreasing trend of the incidence from A to FGK stars is likely real but not due to a sensitivity bias. A comparison of debris disks with similar fractional luminosities (Tables A1 and A2 of Marino et al., 2020) indicates that only 2 out of 9 sources exhibit gas (at levels ) among FGK stars, while 11 out of 17 A-type stars display gas presence (often exceeding ).
Figure 3 shows several interesting consistencies with the modeled – relation. The detection rate is highest for early A-type stars (more than half the stars with gas detected are early A-type, A0–A3). Almost all the gas-rich debris disks with are hosted by early A-type stars. The exception is HD 121191 (, Moór et al., 2017), which is type A5 but does not necessarily disagree with our model considering the range in at . Our model naturally explains younger () gaseous debris disks’ higher numbers around A-type stars than around both lower-mass and O- and early B stars. The decreasing trend toward higher-mass stars could be due to both photoevaporation and intense CO photodissociation. For A stars, the weak photodissociating fluxes would also be helping the long survival of CO. Overall, within the limitations of the sample, the consistencies with the model are remarkable.
In contrast, the gas detected in debris disks around late F-stars appears more compatible with secondary origins, given the short gas lifetime around those low-mass stars in our model. Also, a few debris disks have multiple lines of evidence supporting a secondary origin, among them the A5–A6 star Pic (e.g., Dent et al., 2014; Greaves et al., 2016; Iwasaki et al., 2023; Cataldi et al., 2023). We thus consider primordial and secondary origins not mutually exclusive. We stress that our hypothesized disk evolution does not necessarily rule out a secondary origin for some gaseous debris disks, even among A-type stars younger than . Determining the gas origins in individual sources is a challenge for the future. However, the results we present here suggest the high overall frequency of gas-rich debris disks among A-type stars can come from the primordial origin.
5 Summary and Outlook
The substantial amounts of gas found in some debris disks could either be remnants of the primordial protoplanetary disk, or originate in the secondary release of volatiles from bodies resembling comets or asteroids. While the primordial-origin scenario was classically considered unlikely, we here demonstrated primordial gas can survive to the ages of the known gaseous debris disks, using semi-analytic models to derive lifetimes for the gas in disks that have been depleted in small grains () so that FUV photoelectric heating is ineffective. The resulting lifetimes are longest around stars of , whose evolution switches off their surface convection at before the disk loses the bulk of its gas. Without a surface convective zone, these stars lack surface magnetic activity and thus have low luminosities in the EUV and X-ray bands that drive the photoevaporation of the gas.
The gas lifetime exceeds for the late intermediate-mass stars only. The shorter lifetimes of the gas disks around lower-mass stars () are due to strong EUV and X-rays from the chromosphere, transition region, and corona, while those around higher-mass stars () are due to the high photospheric temperatures and resulting EUV luminosities.
Our model predicts a higher frequency of gaseous debris disks around A- and late B-type stars compared to types both earlier and later. This is qualitatively consistent with the observed population, motivating further investigation of the primordial-origin scenario. Longer gas disk lifetimes for A-stars could be a factor in the giant planet occurrence rate peaking at 1.7– (Reffert et al., 2015; Wolthoff et al., 2022), though more detailed modeling of the dissipating disks would be needed to assess the possibility of gas giant formation. Likewise, our results could relate to the increasing occurrence of transition disks with stellar mass (van der Marel & Mulders, 2021). Further investigations are needed to evaluate whether these transition disks might serve as precursors to gaseous debris disks.
The primordial-origin picture allows the existence around late intermediate-mass stars of long-lived gas-rich disks with very weak dust emission, which we term “phantom” disks. Finding such phantom disks would indicate that the abundant CO gas in at least some young debris disks is primordial. Searches for gas-rich, dust-poor disks especially around A- and late B-stars aged – could thus help determine the range of evolutionary paths followed by planet-forming disks. Note that the phantoms are different from the relic disks, purely viscous, dusty disks with central cavities larger than surviving around Solar-type stars owing to very weak X-ray emission (Owen et al., 2011).
The fraction of PPDs achieving the small-grain-depleted state and the critical level of depletion required to inhibit FUV photoevaporation are open questions. Further hydrodynamics investigations are needed considering a range of stellar masses and FUV/X-ray luminosities. We anticipate that PPDs with PAH/small-grain abundances below of the interstellar level (see §3) may have reached this state and could be potential precursors of gas-rich debris disks around intermediate-mass stars. PPDs with PAH/small-grain abundances above the critical level would have FUV-driven \ceH2 winds extend to with temperatures exceeding a few hundred Kelvin and mass-loss rates of (Nakatani et al., 2018a, b; Komaki et al., 2021). Searching for these molecular winds could also help examine the depletion level in PPDs and very young () hybrid disks (e.g., HD 141569), including hybrid disk candidates (Iglesias et al., 2023), around weak X-ray emitters.
The point of this work is that gas disks can persist beyond , a necessary condition for the primordial-origin scenario. A caveat is that our 0D approach cannot unambiguously predict the detailed surface density evolution and the alignment with other observational characteristics of inner disks, such as accretion and wind mass-loss rates (Fang et al., 2018, 2023). Future studies involve 1D simulations to accurately follow the radial profile evolution and make comparisons with those observables to evaluate the proposed evolutionary pathways. Nevertheless, we expect the conclusion on the long lifetimes around intermediate-mass stars will remain consistent even in more advanced models, as the key determinant of outer gas disk lifetimes, which potentially manifest as gaseous debris disks in observations, is the photoevaporation rates set by the stellar emission rates. The speed of final-stage disk dispersal would not be significantly influenced by how the inner disks clear. Thermochemical modeling would also help understand how the CO and C masses evolve in small-grain depleted disks and examine if the final values reproduce observations (Iwasaki et al., 2023; Cataldi et al., 2023). For a broader perspective, it is worth investigating what fraction of PPDs in general can be long-lived considering environmental factors like external photoevaporation, tidal truncation, and late infall.
References
- Acke et al. (2010) Acke, B., Bouwman, J., Juhász, A., et al. 2010, ApJ, 718, 558, doi: 10.1088/0004-637X/718/1/558
- Alcalá et al. (2014) Alcalá, J. M., Natta, A., Manara, C. F., et al. 2014, A&A, 561, A2, doi: 10.1051/0004-6361/201322254
- Alcalá et al. (2017) Alcalá, J. M., Manara, C. F., Natta, A., et al. 2017, A&A, 600, A20, doi: 10.1051/0004-6361/201629929
- Alexander et al. (2023) Alexander, R., Rosotti, G., Armitage, P. J., et al. 2023, arXiv e-prints, arXiv:2306.17218, doi: 10.48550/arXiv.2306.17218
- Andrews et al. (2013) Andrews, S. M., Rosenfeld, K. A., Kraus, A. L., & Wilner, D. J. 2013, ApJ, 771, 129, doi: 10.1088/0004-637X/771/2/129
- Ansdell et al. (2017) Ansdell, M., Williams, J. P., Manara, C. F., et al. 2017, AJ, 153, 240, doi: 10.3847/1538-3881/aa69c0
- Ansdell et al. (2016) Ansdell, M., Williams, J. P., van der Marel, N., et al. 2016, ApJ, 828, 46, doi: 10.3847/0004-637X/828/1/46
- Astropy Collaboration et al. (2013) Astropy Collaboration, Robitaille, T. P., Tollerud, E. J., et al. 2013, A&A, 558, A33, doi: 10.1051/0004-6361/201322068
- Astropy Collaboration et al. (2018) Astropy Collaboration, Price-Whelan, A. M., Sipőcz, B. M., et al. 2018, AJ, 156, 123, doi: 10.3847/1538-3881/aabc4f
- Astropy Collaboration et al. (2022) Astropy Collaboration, Price-Whelan, A. M., Lim, P. L., et al. 2022, apj, 935, 167, doi: 10.3847/1538-4357/ac7c74
- Bai & Stone (2013a) Bai, X.-N., & Stone, J. M. 2013a, ApJ, 767, 30, doi: 10.1088/0004-637X/767/1/30
- Bai & Stone (2013b) —. 2013b, ApJ, 769, 76, doi: 10.1088/0004-637X/769/1/76
- Calvet et al. (2004) Calvet, N., Muzerolle, J., Briceño, C., et al. 2004, AJ, 128, 1294, doi: 10.1086/422733
- Carrera et al. (2017) Carrera, D., Gorti, U., Johansen, A., & Davies, M. B. 2017, ApJ, 839, 16, doi: 10.3847/1538-4357/aa6932
- Cataldi et al. (2020) Cataldi, G., Wu, Y., Brandeker, A., et al. 2020, ApJ, 892, 99, doi: 10.3847/1538-4357/ab7cc7
- Cataldi et al. (2023) Cataldi, G., Aikawa, Y., Iwasaki, K., et al. 2023, arXiv e-prints, arXiv:2305.12093, doi: 10.48550/arXiv.2305.12093
- Chambers (2019) Chambers, J. 2019, ApJ, 879, 98, doi: 10.3847/1538-4357/ab2537
- Clarke et al. (2001) Clarke, C. J., Gendrin, A., & Sotomayor, M. 2001, MNRAS, 328, 485, doi: 10.1046/j.1365-8711.2001.04891.x
- Dent et al. (2014) Dent, W. R. F., Wyatt, M. C., Roberge, A., et al. 2014, Science, 343, 1490, doi: 10.1126/science.1248726
- Ercolano et al. (2009) Ercolano, B., Clarke, C. J., & Drake, J. J. 2009, ApJ, 699, 1639, doi: 10.1088/0004-637X/699/2/1639
- Fang et al. (2023) Fang, M., Pascucci, I., Edwards, S., et al. 2023, ApJ, 945, 112, doi: 10.3847/1538-4357/acb2c9
- Fang et al. (2018) —. 2018, ApJ, 868, 28, doi: 10.3847/1538-4357/aae780
- Fedele et al. (2010) Fedele, D., van den Ancker, M. E., Henning, T., Jayawardhana, R., & Oliveira, J. M. 2010, A&A, 510, A72, doi: 10.1051/0004-6361/200912810
- Furlan et al. (2006) Furlan, E., Hartmann, L., Calvet, N., et al. 2006, ApJS, 165, 568, doi: 10.1086/505468
- Furlan et al. (2011) Furlan, E., Luhman, K. L., Espaillat, C., et al. 2011, ApJS, 195, 3, doi: 10.1088/0067-0049/195/1/3
- Geers et al. (2007) Geers, V. C., van Dishoeck, E. F., Visser, R., et al. 2007, A&A, 476, 279, doi: 10.1051/0004-6361:20078466
- Geers et al. (2006) Geers, V. C., Augereau, J. C., Pontoppidan, K. M., et al. 2006, A&A, 459, 545, doi: 10.1051/0004-6361:20064830
- Gorti et al. (2009) Gorti, U., Dullemond, C. P., & Hollenbach, D. 2009, ApJ, 705, 1237, doi: 10.1088/0004-637X/705/2/1237
- Gorti & Hollenbach (2008) Gorti, U., & Hollenbach, D. 2008, ApJ, 683, 287, doi: 10.1086/589616
- Gorti et al. (2015) Gorti, U., Hollenbach, D., & Dullemond, C. P. 2015, ApJ, 804, 29, doi: 10.1088/0004-637X/804/1/29
- Greaves et al. (2016) Greaves, J. S., Holland, W. S., Matthews, B. C., et al. 2016, MNRAS, 461, 3910, doi: 10.1093/mnras/stw1569
- Güdel et al. (2007) Güdel, M., Briggs, K. R., Arzner, K., et al. 2007, A&A, 468, 353, doi: 10.1051/0004-6361:20065724
- Haisch et al. (2001) Haisch, Jr., K. E., Lada, E. A., & Lada, C. J. 2001, ApJ, 553, L153, doi: 10.1086/320685
- Hamaguchi et al. (2005) Hamaguchi, K., Yamauchi, S., & Koyama, K. 2005, ApJ, 618, 360, doi: 10.1086/423192
- Harris et al. (2020) Harris, C. R., Millman, K. J., van der Walt, S. J., et al. 2020, Nature, 585, 357, doi: 10.1038/s41586-020-2649-2
- Hartmann et al. (1998) Hartmann, L., Calvet, N., Gullbring, E., & D’Alessio, P. 1998, ApJ, 495, 385, doi: 10.1086/305277
- Hartmann et al. (2016) Hartmann, L., Herczeg, G., & Calvet, N. 2016, ARA&A, 54, 135, doi: 10.1146/annurev-astro-081915-023347
- Hernández et al. (2007) Hernández, J., Hartmann, L., Megeath, T., et al. 2007, ApJ, 662, 1067, doi: 10.1086/513735
- Higuchi et al. (2019a) Higuchi, A. E., Oya, Y., & Yamamoto, S. 2019a, ApJ, 885, L39, doi: 10.3847/2041-8213/ab518d
- Higuchi et al. (2017) Higuchi, A. E., Sato, A., Tsukagoshi, T., et al. 2017, ApJ, 839, L14, doi: 10.3847/2041-8213/aa67f4
- Higuchi et al. (2019b) Higuchi, A. E., Saigo, K., Kobayashi, H., et al. 2019b, ApJ, 883, 180, doi: 10.3847/1538-4357/ab3d26
- Hollenbach et al. (1994) Hollenbach, D., Johnstone, D., Lizano, S., & Shu, F. 1994, ApJ, 428, 654, doi: 10.1086/174276
- Hughes et al. (2018) Hughes, A. M., Duchêne, G., & Matthews, B. C. 2018, ARA&A, 56, 541, doi: 10.1146/annurev-astro-081817-052035
- Hughes et al. (2017) Hughes, A. M., Lieman-Sifry, J., Flaherty, K. M., et al. 2017, ApJ, 839, 86, doi: 10.3847/1538-4357/aa6b04
- Hunter (2007) Hunter, J. D. 2007, Computing in Science & Engineering, 9, 90, doi: 10.1109/MCSE.2007.55
- Iglesias et al. (2023) Iglesias, D. P., Panić, O., van den Ancker, M., et al. 2023, MNRAS, 519, 3958, doi: 10.1093/mnras/stac3619
- Iwasaki et al. (2023) Iwasaki, K., Kobayashi, H., Higuchi, A. E., & Aikawa, Y. 2023, arXiv e-prints, arXiv:2303.11544, doi: 10.48550/arXiv.2303.11544
- Kennedy & Kenyon (2009) Kennedy, G. M., & Kenyon, S. J. 2009, ApJ, 695, 1210, doi: 10.1088/0004-637X/695/2/1210
- Kenyon & Hartmann (1987) Kenyon, S. J., & Hartmann, L. 1987, ApJ, 323, 714, doi: 10.1086/165866
- Komaki et al. (2023) Komaki, A., Fukuhara, S., Suzuki, T. K., & Yoshida, N. 2023, arXiv e-prints, arXiv:2304.13316, doi: 10.48550/arXiv.2304.13316
- Komaki et al. (2021) Komaki, A., Nakatani, R., & Yoshida, N. 2021, ApJ, 910, 51, doi: 10.3847/1538-4357/abe2af
- Kóspál et al. (2013) Kóspál, Á., Moór, A., Juhász, A., et al. 2013, ApJ, 776, 77, doi: 10.1088/0004-637X/776/2/77
- Kral et al. (2019) Kral, Q., Marino, S., Wyatt, M. C., Kama, M., & Matrà, L. 2019, MNRAS, 489, 3670, doi: 10.1093/mnras/sty2923
- Kral et al. (2020) Kral, Q., Matrà, L., Kennedy, G. M., Marino, S., & Wyatt, M. C. 2020, MNRAS, 497, 2811, doi: 10.1093/mnras/staa2038
- Kral et al. (2016) Kral, Q., Wyatt, M., Carswell, R. F., et al. 2016, MNRAS, 461, 845, doi: 10.1093/mnras/stw1361
- Kunitomo et al. (2021) Kunitomo, M., Ida, S., Takeuchi, T., et al. 2021, ApJ, 909, 109, doi: 10.3847/1538-4357/abdb2a
- Kunitomo et al. (2020) Kunitomo, M., Suzuki, T. K., & Inutsuka, S.-i. 2020, MNRAS, 492, 3849, doi: 10.1093/mnras/staa087
- Li & Lunine (2003) Li, A., & Lunine, J. I. 2003, ApJ, 594, 987, doi: 10.1086/376939
- Lieman-Sifry et al. (2016) Lieman-Sifry, J., Hughes, A. M., Carpenter, J. M., et al. 2016, ApJ, 828, 25, doi: 10.3847/0004-637X/828/1/25
- Lynden-Bell & Pringle (1974) Lynden-Bell, D., & Pringle, J. E. 1974, MNRAS, 168, 603, doi: 10.1093/mnras/168.3.603
- Mamajek (2009) Mamajek, E. E. 2009, in American Institute of Physics Conference Series, Vol. 1158, American Institute of Physics Conference Series, ed. T. Usuda, M. Tamura, & M. Ishii (Melville, NY: AIP), 3–10, doi: 10.1063/1.3215910
- Manara et al. (2022) Manara, C. F., Ansdell, M., Rosotti, G. P., et al. 2022, arXiv e-prints, arXiv:2203.09930, doi: 10.48550/arXiv.2203.09930
- Manara et al. (2016) Manara, C. F., Fedele, D., Herczeg, G. J., & Teixeira, P. S. 2016, A&A, 585, A136, doi: 10.1051/0004-6361/201527224
- Mangeney & Praderie (1984) Mangeney, A., & Praderie, F. 1984, A&A, 130, 143
- Marino et al. (2022) Marino, S., Cataldi, G., Jankovic, M. R., Matrà, L., & Wyatt, M. C. 2022, MNRAS, 515, 507, doi: 10.1093/mnras/stac1756
- Marino et al. (2020) Marino, S., Flock, M., Henning, T., et al. 2020, MNRAS, 492, 4409, doi: 10.1093/mnras/stz3487
- Marino et al. (2016) Marino, S., Matrà, L., Stark, C., et al. 2016, MNRAS, 460, 2933, doi: 10.1093/mnras/stw1216
- Matrà et al. (2019) Matrà, L., Öberg, K. I., Wilner, D. J., Olofsson, J., & Bayo, A. 2019, AJ, 157, 117, doi: 10.3847/1538-3881/aaff5b
- Meyer et al. (2007) Meyer, M. R., Backman, D. E., Weinberger, A. J., & Wyatt, M. C. 2007, Protostars and Planets V, 573
- Mohanty et al. (2005) Mohanty, S., Jayawardhana, R., & Basri, G. 2005, ApJ, 626, 498, doi: 10.1086/429794
- Moór et al. (2017) Moór, A., Curé, M., Kóspál, Á., et al. 2017, ApJ, 849, 123, doi: 10.3847/1538-4357/aa8e4e
- Moór et al. (2019) Moór, A., Kral, Q., Ábrahám, P., et al. 2019, ApJ, 884, 108, doi: 10.3847/1538-4357/ab4272
- Mulders et al. (2013) Mulders, G. D., Min, M., Dominik, C., Debes, J. H., & Schneider, G. 2013, A&A, 549, A112, doi: 10.1051/0004-6361/201219522
- Muzerolle et al. (2003) Muzerolle, J., Hillenbrand, L., Calvet, N., Briceño, C., & Hartmann, L. 2003, ApJ, 592, 266, doi: 10.1086/375704
- Muzerolle et al. (2005) Muzerolle, J., Luhman, K. L., Briceño, C., Hartmann, L., & Calvet, N. 2005, ApJ, 625, 906, doi: 10.1086/429483
- Nakatani et al. (2018a) Nakatani, R., Hosokawa, T., Yoshida, N., Nomura, H., & Kuiper, R. 2018a, ApJ, 857, 57, doi: 10.3847/1538-4357/aab70b
- Nakatani et al. (2018b) —. 2018b, ApJ, 865, 75, doi: 10.3847/1538-4357/aad9fd
- Nakatani et al. (2021) Nakatani, R., Kobayashi, H., Kuiper, R., Nomura, H., & Aikawa, Y. 2021, ApJ, 915, 90, doi: 10.3847/1538-4357/ac0137
- Natta et al. (2006) Natta, A., Testi, L., & Randich, S. 2006, A&A, 452, 245, doi: 10.1051/0004-6361:20054706
- Nisini et al. (2018) Nisini, B., Antoniucci, S., Alcalá, J. M., et al. 2018, A&A, 609, A87, doi: 10.1051/0004-6361/201730834
- Noyes et al. (1984) Noyes, R. W., Hartmann, L. W., Baliunas, S. L., Duncan, D. K., & Vaughan, A. H. 1984, ApJ, 279, 763, doi: 10.1086/161945
- Oliveira et al. (2010) Oliveira, I., Pontoppidan, K. M., Merín, B., et al. 2010, ApJ, 714, 778, doi: 10.1088/0004-637X/714/1/778
- Owen et al. (2012) Owen, J. E., Clarke, C. J., & Ercolano, B. 2012, MNRAS, 422, 1880, doi: 10.1111/j.1365-2966.2011.20337.x
- Owen et al. (2011) Owen, J. E., Ercolano, B., & Clarke, C. J. 2011, MNRAS, 412, 13, doi: 10.1111/j.1365-2966.2010.17818.x
- Owen et al. (2010) Owen, J. E., Ercolano, B., Clarke, C. J., & Alexander, R. D. 2010, MNRAS, 401, 1415, doi: 10.1111/j.1365-2966.2009.15771.x
- Owen & Kollmeier (2019) Owen, J. E., & Kollmeier, J. A. 2019, MNRAS, 487, 3702, doi: 10.1093/mnras/stz1591
- Pascucci et al. (2022) Pascucci, I., Cabrit, S., Edwards, S., et al. 2022, arXiv e-prints, arXiv:2203.10068, doi: 10.48550/arXiv.2203.10068
- Pascucci et al. (2016) Pascucci, I., Testi, L., Herczeg, G. J., et al. 2016, ApJ, 831, 125, doi: 10.3847/0004-637X/831/2/125
- Pascucci et al. (2020) Pascucci, I., Banzatti, A., Gorti, U., et al. 2020, ApJ, 903, 78, doi: 10.3847/1538-4357/abba3c
- Pecaut & Mamajek (2013) Pecaut, M. J., & Mamajek, E. E. 2013, ApJS, 208, 9, doi: 10.1088/0067-0049/208/1/9
- Picogna et al. (2019) Picogna, G., Ercolano, B., Owen, J. E., & Weber, M. L. 2019, MNRAS, 487, 691, doi: 10.1093/mnras/stz1166
- Pinilla et al. (2022) Pinilla, P., Garufi, A., & Gárate, M. 2022, A&A, 662, L8, doi: 10.1051/0004-6361/202243637
- Potravnov et al. (2018) Potravnov, I. S., Eselevich, M. V., Kondratieva, T. E., & Sokolov, I. V. 2018, Astronomy Letters, 44, 603, doi: 10.1134/S1063773718100079
- Rab et al. (2022) Rab, C., Weber, M., Grassi, T., et al. 2022, A&A, 668, A154, doi: 10.1051/0004-6361/202244362
- Rafikov (2017) Rafikov, R. R. 2017, ApJ, 837, 163, doi: 10.3847/1538-4357/aa6249
- Reffert et al. (2015) Reffert, S., Bergmann, C., Quirrenbach, A., Trifonov, T., & Künstler, A. 2015, A&A, 574, A116, doi: 10.1051/0004-6361/201322360
- Ribas et al. (2015) Ribas, Á., Bouy, H., & Merín, B. 2015, A&A, 576, A52, doi: 10.1051/0004-6361/201424846
- Ribas et al. (2014) Ribas, Á., Merín, B., Bouy, H., & Maud, L. T. 2014, A&A, 561, A54, doi: 10.1051/0004-6361/201322597
- Richling & Yorke (1998) Richling, S., & Yorke, H. W. 1998, A&A, 340, 508
- Sellek et al. (2020) Sellek, A. D., Booth, R. A., & Clarke, C. J. 2020, MNRAS, 498, 2845, doi: 10.1093/mnras/staa2519
- Sellek et al. (2022) Sellek, A. D., Clarke, C. J., & Ercolano, B. 2022, MNRAS, 514, 535, doi: 10.1093/mnras/stac1148
- Shakura & Sunyaev (1973) Shakura, N. I., & Sunyaev, R. A. 1973, A&A, 24, 337
- Shoda & Takasao (2021) Shoda, M., & Takasao, S. 2021, A&A, 656, A111, doi: 10.1051/0004-6361/202141563
- Shu et al. (1993) Shu, F. H., Johnstone, D., & Hollenbach, D. 1993, Icarus, 106, 92, doi: 10.1006/icar.1993.1160
- Sicilia-Aguilar et al. (2010) Sicilia-Aguilar, A., Henning, T., & Hartmann, L. W. 2010, ApJ, 710, 597, doi: 10.1088/0004-637X/710/1/597
- Smirnov-Pinchukov et al. (2022) Smirnov-Pinchukov, G. V., Moór, A., Semenov, D. A., et al. 2022, MNRAS, 510, 1148, doi: 10.1093/mnras/stab3146
- Stelzer et al. (2006) Stelzer, B., Micela, G., Hamaguchi, K., & Schmitt, J. H. M. M. 2006, A&A, 457, 223, doi: 10.1051/0004-6361:20065006
- Su et al. (2022) Su, K. Y. L., Kennedy, G. M., Schlawin, E., Jackson, A. P., & Rieke, G. H. 2022, ApJ, 927, 135, doi: 10.3847/1538-4357/ac4bbb
- Suzuki & Inutsuka (2009) Suzuki, T. K., & Inutsuka, S.-i. 2009, ApJ, 691, L49, doi: 10.1088/0004-637X/691/1/L49
- Takasao et al. (2022) Takasao, S., Tomida, K., Iwasaki, K., & Suzuki, T. K. 2022, ApJ, 941, 73, doi: 10.3847/1538-4357/ac9eb1
- Tanaka et al. (2013) Tanaka, K. E. I., Nakamoto, T., & Omukai, K. 2013, ApJ, 773, 155, doi: 10.1088/0004-637X/773/2/155
- Thi et al. (2014) Thi, W. F., Pinte, C., Pantin, E., et al. 2014, A&A, 561, A50, doi: 10.1051/0004-6361/201322150
- Trapman et al. (2022) Trapman, L., Tabone, B., Rosotti, G., & Zhang, K. 2022, ApJ, 926, 61, doi: 10.3847/1538-4357/ac3ed5
- van der Marel & Mulders (2021) van der Marel, N., & Mulders, G. D. 2021, AJ, 162, 28, doi: 10.3847/1538-3881/ac0255
- Vicente et al. (2013) Vicente, S., Berné, O., Tielens, A. G. G. M., et al. 2013, ApJ, 765, L38, doi: 10.1088/2041-8205/765/2/L38
- Virtanen et al. (2020) Virtanen, P., Gommers, R., Oliphant, T. E., et al. 2020, Nature Methods, 17, 261, doi: 10.1038/s41592-019-0686-2
- Wang & Goodman (2017) Wang, L., & Goodman, J. 2017, ApJ, 847, 11, doi: 10.3847/1538-4357/aa8726
- Weber et al. (2020) Weber, M. L., Ercolano, B., Picogna, G., Hartmann, L., & Rodenkirch, P. J. 2020, MNRAS, 496, 223, doi: 10.1093/mnras/staa1549
- Weder et al. (2023) Weder, J., Mordasini, C., & Emsenhuber, A. 2023, arXiv e-prints, arXiv:2304.12380, doi: 10.48550/arXiv.2304.12380
- Williams & Cieza (2011) Williams, J. P., & Cieza, L. A. 2011, ARA&A, 49, 67, doi: 10.1146/annurev-astro-081710-102548
- Wolthoff et al. (2022) Wolthoff, V., Reffert, S., Quirrenbach, A., et al. 2022, A&A, 661, A63, doi: 10.1051/0004-6361/202142501
Appendix A The UV-switch Model
The evolution of an accretion disk redistributing its angular momentum via viscous friction can be described by
| (A1) |
(Lynden-Bell & Pringle, 1974). If the disk evolves purely viscously with the viscosity profile of , the surface density profile is analytically computed as
| (A2) |
where is the initial disk mass, is the outer cut-off radius, and is the viscous timescale at . The nominal value of is
with the so-called turbulent viscosity, (Shakura & Sunyaev, 1973). We note that the scale height depends on and ; e.g., a passive disk has a temperature profile of
where is the incident angle of irradiation, and is the Stefan-Boltzmann constant (Kenyon & Hartmann, 1987; Hartmann et al., 1998; Pinilla et al., 2022). The viscous may also depend on as so that the accretion rate reproduces the observational scaling profile (Muzerolle et al., 2003, 2005; Calvet et al., 2004; Mohanty et al., 2005; Natta et al., 2006; Alcalá et al., 2014, 2017; Manara et al., 2016, 2022, also see discussions in Gorti et al. (2009) and Kunitomo et al. (2021)).
We can calculate the disk mass and mass accretion rate from Eq.(A2) as
| (A3) | |||
| (A4) |
When photoevaporation is taken into account in Eq.(A1), the effect appears on the right-hand-side as a sink term
The solution is the so-called UV-switch model (Clarke et al., 2001), and its behavior is described as follows: (1) the disk evolves effectively purely viscously at the early stage. (2) After the accretion rate equals the photoevaporation rate, material supply from the outer part halts. (3) It quickly opens a cavity in the inner region. (4) Photoevaporation dominates mass loss afterward and determines the dispersal time of the remaining disk.
The first transition point at (2) is when is reduced to . This transition occurs at (using Eq.(A4))
| (A5) |
where is the accretion rate at . By this point, the disk mass has reduced to
| (A6) |
Note that , , and are not independent but are constrained by .
Material supply from the outer disk stops at , resulting in a fast draining of the inner region () on the timescale of the viscous time at the critical radius , where a gap opens. Photoevaporation governs disk evolution afterward. Note that for disks without MHD winds’ mass loss, and the switching time of our model are identical. The remaining outer disk disperses by photoevaporation on a timescale of the “initial” outer disk mass over the photoevaporation rate,
| (A7) |
Hence, the gas disk lifetime is in cases of a constant before and after .
Photoevaporation rates vary according to stellar evolution, where the luminosities and spectra change by orders of magnitude. Also, if gets smaller at some point by, e.g., reduced photoelectric heating due to small-grain depletion, the lifetime is extended. This is the basic idea of our model (and Nakatani et al., 2021) to explain a long-lived gas disk in the context of the primordial origin scenario.
Appendix B An analytic disk evolution model with MHD effects
The effects of magnetohydrodynamics (MHD) winds are essential in disk evolution. They can remove not only the mass but also the angular momentum of the disk. Chambers (2019) derived an approximate analytic solution for disk evolution with MHD wind effects. Eq.(A1) is modified to
| (B1) |
where is the inward velocity induced by the disk wind, and is the surface mass-loss rate due to MHD winds. Using a reference radius , the surface mass-loss rate is characterized by a constant parameter as
where is the inward velocity at , is the fraction of induced by MHD winds, is the tangential velocity of the winds, and is the Keplerian orbital frequency. The second equation is derived from the conservation of angular momentum.
Chambers (2019) modified Eq.(B1) to make it analytically solvable (Eq.(12) of the original paper) and found analytic solutions for the modified equation (Eq.(36)–(39) of the original paper). We omit to write the solutions explicitly here to avoid complexity and refer the readers to the original paper. The point of this analytic solution is that the surface density and temperature evolutions are uniquely determined for a given set of model parameters , , , the temperature at : , and the surface density at : .
For example, means purely viscous disk, and choosing a high indicates a disk that accretes mainly magnetically. The parameter can be set to zero with a nonzero . The underlying assumption, in this case, is negligible mass-loss rates due to MHD winds. Small cases are termed fast wind. On the other hand, using a high value for () means that a significant fraction of the accreting gas flows out of the disk before reaching the host star. This case is called a slow wind.
The analytic formula of Chambers (2019) can overall well agree with the true solutions of Eq.(B1) regardless of the approximation taken to make the equation analytically tractable. The exception is when the wind mass-loss rate is large; the analytic formula underestimates the surface density and outer spreading at the later stage. It also fails to predict the positive slope of created by the wind in the inner region. Nevertheless, the errors between the analytic formula and the true solution are small compared to the large uncertainties in the long-term evolution of disk evolution with the MHD effects. We, therefore, use the formula as a valid estimate for time-dependent disk mass evolution.
Appendix C Accretion-generated emissions
We have omitted accretion-generated UV and X-ray emissions from our model. This extra radiation component can dominate the magnetic and photospheric components, leading to accelerated photoevaporation and reduced . We now examine if this omission affects the study’s conclusions—specifically, the peak lifetime beyond at (cf. Figures 1 and 2). Since the EUV models potentially account for the observed higher occurrence of gas-rich debris disks around A stars, our focus remains exclusively on the EUV models.
The exact portion of accretion luminosity () contributing to EUV radiation is uncertain. For simplicity, we assume is processed into EUV emission, aligning with analogous estimation for FUV (Gorti & Hollenbach, 2008) and X-ray (Hartmann et al., 2016). This can be represented as:
Here, the average EUV photon energy is approximated to match that of blackbody radiation, . The total EUV emission rate is now . In practice, accretion-generated EUV radiation may terminate once the disk develops an inner cavity, when photoevaporation and accretion rates balance at (the critical radius for photoevaporation). However, as the cavity-opening time is not determined unambiguously within the framework of our model, we let the accretion-generated EUV emission last until the disk dispersal; this scenario sets the lower limit for .
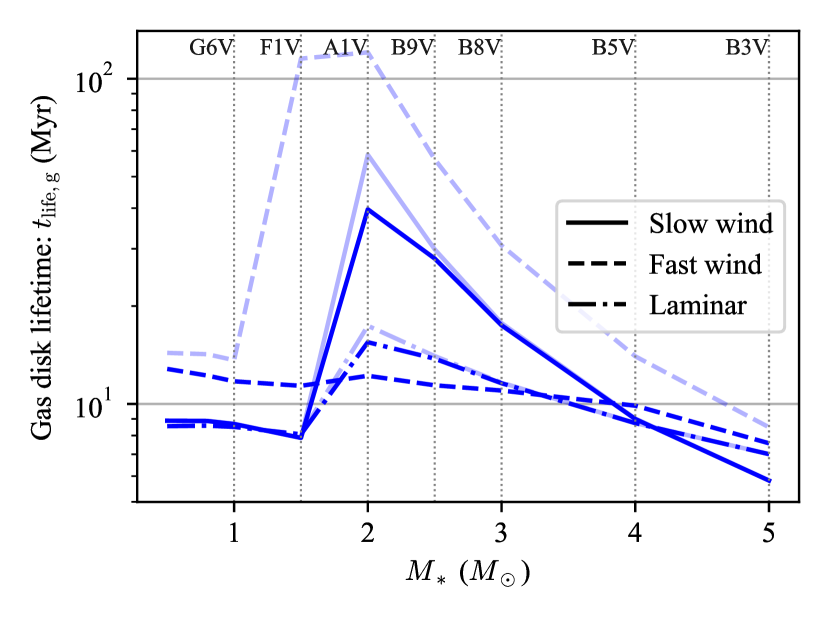
Figure 4 shows the resulting lifetimes. The accretion-generated EUV dominates for the weak- and fast-wind disks especially at the early time (), while laminar disks show minimal total emission rate enhancement. Nevertheless, the photoevaporation rate remains orders of magnitude lower than the accretion and/or MHD wind mass-loss rates at the early stages, with no substantial impact on disk evolution. Except for fast-wind disks, the accretion-generated component becomes negligible as the accretion rate drops in . This occurs prior to the onset of the photoevaporation-dominant epoch at , leading to minimal shortening of for the slow-wind and laminar disks.
In contrast, fast-wind disks can maintain relatively high accretion rates (–) even at , with accretion-generated EUV dominating over (or comparable to) the other components throughout dispersal. This impacts at –, as is significantly exceeds . However, the prevalence of jets and winds observed widely (e.g., Pascucci et al., 2022) suggests that the fast-wind scenario is unlikely to be common among PPDs. It is also difficult to align with the high detection rate of [O I] low-velocity component (Nisini et al., 2018). If termination of accretion-generated emissions due to cavity opening is considered, the peak at may remain even for fast-wind disks.
Overall, incorporating the accretion-generated component can moderately reduce and lessen the stellar-mass dependence for disks with no wind mass loss. Nonetheless, not all disks would evolve as fast-wind disks, supporting the highest plausibility of long-living () gas disks around late intermediate-mass stars. Further investigation is needed to accurately determine , , and its termination time.
Appendix D Disk Parameter Dependences
We explore how depends on various disk parameters, including the initial disk mass (), disk mass scaling law (), viscous , and initial disk cut-off radius (). These parameters are treated as Monte Carlo variables in population synthesis to span a wide parameter space.
The initial disk mass is defined as , with our fiducial values being and . Exploration covers a range of for and , following observations (e.g., Pascucci et al., 2016; Ansdell et al., 2016, 2017). As for , recent finding favor a low value at (Manara et al., 2022), and therefore we vary it in , with the upper limit encompassing the slow-wind and fast-wind disks.
The fiducial values are for slow-wind and fast-wind disks and for the laminar disk. We explore , as values beyond this range lead to unrealistic accretion rate variations. The wind mass-loss parameter is varied in . The initial cut-off radius is tested in ; the fiducial is . For reference, Clarke et al. (2001) and Kunitomo et al. (2020) adopt and , respectively; the time evolution of disk radius in the model by Trapman et al. (2022) aligns with the characteristic radii of observed CO disks in Lupus and Upper Sco when and .
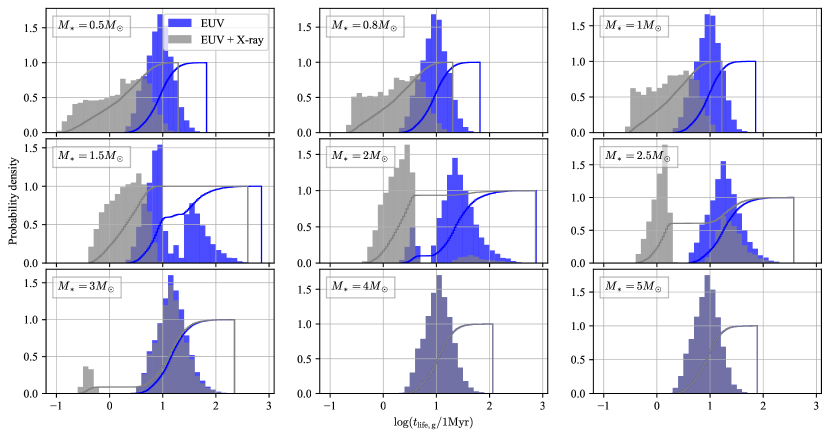
Monte Carlo variables assume uniform densities in linear space, except for and , which follow log-uniform sampling. We perform in total 90000 runs: 5000 parameter sets times 9 different stellar masses for each of the EUV and EUV+X-ray models. Figure 5 illustrates the resulting probability densities and cumulative probabilities for , reflecting the trends seen in Figures 1 and 2.
The lifetime is mostly unaffected by and . For the EUV models and EUV+X-ray models with , has limited influence. However, for EUV+X-ray models with , smaller initial disk masses () result in .
Increasing moderately extends . In the EUV models, tends to exceed for the runs with and . Conversely, the most runs with – and have . When is expanded while keeping constant, it decreases the initial surface density in the inner part, leading to greater mass distribution in the outer disk. This leads to slower mass loss via accretion and MHD winds.
Viscous and also have a moderate impact on the EUV models, with smaller and higher causing shorter lifetimes due to enhanced MHD-driven mass loss and accretion. The longest- population () at – has and , indicating a slow decay of the accretion rate. Unrealistically long lifetimes () can occur when is increased to . Hence, when the disk exhibits a characteristic of a viscous disk relatively strongly, increases significantly.
In summary, higher and larger can extend for specific cases. The other parameters exert minor impacts. Regardless of the parameter dependences, overall trends remain consistent: Late intermediate-mass stars in the EUV models consistently exhibit , peaking at and declining for lower and higher masses. While the fraction of long-living () disks for , most of which have , is apparently higher than observations (Figure 3), the actual CO disk lifetime is shorter than . This is because complete CO photodissociation occurs before disk dissipation, when reduces to a certain threshold mass. In addition, X-ray photoevaporation likely causes mass loss at somewhat much smaller rates than Eq.(3), implying that the the lifetimes of the EUV models should be interpreted as upper limits for low-mass stars.
Thermochemistry modeling is needed to interpret these results fully, along with the potentially crucial influence of atypically weak stellar photodissociating fluxes around A stars. It is important to highlight that our findings primarily demonstrate the plausibility of gas disk survival beyond , a necessary condition for supporting the primordial-origin scenario. Additionally, our model qualitatively explains the observed incidence of gaseous debris disks versus stellar mass.
Appendix E X-ray Luminosity Spread
Observed X-ray luminosities are known to have a large spread (e.g., Güdel et al., 2007). Accounting for the variability in X-ray luminosity would introduce scattering in the derived lifetimes. In the EUV+X-ray models, amplifying X-ray luminosity results in shorter lifetimes while reducing it aligns the lifetimes with those of EUV models. Within the EUV models, the spread in luminosity could influence lifetimes for , as their lifetimes are linked to . However, combining Eqs. (1) and (2), the scaling of EUV photoevaporation rate with places a relatively restrained impact on lifetimes. Furthermore, the adopted X-ray luminosity encompasses representative observational values (Fig.6 of Kunitomo et al. (2021)). It suggests that derived lifetimes remain relatively stable even when incorporating luminosity spread with a plausible distribution of . Consequently, the inclusion of luminosity dispersion is unlikely to significantly alter the core finding of this study.
Taking into account the spread of along with its time evolution would require solving stellar evolution across a wider parameter space than covered by Kunitomo et al. (2021).