MOSEL survey: JWST reveals major mergers/strong interactions drive the extreme emission lines in the early universe
Abstract
Extreme emission line galaxies (EELGs), where nebular emissions contribute 30-40% of the flux in certain photometric bands, are ubiquitous in the early universe (). We utilise deep NIRCam imaging from the JWST Advanced Deep Extragalactic Survey (JADES) to investigate the properties of companion galaxies (projected distance , km/s) around EELGs at . Tests with TNG100 simulation reveal that nearly all galaxies at will merge with at least one companion galaxy selected using similar parameters by . The median mass ratio of the most massive companion and the total mass ratio of all companions around EELGs is more than 10 times higher the control sample. Even after comparing with a stellar mass and stellar mass plus specific SFR-matched control sample, EELGs have three-to-five times higher mass ratios of the brightest companion and total mass ratio of all companions. Our measurements suggest that EELGs are more likely to be experiencing strong interactions or undergoing major mergers irrespective of their stellar mass or specific SFRs. We suspect that gas cooling induced by strong interactions and/or major mergers could be triggering the extreme emission lines, and the increased merger rate might be responsible for the over-abundance of EELGs at .
1 Introduction
In the past decade, deep photometric surveys with Spitzer and Hubble space telescope (HST) revealed more than two orders increase in the [Oiii] 5007+H equivalent width (EW) of galaxies between (Labbé et al., 2013; Roberts-Borsani et al., 2016; Barro et al., 2019; Mainali et al., 2019; Endsley et al., 2020; Gupta et al., 2022). Direct observations with the James Webb Space Telescope (JWST) in the past year have confirmed that 80% of galaxies have [Oiii] 5007+H EW Å; almost three times the EW of a typical star-forming galaxy at (Endsley et al., 2023; Cameron et al., 2023; Tang et al., 2023; Rinaldi et al., 2023). Thus, understanding the physical origin of extreme emission lines is becoming increasingly important to understand the early galaxy evolution.
Extreme emission line galaxies (EELGs) at lower redshifts typically have low stellar masses and high star formation rates (Atek et al., 2011; van der Wel et al., 2011; Maseda et al., 2013, 2014; Chevallard et al., 2018; Tang et al., 2019; Gupta et al., 2022; Lumbreras-Calle et al., 2022) and might be undergoing first burst in their star formation history (Cohn et al., 2018; Endsley et al., 2023). Reddy et al. (2018) show that evolution of stellar mass and star formation main-sequence is sufficient to explain the moderate increase in the [Oiii] 5007 EW between . Although, it is possible that increased stochasticity in the star formation history is sufficient to explain the overabundance of EELGs in the early universe (Endsley et al., 2023; Dressler et al., 2023).
Mergers of gas-rich galaxies and galaxy-galaxy interactions can funnel gas into the galactic center, boosting the star formation (Sanders & Mirabel, 1996; Hayward et al., 2013; Sparre & Springel, 2017; Moreno et al., 2019). Cosmological zoom-in simulations show that scatter in star-forming main-sequence is due to mergers and gas accretion events (Tacchella et al., 2016; Sparre et al., 2017; Torrey et al., 2018), and the gas accretion events also sets the intermediate-scale ( Gyrs) variability in the star formation history (Sparre et al., 2017; Tacchella et al., 2020). Mergers and galaxy-galaxy interaction can induce the circumgalactic medium gas to cool down, boosting the star formation rate by (Moreno et al., 2019; Sparre et al., 2022).
Traditionally, asymmetry and smoothness in the stellar light profile of galaxies is used to identify galaxies undergoing major mergers (Conselice, 2003; Lotz et al., 2004). However, mock-imaging of simulated galaxies show that the accuracy of morphology indicators varies between and depends significantly on the choice of photometric filter (Rose et al., 2023). Sophisticated photometric and/or deep spectroscopic observations have been used to identify pairs of galaxies that would end up merging together at some point (Lin et al., 2004; Watson et al., 2019; Duncan et al., 2019).
In this letter, we use the deep NIRCam photometry from the JADES survey (Bunker et al., 2023; Hainline et al., 2023; Rieke & the JADES Collaboration, 2023; Eisenstein et al., 2023) to analyse the properties of companions around EELGs at . The EELGs were identified in the ZFOURGE survey (Straatman et al., 2016) using composite spectral energy distribution fitting (Forrest et al., 2018) and later confirmed as part of the Multi-Object Spectroscopic of Emission Line (MOSEL) survey (Tran et al., 2020; Gupta et al., 2022). We find that EELGs are more likely to have similar stellar mass companions than the control sample, suggesting they are more likely to be either undergoing major mergers or experiencing strong interactions.
2 Data
The EELGs sample is selected from the FourStar Galaxy Evolution survey (ZFOURGE; Straatman et al., 2016), which uses medium-band filters in J and H bands on the Fourstar instrument () on the Magellan telescope to reach a photometric redshift accuracy of at (Nanayakkara et al., 2016; Tran et al., 2020). Forrest et al. (2018) identified 76 EELGs between in the Chandra Deep field South (CDFS) using composite spectral energy distribution fitting. For comparison, we also select 1712 galaxies within the same redshift range and K-band signal-to-noise (S/N) from the ZFOURGE survey.
The first data release (DR1) of JADES presents unprecedented depth (4.5nJy at in F444W) for (Bunker et al., 2023; Hainline et al., 2023; Rieke & the JADES Collaboration, 2023; Eisenstein et al., 2023) within the CDFS (MAST:http://dx.doi.org/10.17909/8tdj-8n28 (catalog 10.17909/8tdj-8n28),http://dx.doi.org/10.17909/fsc4-dt61 (catalog 10.17909/fsc4-dt61)). We match the brightest galaxy in the F444W filter within to cross match ZFOURGE and JADES samples, to account for small astrometric woffset () between the two surveys. We find only 19 out of 76 EELGs and 275 out of 1712 control galaxies in the JADES DR1 because of its relatively smaller footprint compared to the ZFOURGE survey.
3 Analysis
3.1 Photometric redshifts
To identify companion galaxies, we need redshifts for EELGs, the control sample and their possible companions. Only 12/19 [66/275] of EELGs [control] have spectroscopic redshifts either from the MOSEL survey (Tran et al., 2020; Gupta et al., 2022) or the JADES DR1, which has collected spectroscopic redshifts from many surveys in the literature plus the FRESCO survey (Oesch et al., 2023) and NIRSpec observation by JADES (Rieke & the JADES Collaboration, 2023).
Both ZFOURGE and JADES survey use EAZY (Brammer et al., 2008) to calculate photometric redshifts. Additional stellar templates with younger stellar ages were added by the JADES team (Hainline et al., 2023). We do not find any systematic difference in the photometric redshifts from JADES and ZFOURGE surveys. The average offset between the photometric redshift and spectroscopic redshift for EELGs [control] is [-0.01], [0.019] and zero outliers [3%] from the JADES survey. For consistency, we use photometric redshifts from the JADES DR1 throughout this letter when spectroscopic redshifts are unavailable.
3.2 Spectral energy distribution
We use the MAGPHYS (da Cunha et al., 2008, 2015) spectral energy distribution (SED) fitting code with BC03 stellar population synthesis model (Bruzual & Charlot, 2003), delayed exponentially declining star formation history model, Charlot & Fall (2000) dust attenuation law to derive physical properties. The results presented in this letter were derived only using the 23-band photometry from the JADES DR1 (HST + broad-band JADES + JWST Extragalactic Medium-band Survey (JEMS, Williams et al., 2023)) and fixing the redshift to best redshift determined in Section 3.1 because most companions are undetected in the ZFOURGE survey.
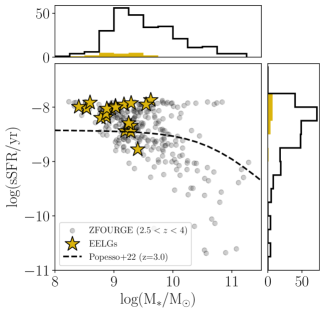
Figure 1 shows the stellar mass and specific star formation rate (sSFR) distribution of our primary targets. As expected EELGs have higher sSFRs and lower stellar mass than the control sample by about 0.3 dex (Table 1, Forrest et al., 2018; Gupta et al., 2022). MAGPHYS does not include emission lines, exclusion of which can increase the estimated stellar masses by up to 0.5 dex especially for EELGs (Forrest et al., 2018). However, our stellar masses do not change significantly ( dex) after removing filters (F277W or F277W plus F356W) that will be contaminated with [Oiii] 5007 and H emission lines. We suspect inclusion of longer wavelength filters (F356W and F444W) and their broadness minimise the effect of emission lines on stellar mass estimates.
3.3 Companion galaxies
We use the distribution of galaxies in phase-space to identify companions around the target galaxies. Spectroscopic studies of pair fractions measurements typically employ projected distances of 20 to 50 kpc and velocity offsets of km/s to identify interacting pairs of galaxies (Patton et al., 2000; Mantha et al., 2018). Studies relying on photometric redshifts adopt a more statistical approach to account for the uncertainty in photometric redshift measurements (López-Sanjuan et al., 2015; Duncan et al., 2019; Watson et al., 2019).
The companion analysis is restricted to all galaxies detected at S/N in F444W filter. The choice of F444W filter ensures that companion galaxies are well detected in all shorter wavelength filters, which is necessary for accurate spectral energy distribution modelling and photometric redshift estimation. Only 4% of the galaxies with S/N in F444W filter have spectroscopic redshifts and less than 10% have counterpart in the ZFOURGE survey. Thus, we use the photometric redshifts provided by the JADES DR1 for all samples when spectroscopic redshifts are unavailable. We estimate an average offset of and with about 13% catastrophic outlier. Slightly higher outlier fraction for our companion sample is because of the confusion between Lyman break and Balmer break at .
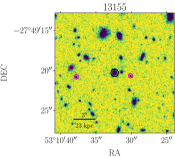
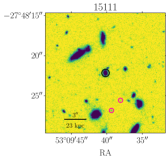
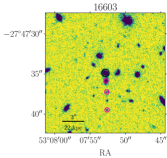
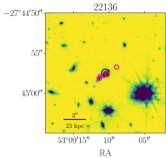
The results presented in this letter use a projected distance and velocity offset km/s ( companions). Figure 2 shows examples of companions identified around a subset of EELGs. The primary conclusions of this paper do not change significantly if we vary the maximum kpc, and maximum km/s. Accuracy of photometric redshifts will strongly affect the properties of companions identified in this paper. About 75% [61%] of companions to EELGs [control] have where corresponds to the peakiness of the redshift probability distribution defined as , where . Our main conclusions do not change significantly if we restrict the analysis to companions with .
Unfortunately, we do not have statistically significant number of spectroscopically confirmed EELGs or control galaxy pairs to test the companion identification technique (three true spectroscopic pairs out of four photometrically identified companions). We instead use cosmological simulations to quantify the accuracy of the companion identification technique (See Section 3.5).
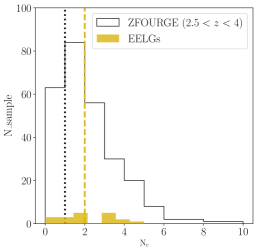
The median number of companions around EELGs is two, whereas galaxies in the control sample only have one companion (Figure 3). About 16% of the EELGs (3 of 19) do not have any companion as apposed to 24% in the control sample. However, a standard two sided KS-test suggests no significant difference between the distribution of number of companions around EELGs and the control sample. For EELGs, we find a weak negative correlation between the sSFR and the nearest neighbour distance (Spearman’s coefficient , with value) but not for the control sample. We suspect that limited sample size and uncertainty in photometric redshift washes out this weak correlation.
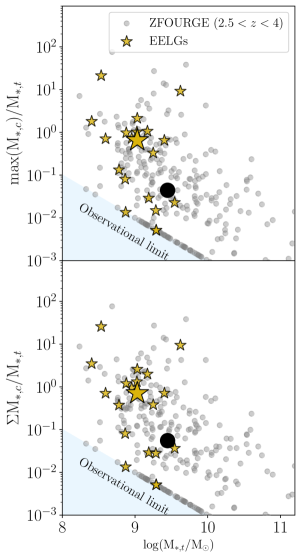
To determine whether the galaxies are experiencing strong or weak interactions, we calculate the ratio of the stellar mass of the most massive companion and the total stellar mass of all companions to the target galaxy (Figure 4). For galaxies without a detected companion, we assign a maximum companion mass of (minimum stellar mass estimated for the full companion population). The median stellar mass ratio of the most massive companion to EELGs is , whereas it is only for the control (two sided KS-test ) sample. The median stellar mass ratio of all companions combined is also less than for the control sample ().
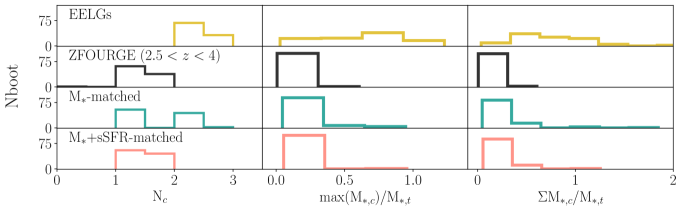
We use bootstrapping to account for the differences in the sample size, stellar mass, and sSFR distribution of the EELGs and control sample. For each bootstrapped iteration and sample, we randomly select 19 galaxies (equal to the total number of EELGs) while allowing for repeats. The stellar mass matching is done by randomly selecting one control galaxy for every EELG whose stellar mass is within 0.1 dex of the EELG (Kaasinen et al., 2016; Gupta et al., 2021). An additional restriction on sSFR to be within 0.1 dex of the EELG is imposed for the stellar mass plus sSFR matched control sample. We estimate a KS-test between EELG and the respective property of the matched samples for all iterations.
On average EELGs have two companion galaxies and the stellar mass ratio of the most massive companion is 0.65 times the EELG (Figure 5). In contrast, the median mass ratio of the most massive companion and the total mass of all companions remains less than and respectively, for 90% of the iterations (Figure 5) across all control samples. Even compared to the stellar mass plus sSFR matched sample, EELGs have three times more massive companions (Table 1). Thus, our measurements suggest that EELGs are more likely to be surrounded by similar stellar mass companions, and thus are more likely to be undergoing major mergers/ experiencing strong interactions.
3.4 False companion contamination
False projections could result in a higher fraction of companions being identified per galaxy. To estimate this effect, we randomly positioned both EELGs and control galaxies at 1000 different locations and re-identified companions at each location, following the criteria outlined in the previous section (projected distance kpc and relative velocity km/s). We detected at least one companion at approximately 30% of the randomly chosen locations for both EELGs and control galaxies. The increased sensitivity of the JADES survey (4.5 nJy at ), leads to a significantly higher contamination fraction compared to previous studies (Watson et al., 2019).
To determine the effect of contamination on the main conclusions of this paper, we generated 100 sets of the four samples (EELGs, control, mass-matched and mass plus sSFR matched control sample) by randomly removing 30% of the companions identified for each galaxy. For each iteration and sample, we calculated the median number of companions, the mass ratio of the brightest companion, and the total mass of all companions. We found very little overlap between the distributions of medians across all samples and parameters (KS-test ).
The median number of companions for EELGs remained one, whereas for the full control sample, after removing 30% of companions, the median number became zero in all iterations. Similarly for the stellar mass- and stellar mass plus sSFR-matched control samples, the median number of companions became zero in about 50% of the iterations. The median mass ratio of the brightest companion [the median ratio of the total stellar mass of all companions] was [], [], [] and [] for EELGs, mass-matched, mass plus sSFR matched and full control samples, respectively. After removing 30% of companions, EELGs still have almost three [six] times higher mass ratio of the brightest companion [total stellar mass of all companions] than the stellar mass and stellar mass plus sSFR-matched control sample. Therefore, assuming a 30% false companion contamination in our sample does not change the main conclusion of this paper.
| Sample | N | max(M∗,c)/M | M∗,c/M |
|---|---|---|---|
| EELGS | |||
| ZFOURGE () | |||
| M∗-matched | |||
| M∗-sSFR-matched |
Notes:
a: Numbers represent the percentile errors.
b: Nc is the number of companions.
c: max(M∗,c)/M∗,t is the stellar mass of the most massive companion to the target galaxy.
d: M∗,c/M∗,t is the total stellar mass of all companions to the target galaxy.
3.5 Test with TNG100 simulations
To test the robustness of our companions identification technique, we use TNG100 simulation, which is part of the IllustrisTNG suit of cosmological simulations (Springel et al., 2018; Naiman et al., 2018; Marinacci et al., 2018; Pillepich et al., 2018; Nelson et al., 2018). From TNG100, we select all galaxies with stellar and dark matter mass at snapshot 25, i.e., .
We use the projected distance along axis and velocity separation along -axis to identify companions around each galaxy. At km/s 72% of the galaxies have more than one companion, and for 61% of the galaxies all identified companions live in the same halo as the target galaxy. If we restrict to 20 kpc then only 19% of the galaxies have more than one companion, and for 85% of galaxies all companions live in the same halo as the target galaxy. At 60 kpc all galaxies have more than one companion, but only 29% of galaxies all companions share the same halo as the target galaxy. The velocity separation only affects these measurements at ( companion), which is not practical for observations given the uncertainty in photometric redshifts.
We use the merger history trees (Rodriguez-Gomez et al., 2015) to estimate the fraction of companions with same descendent as the target galaxy. At km/s, for about 63 percent of galaxies all identified companions will merge into a common descendent. Also, for 99.8% of galaxies at least one companion has the common descendent as the target galaxy. Our measurements are similar to Snyder et al. (2017) who used a similar photometric redshift and projected distance approach on mock surveys with simulated data to find about 80% of galaxy pairs identified at will merge by . This suggest that the projected phase-space approach used in this work can successfully identify galaxies that eventually merge together and might already be experiencing strong interactions.
4 Discussion and Conclusion
This paper utilizes deep JWST/NIRCam photometry and accurate photometric redshifts from the JADES survey to demonstrate that major mergers and/or strong interactions may be driving the extreme emission lines. We analyze the properties of companion galaxies (projected distance kpc, velocity separation of km/s) around 19 EELGs and 275 control galaxies at redshifts . Tests conducted using the TNG100 simulation confirm that nearly all galaxies will eventually merge with at least one companion galaxy by (Section 3.5), affirming the robustness of our companion identification technique.
We find that the median mass ratio of the most massive companion and the total mass ratio of all companions around EELGs is and respectively. In contrast, for control galaxies at similar redshifts these ratios are only (KS test ) and (). Even after comparing with a stellar mass and stellar mass plus sSFR-matched control sample, EELGs have three-five times higher mass ratios of the brightest companion and total mass of all companions (Figure 5). Our measurements suggest that EELGs are more likely to be surrounded by relatively more massive companion galaxies. We need spectroscopic data to confirm whether galaxies are undergoing major mergers or just experiencing strong interactions.
Mergers and galaxy-galaxy interactions can induce the circumgalactic medium gas to cool down and boost the star formation rate by 30-40% as shown by detailed hydro-dynamical simulations (Moreno et al., 2019; Sparre et al., 2022). Some studies find evidence of bursty/rising star formation histories in EELGs (Cohn et al., 2018; Endsley et al., 2023). We find that companions around EELGs are relatively more massive even compared to the stellar mass plus sSFR matched sample. This suggest that extreme emission lines might be produced at significantly shorter timescale than the typical timescale of SFRs estimated from the SED models (100 Myrs). We suspect that gas cooling induced by strong interactions/mergers could be triggering the starburst episodes, which, in turn, produces the extreme emission lines.
Cosmological simulations predict an almost two-order increase in the merger rate between (Hopkins et al., 2010; Rodriguez-Gomez et al., 2015). Deep photometric investigations have also confirmed the monotonic increase in the merger rate till (Duncan et al., 2019). We hypothesise that the increased merger rate might be responsible for the overabundance of EELGs detected with JWST at (Endsley et al., 2023; Cameron et al., 2023; Tang et al., 2023; Rinaldi et al., 2023). Thus, properly accounting for mergers would be important while estimating physical properties of gas and stars, in particular their kinematics and morphology in the early universe.
5 Acknowledgments
This research were supported by the Australian Research Council Centre of Excellence for All Sky Astrophysics in 3 Dimensions (ASTRO 3D), through project number CE170100013. TN acknowledge support from Australian Research Council Laureate Fellowship FL180100060. AH acknowledges support from the ERC Grant FIRSTLIGHT and Slovenian national research agency ARRS through grants N1-0238 and P1-0188. MH acknowledges funding from the Swiss National Science Foundation (SNF) via a PRIMA Grant PR00P2 193577 “From cosmic dawn to high noon: the role of black holes for young galaxies”
| ZFOURGE ID | RA(J2000) | DEC(J2000) | z | Nc | max(M∗,c)/M | M∗,c/M |
|---|---|---|---|---|---|---|
| 12533 | 53.1426 | -27.8266 | 3.568a | 3.0 | 9.19 | 9.43 |
| 12903 | 53.1795 | -27.8239 | 3.17b | 4.0 | 21.2 | 25.7 |
| 17189 | 53.1983 | -27.7892 | 3.55a | 3.0 | 1.81 | 3.49 |
| 17342 | 53.1434 | -27.7881 | 3.41b | 0.0 | 0.0135 | 0.0135 |
| 18742 | 53.1596 | -27.7768 | 3.436a | 4.0 | 0.133 | 0.374 |
| 11398 | 53.1533 | -27.836 | 3.56b | 1.0 | 0.708 | 0.708 |
| 11548 | 53.165 | -27.8339 | 3.11b | 2.0 | 0.722 | 0.939 |
| 15357 | 53.1408 | -27.8041 | 2.616a | 0.0 | 0.00512 | 0.00512 |
| 17583 | 53.1808 | -27.7863 | 2.69a | 2.0 | 1.02 | 1.32 |
| 18053 | 53.1958 | -27.7828 | 3.326a | 1.0 | 0.0806 | 0.0806 |
| 19656 | 53.2034 | -27.7704 | 2.71b | 2.0 | 0.649 | 0.714 |
| 19863 | 53.17 | -27.7684 | 3.087a | 1.0 | 0.029 | 0.029 |
| 20257 | 53.165 | -27.7652 | 3.192a | 2.0 | 0.0228 | 0.0364 |
| 22136 | 53.1529 | -27.7493 | 3.088a | 5.0 | 1.06 | 2.0 |
| 22277 | 53.1493 | -27.7487 | 2.524a | 0.0 | 0.00511 | 0.00511 |
| 13155 | 53.1757 | -27.8223 | 3.064a | 3.0 | 0.977 | 1.2 |
| 13203 | 53.1535 | -27.8215 | 3.563a | 3.0 | 2.13 | 2.58 |
| 15111 | 53.1612 | -27.8062 | 2.987a | 2.0 | 0.0148 | 0.0278 |
| 16603 | 53.1313 | -27.793 | 3.61b | 3.0 | 0.33 | 0.382 |
Notes:
a: Spectroscopic redshift from the JADES DR1 or MOSEL survey
b: Photometric redshift from the JADES DR1.
c: max(M∗,c)/M∗,t is the stellar mass of the most massive companion to the target galaxy.
d: M∗,c/M∗,t is the total stellar mass of all companions to the target galaxy.
References
- Atek et al. (2011) Atek, H., Siana, B., Scarlata, C., et al. 2011, The Astrophysical Journal, 743, 121, doi: 10.1088/0004-637X/743/2/121
- Barro et al. (2019) Barro, G., Pérez-González, P. G., Cava, A., et al. 2019, The Astrophysical Journal Supplement Series, 243, 22, doi: 10.3847/1538-4365/ab23f2
- Brammer et al. (2008) Brammer, G. B., van Dokkum, P. G., & Coppi, P. 2008, The Astrophysical Journal, 686, 1503, doi: 10.1086/591786
- Bruzual & Charlot (2003) Bruzual, G., & Charlot, S. 2003, Monthly Notices of the Royal Astronomical Society, 344, 1000, doi: 10.1046/j.1365-8711.2003.06897.x
- Bunker et al. (2023) Bunker, A. J., Cameron, A. J., Curtis-Lake, E., et al. 2023, JADES NIRSpec Initial Data Release for the Hubble Ultra Deep Field: Redshifts and Line Fluxes of Distant Galaxies from the Deepest JWST Cycle 1 NIRSpec Multi-Object Spectroscopy, doi: 10.48550/arXiv.2306.02467
- Cameron et al. (2023) Cameron, A. J., Saxena, A., Bunker, A. J., et al. 2023, JADES: Probing Interstellar Medium Conditions at $z\sim5.5-9.5$ with Ultra-Deep JWST/NIRSpec Spectroscopy, doi: 10.48550/arXiv.2302.04298
- Charlot & Fall (2000) Charlot, S., & Fall, S. M. 2000, The Astrophysical Journal, 539, 718, doi: 10.1086/309250
- Chevallard et al. (2018) Chevallard, J., Charlot, S., Senchyna, P., et al. 2018, Monthly Notices of the Royal Astronomical Society, 479, 3264, doi: 10.1093/mnras/sty1461
- Cohn et al. (2018) Cohn, J. H., Leja, J., Tran, K.-V. H., et al. 2018, The Astrophysical Journal, 869, 141, doi: 10.3847/1538-4357/aaed3d
- Conselice (2003) Conselice, C. J. 2003, The Astrophysical Journal Supplement Series, 147, 1, doi: 10.1086/375001
- da Cunha et al. (2008) da Cunha, E., Charlot, S., & Elbaz, D. 2008, Monthly Notices of the Royal Astronomical Society, 388, 1595, doi: 10.1111/j.1365-2966.2008.13535.x
- da Cunha et al. (2015) da Cunha, E., Walter, F., Smail, I. R., et al. 2015, The Astrophysical Journal, 806, 110, doi: 10.1088/0004-637X/806/1/110
- Dressler et al. (2023) Dressler, A., Rieke, M., Eisenstein, D., et al. 2023, Building the First Galaxies – Chapter 2. Starbursts Dominate The Star Formation Histories of 6 z 12 Galaxies, arXiv, doi: 10.48550/arXiv.2306.02469
- Duncan et al. (2019) Duncan, K., Conselice, C. J., Mundy, C., et al. 2019, The Astrophysical Journal, 876, 110, doi: 10.3847/1538-4357/ab148a
- Eisenstein et al. (2023) Eisenstein, D. J., Willott, C., Alberts, S., et al. 2023, Overview of the JWST Advanced Deep Extragalactic Survey (JADES), doi: 10.48550/arXiv.2306.02465
- Endsley et al. (2020) Endsley, R., Stark, D. P., Chevallard, J., & Charlot, S. 2020, Monthly Notices of the Royal Astronomical Society, 500, 5229, doi: 10.1093/mnras/staa3370
- Endsley et al. (2023) Endsley, R., Stark, D. P., Whitler, L., et al. 2023, The Star-forming and Ionizing Properties of Dwarf Z~6-9 Galaxies in JADES: Insights on Bursty Star Formation and Ionized Bubble Growth, arXiv, doi: 10.48550/arXiv.2306.05295
- Forrest et al. (2018) Forrest, B., Tran, K.-v. H., Broussard, A., et al. 2018, The Astrophysical Journal, 863, 131, doi: 10.3847/1538-4357/aad232
- Gupta et al. (2021) Gupta, A., Tran, K.-V., Pillepich, A., et al. 2021, The Astrophysical Journal, 907, 95, doi: 10.3847/1538-4357/abca98
- Gupta et al. (2022) Gupta, A., Tran, K.-V., Mendel, T., et al. 2022, Monthly Notices of the Royal Astronomical Society, 519, 980, doi: 10.1093/mnras/stac3548
- Hainline et al. (2023) Hainline, K. N., Johnson, B. D., Robertson, B., et al. 2023, The Cosmos in Its Infancy: JADES Galaxy Candidates at z 8 in GOODS-S and GOODS-N, doi: 10.48550/arXiv.2306.02468
- Hayward et al. (2013) Hayward, C. C., Narayanan, D., Kereš, D., et al. 2013, Monthly Notices of the Royal Astronomical Society, 428, 2529, doi: 10.1093/mnras/sts222
- Hopkins et al. (2010) Hopkins, P. F., Bundy, K., Croton, D., et al. 2010, The Astrophysical Journal, 715, 202, doi: 10.1088/0004-637X/715/1/202
- Kaasinen et al. (2016) Kaasinen, M., Bian, F., Groves, B., Kewley, L., & Gupta, A. 2016, Monthly Notices of the Royal Astronomical Society, 465, 3220, doi: 10.1093/mnras/stw2827
- Labbé et al. (2013) Labbé, I., Oesch, P. A., Bouwens, R. J., et al. 2013, The Astrophysical Journal, 777, L19, doi: 10.1088/2041-8205/777/2/L19
- Lin et al. (2004) Lin, L., Koo, D. C., Willmer, C. N. A., et al. 2004, The Astrophysical Journal, 617, L9, doi: 10.1086/427183
- López-Sanjuan et al. (2015) López-Sanjuan, C., Cenarro, A. J., Varela, J., et al. 2015, Astronomy & Astrophysics, 576, A53, doi: 10.1051/0004-6361/201424913
- Lotz et al. (2004) Lotz, J. M., Primack, J., & Madau, P. 2004, The Astronomical Journal, 128, 163, doi: 10.1086/421849
- Lumbreras-Calle et al. (2022) Lumbreras-Calle, A., López-Sanjuan, C., Sobral, D., et al. 2022, Astronomy and Astrophysics, 668, A60, doi: 10.1051/0004-6361/202142898
- Mainali et al. (2019) Mainali, R., Stark, D. P., Tang, M., et al. 2019, Monthly Notices of the Royal Astronomical Society, 494, 719, doi: 10.1093/mnras/staa751
- Mantha et al. (2018) Mantha, K. B., McIntosh, D. H., Brennan, R., et al. 2018, Monthly Notices of the Royal Astronomical Society, 475, 1549, doi: 10.1093/mnras/stx3260
- Marinacci et al. (2018) Marinacci, F., Vogelsberger, M., Pakmor, R., et al. 2018, Monthly Notices of the Royal Astronomical Society, 26, 1, doi: 10.1093/mnras/sty2206
- Maseda et al. (2013) Maseda, M. V., van der Wel, A., da Cunha, E., et al. 2013, The Astrophysical Journal, 778, L22, doi: 10.1088/2041-8205/778/1/L22
- Maseda et al. (2014) Maseda, M. V., Van Der Wel, A., Rix, H. W., et al. 2014, Astrophysical Journal, 791, 17, doi: 10.1088/0004-637X/791/1/17
- Moreno et al. (2019) Moreno, J., Torrey, P., Ellison, S. L., et al. 2019, Monthly Notices of the Royal Astronomical Society, 485, 1320, doi: 10.1093/mnras/stz417
- Naiman et al. (2018) Naiman, J. P., Pillepich, A., Springel, V., et al. 2018, Monthly Notices of the Royal Astronomical Society, 18, 1, doi: 10.1093/mnras/sty618
- Nanayakkara et al. (2016) Nanayakkara, T., Glazebrook, K., Kacprzak, G. G., et al. 2016, The Astrophysical Journal, 828, 1, doi: 10.3847/0004-637X/828/1/21
- Nelson et al. (2018) Nelson, D., Pillepich, A., Springel, V., et al. 2018, Monthly Notices of the Royal Astronomical Society, 475, 624, doi: 10.1093/mnras/stx3040
- Oesch et al. (2023) Oesch, P. A., Brammer, G., Naidu, R. P., et al. 2023, The JWST FRESCO Survey: Legacy NIRCam/Grism Spectroscopy and Imaging in the Two GOODS Fields, arXiv, doi: 10.48550/arXiv.2304.02026
- Patton et al. (2000) Patton, D. R., Carlberg, R. G., Marzke, R. O., et al. 2000, The Astrophysical Journal, 536, 153, doi: 10.1086/308907
- Pillepich et al. (2018) Pillepich, A., Nelson, D., Hernquist, L., et al. 2018, Monthly Notices of the Royal Astronomical Society, 475, 648, doi: 10.1093/mnras/stx3112
- Popesso et al. (2022) Popesso, P., Concas, A., Cresci, G., et al. 2022, Monthly Notices of the Royal Astronomical Society, 519, 1526, doi: 10.1093/mnras/stac3214
- Reddy et al. (2018) Reddy, N. A., Shapley, A. E., Sanders, R. L., et al. 2018, The Astrophysical Journal, 869, 92, doi: 10.3847/1538-4357/aaed1e
- Rieke & the JADES Collaboration (2023) Rieke, M., & the JADES Collaboration. 2023, JADES Initial Data Release for the Hubble Ultra Deep Field: Revealing the Faint Infrared Sky with Deep JWST NIRCam Imaging, doi: 10.48550/arXiv.2306.02466
- Rinaldi et al. (2023) Rinaldi, P., Caputi, K. I., Costantin, L., et al. 2023, The Astrophysical Journal, 952, 143, doi: 10.3847/1538-4357/acdc27
- Roberts-Borsani et al. (2016) Roberts-Borsani, G. W., Bouwens, R. J., Oesch, P. A., et al. 2016, The Astrophysical Journal, 823, 143, doi: 10.3847/0004-637x/823/2/143
- Rodriguez-Gomez et al. (2015) Rodriguez-Gomez, V., Genel, S., Vogelsberger, M., et al. 2015, Monthly Notices of the Royal Astronomical Society, 449, 49, doi: 10.1093/mnras/stv264
- Rose et al. (2023) Rose, C., Kartaltepe, J. S., Snyder, G. F., et al. 2023, The Astrophysical Journal, 942, 54, doi: 10.3847/1538-4357/ac9f10
- Sanders & Mirabel (1996) Sanders, D. B., & Mirabel, I. F. 1996, Annual Review of Astronomy and Astrophysics, 34, 749, doi: 10.1146/annurev.astro.34.1.749
- Snyder et al. (2017) Snyder, G. F., Lotz, J. M., Rodriguez-Gomez, V., et al. 2017, Monthly Notices of the Royal Astronomical Society, 468, 207, doi: 10.1093/mnras/stx487
- Sparre et al. (2017) Sparre, M., Hayward, C. C., Feldmann, R., et al. 2017, Monthly Notices of the Royal Astronomical Society, 466, 88, doi: 10.1093/mnras/stw3011
- Sparre & Springel (2017) Sparre, M., & Springel, V. 2017, Monthly Notices of the Royal Astronomical Society, 470, 3946, doi: 10.1093/mnras/stx1516
- Sparre et al. (2022) Sparre, M., Whittingham, J., Damle, M., et al. 2022, Monthly Notices of the Royal Astronomical Society, 509, 2720, doi: 10.1093/mnras/stab3171
- Springel et al. (2018) Springel, V., Pakmor, R., Pillepich, A., et al. 2018, Monthly Notices of the Royal Astronomical Society, 475, 676, doi: 10.1093/mnras/stx3304
- Straatman et al. (2016) Straatman, C. M. S., Spitler, L. R., Quadri, R. F., et al. 2016, The Astrophysical Journal, 830, 1, doi: 10.3847/0004-637X/830/1/51
- Tacchella et al. (2016) Tacchella, S., Dekel, A., Carollo, C. M., et al. 2016, Monthly Notices of the Royal Astronomical Society, 457, 2790, doi: 10.1093/mnras/stw131
- Tacchella et al. (2020) Tacchella, S., Forbes, J. C., & Caplar, N. 2020, Monthly Notices of the Royal Astronomical Society, 497, 698, doi: 10.1093/mnras/staa1838
- Tang et al. (2019) Tang, M., Stark, D. P., Chevallard, J., & Charlot, S. 2019, Monthly Notices of the Royal Astronomical Society, 489, 2572, doi: 10.1093/mnras/stz2236
- Tang et al. (2023) Tang, M., Stark, D. P., Chen, Z., et al. 2023, JWST/NIRSpec Spectroscopy of $z=7-9$ Star Forming Galaxies with CEERS: New Insight into Bright Ly$\alpha$ Emitters in Ionized Bubbles, arXiv, doi: 10.48550/arXiv.2301.07072
- Torrey et al. (2018) Torrey, P., Vogelsberger, M., Hernquist, L., et al. 2018, Monthly Notices of the Royal Astronomical Society: Letters, 477, L16, doi: 10.1093/mnrasl/sly031
- Tran et al. (2020) Tran, K.-V. H., Forrest, B., Alcorn, L. Y., et al. 2020, The Astrophysical Journal, 898, 45, doi: 10.3847/1538-4357/ab8cba
- van der Wel et al. (2011) van der Wel, A., Straughn, A. N., Rix, H.-W., et al. 2011, The Astrophysical Journal, 742, 111, doi: 10.1088/0004-637X/742/2/111
- Watson et al. (2019) Watson, C., Tran, K.-V., Tomczak, A., et al. 2019, The Astrophysical Journal, 874, 63, doi: 10.3847/1538-4357/ab06ef
- Williams et al. (2023) Williams, C. C., Tacchella, S., Maseda, M. V., et al. 2023, JEMS: A Deep Medium-Band Imaging Survey in the Hubble Ultra-Deep Field with JWST NIRCam & NIRISS, doi: 10.48550/arXiv.2301.09780