J10464047: an extremely low-metallicity dwarf star-forming galaxy with O32 = 57
Abstract
Using the optical spectrum obtained with the Kitt Peak Ohio State Multi-Object Spectrograph (KOSMOS) mounted on the Apache Point Observatory (APO) 3.5m Telescope and the Sloan Digital Sky Survey (SDSS) spectrum, we study the properties of one of the most metal-poor dwarf star-forming galaxies (SFG) in the local Universe, J10464047. The galaxy, with a redshift =0.04874, was selected from the Data Release 16 (DR16) of the SDSS. Its properties are among the most extreme for SFGs in several ways. The oxygen abundance 12 + log(O/H) = 7.0820.016 in J10464047 is among the lowest ever observed. With an absolute magnitude = 16.51 mag, a low stellar mass = 1.8106 M⊙ and a very low mass-to-light ratio / 0.0029 (in solar units), J10464047 has a very high specific star-formation rate sSFR 430 Gyr-1, indicating very active ongoing star formation. Another striking feature of J10464047 is that it possesses a ratio O32 = ([O iii]5007)/([O ii]3727) 57. Using this extremely high O32, we have confirmed and improved the strong-line calibration for the determination of oxygen abundances in the most metal-deficient galaxies, in the range 12 + log(O/H) 7.65. This improved method is applicable for all galaxies with O32 60. We find the H emission line in J10464047 to be enhanced by some non-recombination processes and thus can not be used for the determination of interstellar extinction.
keywords:
galaxies: dwarf – galaxies: starburst – galaxies: ISM – galaxies: abundances.1 Introduction
The importance of finding of extremely metal-deficient (XMD) low-redshift star-forming galaxies (SFGs), with oxygen abundances 12 + log(O/H) in the range 6.9 – 7.1, is emphasized by the fact that they share many of the same properties with the dwarf galaxies at high redshifts (low metallicities and luminosities, high star formation rates and high specific star formation rates) and thus may be considered as their best local counterparts. These high-redshift dwarfs are thought to be responsible for the reionization of the Universe and so it is crucial to study them in detail. However, until very recently, no galaxy with a definite oxygen abundance below 12 + log(O/H) 7.1 is known at high redshifts, even if recent James Webb Space Telescope (JWST) observations of galaxies with larger than are included (Ouchi et al., 2009; Wise & Chen, 2009; Yajima, Choi & Nagamine, 2011; Mitra, Ferrara & Choudhury, 2013; Bouwens et al., 2015; Izotov et al., 2018c). Only lately, Atek et al. (2023) have reported the discovery by JWST of eight SFGs at 6–8 with 12 + log(O/H) approaching the value of 7.0 and stellar masses of 107M⊙. These properties are similar to those of the most metal-deficient low- SFGs considered in this paper.
Because of the lack of many known XMDs in the early Universe, our strategy is to search for and use low- metal-poor SFGs as their local proxies. A few such XMD objects have been found at low redshifts. Hirschauer et al. (2016) have reported 12 + log(O/H) = 7.020.03 for the galaxy AGC 198691. Izotov et al. (2018a), Izotov et al. (2019a) and Izotov et al. (2021a) have derived oxygen abundances in J08114730, J12343901 and J22292725 of 6.980.02, 7.0350.026 and 7.085031, respectively. All these galaxies were selected from the Sloan Digital Sky Survey (SDSS). Kojima et al. (2020) have recently reported the discovery of the galaxy J16314426 with 12 + log(O/H) = 6.900.03. However, Thuan, Guseva & Izotov (2022) have derived a higher abundance 12 + log(O/H) = 7.140.03 for this galaxy, based on their own independent observations. In all these studies, the oxygen abundances have been derived by the direct method from spectra of the entire galaxy. Common characteristics of these XMD galaxies are their low stellar mass 107 M⊙ and a very compact morphological structure. In addition to these galaxies, very low oxygen abundances of 7.010.07, 6.980.06 and 6.860.14 have also been found by Izotov et al. (2009) in three individual H ii regions of the XMD SBS 0335052W. A value of 6.960.09 has been obtained by Annibali et al. (2019) in one of the H ii regions in the dwarf irregular galaxy DDO 68. However, other regions in SBS 0335052W and DDO 68 do show oxygen abundances above 7.1.
In this paper, we present new spectroscopic observations of the XMD galaxy J10464047, obtained with the Kitt Peak Ohio State Multi-Object Spectrograph (KOSMOS), mounted on the Apache Point Observatory (APO) 3.5m Telescope. We supplement the KOSMOS observations with SDSS spectroscopic observations. The galaxy was selected from the SDSS Data Release 16 (DR16) data base (Ahumada et al., 2020) because its line ratios suggest it to be an extremely low-metallicity object. It also drew our attention because of its extremely high (extinction-corrected) O32 value of 57, defined as the ratio ([O iii]5007)/([O ii]3727). This high ratio indicates that the galaxy may contain density-bounded H ii regions, and thus be a potential Lyman continuum leaker (e.g. Jaskot & Oey, 2013) and a good local counterpart to the high-redshift dwarf galaxies. Its coordinates, redshift and other characteristics obtained from the photometric and spectroscopic SDSS and the Galaxy Evolution Explorer (GALEX) data bases are presented in Table 1. We note that the galaxy was not detected by space Wide-field Infrared Survey Explorer (WISE) because in part of its low metallicity and thus low dust content.
| Parameter | J10464047 |
|---|---|
| R.A.(J2000) | 10:46:09.23 |
| Dec.(J2000) | +40:47:07.07 |
| 0.048740.00006 | |
| GALEX FUV, mag | 20.270.24 |
| GALEX NUV, mag | 21.190.28 |
| SDSS , mag | 20.850.06 |
| SDSS , mag | 20.180.02 |
| SDSS , mag | 21.390.07 |
| SDSS , mag | 20.710.04 |
| SDSS , mag | 21.670.27 |
| , Mpc∗ | 217.80.3 |
| , mag† | 16.510.06 |
| log /Lg,⊙‡ | 8.790.44 |
| log /M⊙†† | 6.250.15 |
| /, M⊙/Lg,⊙ | 0.00290.0001 |
| (H), erg s-1∗∗ | (3.50.6)1040 |
| SFR, M⊙yr-1‡‡ | 0.770.13 |
| sSFR, Gyr-1 | 430180 |
| 12+logO/H††† | 7.0820.016 |
∗Luminosity distance.
†Absolute magnitude corrected for Milky Way extinction.
‡log of the SDSS -band luminosity corrected for Milky Way extinction.
††Stellar mass derived from the extinction-corrected SDSS spectrum.
∗∗H luminosity derived from the extinction-corrected SDSS spectrum.
‡‡Star formation rate derived from the Kennicutt (1998) relation using the extinction-corrected H luminosity.
†††Oxygen abundance derived from the SDSS spectrum.


2 Observations and data reduction
2.1 SDSS and APO/KOSMOS spectra
We show in Fig. 1a the SDSS spectrum of J10464047. It is seen from insets (1) – (3) that the signal-to-noise ratio of most weak emission lines is sufficiently high to derive extinction from the hydrogen Balmer emission lines and the element abundances. In particular, [O iii] 4363 emission line [inset (2)] is strong. Another feature is the weak [O ii] 3727 emission line which is partially blended with the hydrogen H13 and H14 emission lines. To derive its intensity, we apply the deblending procedure with fitting by Gaussians. However, the strongest emission lines H, [O iii] 4959 and most notably the [O iii] 5007 emission lines, are clipped. The [O iii] 4959 emission line is skewed because of clipping and the [O iii] 4959/H flux ratio is equal to 0.89 in the SDSS spectrum, whereas it is 1.06 in the KOSMOS spectrum. We also can not exclude clipping of the H emission line, because its intensity is similar to that of the [O iii] 4959 emission line. Therefore, the SDSS spectrum alone can not be used for the determination of the electron temperature and element abundances.
We attempted to observe this galaxy with the 8.4m Large Binocular Telescope (LBT) to obtain a higher signal-to-noise spectrum and to derive intensities of the strong emission lines. However, due to a specific particularity of the Multi-Object Double Spectrograph (MODS) at the LBT, it was not possible to select a guide star for the observations. Therefore, we observed the blue part of the J10464047 spectrum with the KOSMOS at the 3.5m APO telescope on 19 April 2023, with an exposure time of 900 s and a resolving power of 2600. Observations were done at the relatively high airmass of 1.36, but with the slit oriented along the parallactic angle. Therefore, the effect of differential refraction was minimal (Filippenko, 1982), at least in the wavelength range of 4300 – 5000Å, which is of main interest here. The seeing during the observations was 1.2 arcsec.
Our main aim is to obtain the intensities of the strong emission lines in the KOSMOS spectrum. This spectrum is shown in Fig. 1b. It has a lower signal-to-noise ratio compared to the SDSS spectrum. Furthermore, the sensitivity of KOSMOS at 4000Å is low, making uncertain the determination of line intensities at these wavelengths, including the [O ii] 3727 emission line. Therefore, for element abundance determination, we use the SDSS spectrum. The intensities of H, [O iii] 4959, 5007 emission lines in this spectrum are scaled from the KOSMOS spectrum with the use of the H emission line intensities in both the SDSS and KOSMOS spectra. The observed intensities of the H emission line in the SDSS and KOSMOS spectra differ only by 5 per cent, indicating that aperture corrections for different spectroscopic apertures are small. We also note that the intensity of the H emission line in the SDSS spectrum is 10 per cent lower than in the KOSMOS spectrum and its equivalent width in the SDSS spectrum of 390Å is lower than the one of 411Å in the KOSMOS spectrum. These differences indicate some small clipping of the H emission line in the SDSS spectrum.
The observed emission-line intensities in both SDSS and KOSMOS spectra were measured using the iraf splot routine. The emission-line errors in the SDSS spectrum are calculated using the pixel-by-pixel errors included in the file of the spectrum, whereas the emission-line errors in the KOSMOS spectrum are calculated using the pixel-by-pixel errors generated by the iraf apall routine during extraction of the one-dimensional spectrum. We then use the ratio of the H emission line intensities in both SDSS and KOSMOS spectra to scale the intensities of the strong H, [O iii] 4959, 5007 emission lines in the KOSMOS spectrum. These intensities are employed instead of those of the clipped emission lines in the SDSS spectrum.
The intensities of emission lines in the SDSS spectrum were corrected iteratively for extinction and underlying stellar absorption, derived from comparison of the observed intensity ratios of the hydrogen Balmer emission lines H, H, H, H, H9, H10, H11, H12 with the theoretical recombination ratios, as described in Izotov et al. (1994). The theoretical ratios weakly depend on the electron temperature and electron number density. We obtain them, adopting the approximate electron temperature (O iii) from the observed [O iii] 4363/(4959+5007) intensity ratio, and the approximate electron number density from the observed [S ii] 6717/6731 intensity ratio. The equivalent widths of the underlying stellar Balmer absorption lines are assumed to be the same for each hydrogen line.
The extinction-corrected fluxes together with the extinction coefficient (H), the observed H emission-line flux (H), the rest-frame equivalent width EW(H) of the H emission line, and the equivalent width of the Balmer absorption lines are shown in the left column of Table 2.
2.2 Enhancement of H emission
We find the derived extinction coefficient (H) to be abnormally high, equal to 0.520. This value is not typical for low-metallicity SFGs. Furthermore, the extinction-corrected intensities of H and other higher-order hydrogen lines in the blue part of the spectrum relative to the extinction-corrected intensity of the H line are 20 – 30 per cent higher than the theoretical recombination values (e.g. Storey & Hummer, 1995). It is clear that these emission-line intensities were overcorrected for extinction. The likely reason for such an overcorrection may be that the H emission line is enhanced by some non-recombination process. For example, an additional contribution of H emission from massive stars and supernovae could produce such an effect. Such an enhancement has been detected in the spectra of several other SFGs, most notably in the galaxies J13202155 (Izotov & Thuan, 2009), Haro 11C (Guseva et al., 2012), and J11542443 (Izotov et al., 2018b).
It is clear from the above considerations that the H emission line should not be used for the determination of the extinction coefficient in J10464047. Excluding this line, we derive a much lower (H) = 0.180, more typical of low-metallicity SFGs. The intensities of all hydrogen emission lines relative to H, corrected for extinction with the lower (H) and underlying absorption (right column in Table 2) are now close to the theoretical recombination values (Storey & Hummer, 1995).
2.3 A very young starburst and hard ionizing radiation
We note two features in the spectrum of J10464047, which are very rarely seen in the spectra of other SFGs, including those with the lowest heavy element abundances. First, the O32 ratio of 57 is very high compared to the ones in most other SFGs from the SDSS (compare the position of another SFG, J2229+2725, with a similar O32 = 53, and the positions of SDSS galaxies in fig. 4 from Izotov et al., 2021a). Second, the H equivalent width EW(H) of 411Å is also very large. J10464047 is very similar in these characteristics to J22292725 (Izotov et al., 2021a). This indicates that the starbursts in both galaxies are very young, with an age 1 – 2 Myr.
The SDSS spectrum of J10464047 has a sufficiently high signal-to-noise ratio to show two high-ionization emission lines [Fe v] 4227 and He ii 4686 [inset (2) in Fig. 1a and Table 2], indicative of the presence of hard ionising radiation (with energies greater than 54 eV). The [Fe v] 4227 emission line is frequently seen in spectra with high signal-to-noise ratio of low-metallicity star-forming galaxies (e.g. Fricke et al., 2001; Izotov, Chaffee & Schaerer, 2001; Thuan & Izotov, 2005; Izotov, Thuan & Guseva, 2021b; Berg et al., 2021). Its presence is associated with that of the He ii 4686 emission line. On the other hand, the low-ionization lines [N ii] 6583 and [S ii] 6717, 6731 are very weak [inset (3) in Fig. 1a], indicative of a very high ionization parameter.
| Line | 100()/(H) | |
|---|---|---|
| (H) is derived | (H) is derived | |
| including H | excluding H | |
| (1) | (2) | |
| 3722.00 H14 | 3.441.05 | 2.670.81 |
| 3727.00 [O ii] | 7.201.22 | 5.610.95 |
| 3735.00 H13 | 4.371.38 | 2.850.82 |
| 3750.15 H12 | 5.221.27 | 3.560.83 |
| 3770.63 H11 | 7.851.25 | 5.720.89 |
| 3797.90 H10 | 8.391.28 | 6.150.92 |
| 3835.39 H9 | 11.111.37 | 8.331.01 |
| 3868.76 [Ne iii] | 35.622.07 | 28.431.65 |
| 3889.00 He i+H8 | 27.521.84 | 21.621.44 |
| 3968.00 [Ne iii]+H7 | 33.241.99 | 26.601.58 |
| 4026.19 He i | 1.890.84 | 1.560.69 |
| 4101.74 H | 35.022.00 | 28.871.64 |
| 4227.20 [Fe v] | 1.500.74 | 1.290.63 |
| 4340.47 H | 54.232.38 | 47.712.09 |
| 4363.21 [O iii] | 17.121.32 | 15.271.17 |
| 4471.48 He i | 3.690.79 | 3.380.73 |
| 4685.94 He ii | 1.650.59 | 1.590.57 |
| 4712.00 [Ar iv]+He i | 2.950.66 | 2.860.64 |
| 4740.20 [Ar iv] | 1.940.59 | 1.890.58 |
| 4861.33 H | 100.003.22 | 100.003.21 |
| 4958.92 [O iii] | 103.923.27 | 106.303.33 |
| 5006.80 [O iii] | 309.657.55 | 319.767.77 |
| 5875.60 He i | 7.760.69 | 9.120.81 |
| 6562.80 H | 281.887.12 | 356.598.98 |
| 6583.40 [N ii] | 0.41 | 0.53 |
| 6678.10 He i | 2.040.36 | 2.610.46 |
| 6716.40 [S ii] | 0.340.24 | 0.440.30 |
| 6730.80 [S ii] | 0.36:0.24 | 0.46:0.31 |
| 7065.30 He i | 2.920.39 | 3.900.52 |
| 7135.80 [Ar iii] | 0.640.24 | 0.860.32 |
| 7281.35 He i | 0.860.25 | 1.180.35 |
| (H)† | 0.5200.030 | 0.1800.030 |
| (H)‡ | 41.132.25 | 41.132.25 |
| EW(H)∗ | 411.322.0 | 411.322.0 |
| EW(abs)∗ | 1.10.3 | 0.00.0 |
†Extinction coefficient, derived from the observed hydrogen
Balmer decrement.
‡Observed flux in units of 10-16 erg s-1 cm-2.
∗Rest-frame equivalent width in Å.
3 Diagnostic diagrams and integrated characteristics of J10464047
3.1 Diagnostic diagrams
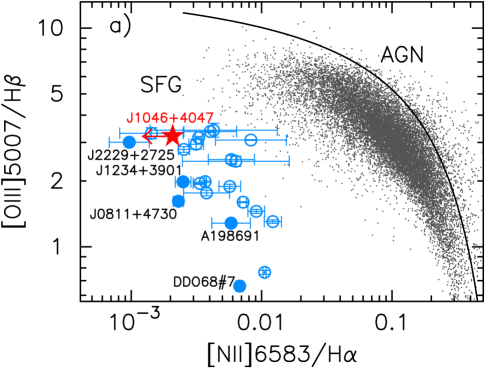
It is known (e.g. Izotov, Thuan & Guseva, 2012; Hirschauer et al., 2016; Izotov et al., 2018a) that extremely metal-deficient SFGs strongly deviate in the diagnostic diagrams from the main sequence SFGs with higher metallicities. This difference can be used to search for the most metal-deficient galaxies by analyzing the relations between the strongest emission lines in the optical spectra.
The most commonly used diagnostic diagram is the one proposed by Baldwin, Phillips & Terlevich (BPT) (Baldwin et al., 1981). It is shown in Fig. 2a. The most metal-deficient SFGs with 12 + log(O/H) 7.1 (filled circles) and the SFGs with 12 + log(O/H) 7.1 – 7.3 (open circles) are located far from the main-sequence SFGs (grey dots). The latter are in general much more enriched with heavy elements, having a characteristic 12 + log(O/H) in the range 7.9 – 8.1. The SFGs shown by coloured symbols form two well-separated distinct sequences: SFGs shown by filled circles have lower metallicities compared to SFGs represented by open circles. The [N ii] 6583 emission line is not detected in the spectrum of J10464047. Therefore we show its location in Fig. 2a (filled star) by plotting the upper limit of this line. Furthermore, all extremely low-metallicity SFGs are faint objects with a very weak [N ii] 6583 emission line, so that it can be detected only in spectra with high signal-to-noise ratios.
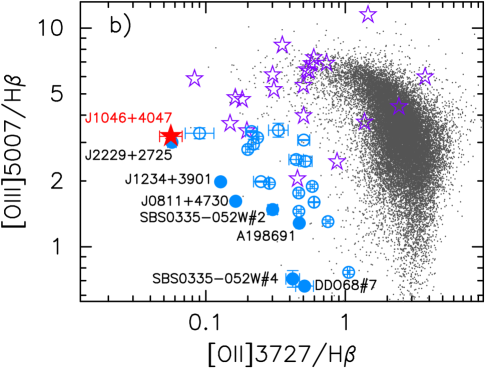
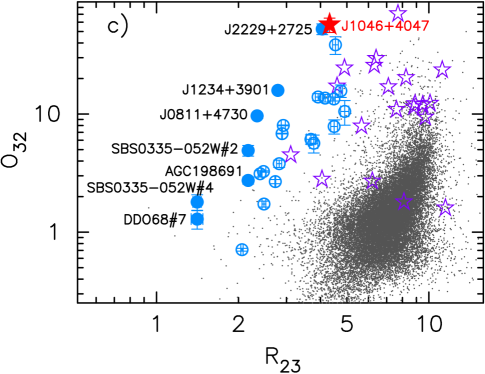
A more promising diagram to search for the most metal-poor SFGs is the ([O iii] 5007)/(H) – ([O ii] 3727)/(H) diagram (Fig. 2b), because it relies on the considerably brighter [O ii] 3727 emission line rather than the weaker [N ii] 6583 emission line. Similarly to Fig. 2a, the lowest-metallicity SFGs form two well-separated sequences. Finally, we consider the O32 – R23 diagram, shown in Fig. 2c, where O32= ([O iii]5007)/([O ii]3727) and R23 = ([O ii]3727 + [O iii]4959 + [O iii]5007)/(H). Again, two distinct sequences of lowest-metallicity SFGs are seen. We note that the locations of two SFGs, J10464047 and J22292725 are nearly coincident in Figs. 2b and 2c, indicating that both galaxies have nearly the same oxygen abundances. For comparison, the 6 – 8 SFGs of Heintz et al. (2022) and Saxena et al. (2023) are shown in Fig. 2b and Fig. 2c by open purple stars. The positions of most of these SFGs indicate a metallicity lower than those of main-sequence SFGs, but not as low as those in the nearby most metal-deficient galaxies with 12 + log(O/H) 7.1.
3.2 Integrated characteristics
For the determination of the integrated characteristics of J10464047 such as stellar mass, star-formation rate and luminosity, we have adopted the luminosity distance = 347 Mpc, obtained from the galaxy redshift for the cosmological parameters H0 = 67.1 km s-1 Mpc-1, = 0.318, = 0.682 (Planck Collaboration XVI, 2014).
The stellar mass of J10464047 is determined from fitting the spectral energy distribution (SED). We follow the prescriptions of Izotov et al. (2018a), starburst99 models (Leitherer et al., 1999) and adopt stellar evolution models by Girardi et al. (2000), stellar atmosphere models by Lejeune, Buser & Cuisiner (1997) and the Salpeter (1955) initial mass function (IMF) with lower and upper mass limits of 0.1 M⊙ and 100 M⊙, respectively.
The equivalent width of the H emission line in J10464047 of 411Å is high (Table 2), indicating a substantial contribution of the nebular continuum, amounting about 50 per cent of the total continuum near the H emission line. Therefore, following e.g. Izotov et al. (2018a), both the stellar and nebular continua are taken into account in the SED fitting. The star-formation history was approximated by a recent short burst at age 10 Myr and a prior continuous star formation. Details on the SED fitting procedure can be found e.g. in Izotov et al. (2018a).
We obtain a stellar mass = 106.25 M⊙ for J10464047. The star formation rate of 0.77 M⊙ yr-1 is derived from the Kennicutt (1998) relation using the extinction-corrected H luminosity and the H/H recombination intensity ratio of 2.7. This yields a very high specific star formation rate sSFR of 430 Gyr-1, indicative of very active ongoing star formation. The absolute SDSS magnitude, corrected for the Milky Way extinction is = 16.51 mag (Table 1). Adopting = 106.25 M⊙, we derive the very low mass-to-luminosity ratio / of 0.0029 (in solar units) for J10464047. That ratio is comparable to those of three other most metal-poor compact SFGs, J08114730, J12343901 and J22292725 (Izotov et al., 2018a, 2019a, 2021a). It is approximately two orders of magnitude lower than the mass-to-light ratios of the majority of compact SFGs in the SDSS shown by grey dots in Fig. 2.
| Property | Value | |
|---|---|---|
| (H) is derived | (H) is derived | |
| including H | excluding H | |
| (1) | (2) | |
| (O iii), K | 283002000 | 253001600 |
| (O ii), K | 22800800 | 20700700 |
| (S iii), K | 252001700 | 227001300 |
| (S ii), cm-3 | 9201800 | 8801800 |
| O+/H+106 | 0.2320.034 | 0.2270.033 |
| O2+/H+105 | 0.9310.045 | 1.1630.043 |
| O3+/H+106 | 0.2240.091 | 0.2120.086 |
| O/H105 | 0.9770.046 | 1.2070.044 |
| 12+log(O/H) | 6.9900.021 | 7.0820.016 |
| N+/H+107 | 0.208 | 0.307 |
| ICF(N) | 36.672 | 46.133 |
| N/H106 | 0.763 | 1.417 |
| log(N/O) | 1.108 | 0.931 |
| Ne2+/H+106 | 2.2200.132 | 2.1840.127 |
| ICF(Ne) | 1.021 | 1.017 |
| Ne/H106 | 2.2670.135 | 2.2210.130 |
| log(Ne/O) | 0.6340.033 | 0.7350.030 |
| Ar2+/H+107 | 0.1200.058 | 0.1850.091 |
| ICF(Ar) | 2.993 | 3.557 |
| Ar/H107 | 0.3590.504 | 0.6580.748 |
| log(Ar/O) | 2.4350.610 | 2.2630.494 |
4 Heavy element abundances
4.1 Direct method
We use the extinction-corrected emission-line fluxes derived from the SDSS spectrum and the prescriptions of Izotov et al. (2006) to derive heavy element abundances in J10464047. The electron temperature (O iii) is calculated from the [O iii]4363/(4959 + 5007) emission-line flux ratio. It is used to derive the abundances of O3+, O2+ and Ne2+. The abundances of O+, N+ and S+ are derived with the electron temperature (O ii) and the abundance of Ar2+ is derived with the electron temperature (S iii), using the relations of Garnett (1992) between (O ii), (S iii) and (O iii). The electron number density was derived from the [S ii]6717/6731 flux ratio. The electron temperatures and electron number densities are shown in Table 3. We note that the [S ii]6717, 6731 emission lines are very weak [inset (3) in Fig. 1a]. Therefore, the electron number density is uncertain.
For comparison, we first consider the case with (H) = 0.520, which is the value derived when the H emission line is included in the determination of extinction. The emission-line intensities are shown in column (1) of Table 2. The derived electron temperature (O iii) of 28300 K is very high (Table 3). It is likely to be overestimated because of the overestimation of (H). The electron number density is also higher than typical values for SFGs, though it is very uncertain because of the weakness of [S ii]6717, 6731 emission lines [inset (3) in Fig. 1a]. We note that uncertainties in the electron number density play a minor role as long as the low-density limit is satisfied, i.e. when the observed electron number density is less than critical densities of 105 cm-3 for forbidden transitions, including [S ii]6717, 6731 transitions. That is the case here. The ionic abundances, ionisation correction factors and total O, N, Ne and Ar abundances are obtained using relations by Izotov et al. (2006). They are presented in Table 3. We derived the extremely low oxygen abundance 12 + log(O/H) of 6.99, in part due to an overestimated (O iii). The logarithm of the Ne/O abundance ratio log(Ne/O) = –0.634 is somewhat higher compared to the values of 0.75 – 0.85 for SFGs with low metallicities (e.g. Izotov et al., 2006). This is because the [Ne iii] 3868 emission line, used for the Ne abundance determination, has been overcorrected for extinction as compared to the [O iii] emission lines.
Adopting the more reasonable value (H) = 0.180, derived by excluding the H emission line, we obtain (O iii) = 25300 K [column (2) in Table 3]. Although this temperature is high, it is still similar to that in other most metal-deficient SFGs. The nebular oxygen abundance of 12+log(O/H) = 7.0820.016 in J10464047 is very close to that in J22292725 (Izotov et al., 2021a). It is among the lowest found for SFGs. The logarithms of the Ne/O and Ar/O abundance ratios (Table 3) for this galaxy are similar to those in other low-metallicity SFGs (e.g., Izotov et al., 2006).
4.2 Strong-line method for oxygen abundance determination in XMD galaxies
The extraordinarily high O32 ratio of 57 in J10464047, together with O32 = 53 in J22292735, makes both objects excellent targets for testing and improving the calibration of the strong-line method for oxygen abundance determination in rare extremely low-metallicity SFGs, with the highest O32 ratios, using the strong oxygen emission lines in the optical range.
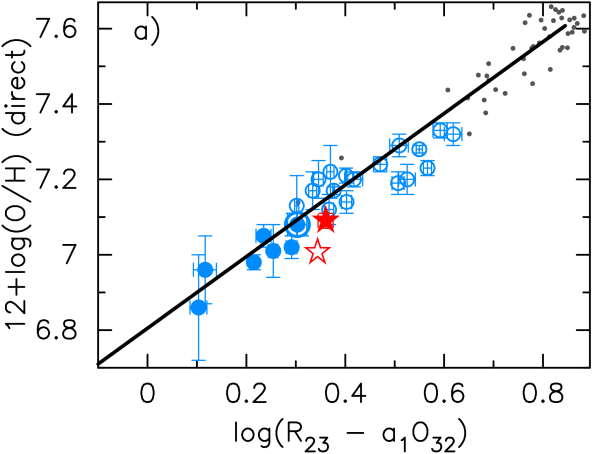
Recently Izotov et al. (2019b, 2021a), have developed a strong-line method for XMD galaxies, calibrated by using high-quality observations of the most metal-poor galaxies with a well-detected [O iii]4363 emission line. A common problem of the strong-line methods is that they depend on several parameters. In particular, the method based on oxygen line intensities depends not only on the sum R32 = ([O ii]3727 + [O iii]4959 + [O iii]5007])/(H), but also on the ionisation parameter. A good indicator of the ionisation parameter is the O32 ratio. Izotov et al. (2021a) have proposed a method which takes into account the correction for ionization parameter in a wide range of O32, up to the value of 53. The dependence found by Izotov et al. (2021a) is shown in Fig. 3a. It is derived by the maximum likelihood estimation technique (Press et al., 2007),
| (1) |
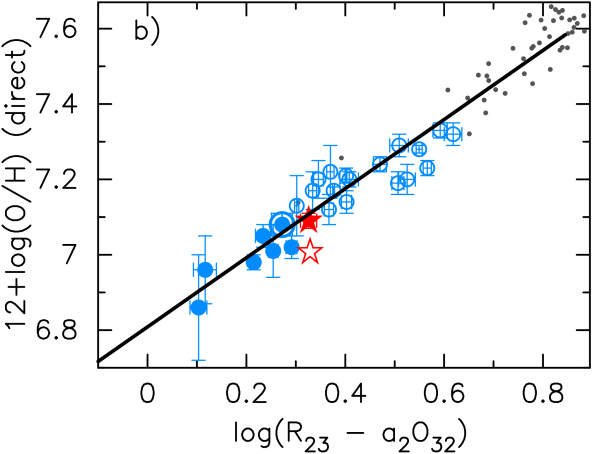
where = 0.080 – 0.00078O32. In Fig. 3a we also show the position of J10464047 by a filled star, for (H) = 0.180, and by an open star, for (H) = 0.520. For comparison, the position of J22292725 is shown by an encircled filled circle. For (H) = 0.180, J10464047 closely follows the relation for SFGs with 12 + log(O/H) 7.3, represented by a straight line, whereas a higher offset is present for the case with (H) = 0.520 (open star).
However, a slight offset is present even for the case with (H) = 0.180 (filled star). This can be due to the fact that, at the high O32 value for J10464047, some improvement of Eq. 1 is needed. We can achieve this by adding one more term in the polynomial expansion of the dependence of the oxygen abundance on the O32 ratio, and by minimizing the position deviations of all galaxies in Fig. 3, including both J22292725 (encircled filled circle) and J10464047 (filled star), from the linear maximum likelihood fit. We then iteratively vary the coefficient in the new polynomial term and calculate a new fit in each step with a new value of the polynomial . We obtain:
| (2) |
where = 0.080 – 0.00078O32 + 0.00000095O. This relation is shown in Fig. 3b. Adding a new term only changes slightly the positions of J22292725 and J10464047, making them in better agreement with the relation shown by the solid line.
On the other hand, the large offset of J10464047 when adopting (H) = 0.520 (open star), indicates that the oxygen abundance derived by the direct method with this high (H) is underestimated by 0.1 dex. As for the position of J22292725 (encircled filled blue circle), it is changed to a lesser extent. The positions of other extremely low metallicity galaxies with 12+log(O/H) 7.3 and lower O32 are not changed. We also note that the extrapolation of the relations Eqs. 1 – 2 to higher 12+log(O/H), up to 7.65, fits well the position of SDSS SFGs (grey dots in Fig. 3). There is an improvement of 12 + log(O/H) by 0.04 dex in J10464047 if Eq. 2 is used instead of Eq. 1. On the other hand, the calibration by Izotov et al. (2019b) is not applicable to both J10464047 and J22292725 despite their very similar high O32, as illustrated in fig. 8 of Izotov et al. (2021a) for J22292725.
In summary, both relations Eqs. 1 and 2 can be used for the determination of oxygen abundances in extremely low-metallicity galaxies with 12+log(O/H) smaller than 7.65, with an uncertainty of 0.05 dex (Fig. 3), when the direct method can not be applied because of the weakness of the [O iii] 4363 emission line. Particularly, the modified relation (Eq. 2) should be used for the rare galaxies with extremely high O32 ratios above 40, whereas the simpler relation derived by Izotov et al. (2019b) can be applied to the vast majority of SFGs with lower O32.
5 Conclusions
We present Sloan Digital Sky Survey (SDSS) and 3.5m Apache Point Observatory (APO) Telescope/Kitt Peak Ohio State Multi-Object Spectrograph (KOSMOS) spectrophotometric observations of the compact star-forming galaxy (SFG) J10464047, selected from the SDSS Data Release 16 (DR16). This local SFG possesses a very low metallicity and an extremely high O32 ratio. Our main results are as follows.
1. The emission-line spectrum of J10464047, with a stellar mass of 1.8106 M⊙ and an absolute SDSS -band magnitude of –16.51 mag, originates from a hot [(O iii) = 25300 K] ionised gas. The detection of the [Fe v] 4227 and He ii 4686 emission lines indicates the presence of hard ionising radiation. The oxygen abundance in J10464047 is 12+log(O/H) = 7.0820.016, one of the lowest for nearby SFGs.
2. The rest-frame equivalent width EW(H) of the H emission line of 411Å in the J10464047 spectrum is one of the highest measured so far in SFGs. Both the very high EW(H) and very low / indicate that the J10464047 emission is strongly dominated by a very young stellar population with an age 2 Myr. These properties are similar to those of another very metal-deficient SFG known, J22292725 (Izotov et al., 2021a).
3. The O32 = ([O iii]5007)/([O ii]3727) flux ratio of 57 in J10464047 is extremely high and is similar to the O32 = 53 of J22292725 with nearly the same oxygen abundance. These properties together with the very high rest-frame equivalent width EW(H) of the H emission line imply that both galaxies are at a very young stage of their formation. The unique properties of J22292725 and J10464047 likely make them the best local counterparts of young high-redshift dwarf SFGs with stellar masses and metallicities similar to those of the galaxies, recently discovered at 6 – 8 by Atek et al. (2023).
4. The extremely high O32 ratio in J10464047 allows us to verify and slightly improve the strong-line method by Izotov et al. (2021a), based on the intensities of strong nebular [O ii]3727 and [O iii]4959+5007 emission lines. We can use it for the determination of the oxygen abundance in extremely low-metallicity SFGs, in the range 12 + log(O/H) 7.65 and O32 60.
5. We find that the H emission line in J10464047 is enhanced by some non-recombination processes such as, for example, collisional excitation of H in the circumstellar envelopes of luminous massive stars or in dense supernova remnants. Therefore, this line can not be used for interstellar extinction determination in J10464047.
Acknowledgements
Y.I.I. and N.G.G. acknowledge support from the National Academy of Sciences of Ukraine (Project No. 0123U102248) and from the Simons Foundation. This study is based on observations with the the 3.5m Apache Point Observatory (APO). The Apache Point Observatory 3.5-meter telescope is owned and operated by the Astrophysical Research Consortium. iraf is distributed by the National Optical Astronomy Observatories, which are operated by the Association of Universities for Research in Astronomy, Inc., under cooperative agreement with the National Science Foundation. Funding for the Sloan Digital Sky Survey IV has been provided by the Alfred P. Sloan Foundation, the U.S. Department of Energy Office of Science, and the Participating Institutions. SDSS-IV acknowledges support and resources from the Center for High-Performance Computing at the University of Utah. The SDSS web site is www.sdss.org. SDSS-IV is managed by the Astrophysical Research Consortium for the Participating Institutions of the SDSS Collaboration. Based on observations made with the NASA Galaxy Evolution Explorer. GALEX is operated for NASA by the California Institute of Technology under NASA contract NAS5-98034. This research has made use of the NASA/IPAC Extragalactic Database (NED), which is operated by the Jet Propulsion Laboratory, California Institute of Technology, under contract with the National Aeronautics and Space Administration.
Data availability
The data underlying this article will be shared on reasonable request to the corresponding author.
References
- Ahumada et al. (2020) Ahumada R. et al., 2020, ApJS, 249, 1
- Annibali et al. (2019) Annibali F. et al., 2019, MNRAS, 482, 3892
- Atek et al. (2023) Atek H. et al., 2023, preprint arXiv:2308.08540
- Baldwin et al. (1981) Baldwin J. A., Phillips M. M., Terlevich R., 1981, PASP, 93, 5
- Berg et al. (2021) Berg D. A., Chisholm J., Erb D. K., Skillman E. D., Pogge R. W., Olivier G. M., 2021, ApJ, 922, 170
- Bouwens et al. (2015) Bouwens R. J., Illingworth G. D., Oesch P. A., Caruana J., Holwerda B., Smit R., Wilkins S., 2015, ApJ, 811, 140
- Filippenko (1982) Filippenko A. V., 1982, PASP, 94, 715
- Fricke et al. (2001) Fricke K. J., Izotov Y. I., Papaderos P., Guseva N. G., Thuan T. X., 2001, AJ, 121, 169
- Garnett (1992) Garnett D. R., 1992, AJ, 103, 1330
- Girardi et al. (2000) Girardi L., Bressan A., Bertelli G., Chiosi C., 2000, A&AS, 141, 371
- Guseva et al. (2012) Guseva N. G., Izotov Y. I., Fricke K. J., Henkel C., 2012, A&A, 541, A115
- Heintz et al. (2022) Heintz K. E. et al., 2022, preprint arXiv:2212.02890
- Hirschauer et al. (2016) Hirschauer A. S. et al., 2016, ApJ, 822, 108
- Izotov & Thuan (2009) Izotov Y. I., Thuan T. X., 2009, ApJ, 707, 1560
- Izotov et al. (1994) Izotov Y. I., Thuan T. X., Lipovetsky V. A., 1994, ApJ, 435, 647
- Izotov et al. (2001) Izotov Y. I., Chaffee F. H., Schaerer D., 2001, A&A, 378, L45
- Izotov et al. (2006) Izotov Y. I., Stasińska G., Meynet G., Guseva N. G., Thuan T. X., 2006, A&A, 448, 955
- Izotov et al. (2009) Izotov Y. I., Guseva N. G., Fricke K. J., Papaderos P., 2009, A&A, 503, 61
- Izotov et al. (2012) Izotov Y. I., Thuan T. X., Guseva N. G., 2012, A&A, 546, 122
- Izotov et al. (2018a) Izotov Y. I., Thuan T. X., Guseva N. G., Liss S. E., 2018a, MNRAS, 473, 1956
- Izotov et al. (2018b) Izotov Y. I., Schaerer D., Worseck G., Guseva N. G., Thuan, T. X., Verhamme A., Orlitová I., Fricke K. J., 2018b, MNRAS, 474, 4514
- Izotov et al. (2018c) Izotov Y. I., Worseck G., Schaerer D., Guseva N. G., Thuan, T. X., Fricke K. J., Verhamme A., Orlitová I., 2018c, MNRAS, 478, 4851
- Izotov et al. (2019a) Izotov Y. I., Thuan T. X., Guseva N. G., 2019a, MNRAS, 483, 5491
- Izotov et al. (2019b) Izotov Y. I., Guseva N. G., Fricke K. J., Henkel C., 2019b, A&A, 623, 40
- Izotov et al. (2021a) Izotov Y. I., Thuan T. X., Guseva N. G., 2021a, MNRAS, 504, 3996
- Izotov et al. (2021b) Izotov Y. I., Thuan T. X., Guseva N. G., 2021b, MNRAS, 508, 2556
- Jaskot & Oey (2013) Jaskot A. E., Oey M. S., 2013, ApJ, 766, 91
- Kennicutt (1998) Kennicutt R. C., Jr., 1998, Ann.Rev.Astron.Astrophys., 36, 189
- Kojima et al. (2020) Kojima T. et al., 2020, ApJ, 898, 142
- Leitherer et al. (1999) Leitherer C. et al., 1999, ApJS, 123, 3
- Lejeune et al. (1997) Lejeune T., Buser R., Cuisinier F., 1997, A&AS, 125, 229
- Mitra et al. (2013) Mitra S., Ferrara A., Choudhury T. R., 2013, MNRAS, 428, L1
- Ouchi et al. (2009) Ouchi M. et al., 2009, ApJ, 706, 1136
- Planck Collaboration XVI (2014) Planck Collaboration XVI, 2014, A&A, 571, 16
- Press et al. (2007) Press W. H., Teukolsky S. A., Vetterling W. T., Flannery B. P., 2007, Numerical Recipes 3rd Edition: The Art of Scientific Computing, New York: Cambridge University Press, 1235 pp.
- Salpeter (1955) Salpeter E. E., 1955, ApJ, 121, 161
- Saxena et al. (2023) Saxena A. et al., 2023, preprint arXiv:2306.04536
- Storey & Hummer (1995) Storey P. J., Hummer D. G., 1995, MNRAS, 272, 41
- Thuan & Izotov (2005) Thuan T. X., Izotov Y. I., 2005, ApJS, 161, 240
- Thuan et al. (2022) Thuan T. X. Guseva N. G., Izotov Y. I., 2022, MNRAS, 516, L81
- Wise & Chen (2009) Wise J. H., Cen R., 2009, ApJ, 693, 984
- Yajima et al. (2011) Yajima H., Choi J.-H., Nagamine K., 2011, MNRAS, 412, 411