Test of the Orbital-Based LI3 Index as a Predictor of the Height of the 3MLCT 3MC Transition-State Barrier for Gas-Phase [Ru(N∧N)3]2+ Polypyridine Complexes
Denis Magero
School of Science, Technology and Engineering, Department of Chemistry and Biochemistry,
Alupe University, P.O. Box 845-50400, Busia, Kenya
e-mail: dmagero@au.ac.ke
Ala Aldin M. H. M. Darghouth
College of Sciences, University of Mosul, Al Majmoaa Street, Mosul,
41002 Iraq.
e-mail: aladarghouth@uomosul.edu.iq
Mark E. Casida
Laboratoire de Spectrométrie, Interactions et Chimie théorique
(SITh),
Département de Chimie Moléculaire (DCM, UMR CNRS/UGA 5250),
Institut de Chimie Moléculaire de Grenoble (ICMG, FR-2607),
Université Grenoble Alpes (UGA)
301 rue de la Chimie, CS40700, F-38058 Grenoble Cedex 9, France
e-mail: mark.casida@univ-grenoble-alpes.fr
Abstract
Ruthenium(II) polypyridine compounds often luminesce but the luminescence lifetime depends upon the precise nature of the ligands. This luminescence lifetime is thought to be controlled by the barrier to conversion from an initial phosphorescent triplet metal-ligand charge transfer (3MLCT) state to a nonluminscent triplet metal-centered (3MC) state which decays nonradiatively. Earlier work [J. Photochem. Photobiol. A 348, 305 (2017)] took room temperature and liquid nitrogen (77 K) lifetimes from a large previously-published database [Coord. Chem. Rev. 84, 85 (1988)] and extracted empirical average 3MLCT 3MC transition state (TS) barrier heights (s) which were not believed to be quantitative but which were believed to capture the trends in the true barrier heights correctly. These were then used together with information from partial density of states calculations [J. Photochem. Photobiol. A 276, 8 (2014)] to derive several orbital-based luminescence indices of which the third (LI3) was based upon frontier-molecular-orbital-like ideas and correlated linearly with values of . As it is known that is a large underestimate of the true 3MLCT 3MC TS barrier height in the case of the trisbipyridine ruthenium(II) cation [Ru(bpy)3]2+ , but accurate TS barrier heights are difficult to obtain experimentally, it was judged useful to verify the ideas used to derive the LI3 index by calculating the energetics of the gas-phase 3MLCT 3MC reaction for a series of ruthenium(II) tris bipyridine complexes using the same density functional and basis sets used in calculating LI3. Specifically, four closely-related bipyradine complexes [Ru(N∧N)3]2+ with N∧N = bpy (6), 4,4’-dm-bpy (70), 4,4’-dph-bpy (73), and 4,4’-DTB-bpy (74) were used for these calculations. We examine the trans dissociation mechanism in great detail at the B3LYP/6-31G+LANLDZ(Ru) level of detail and uncover a two part mechanism. In the first part, the electron is transferred to a single ligand rather than symmetrically to all three ligands. It is the two Ru-N bonds to this ligand which are equally elongated in the transition state. The intrinsic reaction coordinate then continues down a ridge in hyperspace and bifurcates into one of two symmetry-equivalent 3MC structures with elongated trans bonds. Interestingly, no significant difference is found for the TS barriers for the four complexes treated here. Instead, LI3 is linearly correlated with the energy difference . While this work shows that LI3 predicts the total energy difference and this does correlate well with the luminescence lifetime, we do not have a detailed understanding yet of how this happens and are also wary of oversimplicity as there are likely other excited-state reactions occurring on similar time scales which may also impact the luminescence lifetimes.
![[Uncaptioned image]](/html/2311.01704/assets/x1.png)
Graphical Abstract
1 Introduction
Luminescent ruthenium(II) complexes elicit immense interest [1, 2, 3, 4, 5, 6, 7, 8, 9, 10, 11, 12] owing to their wide range of applications, including photochemical molecular devices, biological sensors, organic light emitting diodes, and biomedical applications, ††margin: LFT among others. The commonly assumed ligand-field theory (LFT) mechanism explaining this luminescence begins with the ruthenium complex initially in ††margin: GS its closed-shell ground-state (1GS) configuration,
| (1) |
(The 1X and 3X pre-exponents denote respectively that the state X ††margin: 1X , 3X is a singlet or triplet. Note that the orbital is nonbonding but that the orbitals are antibonding. We have also indicated some unoccupied orbitals on the ligands.) Figure 1 emphasizes that these ligand orbitals are within the LFT gap of the metal.
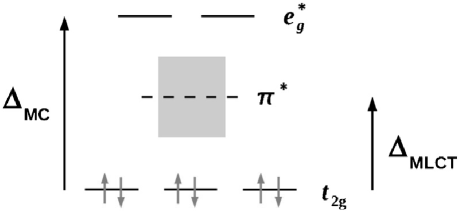
Upon absorption of a photon, an electron is excited from the metal to the ligand to create a high-lying singlet ††margin: MLCT metal-ligand-charge-transfer (1MLCT) configuration,
| (2) |
which relaxes by non-radiative relaxation to the lowest 3MLCT state,
| (3) |
its closed-shell ground-state (1GS) configuration,
| (4) |
Energetically close to this state is a triplet metal-centered (3MC) state which mixes with the 3MLCT state to form an avoided crossing, allowing repopulation of the orbitals via back transfer of an electron,
| (5) |
As this 3MC state does not luminesce, its formation quenches the phosphoresence of the ruthenium(II) complex leading to shortened luminescence lifetimes. Here it is important to realize that, while we talk of states, the picture in most chemical physicists’/physical chemists’ minds is that of LFT orbitals. However most transition metal complex calculations are carried out using ††margin: DFT density-functional theory (DFT) where extracting LFT orbitals is far from obvious. Previous work showed how a LFT-like understanding of ruthenium(II) polypyridine complexes could be ††margin: PDOS obtained using a partial density of state (PDOS) method [13], in particular allowing assignment of the energy of the antibonding state which had posed a problem in previous theoretical work. This, in turn, allowed the construction of an orbital-based luminscence ††margin: LI3 index of which the third try (LI3) correlated well with experimentally-derived 3MLCT 3MC activation energies for about one hundred compounds [14]. However we have no reason to believe that is a quantitative measure of the 3MLCT 3MC barrier height, even though it is derived from experiment and so reflects general luminescence trends in ruthenium(II) polypyridine complexes. This is further confirmed by comparison of with the best available experimental and theoretical values for the same barrier height [14]. It thus makes sense to carry out a more stringent test of LI3 using barriers calculated at the same level as the original PDOS calculations used to calculate LI3, namely gas-phase B3LYP/6-31G+LANLDZ(Ru) (see Sec. 2 for computational details). Such calculations are both computer-resource and human-time intensive and so we restricted our calculations to only a few ruthenium(II) polypyridine complexes. Several aspects of the results turned out to be rather surprising! (Vide infra!)
The 3MLCT 3MC process may be thought of as a chemical reaction involving the metal orbitals and the ligand orbitals. Just as frontier molecular orbital ††margin: FMOT theory (FMOT) has been successful in explaining many chemical reactions, similar arguments were used to motivate the LI3 orbital-based luminescence index [14]
| (6) |
Notice how the form of the LI3 descriptor is typical of FMOT with an orbital energy difference in the denominator. The numerator represents the square of the off-diagonal term in the orbital hamiltonian in the Helmholtz approximation just as in familiar semi-empirical applications of FMOT, but neglecting the orbital overlap term. As shown in Fig. 2, this descriptor works remarkably well for predicting for the compounds considered in the present article. It still works very well when considering a much larger number of compounds though there is necessarily more scatter in the corresponding graph and a small number of compounds appear far enough away from the line that we might start to question whether they follow the same luminescence mechanism as the other compounds [14]. This is not entirely surprising because not all bonds are
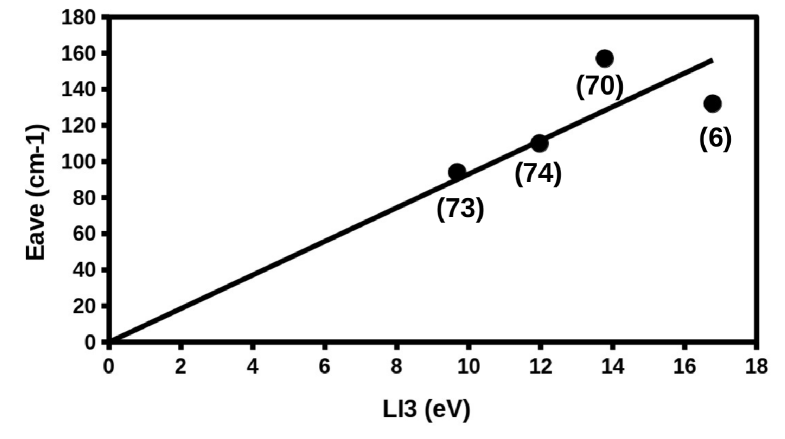
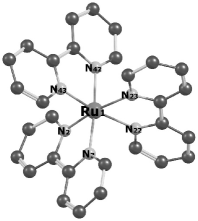
symmetry equivalent in many of these compounds. Given the difficulty of a thorough investigation of reaction barriers, we decided to focus first on only a small series of similar complexes for which results are reported in the present article. These complexes are shown in Fig. 3 and the Lewis dot structures of the corresponding ligands are shown in Fig. 4.
 |
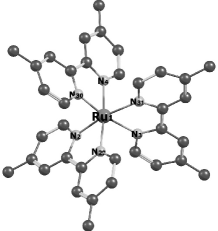 |
| (a) N∧N = bpy (6) | (b) N∧N = 4,4’-dm-bpy (70) |
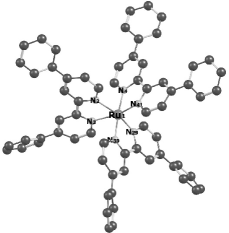 |
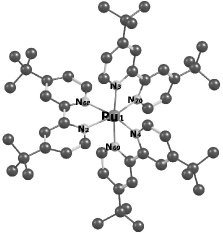 |
| (c) N∧N = 4,4’-dph-bpy (73) | (d) N∧N = 4,4’-DTB-bpy (74) |
| (a) bpy: 2,2’-bipyridine (6) |
| (b) 4,4’-dm-bpy: 4,4’-dimethyl-2,2’-bipyridine (70) |
 |
| (c) 4,4’-dph-bpy: 4,4’-diphenyl-2,2’-bipyridine (73) |
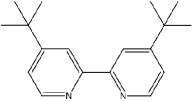 |
| (d) 4,4’-DTB-bpy: 4,4’-di-tert-butyl-2,2’-bipyridine (74) |
This series of complexes was chosen as small and “simple” as possible to ††margin: TS minimize the problem of multiple transition states (TSs) because locating TSs and determining their barrier heights can be difficult.
Let us look in more detail at the conventional mechanism for ruthenium(II) photoluminescence. On the basis of experimental results and LFT group theoretical arguments, Adamson has given a set of rules for photodissociation rules for complexes [15]:
Rule 1. Trans dissociation will occur for those opposing ligands with the weakest average ligand field strength.
Rule 2. In the case of nonidentical ligands, the ligand of greater field strength aquates first.
As Rule 1 appears to be stronger than Rule 2, ruthenium(II) polypyridine complexes have been almost universally assumed to undergo trans dissociation. This coordinate provides a 1D cut allowing us to sketch ††margin: PEC an approximate potential energy curve (PEC). The luminsence mechanism described in the first paragraph is then easy to understand in terms of the diagram in Fig. 5. Note that the 1GS
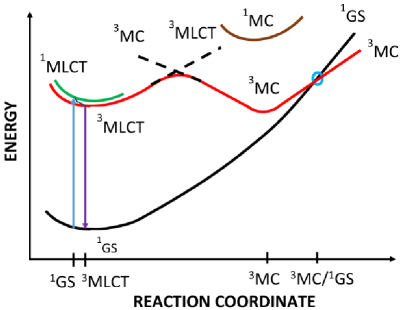
and 3MLCT geometries are represented as very similar, radiationless 1MLCT 3MLCT intersystem crossing is very easy because the two curves have very similar energies and because of spin-orbit coupling due to the heavy ruthenium atom, the 1MC and 3MC geometries are also expected to be similar but with longer ruthenium-ligand bond lengths because of the occupation of the antibonding orbital, there is an avoided crossing between the 3MC and 3MLCT states, and there is easy radiationless de-activation of the 3MC state back to the 1GS.
Such a picture is subject to experimental verification but obtaining barrier heights experimentally requires careful rate measurements at a series of temperatures and extraction using an appropriate model, usually assuming an Arrhenius rate law. An accurate experimental value for the 3MLCT 3MC barrier height of 3800 cm-1 is known for the prototypical trisbipyridine ruthenium(II) cation complex [Ru(bpy)3]2+ in acetonitrile [16] (3960 cm-1 in propionitrile/buylronitile (4:5 v/v) is quoted in Ref. [14]), but for very few other complexes. The problem of obtaining experimental barrier heights has been discussed in more detail in Ref. [14] where a compromise was made in calculating ††margin: so as to be able to use data covering a large number of compounds. The value = 132 cm-1 was found for [Ru(bpy)3]2+ which clearly underestimates the previously quoted experimental barriers, but the hope was that trends in barrier heights would be accurately captured by the experimentally-derived . This hypothesis is exactly what we wish to test in the present work.
It might seem that determining reaction paths and barrier heights might be easier than determining them experimentally. However such complexes are expected to have a plethera of TSs. Adamson’s trans dissociation of complexes with six identical monodentate ligands is completely consistent with the expected Jahn-Teller distortion of an open-shell complex. However there are three symmetry-equivalent trans dissociation pathways, each of which should be associated with three ††margin: PES different TSs on a Mexican hat potential energy (hyper)surface (PES) [17]. This has also been discussed in the context of cobalt(II) imine complexes having a single type of bidentate ligand (e.g., Fig. 7 of Ref. [18]). In addition to the TSs of each of the three symmetry-equivalent trans dissociation products, we may also expect TSs between the symmetry-equivalent 3MLCT geometries and between the symmetry-equivalent 3MC geometries. In the case of three identical bidentatate ligands, our complex has and enantiomers. These also interconvert via TSs. Interconversion between the isomers has been proposed to happen either via Bailar or by Ray-Dutt twists [19], each of which has associated TSs. And there is the question of whether the excited electron in the 3MLCT is transferred equally to all three bidentate ligands or preferentially to a single bidentate ligand? Certainly photodissociation experiments which observe the replacement of a bpy ligand with water in [Ru(bpy)3]2+ to form [Ru(bpy)2(H2O)2]2+ [20] seem consistent with the idea that symmetry breaking is occurring in such a way that one of the bpy is treated differently than the others. And this reaction also has its own TS. All of which means that we must expect many probably close-lying TSs to complicate our investigation.
Of course we are not the first to carryout a theoretical investigation of 3MCLT 3MC PECs, but the number seems to still be rather small [21, 22, 23, 24] and relatively recent. In their 2015 paper [21], Yoshikawa et al. report the energies and geometries of 3MCLT 3MC transition states for nine [Ru(bpy)2(phen derivative)]2+, where “phen derivative” refers to either (1) phen, (2) 4-phenyl-phen, (3) 4,7-diphenyl-phen, (4) 2,9-dimethyl-4,7-diphenyl-phen, (5) 2,9-dimethyl-phen,(6) 3,4,7,8-tetramethyl-phen, (7) 5-amino-phen, (8) 5-methyl-phen, and (9) 3-phenylethynyl-phen. However no PECs were reported. In their 2016 paper [22, 23], Zhou et al. report 3MCLT 3MC PECs for four derivatives of fac-tris(1-methyl-5-phenyl-3-n-propyl-[1,2,4]-triazolyl)iridium(III). In their 2017 paper [25], Dixon et al. report 3MCLT 3MC PECs for [Ru(bpy)(btz)2]2+. In their 2017 paper [24], Sun et al. report 3MCLT 3MC PECs for [Ru(bpy)3]2+ and for [Ru(mphen)3]2+. Finally, in their 2018 papers [26, 25], Soupart et al. report the 3MCLT 3MC potential energy curves for trans [25] and for cis [26] dissociation. Fumanal et al. report transition states for [Mn(im)(CO)3(phen)]+ but without detailed potential energy curves [27].
Some of the most extensive theoretical work has been done studying [Ru(bpy)3]2+ [28, 29, 30, 25, 26] where it is clearly seen that the PEC of Fig. 5 is an oversimplification which sould be replaced with a possibly complex set of competing processes. To begin with, the 3MLCT state of [Ru(bpy)3]2+ has more than one minimum, including a minimum with symmetry where the ruthenium electron has been transferred equally to the three ligands and a minimum with symmetry where the ruthenium electron has been transferred to a single bpy ligand [28]. The same reference reports a 3MC in order to remove the spatial degeneracy of the 3MLCT state. Spin-orbit effects can explain radiationless relaxation to the ground state via SMC mixing as in shown in Fig. 5 [29]. However LFT considerations [15] suggest that cis dissociation might also occur. Indeed theoretical calculations show that cis triplet dissociation has a comparable but higher barrier than does trans triplet dissociation [30, 25]. The trans 3MCLT 3MC pathway has been mapped out in gas phase and solvent for [Ru(bpy)3]2+ [26]. While the overall conclusion is that complex processes are going on, the dominant one still seems to be trans dissociation. We emphasize that we have consulted with the authors of Ref. [26] and use the same techniques, but have pushed the methodology a little further in the direction of answering our driving question about LI3 and the energetics of trans dissociation.
Although the present work is restricted to a small family of closely related molecules, we have nevertheless realized that great care was needed in our calculations because something strange seemed to be happening. Complex 6 ([Ru(bpy)3]2+) has atoms and therefore internal degrees of freedom. Even though some of these degrees of freedom are fairly rigid, this still leaves a lot of possibilities for processes to occur which are different from those initially imagined! So we have made a very careful effort to be systematic:
-
1.
Our first step was to make 2D scans of the PES by fixing two trans bond lengths at different fixed values and minimizing all the other degrees of freedom. This gives us our first crude view of the reaction mechanism, but scans are well-known to be misleading when it comes to finding TSs and reaction paths (Ref. [31] gives a particularly clear explanation of why this is so.) It does, however, provide us with first guesses that are subsequently used to optimize the 3MC and 3MCLT geometries for trans dissociation. ††margin: NEB
-
2.
We then used the nudged elastic band (NEB) method [32, 33] to start from an interpolated path for trans dissociation and find a first approximation to the reaction path. This is important as only ††margin: MEP the NEB, and not the 2D scan, was able to give us a maximum energy point (MEP) close enough to a TS to be useful.
-
3.
The MEP geometry still has to be optimized using a TS optimizer. Special methods must then be used to locate the TS and to determine the reaction pathways [34, 35]. These are typically computationally resource intensive both because they require multiple single point quantum chemical calculations but also because of the need to calculate first and second derivatives of the PESs [34, 35, 36, 37, 38, 39, 40].
-
4.
The optimized TS still has to be confirmed as linking the 3MC and 3MLCT minima and this is done by following the intrinsic reaction ††margin: IRC coordinate (IRC) in both directions along the direction of the imaginary vibrational coordinate to verify that the TS does indeed correspond to the desired reaction path.
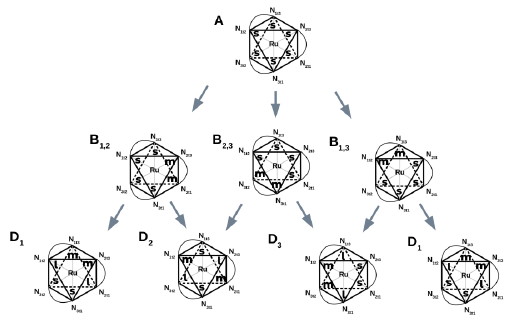
It is also possible to follow the change in character of the molecule along the IRC by using Mulliken population analysis to follow the spin- and charge-density along the reaction path. Given the surprising nature and complexity of what we found, we prefer to give a schematic of our main conclusions and then later justify them. This schematic PES is shown in Fig. 6. The details of the notation will be explained later. Briefly the initial 3MLCT state is quite symmetric so that it is difficult to distinguish three symmetry equivalent Jahn-Teller distorted geometries. The IRC is consistent with an electron being transferred to a particular bidentate ligand whose two bonds to the central ruthenium atom elongate simultaneously so as to maintain symmetry at the TS and beyond. The reaction path is then on a ridge and can bifurcate in either of two directions to find one of two symmetry-equivalent minima. This accounts for small indications here and there in the literature (and our own experience) that, and explains why, the IRC is unusually difficult to calculate for this reaction.
| (a) | |
|---|---|
| (b) | 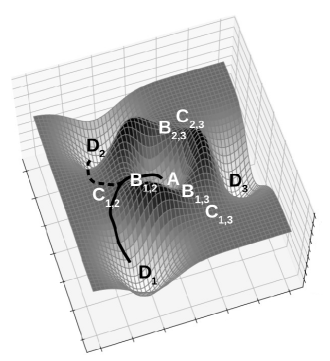 |
 |
The rest of this paper is organized as follows: Our computational methods are described in the next section. Section 3 justifies the general picture seen in Fig. 6 and then goes on to compare calculated barrier and reaction energies with LI3. Section 4 summarizes our conclusions. Additional information is available as Supplementary Information ††margin: SI (SI) (Sec. Supplementary Information).
2 Computational Details
The four-step procedure that was used in the present work has already been described in the introduction. This section goes into greater technical detail.
We used two programs to carryout this procedure, namely version 09 revision D.01 of the Gaussian code [43] and version 5.0.2 of the ORCA code [44]. All calculations were gas phase calculations with the same basis sets and the same functionals.
The basis consisted of the valence double- quality 6-31G basis
set for H [45], N [46], and C [46].
The Ru atom requires an effective core
potential (ECP) in order to include relativistic effects. We used
††margin:
LANL2DZ
ECP
the LANL2DZ ECP and the corresponding double- basis set [47].
effective core potential (ECP) [47] was used to characterize Ru.
H, N and C atoms were described by 6-31G basis set.
The density functional approximation used is the B3LYP (Becke exchange, 3 parameter, Lee-Yang-Parr correlation) functional described in Ref. [48] and initially programmed in Gaussian. Unfortunately this functional has a history of confusion which can ††margin: VWN be traced back to the implementation of the Vosko-Wilke-Nusair (VWN) ††margin: LDA parameterization of the local density approximation (LDA) in Gaussian. Their parameterization of Ceperley and Alder’s quantum Monte Carlo results (found in the caption of Fig. 5 of Ref. [49]) should have been used as this is what had been referred to as VWN in works by all previous authors. However the Vosko-Wilke-Nusair parameterization ††margin: RPA of a random phase approximation (RPA) result for the electron gas result was called VWN in Gaussian. Instead of correcting the error, Gaussian refers to the original parameterization of the Ceperley-Alder ††margin: VWN5 results as VWN5. The implementation of B3LYP in Gaussian uses VWN for the LDA. However B3LYP in ORCA uses the orginal VWN (i.e., ††margin: B3LYP/G VWN5) in its implementation of B3LYP and requires the specification of B3LYP/G in order to get the original B3LYP. We used the original B3LYP in our calculations througout this paper.
While there may be some value in using other functionals and better basis sets in implicit solvent, such changes would defeat our goal of calculating barriers to compare with the LI3 indices already calculated at the B3LYP/6-31G+LANLDZ(Ru) level used in Ref. [14]. So we decided to stick with the original level of calculation.
In Gaussian, all calculations were carried out without any symmetry
contraints, using an ultrafine grid, and the spin-unrestricted formalism.
††margin:
SCF
DIIS
Self-consistent field (SCF) convergience was achieved using the direct
inversion of iterative subspace (DIIS) extrapolation algorithm.
Frequency calculations were
performed on the optimized geometries so as to check whether they were
the true minima (with no imaginary frequencies) or a transition state
(with one imaginary frequency). For all the calculations, (pop=full)
was set to full so as to extract all the information.
In ORCA, keywords used included NORI (no approximation is used),
TightSCF, TightOpt, SlowConv, NumFreq and an
ultra-fine grid. We explicitly confirmed that Gaussian and Orca
gave the same results for the same basis sets and functionals in single-point
calculations.
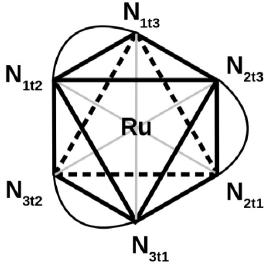
We also need some system of N atom numbering in order to be able to discuss the photochemical reaction pathways. One possibility is to just use the numbers shown in Fig. 3. However we found that we could be a little less arbitrary by using a system where each of the N∧N ligands with the numbers 1,2, and 3. Each of the N in a given N∧N is ††margin: t trans to a different N∧N, so we may label as t the in the th N∧N that is trans to the th N∧N. This is a great improvement over using the atom numbers in Fig. 3, but still is complicated by the fact that there are still six different ways to permute the three numbers (1,2,3). The possible alternative numberings are shown in Table 1. With a little practice and an occasional sketch (Fig. 7), it is relatively easy to master. Usually it is the 2t1-1t2 or the 3t1-1t3 trans stretch which interests us in our calculations. We will now take a step-by-step look at how we carried out our calculations. Many of these steps could have been carried out using either the Gaussian or the ORCA codes, but we chose to allow different people use the codes with which they were most familiar once we had assured ourselves that the two codes did indeed give the same results.
| Complex | Ru-N Bond | (1,2,3) | (1,3,2) | (2,1,3) | (2,3,1) | (3,1,2) | (3,2,1) |
|---|---|---|---|---|---|---|---|
| [Ru(bpy)3]2+ | 1-2 | 3t2 | 2t3 | 3t1 | 1t3 | 2t1 | 1t2 |
| (6) | 1-3 | 3t1 | 2t1 | 3t2 | 1t2 | 2t3 | 1t3 |
| 1-22 | 2t1 | 3t1 | 1t2 | 3t2 | 1t3 | 2t3 | |
| 1-23 | 2t3 | 3t2 | 1t3 | 3t1 | 1t2 | 2t1 | |
| 1-42 | 1t3 | 1t2 | 2t3 | 2t1 | 3t2 | 3t1 | |
| 1-43 | 1t2 | 1t3 | 2t1 | 2t3 | 3t1 | 3t2 | |
| [Ru(4,4’-dm-bpy)3]2+ | 1-2 | 3t2 | 2t3 | 3t1 | 1t3 | 2t1 | 1t2 |
| (70) | 1-3 | 2t1 | 3t1 | 1t2 | 3t2 | 1t3 | 2t3 |
| 1-4 | 1t3 | 1t2 | 2t3 | 2t1 | 3t1 | 3t1 | |
| 1-29 | 3t1 | 2t1 | 3t2 | 3t2 | 2t3 | 1t3 | |
| 1-30 | 1t2 | 1t3 | 2t1 | 2t3 | 2t1 | 3t2 | |
| 1-31 | 2t3 | 1t3 | 1t3 | 3t1 | 1t2 | 2t1 | |
| [Ru(4,4’-dph-bpy)3]2+ | 1-2 | 1t2 | 1t3 | 2t1 | 2t3 | 3t1 | 3t2 |
| (73) | 1-3 | 1t3 | 1t2 | 2t3 | 2t1 | 3t2 | 3t1 |
| 1-4 | 3t2 | 2t3 | 3t1 | 1t3 | 2t1 | 1t2 | |
| 1-29 | 2t1 | 3t1 | 1t2 | 3t2 | 1t3 | 2t3 | |
| 1-39 | 2t3 | 3t2 | 1t3 | 3t1 | 2t1 | 2t1 | |
| 1-41 | 3t1 | 2t1 | 3t2 | 1t2 | 2t3 | 1t3 | |
| [Ru(4,4’-DTB-bpy)3]2+ | 1-2 | 3t1 | 2t1 | 3t2 | 1t2 | 2t3 | 1t3 |
| (74) | 1-3 | 1t2 | 1t3 | 2t1 | 2t3 | 3t1 | 3t2 |
| 1-4 | 2t3 | 3t2 | 1t3 | 3t1 | 2t1 | 2t1 | |
| 1-68 | 3t2 | 2t3 | 3t1 | 1t3 | 2t1 | 1t2 | |
| 1-69 | 2t1 | 3t1 | 1t2 | 3t2 | 1t3 | 2t3 | |
| 1-70 | 1t3 | 1t2 | 2t3 | 2t1 | 3t2 | 3t1 |
Step 1
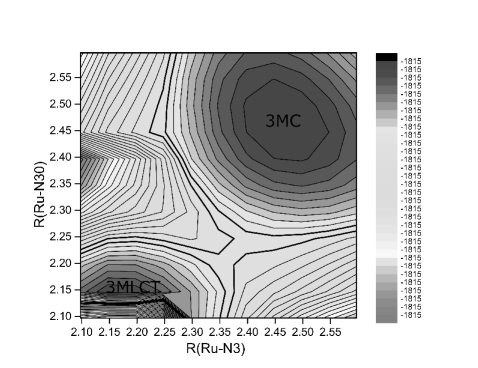
consists of making a 2D scan of the PES. This was done using Gaussian with the objective of finding a suitable 3MLCT minimum energy geometry. This was achieved by first doing a vertical excitation ††margin: FC from the 1GS minimum to obtain the Franck-Condon (FC) 3MLCT. This FC 3MLCT geometry was then optimized to get the 3MLCT local minimum. (It is not a global minimum!) This minimum was confirmed by checking for the absence of imaginary frequencies. We then made a simultaneous 2D-scan by independently stretching two trans Ru-N bonds and made a contour plot. This strategy was adopted from [28] which suggested that the ground state molecular orbitals are of the -type and the population of this -like orbital in the triplet excited state would thus result in the bond elongations (i.e., the LFT orbital is antibonding). Of course all three trans distortions should give the same reaction path. Two axial bonds that were trans to each other were independently elongated from the initial bond length in the optimized geometry of the 3MLCT state to 2.500 Å in steps of 0.002 Å, letting all other geometric parameters relax to give the lowest energy with only the two trans Ru-N distances constrained. The resulting energies had to be resorted before plotting because Gaussian uses a boustrophedon (as an ox plows a field) order when it does a 2D-scan in order to minimize changes in geometries during the scan. The lowest energy point with long trans bonds is a first guess at the 3MC geometry. This was then optimized once again to obtain the minimum energy geometry and the minima was confirmed by checking for the absence of any imaginary frequencies. Mulliken spin density analysis was used to confirm of the nature of the excited-state {0.9 excess spin-up electron on Ru [Eq. (2)] for the 3MLCT state and 1.8 excess spin-up electron on Ru for a 3MC state [Eq. (3)]}.
Step 2
Step 3
The MEP from the NEB calculation in ORCA was further optimized using ORCA’s NEB-TS algorithm. The resultant TS was reoptimized with a different algorithm with Gaussian.
Step 4
Finally Gaussian was used to follow the IRC from the calculated TS and insure that it is indeed connected to the originally input 3MLCT and 3MC input geometries.
3 Results and Discussion
We are now prepared to investigate the question initially posed, namely how well the orbital-based luminescence index LI3 predicts the 3MLCT 3MC barrier height. A first subsection will focus on the mechanism and energetics of the 3MLCT 3MC reaction. The method of calculation of the barrier height was explained earlier as was the reason for the choice of the level of our calculations to be consistent with our earlier calculations of LI3. While we will focus on results for complex 70 (the results for the other three complexes are in the SI), we also want to reveal the correctness of the schematic PES of Fig. 6 as we believe this to be a new and novel contribution to the literature of this well-studied and important family of molecules. A second, and final, subsection will then examine the question of what we can say about the predictive value of LI3.
3.1 3MLCT 3MC Mechanism and Energetics
In the first instance, we focus on complex 70 and show the results for the various steps of our reaction mechanism investigation.
Step 1
The calculated contour plot is shown in Fig. 8. Inspection of a model shows that this plot should be symmetric about the 45∘ line representing interchange between the 2t1 and 1t2 N atoms. It is approximately but not exactly symmetric because of the existance of multiple internal degrees of freedom in this system which may be trapped in different local minima due to the boustrophedon nature of Gaussian’s 2D scan. This phenomenon is well understood [31]. Nevertheless the contour plot is nearly symmetric. It allows us to see that there is an energetically high-lying 3MLCT minimum and an energetically lower-lying 3MC minimum, separated by a barrier. Importantly, this allows us to find a first guess of the 3MC structure which is subsequently optimized. Key optimized Ru-N bond lengths are collected in Table 2.
| Ru-N | Ground State | 3MLCT | TS | 3MC | ||||
| Bond | Gaussian | Orca | Gaussian | Orca | Gaussian | Orca | Gaussian | Orca |
| [Ru(bpy)3]2+ (6) | ||||||||
| 3t2 | 2.110 (s) | 2.111 (s) | 2.096 (s) | 2.098 (s) | 2.101 (s) | 2.100 (s) | 2.115 (s) | 2.115 (s) |
| 3t1 | 2.110 (s) | 2.111 (s) | 2.097 (s) | 2.098 (s) | 2.102 (s) | 2.102 (s) | 2.112 (s) | 2.115 (s) |
| 2t1 | 2.110 (s) | 2.110 (s) | 2.118 (s) | 2.119 (s) | 2.211 (m) | 2.214 (m) | 2.463 (l) | 2.464 (l) |
| 2t3 | 2.110 (s) | 2.110 (s) | 2.118 (s) | 2.119 (s) | 2.215 (m) | 2.212 (m) | 2.176 (m) | 2.170 (m) |
| 1t3 | 2.110 (s) | 2.110 (s) | 2.097 (s) | 2.099 (s) | 2.103 (s) | 2.102 (s) | 2.164 (m) | 2.170 (m) |
| 1t2 | 2.110 (s) | 2.110 (s) | 2.095 (s) | 2.097 (s) | 2.098 (s) | 2.101 (s) | 2.454 (l) | 2.464 (l) |
| [Ru(4,4’-dm-bpy)3]2+ (70) | ||||||||
| 3t2 | 2.109 (s) | 2.109 (s) | 2.097 (s) | 2.097 (s) | 2.098 (s) | 2.096 (s) | 2.129 (s) | 2.112 (s) |
| 2t1 | 2.109 (s) | 2.109 (s) | 2.097 (s) | 2.097 (s) | 2.227 (m) | 2.225 (m) | 2.437 (l) | 2.465 (l) |
| 1t3 | 2.109 (s) | 2.109 (s) | 2.097 (s) | 2.097 (s) | 2.103 (s) | 2.103 (s) | 2.139 (m) | 2.186 (m) |
| 3t1 | 2.109 (s) | 2.109 (s) | 2.097 (s) | 2.097 (s) | 2.103 (s) | 2.104 (s) | 2.104 (s) | 2.112 (s) |
| 1t2 | 2.109 (s) | 2.109 (s) | 2.097 (s) | 2.097 (s) | 2.098 (s) | 2.097 (s) | 2.387 (l) | 2.465 (l) |
| 2t3 | 2.109 (s) | 2.109 (s) | 2.097 (s) | 2.097 (s) | 2.226 (m) | 2.225 (m) | 2.222 (m) | 2.168 (m) |
| [Ru(4,4’-dph-bpy)3]2+ (73) | ||||||||
| 1t2 | 2.104 (s) | 2.104 | 2.114 (s) | 2.094 (s) | 2.251 (m) | 2.251 (m) | 2.165 (m) | 2.459 (l) |
| 1t3 | 2.104 (s) | 2.104 | 2.115 (s) | 2.091 (s) | 2.258 (m) | 2.258 (m) | 2.458 (l) | 2.165 (m) |
| 3t2 | 2.104 (s) | 2.104 | 2.091 (s) | 2.098 (s) | 2.103 (s) | 2.103 (s) | 2.165 (m) | 2.108 (s) |
| 2t1 | 2.104 (s) | 2.104 | 2.087 (s) | 2.094 (s) | 2.099 (s) | 2.099 (s) | 2.108 (s) | 2.457 (l) |
| 2t3 | 2.104 (s) | 2.104 | 2.094 (s) | 2.091 (s) | 2.106 (s) | 2.106 (s) | 2.108 (s) | 2.165 (m) |
| 3t1 | 2.104 (s) | 2.104 | 2.086 (s) | 2.098 (s) | 2.101 (s) | 2.101 (s) | 2.456 (l) | 2.108 (s) |
| [Ru(4,4’-DTB-bpy)3]2+ (74) | ||||||||
| 3t1 | 2.107 (s) | 2.107 | 2.130 (s) | 2.130 (s) | 2.229 (m) | 2.230 (m) | 2.357 (l) | 2.465 (l) |
| 1t2 | 2.107 (s) | 2.107 | 2.092 (s) | 2.092 (s) | 2.102 (s) | 2.102 (s) | 2.106 (s) | 2.166 (s) |
| 2t3 | 2.107 (s) | 2.107 | 2.075 (s) | 2.073 (s) | 2.090 (s) | 2.090 (s) | 2.210 (m) | 2.110 (m) |
| 3t2 | 2.107 (s) | 2.107 | 2.130 (s) | 2.130 (s) | 2.231 (m) | 2.231 (m) | 2.357 (l) | 2.167 (m) |
| 2t1 | 2.107 (s) | 2.107 | 2.092 (s) | 2.092 (s) | 2.102 (s) | 2.102 (s) | 2.105 (s) | 2.109 (s) |
| 1t3 | 2.107 (s) | 2.107 | 2.075 (s) | 2.073 (s) | 2.090 (s) | 2.090 (s) | 2.210 (m) | 2.459 (l) |
Step 2
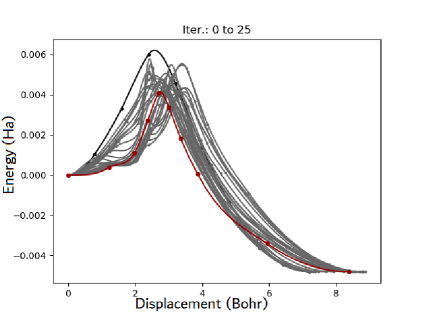
Figure 9 shows the iterative convergence of the NEB IRC from its initial guess to its final result. This is an expensive calculation involving the simultaneous displacement of 24 points (the end points are fixed) in a parallelized calculation. It is clear that its convergence is approximate.

Step 3
Figure 10 shows the IRC obtained from the NEB calculation. In this particular case, the MEP optimizes to a point which gives a considerably lower barrier. The geometries of the optimized TSs obtained with Gaussian and Orca may compared in Table 2. Agreement is to within 0.002 Å.
Step 4
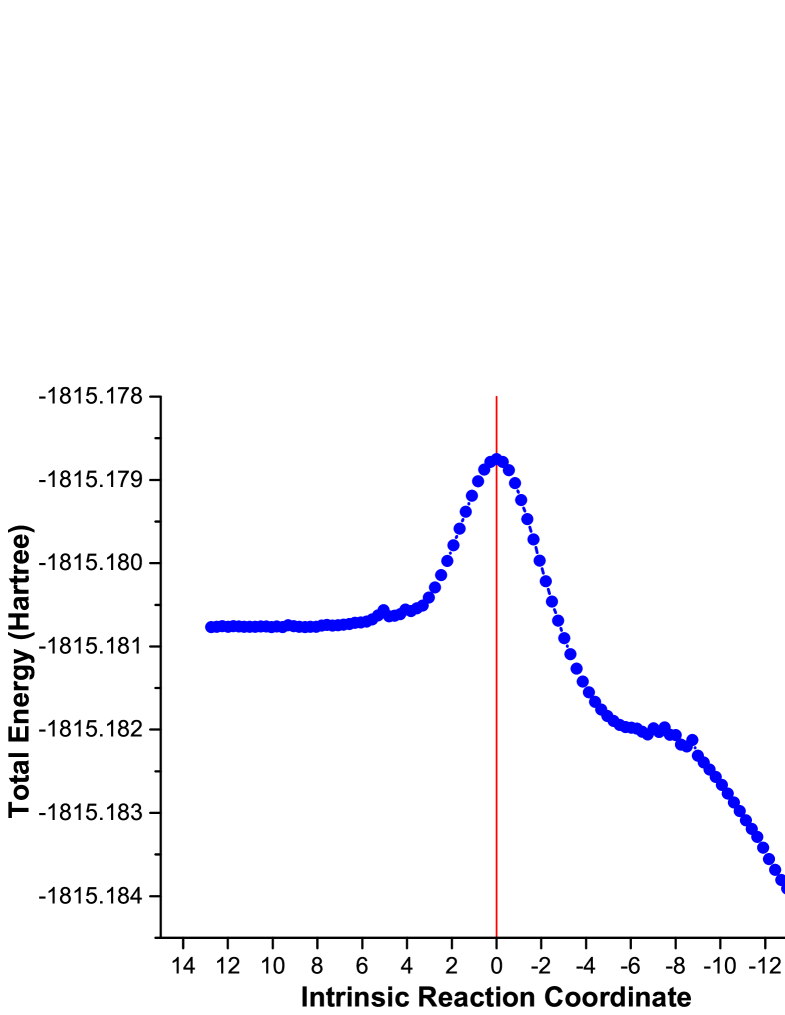
Figure 11 shows the more accurate IRC obtained using Gaussian. Note that this figure evolves from left to right in the 3MLCT 3MC direction while Fig 10 evolves from left to right in the 3MC 3MLCT direction. These calculations confirmed that the TS is connected by the IRC to the originally input 3MC and 3MLCT structures.
Reaction Mechanism
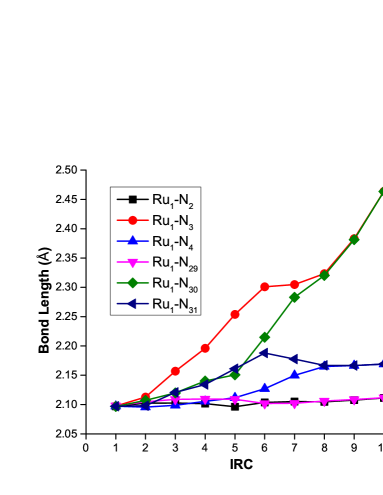
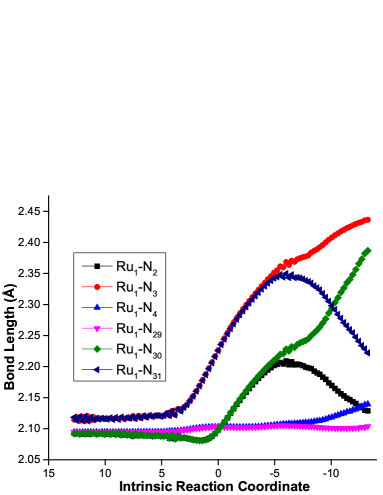
We have also looked at spin densities, but we have found the evolution of Ru-N bond lengths along the IRC to be the most valuable indicator of how the reaction mechanism proceeds. Figures 12 and 13 show how these bond lengths vary along the IRC during the photoreaction. The NEB calculation (Fig. 12) from left to right follows the 3MC 3MLCT reaction. It is less accurate than the IRC calculation carried out with Gaussian (Fig. 13) which from left to right follows the 3MLCT 3MC direction. Only the Gaussian IRC is accurate enough to understand what is going on. From right to left: The initial 3MLCT Ru-N bond lengths are nearly equal until the IRC is reduced to about 3, at which point the 2t1 and 2t3 bond lengths remain equal but increase while the other bond lengths continue to stay about the same. This means that ligand 2 is moving away from the metal in a way that might be expected if the electron on Ru had been transferred to a orbital on ligand 2. This continues beyond the TS (at IRC coordinate 0 in Fig. 13) until we get to an IRC coordinate of about -5. So, up to this point, one of the ligands is coming off by elongating both of its Ru-N bonds equally. When the IRC is less than -5, there is a sudden change in the bond lengths, so that the two trans Ru-N pairs (2t1 and 1t2) become longest while two other pairs (3t2 and 2t2) reduce to a medium bond length. Two Ru-N pairs (3t2 and 3t1) remain short. Such behavior is consistent with the PES scheme shown in Fig. 6. Such a PES should show a bifurcation such that different trans bond lengths could lengthen in different calculations. This is seen in Table 2 for complexes 73 and 74, confirming our overall interpretation of the trans dissociation reaction mechanism.
3.2 What Does LI3 Predict?
We established in our earlier work that the orbital-based luminescence index LI3 correlates well with values of the 3MLCT 3MC barrier derived from experimental luminescence data obtained at room temperature and at the boiling point of liquid nitrogen [14]. This has been illustrated in Fig. 2. The question is not whether LI3 works (it does!) but how it is able to do this. We will address this question more fully in this subsection.
| Complex | /s (77K) | /s (RT) | /cm-1 |
|---|---|---|---|
| (6) | 5.23 | 0.845 | 132. |
| (70) | 4.6 | 0.525 | 157. |
| (73) | 4.79 | 1.31 | 94. |
| (74) | 9.93 | 0.673 | 194. |
It is perhaps appropriate to recall that the fundamental 3MLCT 3MC reaction involves an electron transfer. One famous theory of electron transfer is Marcus theory [50] and Marcus theory has indeed been used in connection with studying electrogenerated chemiluminescence in tris(polypyridine) ruthenium complexes [51]. Marcus theory is valid when the Massey parameter,
| (7) |
is small, where and are the energies of the two diabatic curves (3MLCT and 3MC here) and is the adiabatic coupling. Diagonalizing the corresponding matrix gives the adiabatic curves, corresponding to the PESs treated in the present work. Marcus theory assumes rapid crossing of the avoided crossing region in the weak coupling case (i.e., when ). A detailed derivation [52] shows that Marcus theory assumes rapid oscillation between the reactants and products. The final formula for the reaction rate constant, expressed in terms of Gibb’s free energies is,
| (8) |
where the relaxation parameter is the difference between the product diabatic curve at the reactant minimum and the same curve at the product minimum. In contrast, the strong coupling limit combined with a no-recrossing rule, leads to Eyring’s transition state theory [53] and the equally well-known formula,
| (9) |
which explains the famous Arrhenius equation,
| (10) |
familiar from first-year University chemistry courses. Marcus theory and Eyring transition state theory are, in fact, just two limiting cases of the more general theory of charge transfer reactions [54]. We have not defined every parameter in these well-known equations because we do not need them in the present work and because we are sure that the interested reader can easily find suitable references to fill in any missing details. But it is evident that temperature is in these equations which may at first seem a little strange for a photochemical reaction. A justification is that the luminescence lifetimes of our complexes are on the order of microseconds (Table 3) whereas a typical vibrational time is on the order of picoseconds, which suggests that some degree of thermodynamic equilibration may occur, even if it is not necessarily complete. In turn, this explains why the usual analysis of barriers for these complexes is carried out in terms of the Arrhenius equation with some additional terms involving equilibrium between near-lying electronic states and a melting term (see Ref. [14] and references therein). In our case, we are only interested in the energetics of the 3MLCT 3MC reaction and the extent to which it correlates with LI3. We will assume the Arrhenius picture with the same freqency factor for all our complexes so that only the activation energy is important. Of course, we are also limited by the fact that we are using the same level of calculation of the PESs that we used to calculate our LI3s. We have to accept in advance that this level of calculation may or may not be adequate for directly explaining the experimental observations, even if we expect it to shed light upon our problem.
| Energy\Complex | 6 | 70 | 73 | 74 |
|---|---|---|---|---|
| LI3 | 16.78 eV | 13.78 eV | 9.68 eV | 11.97 eV |
| 3MLCT | -1579.29913 Ha | -1815.18022 Ha | -2965.37532 Ha | -2522.64515 Ha |
| 3MC | -1579.30474 Ha | -1815.18504 Ha | -2965.37816 Ha | -2522.64934 Ha |
| 3MEP | -1579.29661 Ha | -1815.17613 Ha | -2965.37120 Ha | -2522.64201 Ha |
| 3TS | -1579.29769 Ha | -1815.17880 Ha | -2965.37392 Ha | -2522.64328 Ha |
| 3MEP-3MLCT | 0.00252 Ha | 0.00409 Ha | 0.00412 Ha | 0.00314 Ha |
| 553.08 cm-1 | 897.65 cm-1 | 904.24 cm-1 | 689.15 cm-1 | |
| 3TS-3MLCT | 0.00144 Ha | 0.00142 Ha | 0.0014 Ha | 0.00187 Ha |
| 316.04 cm-1 | 311.65 cm-1 | 307.26 cm-1 | 410.42 cm-1 | |
| 3MEP-3MC | 0.00813 Ha | 0.00891 Ha | 0.00696 Ha | 0.00733 Ha |
| 1784.33 cm-1 | 1955.52 cm-1 | 1527.54 cm-1 | 1608.75 cm-1 | |
| 3TS-3MC | 0.00705 Ha | 0.00624 Ha | 0.00424 Ha | 0.00606 Ha |
| 1547.52 cm-1 | 1369.52 cm-1 | 930.57 cm-1 | 1330.02 cm-1 | |
| 3MC-3MLCT | 0.005610 Ha | 0.00482 Ha | 0.00284 Ha | 0.004190 Ha |
| 1231.25 cm-1 | 1057.87 cm-1 | 623.31 cm-1 | 919.60 cm-1 |
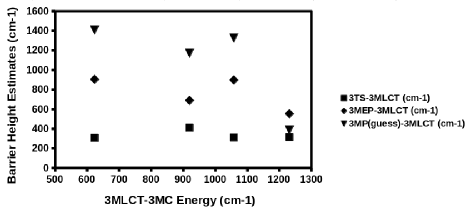
Table 4 gives energies for the 3MLCT states, 3MC states, and TSs for the four compounds obtained from NEB calculations as implemented in the Orca code. Values in parenthesis are in cm-1. Except for the 3MEP values which come from NEB calculations, the same numbers are obtained with Gaussian. It is immediately clear that the 3MLCT 3MC barrier (3MEP-3MLCT or, for more accuracy, 3TS-3MC) is really very small and on the order of about 300-400 cm-1 (0.86-1.14 kcal/mol). Chemical accuracy is usually cited as 1 kcal/mol (349.757 cm-1) and is very hard to achieve even with the best quantum chemical methods.
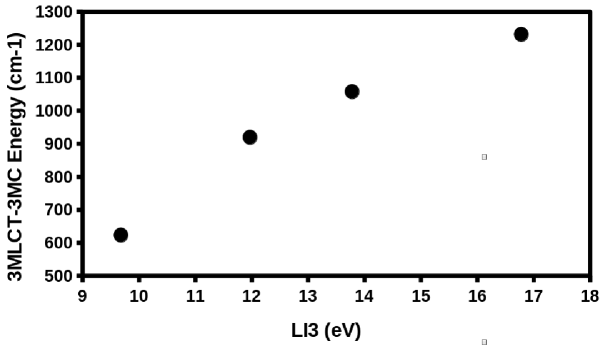
Figure 14 shows that the 3MLCT-3MC energy difference correlates very well with L3—in fact even better than the correlation of with LI3 (Fig. 2). This is consistent with the origin of the FMOT origin of the orbital-based luminescence index LI3.
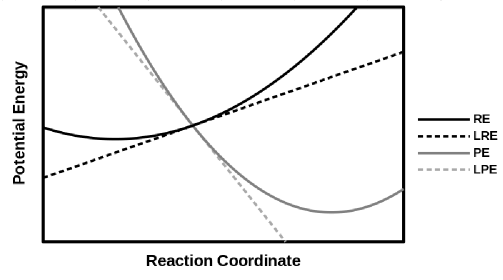
There is an argument that the 3TS-3MLCT energy barrier should vary linearly with the 3MLCT-3MC energy difference,
| (11) |
and hence that the 3TS-3MLCT energy barrier should also correlate quite nicely with L3. This can be understood in terms of two parabollic intersecting diabatic curves as shown in Fig. 15. The intersection point defines the activation energy (). The corresponding reaction coordinate may be found by solving the equation,
| (12) |
where and . Equation (12) may be solved for in many different ways, but taking as an initial guess and then interating leads to rapid convergence in the case we tried. Back in 1936, Bell, Evans, and Polanyi [55, 56] presented an argument which is easily used in the present context. It requires linearlization of the parabolas (dotted lines in Fig. 15) and then solving, which gives,
| (13) |
Identification of the reactant as the 3MLCT state and the product as the 3MC state, then gives Eq. (11). Solving with the full parabolas (which is a step in the derivation of Marcus theory) would lead to an additional quadratic term, which we will ignore here.
But this derivation was important here because it underlines that we need a PEC that resembles two intersecting parabolas, which is evidently not the case in Fig. 11 because of the plateau in the IRC curve caused by the presence of a bifurcation. For this reason, we do not expect the 3TS-3MLCT energy to follow the Bell-Evans-Polanyi postulate, even approximately. However the first guess IRC of the NEB does not go through the bifurcation region and so in in approximate agreement with the Bell-Evans-Polanyi postulate as shown in Fig. 16. As might be expected, after a little reflection, the slope of the first guess NEB MEPs opposite would be opposite to that seen in Fig. 2 for . Also, as previously mentioned our best results (namely 3TS-3MLCT) are actually essentially constant.
We are now left with a final conundrum. All our calculations for the four complexes studied in this article suggest that trans dissociation kinetics is actually unable to explain the observed correlation between the experimentally-derived and LI3, because our theoretically-calculated 3TS-3MLCT is complex-independent to within the expected accuracy of our methodology. Nevertheless LI3 is positively correlated with the 3MLCT-3MC energy difference as expected from FMOT and this leads to a strong correlation between and the 3MLCT-3MC energy difference . Why? Could it be that our experimentally-derived reflects something other than kinetics? Afterall, the measured luminescence lifetimes are orders of magnitude longer than typical vibrational lifetimes. This might allow some sort of quasiequilibrium to take place. Indeed, our observations up to this point are more consistent with the hypothesis that 3MLCT states are being removed via a fast 3MLCT = 3MC equilibrium process whose equilibrium constant is roughly,
| (14) |
Hence, all other things being equal, a larger 3MLCT-3MC means a more negative value of and hence a larger ratio of 3MC product in comparison to the 3MLCT reactant, effectively removing the luminescent 3MLCT state in favor of the nonluminescent 3MC state and leading to shorter observed luminescence lifetimes which were previously interpretted in terms of larger values of . Of course, we cannot rule out the presence of other competing pathways leading to different products and transition states and hence the possibility of completing kinetics and quasiequilibria.
4 Conclusion
This may be regarded as the third in a series of articles seeking an orbital-based explanation of luminescence life-times in ruthenium(II) polypyridine complexes. Article I [13] introduced the use of the partial density of states (PDOS) for the extraction of a ligand-field theory (LFT) like picture from density-functional theory (DFT) calculations. Direct visualization of molecular orbitals (MOs) is insufficient for this purpose because the metal MOs mix heavily with ligand MOs. However the PDOS analysis allows the assignment of an energy to these orbitals in a quantitative, albeit fuzzy and both basis set and functional dependent, fashion. This allowed the investigation of on the order of 100 molecules in Article II [14] to develop an orbital-based luminescence index, called LI3, which correlated strongly with an average “activation energy” calculated from experimental luminescence lifetimes measured in solution at room temperature and liquid nitrogen temperature. The work in Articles I and II is based upon the widely assumed 3MLCT 3MC trans distortion mechanism and made use of ideas from frontier molecular orbital theory (FMOT). However it was made clear in Article II that is quite different from an accurately determined experimental 3MLCT 3MC activation energy for [Ru(bpy)3]2+, complex 6 in the present article, for which = 132 cm-1 [14], but for which experimental studies in solution gave 3800 cm-1 [16] and 3960 cm-1 depending upon the solvent and details of the analysis. The present article corrects this somewhat unsatisfactory state of affairs by carrying out calculations of the transition states (TSs) and intrinsic reaction coordinates (IRCs) for four closely related ruthenium(II) bipyridine complexes under the same conditions as used to calculate LI3 in Article II, namely gas phase calculations with the B3LYP functional and the 6-31G+LANLDZ(Ru) basis set. Our calculated 3MLCT 3MC TS barrier is 316.04 cm-1 which may be compared with the previously calculated theoretical gas phase value of 700 cm-1 [11].
It is important to note that we used the same nudged elastic band (NEB) methodology as in Ref. [11], though the basis set and functional differ, but made a more thorough investigation of our four molecules using more accurate TS and IRC searches. The result carries some surprises. For example, our NEB maximum energy point (MEP) gives a TS barrier of 553 cm-1 (closer to the 700 cm-1 value quoted in Ref. [11], particularly when considering that chemical accuracy is often quoted as 1 kcal/mol = 350 cm-1). But we realized that the NEB MEP is not sufficiently accurate for our purposes and so used specific TS optimizers and proved the correctness of our optimized TS by calculation of the IRC. Examination of Ru-N bond lengths along the IRC showed some surprising results which can only be explained by a TS corresponding to one of the ligands symmetrically lengthening its Ru-N bonds, hence going through a sort of cis TS consistent with electron transfer to a single ligand, rather than symmetrically to all three ligands. The trans dissociation then continues along a ridge and then bifurcates into one of two symmetry-equivalent minima. Once this is taken into account, not only is a lower TS barrier obtained, but a much richer and more complex description is obtained of the trans dissociation mechanism.
Returning to LI3 and the energetics of trans dissociation, we find that the 3MLCT-3MC energy correlates linearly with LI3 but that the 3TS-3MLCT is, to within the accuracy of our calculation, molecule independent. Attempts to make alternative kinetic arguments, such as by using the Bell-Evans-Polanyi postulate, only lead to ideas in contradiction with the observed relation between and LI3. This suggests that it is the total energy difference of the reaction, rather than the barrier height, which determines the luminescence lifetime. That is, we are looking at a quasielquilibrium property rather than a kinetic property. Given that the measured luminescence lifetimes are on the order of s which is much several orders of magnitude longer than a typical vibrational time, then such an assumption is not unreasonable.
Our picture of what is going on in our study is limited by it being a gas-phase study with a particular basis set and a particular functional. It is also limited by the fact that only one luminescence quenching mechanism has been studied in a family of molecules which is rich in degrees of freedom and hence also rich in dissociation mechanisms as shown by the brief review of related work given in the introduction of this article. Nevertheless we think that our work brings a new and more detailed picture of part of what could be going on in the luminescence mechanism for this important family of molecules.
Acknowledgement
DM and MEC gratefully acknowledge helpful funding from the African School on Electronic Structure Methods and Applications (ASESMA), ASESMANet, and the US-Africa Initiative. We thank the following people for insightful discussions: Ragnar Björnsson, Isabelle M. Dixon, Jean Louis Heully, Valid Mwatati, Max Daku Latévi Lawson, Sandeep Sharma. In particular, Isabelle M. Dixon is gratefully acknowledged for sharing unpublished computational results with us early on in our project. We would like to thank Pierre Girard and Sébastien Morin for technical support in the context of the Grenoble Centre d’Experimentation du Calcul Intensif en Chimie (CECIC) computers used for the calculations reported here.
Supplementary Information
Only plots for complex 70 have been used in the main article. The corresponding plots for complexes 6, 73, and 74 are available on-line:
-
1.
Contour plots
-
2.
NEB optimizations
-
3.
Converged NEB Minimum Energy Paths
-
4.
IRC Energy Profiles
-
5.
Variation of Metal-Ligand Bond Lengths Along the NEB Reaction Path
-
6.
Variation of Metal-Ligand Bond Lengths Along the IRC
-
7.
Author contributions
References
- [1] D. Magero, T. Mestiri, K. Alimi, and M. E. Casida, Computational studies of ruthenium and iridium complexes for energy sciences and progress on greener alternatives, in Green Chemistry and Computational Chemistry: Shared Lessons in Sustainability, edited by L. Mammino, pages 115–145, Elsevier, 2020, preprint: https://arxiv.org/abs/2004.03345.
- [2] J. P. Sauvage, J. Collin, J. C. Chambron, S. Guillerez, and C. Coudret, Ruthenium(II) and osmium(II) bis(terpyridine) complexes in covalently-linked multicomponent systems: Synthesis, electrochemical behavior, absorption spectra, and photochemical and photophysical properties, Chem. Rev. 94, 993 (1994).
- [3] K. Nakamaru, Synthesis, luminescence quantum yields, and lifetimes of trischelated ruthenium (II) mixed-ligand complexes including 3,3’-dimethyl-2,2’-bipyridyl, Bull. Chem. Soc. Jpn. 55, 2697 (1982).
- [4] G. Liebsch, I. Klimant, and O. S. Wolfbeis, Luminescence lifetime temperature sensing based on sol-gels and poly(acrylonitrile)s dyed with ruthenium metal-ligand complexes, Adv. Mat. 11, 1296 (1999).
- [5] V. Balzani and A. Juris, Photochemistry and photophysics of Ru (II) polypyridine complexes in the bologna group. From early studies to recent developments, Coordin. Chem. Rev. 211, 97 (2001).
- [6] M. Duati, S. Tasca, F. C. Lynch, H. Bohlen, J. G. Vos, S. Stagni, and M. D. Ward, Enhancement of luminescence lifetimes of mononuclear ruthenium(II)-terpyridine complexes by manipulation of the -donor strength of ligands, J. Inorg. Chem. 42, 8377 (2003).
- [7] A. Harriman, A. Khatyr, and R. Ziessel, Extending the luminescence lifetime of ruthenium(II) poly(pyridine) complexes in solution at ambient temperature, Dalton Trans. 10, 2061 (2003).
- [8] E. A. Medlycott and G. S. Hanan, Designing tridentate ligands for ruthenium(II) complexes with prolonged room temperature luminescence lifetimes, Chem. Soc. Rev. 34, 133 (2005).
- [9] L. J. Nurkkala, R. O. Steen, H. K. J. Friberg, J. A. Häggström, P. V. Bernhardt, M. J. Riley, and S. J. Dunne, The effects of pendant vs. fused thiophene attachment upon the luminescence lifetimes and electrochemistry of tris(2,2’-bipyridine)ruthenium(II) complexes, Eur. J. Inorg. Chem. 26, 4101 (2008).
- [10] S. Ji, W. Wu, W. Wu, P. Song, K. Han, Z. Wang, S. Liu, H. Guo, and J. Zhao, Tuning the luminescence lifetimes of ruthenium(II) polypyridine complexes and its application in luminescent oxygen sensing, J. Mater. Chem. 20, 1953 (2010).
- [11] A. Soupart, F. Alary, J. Heully, P. I. P. Elliot, and I. M. Dixon, Theoretical study of the full photosolvolysis mechanism of [Ru(bpy)3]2+: Providing a general mechanistic roadmap for the photochemistry of [Ru(NN)3]2+-type complexes toward both cis and trans photoproducts, Inorg. Chem. 59, 14679 (2020).
- [12] V. Balzani, P. Ceroni, A. Credi, and M. Venturi, Ruthenium tris(bipyridine) complexes: Interchange between photons and electrons in molecular-scale devices and machines, Coord. Chem. Rev. 433, 213758 (2021).
- [13] C. M. Wawire, D. Jouvenot, F. Loiseau, P. Baudin, S. Liatard, L. Njenga, G. Kamau, and M. E. Casida, Density-functional study of luminescence in polypyrine ruthenium complexes, J. Photochem. and Photobiol. A 276, 8 (2014).
- [14] D. Magero, M. E. Casida, G. Amolo, N. Makau, and L. Kituyi, Partial density of states ligand field theory (PDOS-LFT): Recovering a LFT-like picture and application to photoproperties of ruthenium(II) polypyridine complexes, J. Photochem. Photobiol. A 348, 305 (2017).
- [15] L. G. Vanquickenborne and A. Ceulemans, Ligand-field models and the photochemistry of coordination compounds, Coord. Chem. Rev. 48, 157 (1983).
- [16] J. V. Caspar and T. J. Meyer, Photochemistry of tris(2,2’-bipyridine) ruthenium(ii) ion ([Ru(bpy)3]2+). Solvent effects., J. Am. Chem. Soc. 105, 5583 (1983).
- [17] I. B. Bersuker, Modern aspects of the jahn-teller effect theory and applications to molecular problems, Chem. Rev. 101, 1067 (2001).
- [18] I. Krivokapic, M. Zerara, M. Lawson Daku, A. Vargas, C. Enachescu, C. Ambrus, P. Tregenna-Piggott, N. Amstutz, E. Krausz, and A. Hauser, Spin-crossover in cobalt(II) imine complexes, Coord. Chem. Rev. 251, 364 (2007).
- [19] D. C. Ashley and E. Jakubikova, Ray-Dutt and Bailar twists in Fe(II)-tris(2,2’-bipyridine): Spin states, sterics, and Fe-N bond strengths, Inorg. Chem. 57, 5585 (2018).
- [20] A. Vaidyalingam and P. K. Dutta, Analysis of the photodecomposition products of Ru(bpy) in various buffers and upon zeolite encapsulation, Anal. Chem. 72, 5219 (2000).
- [21] N. Yoshikawa, S. Yamabe, S. Sakaki, N. Kanehisa, T. Inoue, and H. Takashima, Transition states of the 3MLCT to 3MC conversion in Ru(bpy)2(phen derivative)2+ complexes, J. Mol. Struct. 1094, 98 (2015).
- [22] X. W. Zhou, P. L. Burn, and B. J. Powell, Bond fission and non-radiative decay in iridium(III) complexes, Inorg. Chem. 55, 5266 (2016).
- [23] X. W. Zhou, P. L. Burn, and B. J. Powell, Correction to “bond fission and non-radiative decay in iridium(III) complexes”, Inorg. Chem. 56, 7574 (2017).
- [24] Q. Sun, B. Dereka, E. Vauthey, L. M. L. Daku, and A. Hauser, Ultrafast transient IR spectroscopy and DFT calculations of ruthenium(II) polypyridyl complexes, Chem. Sci. 8, 223 (2017).
- [25] A. Soupart, I. M. Dixon, F. Alary, and J. Heully, DFT rationalization of the room-temperature luminescence properties of Ru(bpy) and Ru(tpy): 3MLCT-3MC minimum energy path from neb calculations and emission spectra from vres calculations, Theor. Chem. Acc. 137, 37 (2018).
- [26] A. Soupart, F. Alary, J. Heully, P. I. P. Elliott, and I. M. Dixon, Exploration of the uncharted 3PES territory for [Ru(bpy)3]2+] A new 3MC minimum prone to ligand loss photochemistry, Inorg. Chem. 57, 3192 (2018).
- [27] M. Fumanal, Y. Harabuchi, E. Gindensperger, S. Maeda, and C. Daniel, Excited-state reactivity of [Mn(im)(CO)3(phen)]+: A structural exploration, J. Comput. Chem. 40, 72 (2019).
- [28] F. Alary, J. L. Heully, L. Bijeire, and P. Vicendo, Is the 3MLCT the only photoreactive state of polypyridyl complexes?, Inorg. chem. 46, 3154 (2007).
- [29] J. Heully, F. Alary, and M. Boggio-Pasqua, Spin-orbit effects on the photophysical properties of [Ru(bpy)3]2+, J. Chem. Phys. 131, 184308 (2009).
- [30] I. M. Dixon, J. Heully, F. Alary, and P. I. P. Elliott, Theoretical illumination of highly original photoreactive 3MC states and the mechanism of the photochemistry of Ru(II) tris(bidentate) complexes, Phys. Chem. Chem. Phys. 19, 27765 (2017).
- [31] K. Müller, Reaction paths on multidimensional energy hypersurfaces, Angew. Chem. Int. Ed. Engl. 19, 1 (1980).
- [32] H. Jónsson, G. Mills, and K. W. Jacobsen, Nudged elastic band method for finding minimum energy paths of transitions, in Classical and quantum dynamics in condensed phase simulations, pages 385–404, World Scientific, 1998.
- [33] V. Ásgeirsson, B. O. Birgisson, R. Bjornsson, U. Becker, F. Neese, C. Riplinger, and H. Jónsson, Nudged elastic band method for molecular reactions using energy-weighted springs combined with eigenvector following, Journal of chemical theory and computation 17, 4929 (2021).
- [34] H. B. Schlegel, Exploring potential energy surfaces for chemical reactions: An overview of some practical methods, J. Comput. Chem. 24, 1514 (2003).
- [35] H. B. Schlegel, Geometry optimization, WIREs Comput. Mol. Sci. 1, 790 (2011).
- [36] C. Peng and H. B. Schlegel, Combining synchronous transit and quasi-Newton methods to find transition states, Israel J. Chem. 33, 449 (1993).
- [37] C. Peng, P. Y. Ayala, H. B. Schlegel, and M. J. Frisch, Using redundant internal coordinates to optimize equilibrium geometries and transition states, J. Comput. Chem. 17, 49 (1996).
- [38] A. Heyden, A. T. Bell, and F. J. Keil, Efficient methods for finding transition states in chemical reactions: Comparison of improved dimer method and partitionned rational function optimization method, J. Chem. Phys. 123, 224101 (2005).
- [39] S. M. Sharada, P. M. Zimmerman, A. T. Bell, and M. Head-Gordon, Automated transition state searches without evaluating the Hessian, J. Chem. Theory Comput. 8, 5166 (2012).
- [40] A. C. Vaucher and M. Reiher, Minimum energy paths and transition states by curve optimization, J. Chem. Theory Comput. 14, 3091 (2018).
- [41] S. Maeda, Y. Harabuchi, Y. Ono, T. Taketsugu, and K. Morokuma, Intrinsic reaction coordinate: Calculation, bifurcation, and automated search, Int. J. Quant. Chem. 115, 258 (2015).
- [42] D. H. Ess, S. E. Wheeler, R. G. Iafe, L. Xu, N. Celebi-Oelcuem, and K. N. Houk, Bifurcations on potential energy surfaces of organic reactions, Angewandte Chemie International Edition 47, 7592 (2008).
- [43] M. J. Frisch et al., Gaussian 09 Revision D.01, Gaussian Inc. Wallingford CT 2009.
- [44] F. Neese, F. Wennmohs, U. Becker, and C. Riplinger, The orca quantum chemistry program package, The Journal of chemical physics 152, 224108 (2020).
- [45] R. Ditchfield, W. Hehre, and J. A. Pople, Self-consistent molecular-orbital methods. ix. an extended gaussian-type basis for molecular-orbital studies of organic molecules, J. Chem. Phys. 54, 724 (1971).
- [46] W. J. Hehre, R. Ditchfield, and J. A. Pople, Self—consistent molecular orbital methods. xii. further extensions of gaussian—type basis sets for use in molecular orbital studies of organic molecules, J. Chem. Phys. 56, 2257 (1972).
- [47] P. J. Hay and W. R. Wadt, Ab initio effective core potentials for molecular calculations. Potentials for K to Au including the outermost core orbitals, J. Chem. Phys. 82, 299 (1985), Ab initio effective core potentials for molecular calculations. Potentials for K to Au including the outermost core orbitals.
- [48] P. J. Stephens, F. J. Devlin, C. F. Chabalowski, and M. J. Frisch, Ab initio calculation of vibrational absorption and circular dichroism spectra using density functional force fields, J. Phys. Chem. 98, 11623 (1994).
- [49] S. H. Vosko, L. Wilk, and M. Nusair, Accurate spin-dependent electron liquid correlation energies for local spin density calculations: a critical analysis, Can. J. Phys. 58, 1200 (1980).
- [50] R. A. Marcus, On the theory of oxidation-reduction reactions involving electron transfer. I, J. Chem. Phys. 24, 966 (1956).
- [51] F. Kanoufi and A. J. Bard, Electrogenerated chemiluminescence. 65. An investigation of the oxidation of oxalate by tris(polypyridine) ruthenium complexes and the effect of the electrochemical steps on the emission intensity, J. Chem. Phys. B 103, 10469 (1999).
- [52] G. F. Bertsch, Derivations of Marcus’s formula, http://www.int.washington.edu/users/bertsch/marcus.1.pdf, last accessed 6 May 2020.
- [53] K. J. Laldler and M. C. King, The development of transition-state theory, J. Phys. Chem. 87, 2657 (1983).
- [54] P. F. Barbara, T. J. Meyer, and M. A. Ratner, Contemporary issues in electron transfer research, J. Phys. Chem. 100, 13148 (1996).
- [55] R. P. Bell, The theory of reactions involving proton transfers, Proc. R. Soc. London, Ser. A 154, 414 (1936).
- [56] M. G. Evans and M. Polanyi, Further considerations on the thermodynamics of chemical equilibria and reaction rates, J. Chem. Soc., Faraday Trans. 32, 1333 (1936).