Counting Bubbles in Linear Chord Diagrams
Donovan Young
St Albans, Hertfordshire
United Kingdom
donovan.m.young@gmail.com
Abstract
In a linear chord diagram a short chord is one which joins adjacent vertices. We define a bubble to be a region in a linear chord diagram devoid of short chords. We derive a formal generating function counting bubbles by their size and find an exact result for the mean bubble size. We find that once one discards diagrams which have no short chords at all, the distribution of bubble sizes is given by a smooth function in the limit of long diagrams. Using a summation over short chords, the exact form of this asymptotic distribution is found.
1 Introduction and basic notions
A linear chord diagram consists of a linear arrangement of vertices. Each vertex is joined to exactly one different vertex by an unoriented arc called a chord. Hence every linear chord diagram on vertices has exactly chords. As the chords are distinguished only by the positions of their endpoints, it is evident that there are different linear chord diagrams on vertices.
One interesting way of refining this counting111The combinatorics of linear chord diagrams has a long history begininng with Touchard [7] and Riordan’s [5] studies of the number of chord crossings; cf. Pilaud and Rué [4] for a modern approach and further developments. Krasko and Omelchenko [2] provide a more complete list of references. is by the number of so-called short chords, i.e. chords which join adjacent vertices. Kreweras and Poupard [3] provided recurrence relations and closed form expressions for the number of diagrams with exactly short chords. They also showed that the mean number of short chords is , which implies that the total number of short chords is equinumerous with the total number of linear chord diagrams, cf. [1]. Kreweras and Poupard [3] showed further that all higher factorial moments of the distribution approach in the limit, thus establishing the Poisson nature of the asymptotic distribution.

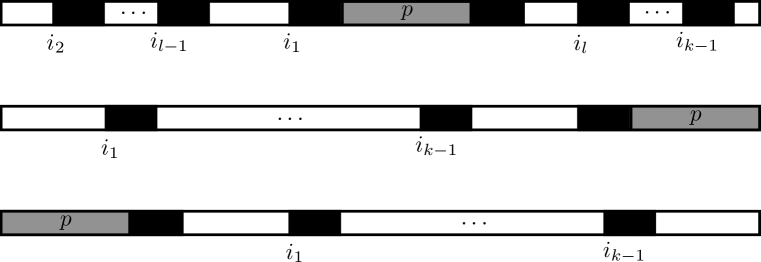
In this paper we will be concerned with counting certain sets of adjacent vertices of a linear chord diagram. We call these sets bubbles. The vertices of a given bubble may be joined by chords to one another or to vertices outside, but (in either case) never via a short chord. A bubble is therefore bounded either by short chords or by the ends of the diagram, see Figure 1. The size of a bubble is defined as the number of vertices it has, and may generically take on any value from 1 to , or, in the case of a linear chord diagram devoid of short chords, .
Let the total number of bubbles of size found among linear chord diagrams on vertices be given by . Table 1 shows the values of for .
| \ | 1 | 2 | 3 | 4 | 5 | 6 | 7 | 8 | 9 | 10 | 11 | 12 |
|---|---|---|---|---|---|---|---|---|---|---|---|---|
| 1 | 0 | 0 | ||||||||||
| 2 | 2 | 0 | 0 | 1 | ||||||||
| 3 | 8 | 4 | 2 | 2 | 0 | 5 | ||||||
| 4 | 42 | 30 | 20 | 15 | 12 | 10 | 0 | 36 | ||||
| 5 | 300 | 240 | 186 | 147 | 120 | 99 | 82 | 72 | 0 | 329 | ||
| 6 | 2730 | 2310 | 1920 | 1605 | 1356 | 1155 | 988 | 848 | 730 | 658 | 0 | 3655 |
Because a single diagram can consist of many bubbles, we note that the row-sums are generically greater than the total number of linear chord diagrams .
2 Enumeration of bubbles
The present author [8] developed a technique for computing generating functions which count linear chord diagrams refined by short chords. We begin with the matching (or rook) polynomial for the path of length , which is generated by
where is the matching polynomial for the path consisting of vertices. A bubble is bounded to the left and right by short chords (or the ends of the diagram), thus we define the following generating function
The central factor corresponds to the bubble being counted, whereas the two factors of correspond to the remainder of the diagram, to the left and to the right of the bubble; the presence of corresponds to the short chords bounding the bubble. In the expansion of , each power of corresponds to a vertex of the linear chord diagram. Those vertices belonging to the bubble under consideration are further labelled with a power of , while any vertex not part of a short chord is also labelled with a power of . Armed with this aggregate generating function for the matching polynomial, we calculate the generating function which counts bubbles as follows. Let be the number of -edge matchings on the vertices marked with and let be the number of these vertices, then
| (1) |
counts the number of configurations with no short chords on the vertices in question. The present author [8, Proposition 5] explains this argument, based on inclusion-exclusion, in detail in that publication.
Theorem 1.
The generating function which counts the numbers is given by:
Proof.
A generic term in the expansion of (which survives the contour integration) will have the form
where are the aforementioned matching numbers. The third factor follows from the fact that is an even function of . The expansion of the exponential in will contribute only the term of order , as the contour integration in will eliminate all other terms. This mechanism also forces the power of to be even, and accounts for the even power of in the first factor. We note that
and that
and so together they give the factor as required by Equation (1). ∎
Corollary 2.
The generating function is given by:
Proof.
This is established by evaluating the contour integral over from Theorem 1. We begin with a simplified expression for :
We therefore have two poles: a simple pole at , and a pole of order two at . Computing the residues at these poles we find, through direct calculation, the result for . ∎
Lemma 3.
The total number of bubbles, counted across all linear chord diagrams on vertices is given by
Proof.
We use Corollary 2 and set :
where in the second line we have used the expansion of the exponential. Our result is then obtained by reading off the coefficient of :
∎
Lemma 4.
The un-normalised first moment of bubble size is given by:
Proof.
We use Corollary 2 and take a derivative with respect to :
where we have used the expansion of the exponential before integrating over . Our result is then obtained by reading off the coefficient of :
∎
Theorem 5.
The mean bubble size , taken over all bubbles on linear chord diagrams consisting of vertices, is given by:
3 Asymptotic distribution
The values for follow a smooth distribution in the limit , the form of which we shall discover in this section. It is therefore natural to discard the penultimate and final entries in Table 1, and to view the configurations consisting of a single bubble of size as part of a different counting problem. Before we do this, however, we note that the result of Theorem 5 implies that the asymptotic value of the mean bubble size is
To see how this arises, we remind the reader that Kreweras and Poupard [3] proved that the number of short chords is asymptotically Poisson distributed with mean . To leading order, the presence of short chords induces bubbles. This implies
| (2) |
where counts the total number of linear chord diagrams consisting of chords. Since the distribution of the positions of these short chords is asymptotically uniform, the mean size of any given bubble is asymptotically . The overall mean bubble size is then
| (3) |
We now turn our attention to the asymptotic distribution of bubble sizes, not including the values . The mean of this distribution can be obtained by subtracting the contribution of the bubble of size as follows:
| (4) |
Theorem 6.
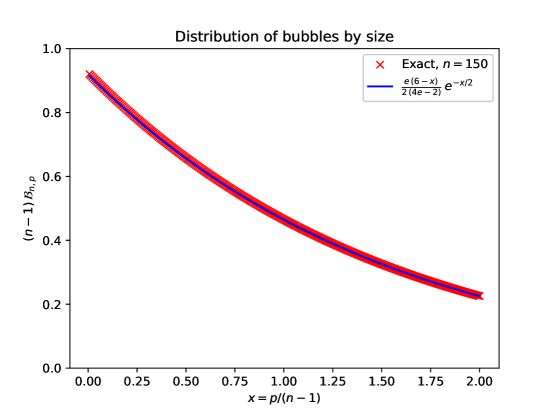
Let denote the size of a bubble and let . The asymptotic distribution of the size of bubbles, excluding diagrams which are themselves bubbles, is given for by:
Proof.
We begin by noting that as is taken to infinity it is rare, amongst all linear chord diagrams, for a short chord to be found nested directly inside of another chord. Specifically, if are the positions of consecutive vertices, and are joined by a short chord, then it is unlikely that will also be joined by a chord. To see this consider the diagrams with exactly one short chord on vertices. If one then inserts an additional short chord into any one of these diagrams (to thus produce a diagram on vertices), then there are possible positions for it, only one of which will produce the nested configuration.
To leading order we may therefore consider a bubble to be constructed by the existence of some short chords (at least one). We then consider the vertices not participating in these short chords to constitute a (shorter) diagram devoid of short chords. The number of diagrams on vertices devoid of short chords is given asymptotically, according to the Poisson distribution, by , and thus .
Starting with a diagram devoid of short chords on vertices, where is order 1, we add short chords to produce a diagram on vertices. We may use one of these short chords (in conjunction with the end of the diagram), or two of them, to bound a bubble of size (which we take to be order ), see Figure 2. In the former case there are indistinguishable short chords whose positions must be summed over. In the latter, the complex consisting of the bubble and its two bounding chords must have its position summed over, in addition to the remaining indistinguishable chords. We therefore have the following asymptotic count for the number of bubbles of size :
where we have used the relation once, and then more times to express in terms of . We recall from Equation (4) that
and using , we therefore find:
where we have summed over from 1 to infinity. ∎
It is trivial to verify that the mean of gives the result from Equation (4). In Figure 3 we have plotted the exact data for against .
References
- [1] N. T. Cameron and K. Killpatrick, Statistics on linear chord diagrams, Discrete Math. Theor. Comput. Sci. 21 (2019) #11. Available at https://dmtcs.episciences.org/6038/pdf.
- [2] E. Krasko and A. Omelchenko, Enumeration of chord diagrams without loops and parallel chords, Electron. J. Combin. 24 (2017), Article P3.43.
- [3] G. Kreweras and Y. Poupard, Sur les partitions en paires d’un ensemble fini totalement ordonné, Publications de l’Institut de Statistique de l’Université de Paris 23 (1978), 57–74.
- [4] V. Pilaud and J. Rué, Analytic combinatorics of chord and hyperchord diagrams with crossings, Adv. Appl. Math. 57 (2014), 60–100
- [5] J. Riordan, The distribution of crossings of chords joining pairs of points on a circle, Math. Comp. 29 (1975), 215–222.
- [6] N. J. A. Sloane et al., The on-line encyclopedia of integer sequences, 2020. Available at https://oeis.org.
- [7] J. Touchard, Sur un problème de configurations et sur les fractions continues, Canad. J. Math. 4 (1952), 2–25.
- [8] D. Young, Linear -chord diagrams, J. Integer Sequences 23 (2020), Article 20.9.1.
2010 Mathematics Subject Classification: Primary 05A15; Secondary 05C70, 60C05.
Keywords: chord diagram, perfect matching.
(Concerned with sequences A367000.)