BASS XLII: The relation between the covering factor of dusty gas and the Eddington ratio in nearby active galactic nuclei
Abstract
Accreting supermassive black holes (SMBHs) located at the center of galaxies are typically surrounded by large quantities of gas and dust. The structure and evolution of this circumnuclear material can be studied at different wavelengths, from the submillimeter to the X-rays. Recent X-ray studies have shown that the covering factor of the obscuring material tends to decrease with increasing Eddington ratio, likely due to radiative feedback on dusty gas. Here we study a sample of 549 nearby () hard X-ray (14–195 keV) selected non-blazar active galactic nuclei (AGN), and use the ratio between the AGN infrared and bolometric luminosity as a proxy of the covering factor. We find that, in agreement with what has been found by X-ray studies of the same sample, the covering factor decreases with increasing Eddington ratio. We also confirm previous findings which showed that obscured AGN typically have larger covering factors than unobscured sources. Finally, we find that the median covering factors of AGN located in different regions of the column density-Eddington ratio diagram are in good agreement with what would be expected from a radiation-regulated growth of SMBHs.
1 Introduction
Supermassive black holes (SMBHs) that accrete copious amounts of gas and dust from their surroundings can emit throughout the whole electromagnetic spectrum, and are observed as Active Galactic Nuclei (AGN). The material responsible for most of the AGN obscuration is widely believed to be anisotropically distributed, possibly in the form of a torus, as predicted by the classical AGN unification model (Antonucci, 1993; Urry & Padovani, 1995; Netzer, 2015; Ramos Almeida & Ricci, 2017; Hickox & Alexander, 2018). This obscuring material can be studied in the X-ray band in absorption (e.g., Awaki et al., 1991; Ueda et al., 2003; Merloni et al., 2014; Ricci et al., 2015) and/or through spectral features (e.g., Lightman & White, 1988; Pounds et al., 1990; Matt et al., 1991), in the infrared (IR) from the radiation produced by reprocessing of the UV/optical and X-ray radiation in circumnuclear dust (e.g., Krolik & Begelman, 1988; Granato & Danese, 1994; Jaffe et al., 2004a; Elitzur, 2008; Gandhi et al., 2009; Ramos Almeida et al., 2011; Alonso-Herrero et al., 2011; Lanz et al., 2019; Gámez Rosas et al., 2022), or at millimeter wavelengths from dust continuum and molecular line emission (e.g., Impellizzeri et al., 2019; García-Burillo et al., 2019, 2021; Imanishi et al., 2020; Tristram et al., 2022). Understanding the structure and evolution of the gas and dust surrounding these accreting SMBHs is extremely important, because this is likely to be the reservoir of material that eventually accretes onto SMBHs. Moreover, being located in the inner regions of the accreting system, this material could carry imprinted signatures of AGN feedback (e.g., Fabian et al., 2006; Ricci et al., 2017a), which is thought to play an important role in the evolution of galaxies (e.g., Kormendy & Ho, 2013; Harrison, 2017 and references therein).
One of the main parameters of the obscuring material surrounding the SMBH is its covering factor (e.g., Lawrence & Elvis, 2010), i.e. the fraction of the SMBH sky that is obscured, which can be inferred using the following techniques in the X-rays, optical and IR:
i) In X-ray surveys using the fraction of obscured sources (; e.g., Ueda et al., 2003, 2014; La Franca et al., 2005; Hasinger, 2008; Merloni et al., 2014), i.e. the fraction of AGN with column densities . According to the unification model, different objects would probe different inclination angles with respect to the torus. Therefore, if the sample has a high completeness level, then the fraction of sources within a certain range of column densities is a proxy of the mean covering factor of the obscuring material with that column density. Alternatively, the fraction of AGN optically classified as type-1 (i.e., showing both broad permitted and narrow forbidden optical lines) and type-2 (displaying only narrow lines) can also be used to infer the covering factor of the obscuring material (e.g., Lawrence & Elvis, 1982; Simpson, 2005; Toba et al., 2013; Oh et al., 2015). However, a possible source of uncertainty related to this approach is the existence of a fraction of AGN which are optically dull (e.g., Smith et al., 2014; Georgantopoulos & Georgakakis, 2005; Koss et al., 2017), and of unobscured sources in which the optical broad lines are too faint or broad to be detected (e.g., Bianchi et al., 2017).
ii) From the ratio between the IR and the bolometric AGN luminosity. Considering that a significant fraction of the IR emission in AGN is produced by dust reprocessing, it has been argued that the fraction of bolometric luminosity () re-emitted in the IR is directly proportional to the covering factor of the obscuring material (e.g., Maiolino et al., 2007; Treister et al., 2008; Gandhi et al., 2009; Assef et al., 2013; Netzer et al., 2016; Toba et al., 2021). However, a detailed study carried out using radiative transfer simulations of dusty tori (Stalevski et al., 2016) has shown that the relation between the covering factor and the ratio between the IR and bolometric AGN luminosity is significantly more complex than previously believed (see §3).
iii) From torus models applied to the mid-IR spectral energy distribution (SED) of individual AGN. Several IR torus models have been developed in the past decade (Hönig et al., 2006; Schartmann et al., 2008; Hönig & Kishimoto, 2010; Hönig et al., 2010; Hönig & Kishimoto, 2017; Stalevski et al., 2012, 2016; Siebenmorgen et al., 2015), and can be used to recover some of the properties of the dust surrounding SMBHs, including its covering factor. Works carried out using torus models such as clumpy (Nenkova et al., 2008a, b; Nikutta et al., 2009), cat3d (Hönig & Kishimoto, 2010) and cat3d-wind (Hönig & Kishimoto, 2017) have been applied to a significant number of AGN (e.g., Mor et al., 2009; Alonso-Herrero et al., 2011, 2021; Ramos Almeida et al., 2011; Ichikawa et al., 2015; Zhuang et al., 2018; González-Martín et al., 2019; García-Bernete et al., 2019, 2022). For one of the closest AGN, the Circinus Galaxy, it has been possible to infer the covering factor by modelling both spectroscopic and high-resolution morphological data (Stalevski et al., 2017, 2019).
iv) Applying torus models to the broad-band X-ray spectra of AGN. X-ray torus models (e.g., Murphy & Yaqoob, 2009; Brightman & Nandra, 2011; Liu & Li, 2014; Paltani & Ricci, 2017; Baloković et al., 2018; Tanimoto et al., 2019; Buchner et al., 2021; Ricci & Paltani, 2023), some of which now include the effect of dusty gas in the X-rays (Ricci & Paltani, 2023; Vander Meulen et al., 2023), allow us to infer the covering factor of the gas and dust surrounding the SMBH. This has been particularly effective in the past years using NuSTAR observations (e.g., Brightman et al., 2015; Zhao et al., 2020; Tanimoto et al., 2020; Ogawa et al., 2019, 2021; Yamada et al., 2021; Uematsu et al., 2021; Inaba et al., 2022; Andonie et al., 2022), since its large energy coverage ( keV) allows for the detection of both main features produced by reprocessed X-ray radiation: the Fe K line (6.4 keV) and the Compton hump ( keV).
A relation between the torus covering factor and the AGN luminosity was originally found by the decrease in the fraction of type-2 AGN with the luminosity (Lawrence & Elvis, 1982; Lawrence, 1991). Studies of X-ray (e.g., Ueda et al., 2003, 2014; Treister & Urry, 2005, 2006; Sazonov et al., 2007; Della Ceca et al., 2008; Hasinger, 2008; Beckmann et al., 2009; Ueda et al., 2011; Merloni et al., 2014; Buchner et al., 2015) and IR (e.g., Maiolino et al., 2007; Treister et al., 2008; Gandhi et al., 2009; Assef et al., 2013; Lusso et al., 2013; Toba et al., 2014; Lacy et al., 2015; Stalevski et al., 2016; Mateos et al., 2016; Ichikawa et al., 2017) surveys, as well as IR studies carried out by applying torus models (e.g., Mor et al., 2009; Alonso-Herrero et al., 2011) have confirmed this trend. The relationship between the covering factor of the obscuring material and the luminosity has been shown to be related to the intrinsically different luminosity functions of obscured and unobscured AGN (e.g., Tueller et al., 2008; Della Ceca et al., 2008; Burlon et al., 2011), and that it can reproduce the decrease of the Fe K intensity with luminosity (Ricci et al., 2013, see also Iwasawa & Taniguchi, 1993; Bianchi et al., 2007; Ricci et al., 2014; Boorman et al., 2018; Matt & Iwasawa, 2019). Recently, it has been shown that the main driver of this correlation could be the Eddington ratio (Ricci et al., 2017a, 2022a, see also Ezhikode et al., 2017; Buchner & Bauer, 2017; Ananna et al., 2022a), with radiation pressure on dusty gas (e.g., Fabian et al., 2006; Venanzi et al., 2020) likely responsible for the decrease of the covering factor with increasing mass-normalized accretion rates. Here we complement our previous X-ray studies (Ricci et al., 2017a, 2022a) by analyzing the relation between the dust covering factor, obtained by comparing IR to bolometric luminosities, and the Eddington ratio for sources from the BAT AGN Spectroscopic survey (BASS111www.bass-survey.com, Koss et al., 2017, 2022a; Ricci et al., 2017b). Throughout the paper we adopt standard cosmological parameters (, , ).
2 Sample and Data
Our sample is composed of objects from the BASS survey. BASS is studying in detail the multi-wavelength properties of AGN detected by the Burst Alert Telescope (BAT, Barthelmy et al., 2005), on board the Neil Gehrels Swift Observatory (Gehrels et al., 2004), with the goal of improving our understanding of the properties of accreting SMBHs in the local Universe (). Swift/BAT operates in a band (14–195 keV) that is not significantly affected by obscuration up to column densities (e.g., Fig. 1 in Ricci et al., 2015, see also Koss et al., 2016), thus providing an almost unbiased view of local AGN. Swift/BAT has detected 733 non-blazar AGN in the first 70-months of operations (Baumgartner et al., 2013; Ricci et al., 2017b), and our initial sample consists of the 731 sources for which X-ray spectroscopy was available. The intrinsic 14–150 keV AGN luminosities () and their column densities are taken from Ricci et al. (2017b), which reports the broadband (0.3–150 keV) X-ray spectral properties of the AGN from the Swift/BAT 70-month catalog. The 1-1000 m luminosity of the torus (), necessary to estimate its covering factor (§3), was calculated from the 12 m AGN luminosity () reported in Ichikawa et al. (2019), using a correction factor of (i.e., ), based on the model of Stalevski et al. (2016). The AGN IR luminosities of Ichikawa et al. (2019) were obtained by the spectral decomposition of the IR SED, considering both AGN and host galaxy emission using decompir (Mullaney et al., 2011), and are shown to be in good agreement with the luminosities obtained by high-spatial-resolution IR studies (e.g., Asmus et al., 2014, see Fig. 11 of Ichikawa et al., 2019). Ichikawa et al. (2019) report IR luminosities for 587 non-blazar AGN, of which 21 only have upper limits, since their IR SED is dominated by other physical processes, such as star formation.
The black hole masses () for the sources of the BASS sample are listed in Koss et al. (2017) and Koss et al. (2022b), who reported black hole masses for 790 AGN from the Swift/BAT 70-month catalog (Baumgartner et al., 2013). For unobscured AGN black hole masses were mostly estimated using broad H and H lines, while for obscured objects we used black hole masses mostly estimated with velocity dispersion (see Koss et al., 2022b, c for details). Similarly to what was done in Ricci et al. (2017a), we excluded the objects with for which was obtained using broad H and H, since the black hole masses are likely underestimated because of the extinction of the optical emission (e.g., Ricci et al., 2022b; Mejía-Restrepo et al., 2022). Cross-matching the 587 AGN with available with those for which we have we obtain a final sample of 549 objects, of which 289 are unobscured [] and 260 are obscured [] AGN. For 19 of these objects, only an upper limit on is available.
For all objects in our final sample, the intrinsic 14–150 keV and 12 m luminosities were calculated using the redshifts and redshift-independent distances reported in Koss et al. (2022b). We calculated the Eddington ratio from the Eddington luminosity: , where is the gravitational constant, is the mass of the proton, is the speed of light, and is the Thomson cross-section. The bolometric luminosity was calculated by either adopting the -dependent 2–10 keV bolometric corrections of Vasudevan & Fabian [2007; ], or considering a 14–150 keV bolometric correction of (). The latter is equivalent to a 2–10 keV bolometric correction of (Vasudevan & Fabian, 2007) for an X-ray photon index of , consistent with the typical value of Swift/BAT AGN (Ricci et al., 2017b). The -dependent 2–10 keV bolometric corrections of Vasudevan & Fabian were implemented as in Ricci et al. (2017a), considering for , for , and follow over the range . To also consider objects for which only an upper limit in is available, all medians were calculated with the Kaplan-Meier estimator within the asurv package (Feigelson & Nelson, 1985; Isobe et al., 1986), using a python implementation (see §5 in Shimizu et al., 2016 for details). We also verified our results using other python implementation of the survival analysis approach, such as scikit-survival (Pölsterl, 2020).
3 The covering factor of dust
While most studies carried out in the past decade have used
| (1) |
as a direct proxy of the covering factor of the circumnuclear dust (CF), Stalevski et al. (2016) have shown that the covering factor of the torus is not directly proportional to ; instead, it is related by a more complex function due to the radiative transfer effects. In particular, Stalevski et al. (2016) illustrated how the anisotropic emission of both the accretion disk and the dusty torus plays a strong role in the relation between and . The authors showed that overestimates high covering factors and underestimates low covering factors for unobscured AGN, while always underestimating the covering factors for obscured sources. Stalevski et al. (2016) provide corrections to take all of these effects into account (see Table 1 of their paper). These corrections do not yet take into account the effect of the SMBH spin, which could also change the radiation pattern of the accretion flow (e.g., Campitiello et al., 2018; Ishibashi et al., 2019). Here we will focus on the dust covering factors obtained by applying the corrections suggested by Stalevski et al. (2016). These corrections are given in the form of polynomials of , and depend on the optical depth of the silicate feature (), and whether the disk and the torus are misaligned. For pole-on (i.e., unobscured) objects, the covering factor of the dust is given by
| (2) |
while for edge-on (i.e., obscured) AGN
| (3) |
We considered here and, following the prescriptions of Stalevski et al. (2016) we set the maximum value of the ratio between the torus and bolometric AGN luminosity () to 1.3 for unobscured objects and for obscured AGN. In the following we will use the dust covering factors obtained from Eqs.2 and 3. We also tested the scenario in which the torus and the disk are misaligned (with ), in which case for unobscured objects was set to 1.5 and 1.6, for an inclination of the disk with respect to the torus of and , respectively. We found that this does not significantly affect any of the results reported here.

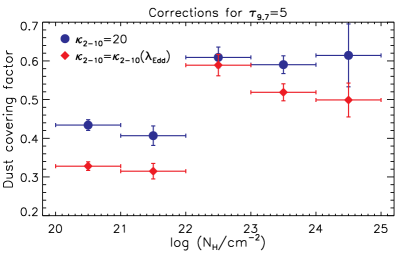
The median dust covering factors obtained using the approach described above are and for and , respectively. Interestingly, as observed in Ichikawa et al. (2019), these values are significantly lower than the covering factor obtained by X-ray observations for the same sample (, Ricci et al., 2015, 2017a). This difference could be associated with obscuration from the broad line region (e.g., Davies et al., 2015; Ichikawa et al., 2019) or from dust-free gas associated with outflows produced by the AGN. In Fig. 1 we show the dust covering factor of BASS AGN versus the column density inferred by X-ray observations by considering fixed bolometric corrections (blue circles) or Eddington ratio-dependent bolometric corrections (red diamonds). In both cases, the dust covering factor of the obscuring material in an unobscured AGN is times lower than for an obscured AGN. This is in agreement with previous studies carried out by applying a torus model to the IR emission of nearby AGN (e.g., Ramos Almeida et al., 2011). As proposed by Elitzur (2012), this could be explained simply by the fact that AGN in which the covering factor of the obscuring material is large are more likely to be observed as obscured/type-2, due to the larger fraction of obscured lines-of-sight.
3.1 The dependence of the covering factor on the Eddington ratio
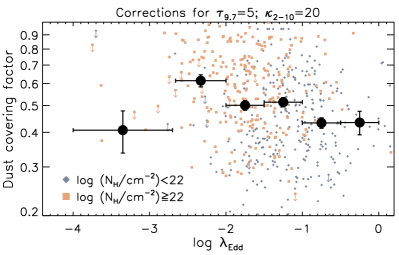
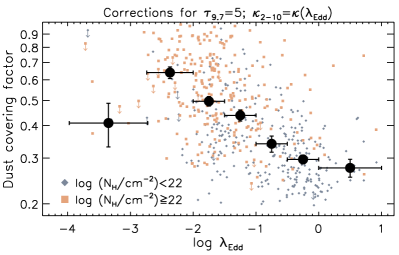
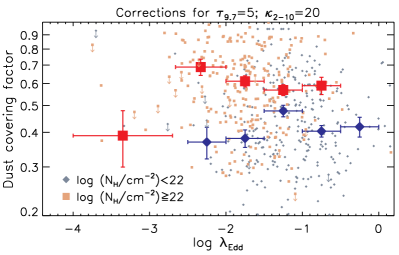
In Fig. 2 we illustrate the dust covering factor versus the Eddington ratio for the sources of our sample. This was done considering (left panels) and (right panels). In the top panels we show the median values of the dust covering factor for the whole sample (large black circles), while in the bottom panels we illustrate the median values for obscured (large red squares) and unobscured (large blue diamonds) AGN. The medians were calculated considering the upper limits, as outlined in §2. In both cases, we find a decrease of the covering factor with the Eddington ratio for AGN with , which is steeper when considering the -dependent bolometric corrections of Vasudevan & Fabian (2007). The decrease starts at , similar to what was observed for the covering factor inferred from the fraction of obscured sources (Ricci et al., 2017a, 2022a). The bottom figures show that obscured AGN tend to have larger covering factors than unobscured AGN, as discussed in §3, regardless of their Eddington ratio. When assuming a fixed bolometric correction (), the relation between the dust covering factor and for all AGN is mostly driven by the difference in covering factor between obscured and unobscured AGN, and the fact that unobscured AGN are mostly found at higher Eddington ratios (Ricci et al., 2017a). On the other hand, when assuming -dependent bolometric corrections, one can observe a clear decrease of the dust covering factor with also for obscured and unobscured AGN. It should be noted that there is an inherent dependence on the choice of bolometric correction in the values of the covering factor, since they are a function of the ratio between the IR AGN luminosity and the bolometric luminosity. However, a recent study focused on a sample of unobscured BASS AGN with simultaneous X-ray and optical/UV observations has shown that the Eddington ratio is the main driver of the bolometric corrections (Gupta et al. in prep.). To ensure the robustness of our results we tested two additional bolometric corrections: the luminosity-dependent bolometric corrections from Lusso et al. (2012) and the more recent formulation of the Eddington-ratio dependent bolometric corrections from Gupta et al. (in prep.). In both cases we recover trends very similar to those presented here by assuming the bolometric corrections of Vasudevan & Fabian (2007), with two differences: i) a flatter decrease with for the obscured AGN population when considering the bolometric corrections from Lusso et al. (2012); ii) slightly higher covering factors when using the Gupta et al. (in prep.) bolometric corrections (). Similar to what we found using (Ricci et al., 2017a), and regardless of the choice of the bolometric correction, we see a decrease in the covering factor at low Eddington ratios, which could be associated with an evolutionary sequence of AGN in the plane (Ricci et al., 2022a; see §3.3).
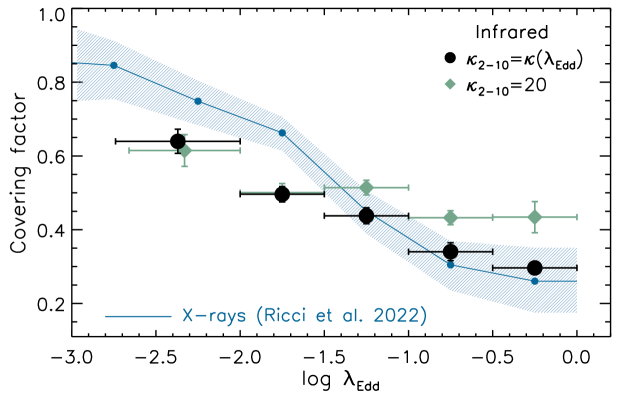
In Ricci et al. (2017a, 2022a), we have shown that the main driver of the covering factor of the Compton-thin obscuring material is the Eddington ratio, and that above the effective Eddington limit for dusty gas () with [, see Fabian et al., 2006, 2008, 2009; Arakawa et al., 2022] most AGN are unobscured. The effective Eddington limit is given by the ratio between the Thomson cross section () and the effective cross section of the interaction (), i.e. . The value of depends on the physical properties of the material and is typically , which implies that . For the obscuring material is expected to be expelled by radiation pressure, and dusty outflows would be expected to populate the polar region of the system (see §3.2). Results consistent with those reported in Ricci et al. (2017a) were also obtained using the ratio between the Eddington ratio distribution functions of obscured and unobscured Swift/BAT AGN (Ananna et al., 2022b, a), and by using the results of broad-band X-ray spectroscopy (e.g., Zhao et al., 2020, see also Ogawa et al., 2021) after fixing the inclination angle with respect to the torus to the value obtained from careful modeling of the narrow-line region (Fischer et al., 2013).
In Fig. 3 we illustrate the dust covering factors versus obtained in the infrared (black circles and green diamonds) together with the covering factor obtained in the X-rays by the recent study of Ricci et al. (2022a) (blue line). There is generally a rather good agreement between the values obtained in the IR (for dusty gas) and in the X-rays (for dust-free and dusty gas). The slightly less steep trend observed in the IR might be ascribed to the fact that as one moves toward higher the dust expelled by radiation pressure would still contribute to the IR emission in the form of a polar component (see also García-Bernete et al., 2019; Toba et al., 2021). The relation between the covering factor and implies that, in addition to the inclination angle (), the observational classification of AGN into obscured and unobscured is driven by the Eddington ratio, in what was defined as the radiation-regulated unification model (Ricci et al., 2017a). If the filling factor of the obscuring clouds is large, the half-opening angle of the torus for a given value of can be deduced from , where is the fraction of all obscured sources (i.e. both Compton-thin and Compton-thick). In this scheme, a source will be unobscured if the inclination angle is smaller than the half-opening angle of the torus [], while it will be obscured if .
3.2 Dusty outflows and polar dust
Over the past few years, interferometric studies (Jaffe et al., 2004b; Wittkowski et al., 2004; Tristram et al., 2007; Raban et al., 2009; Hönig et al., 2012, 2013; Burtscher et al., 2013; López-Gonzaga et al., 2014; Tristram et al., 2014; López-Gonzaga et al., 2016; Isbell et al., 2022; Gámez Rosas et al., 2022) and high-spatial resolution observations carried out by 8-10 m telescopes (Asmus et al., 2016; García-Bernete et al., 2016) have shown that a significant fraction of the mid-IR emission of AGN is elongated in the polar direction, and models including a disk and a wind can reproduce the near- to mid-IR properties of local AGN (Hönig & Kishimoto, 2017). The elongated mid-IR emission, which is thought to originate in a hollow cone (e.g., Stalevski et al., 2017, 2019), could be related to dusty outflows arising at (e.g., Hönig et al., 2012; Venanzi et al., 2020; Tazaki & Ichikawa, 2020). Such outflows could also be associated to larger-scale winds observed in AGN (e.g., Kakkad et al., 2016; Rojas et al., 2020; Stacey et al., 2022; Musiimenta et al., 2023).
Consistent with the idea that radiation pressure is responsible for the extended IR emission in AGN, the Eddington ratio of the objects currently known to show polar mid-IR emission is typically rather high. Some of the sources where polar dust was observed, such as Circinus (Tristram et al., 2014), NGC 424 (Hönig et al., 2012), NGC 1068 (López-Gonzaga et al., 2014) are among the obscured AGN with the highest Eddington ratio in our sample (see also Leftley et al., 2019), and several of them lie in the forbidden region of the diagram. Indeed, Alonso-Herrero et al. (2021) found that AGN with polar mid-IR (MIR) emission show intermediate column densities [] and Eddington ratios ( to ). García-Bernete et al. (2022) fitted the IR spectra of nearby AGN from the Swift/BAT sample and found that AGN that are best reproduced by models that include a polar dust component typically have (see also González-Martín et al., 2019). Yamada et al. (2023) showed, for a sample of nearby AGN undergoing mergers that the contribution of the polar component to the IR AGN luminosity increases for (see their Fig. 21). However, it should be noted that the forbidden region is defined for the line-of-sight column density , so even sources accreting at might be in the process of expelling some material if, for some inclination angles, the clouds surrounding the SMBH have column densities [] lower than the value inferred for the line-of-sight, and such that .
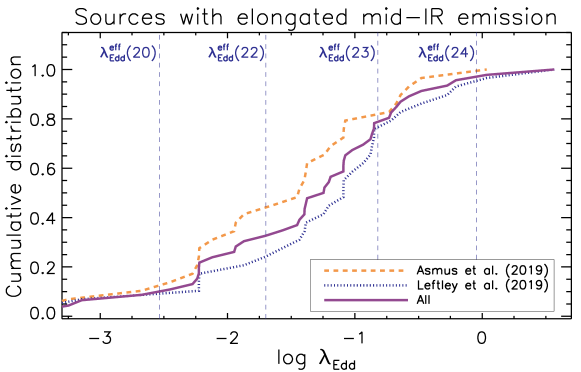
In Figure 4 we illustrate the cumulative Eddington ratio distribution of sources showing mid-IR polar emission from interferometric (Leftley et al., 2019, dotted blue line) and high-resolution single dish observations (Asmus, 2019, dashed orange line), most of which are part of our Swift/BAT-selected sample. Interestingly, all of the sources showing elongated mid-IR emission are accreting above the Eddington limit for dusty gas with , and more than half of them () at . A possible caveat of these studies is that we might preferentially detect extended IR emission in AGN with higher luminosities and Eddington ratios because of the stronger contrasts with respect to the host galaxy, whose emission could hide extended IR emission at low accretion rates.
3.3 Radiation-regulated SMBH growth
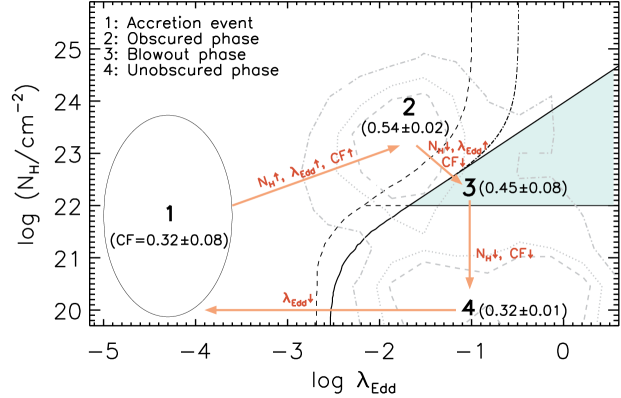
As argued by Ricci et al. (2017a), the radiation-regulated unification model could be dynamic, with AGN moving in the diagram during their lifetime (see also Jun et al., 2021; Toba et al., 2022). Ricci et al. (2022a) showed that the breaks observed in both the Eddington ratio distribution function and the luminosity function (Ananna et al., 2022b) correspond to the and at which AGN transition from having most of their sky covered by absorbing material to having most of their sky devoid of obscuring material (see Fig. 4 of . Ricci et al., 2022a ). This implies that the majority of the SMBH growth at happens when most of the AGN is covered by gas and dust, and that AGN accreting above the Eddington limit for dusty gas are rarer. Ricci et al. (2022a) proposed that this could be related to the lower amount of material available to feed the SMBH when the AGN is accreting very rapidly, due to the depletion of the gas reservoir caused by radiation pressure, and that AGN could move in the plane during their life cycle (see Fig. 5). In this picture SMBHs start their growth phase at low in a mostly unobscured phase (stage 1). As the fuel moves toward the supermassive black hole, , and the covering factor would gradually increase, leading the source to be preferentially observed as obscured by observers with random inclination angles (stage 2). Once the AGN would start expelling the obscuring material (stage 3), which would lead to a decrease in both its covering factor and typical , and the source would be preferentially observed as an unobscured AGN (stage 4). This last phase is expected to be rather short, and to last Myr (Ananna et al., 2022a; assuming an AGN lifetime of yr). Once the AGN accretes the rest of the material, it will move towards low Eddington ratios again (stage 1). Interestingly, studying ALMA observations of 19 nearby AGN, García-Burillo et al. (2021) recently found a tentative decline of the average molecular gas surface density and H2 column density for increasing Eddington ratios. They interpreted this, and the presence of molecular deficits on nuclear scales, as a signature of AGN feedback, and possibly an evolutionary sequence of AGN for increasing luminosities and Eddington ratios, similar to that proposed by Ricci et al. (2017a) and Ricci et al. (2022a).
Using the dust covering factor we estimated from IR luminosities, we can test this model and, in particular, check whether the typical covering factors change from stage 1 to stage 4. To do this, we used the bolometric corrections of Vasudevan & Fabian, 2007, and divided the into different regions. For stage 1, we considered all objects with , while for stage 2, we used all obscured AGNs with , using the original definition of Fabian et al. (2009; black solid curve in Fig. 5). For stage 3 we considered all obscured AGNs in the blowout region (green area in Fig. 5): . Finally, for stage 4 we used all unobscured AGNs with [i.e. a value corresponding to ]. The median covering factors we obtain agree well with the expected general trends: it is the lowest in stage 1 (), it increases by a factor two in stage 2 (), for then decreasing, likely due to the effect of radiation pressure, in stage 3 () and stage 4 (). It should be stressed that in stage 1 the covering factors could actually be lower than what was inferred here due to our AGN selection, which is missing AGN that accrete at very low Eddington ratios (). In fact, besides showing little absorption (see also She et al., 2018), AGN accreting at very low also typically display faint reflection features (e.g., Ptak et al., 2004; Bianchi et al., 2017; Diaz et al., 2020, 2023; Jana et al., 2023, see Ho, 2008 for a review of the subject).
4 Summary and conclusion
In this paper we studied a sample of 549 nearby non-blazar hard X-ray selected AGN (§2) to investigate the relation of the covering factor of dust around SMBHs and the Eddington ratio. We used the ratio of IR and bolometric AGN luminosity as a proxy of the covering factor of the circumnuclear dusty gas, considering the corrections of Stalevski et al. (2016; §3). In the following, we summarize our main findings.
-
•
We find that obscured AGN typically have a higher covering factor than their unobscured counterparts (Fig. 1), consistently with previous studies of IR SEDs of nearby AGN (e.g., Ramos Almeida et al., 2011). This is in agreement with the idea that AGN with large covering factors of obscuring material are more likely to be observed as obscured/type-2, due to the larger fraction of obscured lines of sight (Elitzur, 2012).
-
•
The dust covering factor shows a decrease with the Eddington ratio (§3.1) similar to that observed in the X-ray band (Ricci et al., 2017a, 2022a; Figs.,2,3), which was attributed to the effect of radiation pressure on the dusty gas. The relation between the covering factor and implies that, besides the inclination angle, the observational classification of AGN into obscured and unobscured is driven by the Eddington ratio (radiation-regulated unification model; Ricci et al., 2017a).
-
•
The obscuring material expelled by radiation pressure would be expected to populate the polar region of the system (see §3.2), and could be responsible for the extended MIR emission observed in a growing number of AGN (e.g., Hönig et al., 2012; Venanzi et al., 2020). In agreement with this, we find that all of the sources showing elongated mid-IR emission are accreting with Eddington ratios above the Eddington limit for dusty gas with , and more than half of them are above the Eddington limit for dusty gas with (Fig. 4).
- •
References
- Alonso-Herrero et al. (2011) Alonso-Herrero, A., Ramos Almeida, C., Mason, R., et al. 2011, ApJ, 736, 82, doi: 10.1088/0004-637X/736/2/82
- Alonso-Herrero et al. (2021) Alonso-Herrero, A., García-Burillo, S., Hönig, S. F., et al. 2021, A&A, 652, A99, doi: 10.1051/0004-6361/202141219
- Ananna et al. (2022a) Ananna, T. T., Urry, C. M., Ricci, C., et al. 2022a, ApJ, 939, L13, doi: 10.3847/2041-8213/ac9979
- Ananna et al. (2022b) Ananna, T. T., Weigel, A. K., Trakhtenbrot, B., et al. 2022b, ApJS, 261, 9, doi: 10.3847/1538-4365/ac5b64
- Andonie et al. (2022) Andonie, C., Ricci, C., Paltani, S., et al. 2022, MNRAS, 511, 5768, doi: 10.1093/mnras/stac403
- Antonucci (1993) Antonucci, R. 1993, ARA&A, 31, 473, doi: 10.1146/annurev.aa.31.090193.002353
- Arakawa et al. (2022) Arakawa, N., Fabian, A. C., Ferland, G. J., & Ishibashi, W. 2022, MNRAS, 517, 5069, doi: 10.1093/mnras/stac3044
- Asmus (2019) Asmus, D. 2019, MNRAS, 489, 2177, doi: 10.1093/mnras/stz2289
- Asmus et al. (2016) Asmus, D., Hönig, S. F., & Gandhi, P. 2016, ApJ, 822, 109, doi: 10.3847/0004-637X/822/2/109
- Asmus et al. (2014) Asmus, D., Hönig, S. F., Gandhi, P., Smette, A., & Duschl, W. J. 2014, MNRAS, 439, 1648, doi: 10.1093/mnras/stu041
- Assef et al. (2013) Assef, R. J., Stern, D., Kochanek, C. S., et al. 2013, ApJ, 772, 26, doi: 10.1088/0004-637X/772/1/26
- Awaki et al. (1991) Awaki, H., Koyama, K., Inoue, H., & Halpern, J. P. 1991, PASJ, 43, 195
- Baloković et al. (2018) Baloković, M., Brightman, M., Harrison, F. A., et al. 2018, ApJ, 854, 42, doi: 10.3847/1538-4357/aaa7eb
- Barthelmy et al. (2005) Barthelmy, S. D., Barbier, L. M., Cummings, J. R., et al. 2005, Space Sci. Rev., 120, 143, doi: 10.1007/s11214-005-5096-3
- Baumgartner et al. (2013) Baumgartner, W. H., Tueller, J., Markwardt, C. B., et al. 2013, ApJS, 207, 19, doi: 10.1088/0067-0049/207/2/19
- Beckmann et al. (2009) Beckmann, V., Soldi, S., Ricci, C., et al. 2009, A&A, 505, 417, doi: 10.1051/0004-6361/200912111
- Bianchi et al. (2007) Bianchi, S., Guainazzi, M., Matt, G., & Fonseca Bonilla, N. 2007, A&A, 467, L19, doi: 10.1051/0004-6361:20077331
- Bianchi et al. (2017) Bianchi, S., Marinucci, A., Matt, G., et al. 2017, MNRAS, 468, 2740, doi: 10.1093/mnras/stx662
- Boorman et al. (2018) Boorman, P. G., Gandhi, P., Baloković, M., et al. 2018, MNRAS, 477, 3775, doi: 10.1093/mnras/sty861
- Brightman & Nandra (2011) Brightman, M., & Nandra, K. 2011, MNRAS, 413, 1206, doi: 10.1111/j.1365-2966.2011.18207.x
- Brightman et al. (2015) Brightman, M., Baloković, M., Stern, D., et al. 2015, ApJ, 805, 41, doi: 10.1088/0004-637X/805/1/41
- Buchner & Bauer (2017) Buchner, J., & Bauer, F. E. 2017, MNRAS, 465, 4348, doi: 10.1093/mnras/stw2955
- Buchner et al. (2021) Buchner, J., Brightman, M., Baloković, M., et al. 2021, A&A, 651, A58, doi: 10.1051/0004-6361/201834963
- Buchner et al. (2015) Buchner, J., Georgakakis, A., Nandra, K., et al. 2015, ApJ, 802, 89, doi: 10.1088/0004-637X/802/2/89
- Burlon et al. (2011) Burlon, D., Ajello, M., Greiner, J., et al. 2011, ApJ, 728, 58, doi: 10.1088/0004-637X/728/1/58
- Burtscher et al. (2013) Burtscher, L., Meisenheimer, K., Tristram, K. R. W., et al. 2013, A&A, 558, A149, doi: 10.1051/0004-6361/201321890
- Campitiello et al. (2018) Campitiello, S., Ghisellini, G., Sbarrato, T., & Calderone, G. 2018, A&A, 612, A59, doi: 10.1051/0004-6361/201731897
- Davies et al. (2015) Davies, R. I., Burtscher, L., Rosario, D., et al. 2015, ApJ, 806, 127, doi: 10.1088/0004-637X/806/1/127
- Della Ceca et al. (2008) Della Ceca, R., Caccianiga, A., Severgnini, P., et al. 2008, A&A, 487, 119, doi: 10.1051/0004-6361:20079319
- Diaz et al. (2020) Diaz, Y., Arévalo, P., Hernández-García, L., et al. 2020, MNRAS, 496, 5399, doi: 10.1093/mnras/staa1762
- Diaz et al. (2023) Diaz, Y., Hernàndez-García, L., Arévalo, P., et al. 2023, A&A, 669, A114, doi: 10.1051/0004-6361/202244678
- Elitzur (2008) Elitzur, M. 2008, New A Rev., 52, 274, doi: 10.1016/j.newar.2008.06.010
- Elitzur (2012) —. 2012, ApJ, 747, L33, doi: 10.1088/2041-8205/747/2/L33
- Ezhikode et al. (2017) Ezhikode, S. H., Gandhi, P., Done, C., et al. 2017, MNRAS, 472, 3492, doi: 10.1093/mnras/stx2160
- Fabian et al. (2006) Fabian, A. C., Celotti, A., & Erlund, M. C. 2006, MNRAS, 373, L16, doi: 10.1111/j.1745-3933.2006.00234.x
- Fabian et al. (2008) Fabian, A. C., Vasudevan, R. V., & Gandhi, P. 2008, MNRAS, 385, L43, doi: 10.1111/j.1745-3933.2008.00430.x
- Fabian et al. (2009) Fabian, A. C., Vasudevan, R. V., Mushotzky, R. F., Winter, L. M., & Reynolds, C. S. 2009, MNRAS, 394, L89, doi: 10.1111/j.1745-3933.2009.00617.x
- Feigelson & Nelson (1985) Feigelson, E. D., & Nelson, P. I. 1985, ApJ, 293, 192, doi: 10.1086/163225
- Fischer et al. (2013) Fischer, T. C., Crenshaw, D. M., Kraemer, S. B., & Schmitt, H. R. 2013, ApJS, 209, 1, doi: 10.1088/0067-0049/209/1/1
- Gámez Rosas et al. (2022) Gámez Rosas, V., Isbell, J. W., Jaffe, W., et al. 2022, Nature, 602, 403, doi: 10.1038/s41586-021-04311-7
- Gandhi et al. (2009) Gandhi, P., Horst, H., Smette, A., et al. 2009, A&A, 502, 457, doi: 10.1051/0004-6361/200811368
- García-Bernete et al. (2016) García-Bernete, I., Ramos Almeida, C., Acosta-Pulido, J. A., et al. 2016, MNRAS, 463, 3531, doi: 10.1093/mnras/stw2125
- García-Bernete et al. (2019) García-Bernete, I., Ramos Almeida, C., Alonso-Herrero, A., et al. 2019, MNRAS, 486, 4917, doi: 10.1093/mnras/stz1003
- García-Bernete et al. (2022) García-Bernete, I., González-Martín, O., Ramos Almeida, C., et al. 2022, A&A, 667, A140, doi: 10.1051/0004-6361/202244230
- García-Burillo et al. (2019) García-Burillo, S., Combes, F., Ramos Almeida, C., et al. 2019, A&A, 632, A61, doi: 10.1051/0004-6361/201936606
- García-Burillo et al. (2021) García-Burillo, S., Alonso-Herrero, A., Ramos Almeida, C., et al. 2021, A&A, 652, A98, doi: 10.1051/0004-6361/202141075
- Gehrels et al. (2004) Gehrels, N., Chincarini, G., Giommi, P., et al. 2004, ApJ, 611, 1005, doi: 10.1086/422091
- Georgantopoulos & Georgakakis (2005) Georgantopoulos, I., & Georgakakis, A. 2005, MNRAS, 358, 131, doi: 10.1111/j.1365-2966.2005.08754.x
- González-Martín et al. (2019) González-Martín, O., Masegosa, J., García-Bernete, I., et al. 2019, ApJ, 884, 10, doi: 10.3847/1538-4357/ab3e6b
- Granato & Danese (1994) Granato, G. L., & Danese, L. 1994, MNRAS, 268, 235, doi: 10.1093/mnras/268.1.235
- Harrison (2017) Harrison, C. M. 2017, Nature Astronomy, 1, 0165, doi: 10.1038/s41550-017-0165
- Hasinger (2008) Hasinger, G. 2008, A&A, 490, 905, doi: 10.1051/0004-6361:200809839
- Hickox & Alexander (2018) Hickox, R. C., & Alexander, D. M. 2018, ARA&A, 56, 625, doi: 10.1146/annurev-astro-081817-051803
- Ho (2008) Ho, L. C. 2008, ARA&A, 46, 475, doi: 10.1146/annurev.astro.45.051806.110546
- Hönig et al. (2006) Hönig, S. F., Beckert, T., Ohnaka, K., & Weigelt, G. 2006, A&A, 452, 459, doi: 10.1051/0004-6361:20054622
- Hönig & Kishimoto (2010) Hönig, S. F., & Kishimoto, M. 2010, A&A, 523, A27, doi: 10.1051/0004-6361/200912676
- Hönig & Kishimoto (2017) —. 2017, ApJ, 838, L20, doi: 10.3847/2041-8213/aa6838
- Hönig et al. (2012) Hönig, S. F., Kishimoto, M., Antonucci, R., et al. 2012, ApJ, 755, 149, doi: 10.1088/0004-637X/755/2/149
- Hönig et al. (2010) Hönig, S. F., Kishimoto, M., Gandhi, P., et al. 2010, A&A, 515, A23, doi: 10.1051/0004-6361/200913742
- Hönig et al. (2013) Hönig, S. F., Kishimoto, M., Tristram, K. R. W., et al. 2013, ApJ, 771, 87, doi: 10.1088/0004-637X/771/2/87
- Ichikawa et al. (2017) Ichikawa, K., Ricci, C., Ueda, Y., et al. 2017, ApJ, 835, 74, doi: 10.3847/1538-4357/835/1/74
- Ichikawa et al. (2015) Ichikawa, K., Packham, C., Ramos Almeida, C., et al. 2015, ApJ, 803, 57, doi: 10.1088/0004-637X/803/2/57
- Ichikawa et al. (2019) Ichikawa, K., Ricci, C., Ueda, Y., et al. 2019, ApJ, 870, 31, doi: 10.3847/1538-4357/aaef8f
- Imanishi et al. (2020) Imanishi, M., Nguyen, D. D., Wada, K., et al. 2020, ApJ, 902, 99, doi: 10.3847/1538-4357/abaf50
- Impellizzeri et al. (2019) Impellizzeri, C. M. V., Gallimore, J. F., Baum, S. A., et al. 2019, ApJ, 884, L28, doi: 10.3847/2041-8213/ab3c64
- Inaba et al. (2022) Inaba, K., Ueda, Y., Yamada, S., et al. 2022, ApJ, 939, 88, doi: 10.3847/1538-4357/ac97ec
- Isbell et al. (2022) Isbell, J. W., Meisenheimer, K., Pott, J. U., et al. 2022, A&A, 663, A35, doi: 10.1051/0004-6361/202243271
- Ishibashi et al. (2019) Ishibashi, W., Fabian, A. C., & Reynolds, C. S. 2019, MNRAS, 486, 2210, doi: 10.1093/mnras/stz987
- Ishibashi et al. (2018) Ishibashi, W., Fabian, A. C., Ricci, C., & Celotti, A. 2018, MNRAS, 479, 3335, doi: 10.1093/mnras/sty1620
- Isobe et al. (1986) Isobe, T., Feigelson, E. D., & Nelson, P. I. 1986, ApJ, 306, 490, doi: 10.1086/164359
- Iwasawa & Taniguchi (1993) Iwasawa, K., & Taniguchi, Y. 1993, ApJ, 413, L15, doi: 10.1086/186948
- Jaffe et al. (2004a) Jaffe, W., Meisenheimer, K., Röttgering, H. J. A., et al. 2004a, Nature, 429, 47, doi: 10.1038/nature02531
- Jaffe et al. (2004b) —. 2004b, Nature, 429, 47, doi: 10.1038/nature02531
- Jana et al. (2023) Jana, A., Chatterjee, A., Chang, H.-K., et al. 2023, MNRAS, doi: 10.1093/mnras/stad2140
- Jun et al. (2021) Jun, H. D., Assef, R. J., Carroll, C. M., et al. 2021, ApJ, 906, 21, doi: 10.3847/1538-4357/abc629
- Kakkad et al. (2016) Kakkad, D., Mainieri, V., Padovani, P., et al. 2016, A&A, 592, A148, doi: 10.1051/0004-6361/201527968
- Kormendy & Ho (2013) Kormendy, J., & Ho, L. C. 2013, ARA&A, 51, 511, doi: 10.1146/annurev-astro-082708-101811
- Koss et al. (2017) Koss, M., Trakhtenbrot, B., Ricci, C., et al. 2017, ApJ, 850, 74, doi: 10.3847/1538-4357/aa8ec9
- Koss et al. (2016) Koss, M. J., Assef, R., Baloković, M., et al. 2016, ApJ, 825, 85, doi: 10.3847/0004-637X/825/2/85
- Koss et al. (2022a) Koss, M. J., Trakhtenbrot, B., Ricci, C., et al. 2022a, ApJS, 261, 1, doi: 10.3847/1538-4365/ac6c8f
- Koss et al. (2022b) Koss, M. J., Ricci, C., Trakhtenbrot, B., et al. 2022b, ApJS, 261, 2, doi: 10.3847/1538-4365/ac6c05
- Koss et al. (2022c) Koss, M. J., Trakhtenbrot, B., Ricci, C., et al. 2022c, ApJS, 261, 6, doi: 10.3847/1538-4365/ac650b
- Krolik & Begelman (1988) Krolik, J. H., & Begelman, M. C. 1988, ApJ, 329, 702, doi: 10.1086/166414
- La Franca et al. (2005) La Franca, F., Fiore, F., Comastri, A., et al. 2005, ApJ, 635, 864, doi: 10.1086/497586
- Lacy et al. (2015) Lacy, M., Ridgway, S. E., Sajina, A., et al. 2015, ApJ, 802, 102, doi: 10.1088/0004-637X/802/2/102
- Lansbury et al. (2020) Lansbury, G. B., Banerji, M., Fabian, A. C., & Temple, M. J. 2020, MNRAS, 495, 2652, doi: 10.1093/mnras/staa1220
- Lanz et al. (2019) Lanz, L., Hickox, R. C., Baloković, M., et al. 2019, ApJ, 870, 26, doi: 10.3847/1538-4357/aaee6c
- Lawrence (1991) Lawrence, A. 1991, MNRAS, 252, 586
- Lawrence & Elvis (1982) Lawrence, A., & Elvis, M. 1982, ApJ, 256, 410, doi: 10.1086/159918
- Lawrence & Elvis (2010) —. 2010, ApJ, 714, 561, doi: 10.1088/0004-637X/714/1/561
- Leftley et al. (2019) Leftley, J. H., Hönig, S. F., Asmus, D., et al. 2019, ApJ, 886, 55, doi: 10.3847/1538-4357/ab4a0b
- Lightman & White (1988) Lightman, A. P., & White, T. R. 1988, ApJ, 335, 57, doi: 10.1086/166905
- Liu & Li (2014) Liu, Y., & Li, X. 2014, ApJ, 787, 52, doi: 10.1088/0004-637X/787/1/52
- López-Gonzaga et al. (2016) López-Gonzaga, N., Burtscher, L., Tristram, K. R. W., Meisenheimer, K., & Schartmann, M. 2016, A&A, 591, A47, doi: 10.1051/0004-6361/201527590
- López-Gonzaga et al. (2014) López-Gonzaga, N., Jaffe, W., Burtscher, L., Tristram, K. R. W., & Meisenheimer, K. 2014, A&A, 565, A71, doi: 10.1051/0004-6361/201323002
- Lusso et al. (2012) Lusso, E., Comastri, A., Simmons, B. D., et al. 2012, MNRAS, 425, 623, doi: 10.1111/j.1365-2966.2012.21513.x
- Lusso et al. (2013) Lusso, E., Hennawi, J. F., Comastri, A., et al. 2013, ApJ, 777, 86, doi: 10.1088/0004-637X/777/2/86
- Maiolino et al. (2007) Maiolino, R., Shemmer, O., Imanishi, M., et al. 2007, A&A, 468, 979, doi: 10.1051/0004-6361:20077252
- Mateos et al. (2016) Mateos, S., Carrera, F. J., Alonso-Herrero, A., et al. 2016, ApJ, 819, 166, doi: 10.3847/0004-637X/819/2/166
- Matt & Iwasawa (2019) Matt, G., & Iwasawa, K. 2019, MNRAS, 482, 151, doi: 10.1093/mnras/sty2697
- Matt et al. (1991) Matt, G., Perola, G. C., & Piro, L. 1991, A&A, 247, 25
- Mejía-Restrepo et al. (2022) Mejía-Restrepo, J. E., Trakhtenbrot, B., Koss, M. J., et al. 2022, ApJS, 261, 5, doi: 10.3847/1538-4365/ac6602
- Merloni et al. (2014) Merloni, A., Bongiorno, A., Brusa, M., et al. 2014, MNRAS, 437, 3550, doi: 10.1093/mnras/stt2149
- Mor et al. (2009) Mor, R., Netzer, H., & Elitzur, M. 2009, ApJ, 705, 298, doi: 10.1088/0004-637X/705/1/298
- Mullaney et al. (2011) Mullaney, J. R., Alexander, D. M., Goulding, A. D., & Hickox, R. C. 2011, MNRAS, 414, 1082, doi: 10.1111/j.1365-2966.2011.18448.x
- Murphy & Yaqoob (2009) Murphy, K. D., & Yaqoob, T. 2009, MNRAS, 397, 1549, doi: 10.1111/j.1365-2966.2009.15025.x
- Musiimenta et al. (2023) Musiimenta, B., Brusa, M., Liu, T., et al. 2023, arXiv e-prints, arXiv:2309.16528, doi: 10.48550/arXiv.2309.16528
- Nenkova et al. (2008a) Nenkova, M., Sirocky, M. M., Ivezić, Ž., & Elitzur, M. 2008a, ApJ, 685, 147, doi: 10.1086/590482
- Nenkova et al. (2008b) Nenkova, M., Sirocky, M. M., Nikutta, R., Ivezić, Ž., & Elitzur, M. 2008b, ApJ, 685, 160, doi: 10.1086/590483
- Netzer (2015) Netzer, H. 2015, ARA&A, 53, 365, doi: 10.1146/annurev-astro-082214-122302
- Netzer et al. (2016) Netzer, H., Lani, C., Nordon, R., et al. 2016, ApJ, 819, 123, doi: 10.3847/0004-637X/819/2/123
- Nikutta et al. (2009) Nikutta, R., Elitzur, M., & Lacy, M. 2009, ApJ, 707, 1550, doi: 10.1088/0004-637X/707/2/1550
- Ogawa et al. (2021) Ogawa, S., Ueda, Y., Tanimoto, A., & Yamada, S. 2021, ApJ, 906, 84, doi: 10.3847/1538-4357/abccce
- Ogawa et al. (2019) Ogawa, S., Ueda, Y., Yamada, S., Tanimoto, A., & Kawaguchi, T. 2019, ApJ, 875, 115, doi: 10.3847/1538-4357/ab0e08
- Oh et al. (2015) Oh, K., Yi, S. K., Schawinski, K., et al. 2015, ApJS, 219, 1, doi: 10.1088/0067-0049/219/1/1
- Paltani & Ricci (2017) Paltani, S., & Ricci, C. 2017, A&A, 607, A31, doi: 10.1051/0004-6361/201629623
- Pölsterl (2020) Pölsterl, S. 2020, Journal of Machine Learning Research, 21, 1. http://jmlr.org/papers/v21/20-729.html
- Pounds et al. (1990) Pounds, K. A., Nandra, K., Stewart, G. C., George, I. M., & Fabian, A. C. 1990, Nature, 344, 132, doi: 10.1038/344132a0
- Ptak et al. (2004) Ptak, A., Terashima, Y., Ho, L. C., & Quataert, E. 2004, ApJ, 606, 173, doi: 10.1086/382940
- Raban et al. (2009) Raban, D., Jaffe, W., Röttgering, H., Meisenheimer, K., & Tristram, K. R. W. 2009, MNRAS, 394, 1325, doi: 10.1111/j.1365-2966.2009.14439.x
- Ramos Almeida & Ricci (2017) Ramos Almeida, C., & Ricci, C. 2017, Nature Astronomy, 1, 679, doi: 10.1038/s41550-017-0232-z
- Ramos Almeida et al. (2011) Ramos Almeida, C., Levenson, N. A., Alonso-Herrero, A., et al. 2011, ApJ, 731, 92, doi: 10.1088/0004-637X/731/2/92
- Ricci & Paltani (2023) Ricci, C., & Paltani, S. 2023, ApJ, 945, 55, doi: 10.3847/1538-4357/acb5a6
- Ricci et al. (2013) Ricci, C., Paltani, S., Awaki, H., et al. 2013, A&A, 553, A29, doi: 10.1051/0004-6361/201220324
- Ricci et al. (2015) Ricci, C., Ueda, Y., Koss, M. J., et al. 2015, ApJ, 815, L13, doi: 10.1088/2041-8205/815/1/L13
- Ricci et al. (2014) Ricci, C., Ueda, Y., Paltani, S., et al. 2014, MNRAS, 441, 3622, doi: 10.1093/mnras/stu735
- Ricci et al. (2017a) Ricci, C., Trakhtenbrot, B., Koss, M. J., et al. 2017a, Nature, 549, 488, doi: 10.1038/nature23906
- Ricci et al. (2017b) —. 2017b, ApJS, 233, 17, doi: 10.3847/1538-4365/aa96ad
- Ricci et al. (2022a) Ricci, C., Ananna, T. T., Temple, M. J., et al. 2022a, ApJ, 938, 67, doi: 10.3847/1538-4357/ac8e67
- Ricci et al. (2022b) Ricci, F., Treister, E., Bauer, F. E., et al. 2022b, ApJS, 261, 8, doi: 10.3847/1538-4365/ac5b67
- Rojas et al. (2020) Rojas, A. F., Sani, E., Gavignaud, I., et al. 2020, MNRAS, 491, 5867, doi: 10.1093/mnras/stz3386
- Sazonov et al. (2007) Sazonov, S., Revnivtsev, M., Krivonos, R., Churazov, E., & Sunyaev, R. 2007, A&A, 462, 57, doi: 10.1051/0004-6361:20066277
- Schartmann et al. (2008) Schartmann, M., Meisenheimer, K., Camenzind, M., et al. 2008, A&A, 482, 67, doi: 10.1051/0004-6361:20078907
- She et al. (2018) She, R., Ho, L. C., Feng, H., & Cui, C. 2018, ApJ, 859, 152, doi: 10.3847/1538-4357/aabfe7
- Shimizu et al. (2016) Shimizu, T. T., Meléndez, M., Mushotzky, R. F., et al. 2016, MNRAS, 456, 3335, doi: 10.1093/mnras/stv2828
- Siebenmorgen et al. (2015) Siebenmorgen, R., Heymann, F., & Efstathiou, A. 2015, A&A, 583, A120, doi: 10.1051/0004-6361/201526034
- Simpson (2005) Simpson, C. 2005, MNRAS, 360, 565, doi: 10.1111/j.1365-2966.2005.09043.x
- Smith et al. (2014) Smith, K. L., Koss, M., & Mushotzky, R. F. 2014, ApJ, 794, 112, doi: 10.1088/0004-637X/794/2/112
- Stacey et al. (2022) Stacey, H. R., Costa, T., McKean, J. P., et al. 2022, MNRAS, 517, 3377, doi: 10.1093/mnras/stac2765
- Stalevski et al. (2017) Stalevski, M., Asmus, D., & Tristram, K. R. W. 2017, MNRAS, 472, 3854, doi: 10.1093/mnras/stx2227
- Stalevski et al. (2012) Stalevski, M., Fritz, J., Baes, M., Nakos, T., & Popović, L. Č. 2012, MNRAS, 420, 2756, doi: 10.1111/j.1365-2966.2011.19775.x
- Stalevski et al. (2016) Stalevski, M., Ricci, C., Ueda, Y., et al. 2016, MNRAS, 458, 2288, doi: 10.1093/mnras/stw444
- Stalevski et al. (2019) Stalevski, M., Tristram, K. R. W., & Asmus, D. 2019, MNRAS, 484, 3334, doi: 10.1093/mnras/stz220
- Tanimoto et al. (2019) Tanimoto, A., Ueda, Y., Odaka, H., et al. 2019, ApJ, 877, 95, doi: 10.3847/1538-4357/ab1b20
- Tanimoto et al. (2020) —. 2020, ApJ, 897, 2, doi: 10.3847/1538-4357/ab96bc
- Tazaki & Ichikawa (2020) Tazaki, R., & Ichikawa, K. 2020, ApJ, 892, 149, doi: 10.3847/1538-4357/ab72f6
- Toba et al. (2013) Toba, Y., Oyabu, S., Matsuhara, H., et al. 2013, PASJ, 65, 113, doi: 10.1093/pasj/65.5.113
- Toba et al. (2014) —. 2014, ApJ, 788, 45, doi: 10.1088/0004-637X/788/1/45
- Toba et al. (2021) Toba, Y., Ueda, Y., Gandhi, P., et al. 2021, ApJ, 912, 91, doi: 10.3847/1538-4357/abe94a
- Toba et al. (2022) Toba, Y., Liu, T., Urrutia, T., et al. 2022, A&A, 661, A15, doi: 10.1051/0004-6361/202141547
- Treister et al. (2008) Treister, E., Krolik, J. H., & Dullemond, C. 2008, ApJ, 679, 140, doi: 10.1086/586698
- Treister & Urry (2005) Treister, E., & Urry, C. M. 2005, ApJ, 630, 115, doi: 10.1086/431892
- Treister & Urry (2006) —. 2006, ApJ, 652, L79, doi: 10.1086/510237
- Tristram et al. (2014) Tristram, K. R. W., Burtscher, L., Jaffe, W., et al. 2014, A&A, 563, A82, doi: 10.1051/0004-6361/201322698
- Tristram et al. (2007) Tristram, K. R. W., Meisenheimer, K., Jaffe, W., et al. 2007, A&A, 474, 837, doi: 10.1051/0004-6361:20078369
- Tristram et al. (2022) Tristram, K. R. W., Impellizzeri, C. M. V., Zhang, Z.-Y., et al. 2022, A&A, 664, A142, doi: 10.1051/0004-6361/202243535
- Tueller et al. (2008) Tueller, J., Mushotzky, R. F., Barthelmy, S., et al. 2008, ApJ, 681, 113, doi: 10.1086/588458
- Ueda et al. (2014) Ueda, Y., Akiyama, M., Hasinger, G., Miyaji, T., & Watson, M. G. 2014, ApJ, 786, 104, doi: 10.1088/0004-637X/786/2/104
- Ueda et al. (2003) Ueda, Y., Akiyama, M., Ohta, K., & Miyaji, T. 2003, ApJ, 598, 886, doi: 10.1086/378940
- Ueda et al. (2011) Ueda, Y., Hiroi, K., Isobe, N., et al. 2011, PASJ, 63, 937. https://arxiv.org/abs/1109.0852
- Uematsu et al. (2021) Uematsu, R., Ueda, Y., Tanimoto, A., et al. 2021, ApJ, 913, 17, doi: 10.3847/1538-4357/abf0a2
- Urry & Padovani (1995) Urry, C. M., & Padovani, P. 1995, PASP, 107, 803, doi: 10.1086/133630
- Vander Meulen et al. (2023) Vander Meulen, B., Camps, P., Stalevski, M., & Baes, M. 2023, arXiv e-prints, arXiv:2304.10563, doi: 10.48550/arXiv.2304.10563
- Vasudevan & Fabian (2007) Vasudevan, R. V., & Fabian, A. C. 2007, MNRAS, 381, 1235, doi: 10.1111/j.1365-2966.2007.12328.x
- Venanzi et al. (2020) Venanzi, M., Hönig, S., & Williamson, D. 2020, ApJ, 900, 174, doi: 10.3847/1538-4357/aba89f
- Wittkowski et al. (2004) Wittkowski, M., Kervella, P., Arsenault, R., et al. 2004, A&A, 418, L39, doi: 10.1051/0004-6361:20040118
- Yamada et al. (2021) Yamada, S., Ueda, Y., Tanimoto, A., et al. 2021, ApJS, 257, 61, doi: 10.3847/1538-4365/ac17f5
- Yamada et al. (2023) Yamada, S., Ueda, Y., Herrera-Endoqui, M., et al. 2023, ApJS, 265, 37, doi: 10.3847/1538-4365/acb349
- Zhao et al. (2020) Zhao, X., Marchesi, S., Ajello, M., Baloković, M., & Fischer, T. 2020, ApJ, 894, 71, doi: 10.3847/1538-4357/ab879d
- Zhuang et al. (2018) Zhuang, M.-Y., Ho, L. C., & Shangguan, J. 2018, ApJ, 862, 118, doi: 10.3847/1538-4357/aacc2d