Learning a Multi-task Transformer via
Unified and Customized Instruction Tuning for
Chest Radiograph Interpretation
Abstract
The emergence of multi-modal deep learning models has made significant impacts on clinical applications in the last decade. However, the majority of models are limited to single-tasking, without considering disease diagnosis is indeed a multi-task procedure. Here, we demonstrate a unified transformer model specifically designed for multi-modal clinical tasks by incorporating customized instruction tuning. We first compose a multi-task training dataset comprising 13.4 million instruction and ground-truth pairs (with approximately one million radiographs) for the customized tuning, involving both image- and pixel-level tasks. Thus, we can unify the various vision-intensive tasks in a single training framework with homogeneous model inputs and outputs to increase clinical interpretability in one reading. Finally, we demonstrate the overall superior performance of our model compared to prior arts on various chest X-ray benchmarks across multi-tasks in both direct inference and finetuning settings. Three radiologists further evaluate the generated reports against the recorded ones, which also exhibit the enhanced explainability of our multi-task model.
Keywords Instruction Tuning Multi-task Learning Chest X-ray Explainability Computer-aided Diagnosis
1 Introduction
Chest radiography (CXR) is a non-invasive and relatively low-cost diagnostic radiology examination for screening and diagnosis of various thoracic diseases affecting the lung and heart [1]. However, the interpretation of CXR is greatly challenged by its low sensitivity of subtle abnormalities, overlapping structures, and limited soft tissue details, and therefore, depends heavily on the capability and experience of radiologists [2]. On the other hand, the growing demand for CXR examination has brought a burden on medical professionals, which also limits the clinical application of CXR, especially in community clinics or primary hospitals. In this context, automated diagnosis by AI could potentially contribute to reducing the workload of radiologists.
Large Language Models [3; 4] have revolutionized natural language processing and developed the capability to generate responses that closely resemble those from humans. They excel at a wide range of tasks, including language translation, question answering, and text generation[5; 6; 7; 8; 9; 10; 11]. Models like ChatGPT (OpenAI) [12; 13] and Med-PaLm (Google) [14; 15]have also demonstrated the powerful reasoning capabilities of language models in complex scenarios like medical diagnosis to assist professionals in delivering care. Nonetheless, such tasks are limited to a more general medical scope and largely rely on the visual features on the image level, without touching the pixel-level vision tasks, e.g., disease localization and segmentation. Moreover, to further improve the model’s ability on downstream tasks, supervised instruction tuning with specific downstream task-oriented data is often required on language only [16; 17] and vision-language tasks[18; 19; 20], individually.
On the other hand, the development of the generalist model in the medical field has lagged. Most models are designed primarily for "pure" language tasks [21; 14]. Several generalist models for the biomedical field have been recently proposed and achieved progress in the VQA task [22; 23; 24; 25; 26; 27; 28; 29]. On the other hand, the present multi-modality models are not well-suited for traditional image processing tasks like detection and segmentation. Existing methods face discrepancies in input, output, and training processes between visual tasks (e.g., detection, segmentation) and language tasks (e.g., image captioning and VQA), which hinders efficient collaboration. Furthermore, relying solely on textual outputs restricts the answer capacity and interpretability to some extent. For instance, in computer-aided diagnosis (CAD) using medical images, while the model can identify the disease type and provide treatment recommendations, it is unable to pinpoint the exact location and region of the pathologies, limiting its clinical usefulness as a reference for explainable diagnosis prediction.
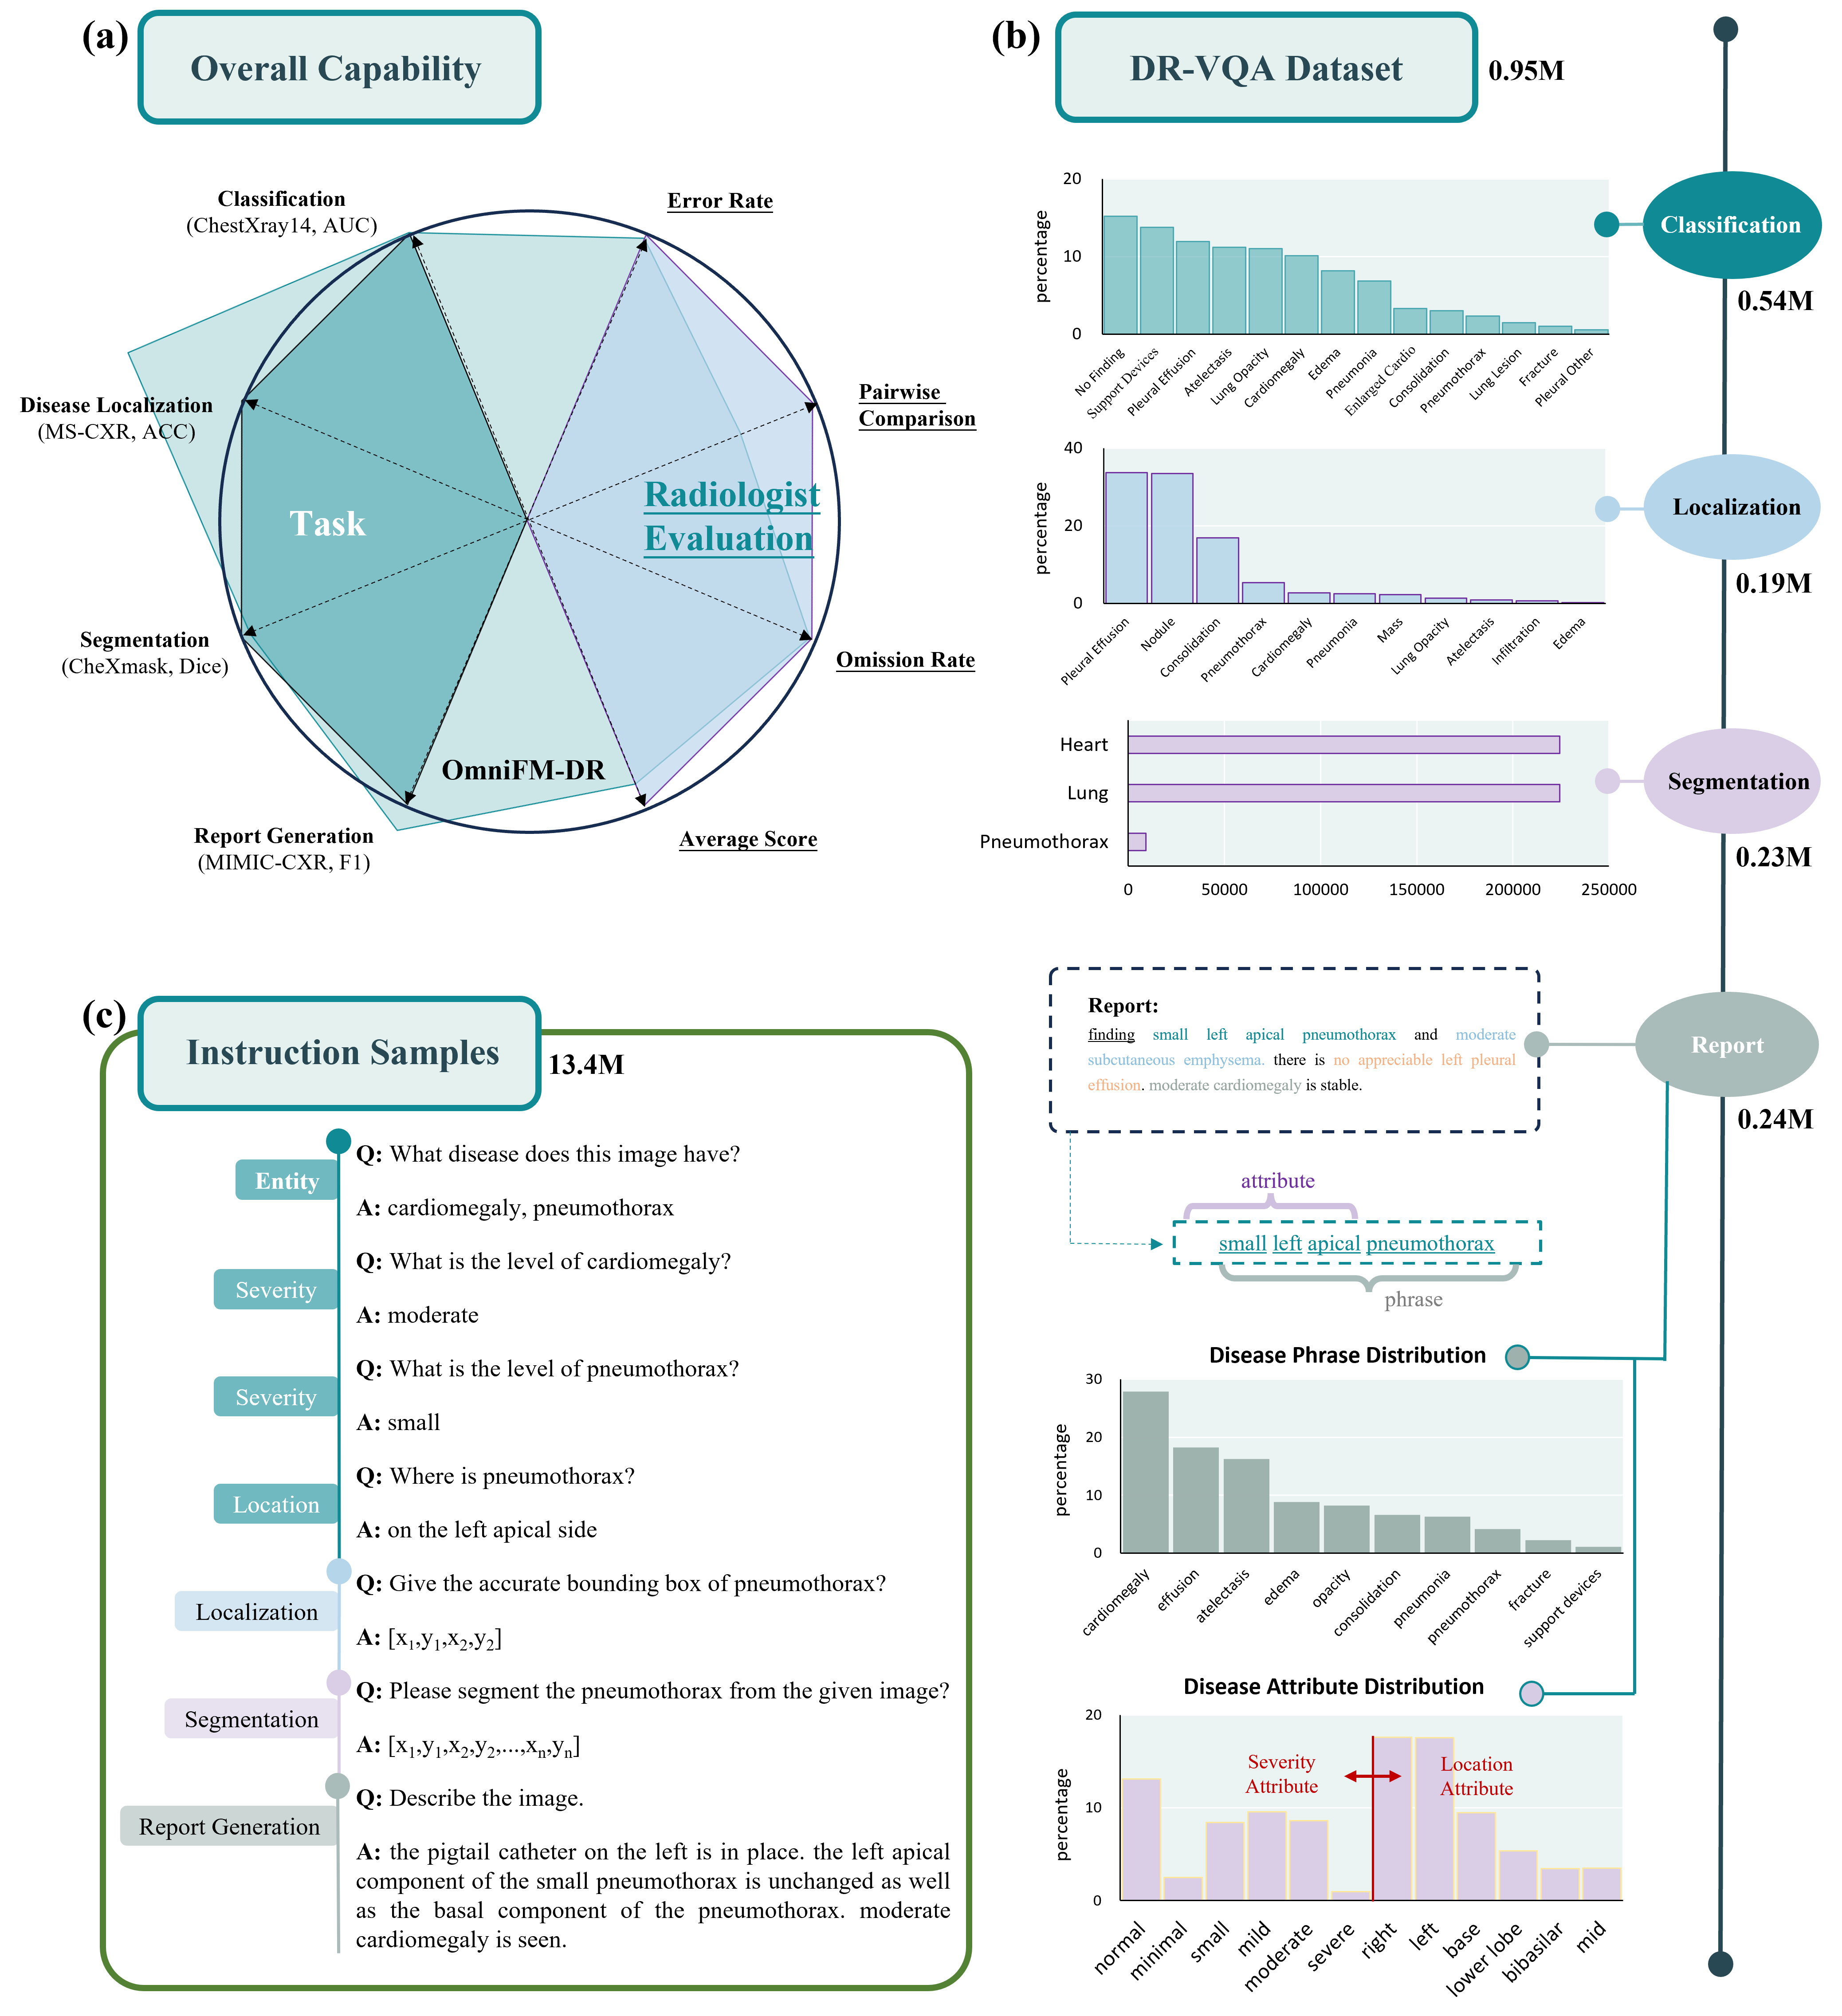
To address these limitations on both technical and application aspects, we propose OmniFM-DR, a multi-modal generalist model for reading chest radiographs, by providing more detailed evidence of associated diseases instead of rushing to the diagnosis directly. For the proposed multi-task transformer model, we unify the input and output labels of all sub-tasks into a uniform format for consistent modeling and joint training, which is detailed in the customized instruction tuning section. Figure 1 illustrates the four main tasks performed by OmniFM-DR and provides an illustrative comparison of model capabilities in each task with other state-of-the-art (SOTA) methods, measured in each individual evaluation metric. OmniFM-DR is designed to handle a wide range of downstream tasks relevant to chest X-ray analysis, including diagnosis of common thoracic diseases and localization of those image-visible disease patterns. Additionally, it can perform image segmentation for pneumothorax, lungs, and heart regions. Most importantly, OmniFM-DR is capable of generating reports summarizing the findings by leveraging all the provided evidence mentioned here. Notably, OmniFM-DR is capable of reaching equivalent or even better performance compared to SOTA models (dedicated to specific tasks) in all downstream clinical applications, showing its effectiveness and generality in chest X-ray interpretation.
Our contributions are three-fold:
-
•
Our proposed model offers a versatile approach to analyzing chest X-ray images, allowing for comprehensive and accurate radiography image analysis across various application tasks. It enhances the interpretability of chest X-ray reporting by generating more detailed information on disease attributes. This includes disease size, location, severity, and contour, providing stronger evidence for diagnosis and treatment.
-
•
We develop a unique framework for building datasets that are tailored for customized instruction tuning. Unlike the conventional method of organizing pair-wise supervision (consisting of an image and its corresponding label), our framework involves cross-task training supervision for each sample, which enhances the learning of correlations among tasks. We will release the composed datasets with detailed image-instruction-label triplets, which is the very first dataset of this kind to our knowledge.
-
•
We applied the proposed model on various downstream application benchmarks, and an overall superior performance is shown compared to SOTA approaches. Furthermore, we conducted a controlled trial and evaluation on the generated reports performed by three radiologists. In the blinded comparison of 160 retrospective cases from four centers, three radiologists perceived the quality of 59% of the generated reports to be equivalent to or even better than the original physician reports.
2 Results
2.1 Overview
As illustrated in Figure 1, we train the multi-task model for analyzing chest X-ray images with a dataset specially designed for customized instruction tuning. It aims at a comprehensive analysis of chest X-ray images (providing detailed evidence) and enhanced interpretability (evidence-based diagnosis) as a tool for computer-aided diagnosis (CADx). For the performance evaluation purpose, we applied the proposed model to various downstream tasks and benchmarks, and an overall superior performance is achieved compared to SOTA models (dedicated to each individual sub-task). Furthermore, we conducted a controlled trial for the evaluation of the generated report in comparison to the original reports, assessed by a group of radiologists. In a blinded comparison involving 160 historical reports from four different centers, three radiologists consistently rated the quality of the generated reports as comparable to or better than original radiological reports, with a success rate of over 59%. Moreover, our proposed model exhibited an average omission rate of 2.53% and an average error rate of 2.72% per report, which are close to those of the radiologist-provided reference reports (i.e., 1.25% and 2.00%)
In Table 1, we illustrate the overall performance of the proposed OmniFM-DR across four main tasks on nine datasets, along with individual SOTA results, using a total of 150 thousand testing cases. Our unified transformer model achieves superior results among the majority of the tasks on unseen datasets when performing direct inference. In the fine-tuning setting, the advantage remains significant in most of the tasks and metrics. Here, the proposed model is trained using a list of public datasets (detailed below). ChestXray14 and RSNA pneumonia datasets are utilized to evaluate the multi-label classification task performance, while MS-CXR, ChestXray14, and RSNA pneumonia datasets are used for the disease localization task. Furthermore, the largest available dataset for CXR reports (i.e., MIMIC-CXR) is utilized to evaluate the report generation performance. The metrics (AUC and F1) refer to the macro average on the 14 diseases for ChestXray14. Accuracy (ACC) and mean Intersection over Union (mIoU) are utilized for the evaluation of disease localization, while Dice is utilized for segmentation tasks in three datasets (JSRT, CheXMark, and MS-PS). Furthermore, the performance of the report generation task is assessed by both clinical efficacy (CE, i.e., F1, Precision, Recall) and natural language processing (NLP, i.e., BL-4, METEOR, Rouge-L) metrics.
| Task | Dataset | Metric | Direct Inference | Finetuning | ||
|---|---|---|---|---|---|---|
| SOTA | OmniFM-DR | SOTA | OmniFM-DR | |||
| Disease classification | ChestXray14 | AUC | 72.6[30] | 73.4 | 77.8[31] | 77.9 |
| F1 | 24.4[30] | 26.2 | 32.9[31] | 32.6 | ||
| RSNA Pneumonia | AUC | 82.8[32] | 84.3 | 88.5[33] | 88.9 | |
| F1 | 58.4[31] | 59.5 | 67.2[33] | 66.2 | ||
| Disease localization | ChestXray14 | ACC | 31.5[34] | 56.7 | 47.7[34] | 61.5 |
| mIoU | 32.7[34] | 49.2 | 41.5[34] | 51.6 | ||
| MS-CXR | ACC | 26.1[34] | 46.5 | 43.7[34] | 54.7 | |
| mIoU | 28.2[34] | 46.2 | 46.5[34] | 50.6 | ||
| RSNA Pneumonia | ACC | 35.7[34] | 42.7 | 33.4[34] | 55.0 | |
| mIoU | 36.7[34] | 47.6 | 33.2[34] | 49.7 | ||
| Segmentation | JSRT | Dice | 93.8[33] | 90.8 | 95.2[33] | 91.6 |
| CheXmask | Dice | 90.2[33] | 88.5 | 92.1[33] | 93.9 | |
| MS-PS | Dice | 48.9 [33] | 65.0 | 52.6[33] | 59.4 | |
| Report generation | MIMIC-CXR | F1 | 30.3[35] | 33.3 | - | - |
| Precision | 35.2[35] | 43.2 | - | - | ||
| Recall | 29.8[35] | 31.3 | - | - | ||
| BL-4 | 10.9[35] | 11.0 | - | - | ||
| METEOR | 15.1[35] | 14.0 | - | - | ||
| Rouge-L | 28.3[35] | 26.5 | - | - | ||
2.2 Disease Classification
We explore two types of classification tasks: disease entity classification and attribute classification. The entity classification task focuses on classifying disease categories, while the attribute classification task determines the disease attributes, e.g., location and severity. As illustrated in Table 1, we evaluate the disease entity classification task on the ChestXray14 and RSNA Pneumonia datasets with both direct inference and fine-tuning settings. Compared to the previous best results, Our model shows improvements of 0.8% in AUC and 1.8% in F1 for the ChestXRay14 dataset, with improvements of 1.5% in AUC and 1.1% in F1 for the RSNA Pneumonia dataset with direct inference setting, in comparison to models explicitly trained for each classification task. We further conduct the fine-tuning experiments and notice the average results of various methods are similar when models are fine-tuned with 50 samples for each finding on the target dataset. Figure2(a) further shows the detailed distribution of F1 results for 26 different disease entities that are aligned with the long-tail distribution on the MIMIC-CXR dataset. Additionally, our model attains high F1 scores across the diseases in the attribute classification task. For instance, the severity classification ACC for Effusion and Pneumothorax reaches 65.6% and 65.9%, respectively, with an average of 59.2% for seven diseases with attribute descriptions.
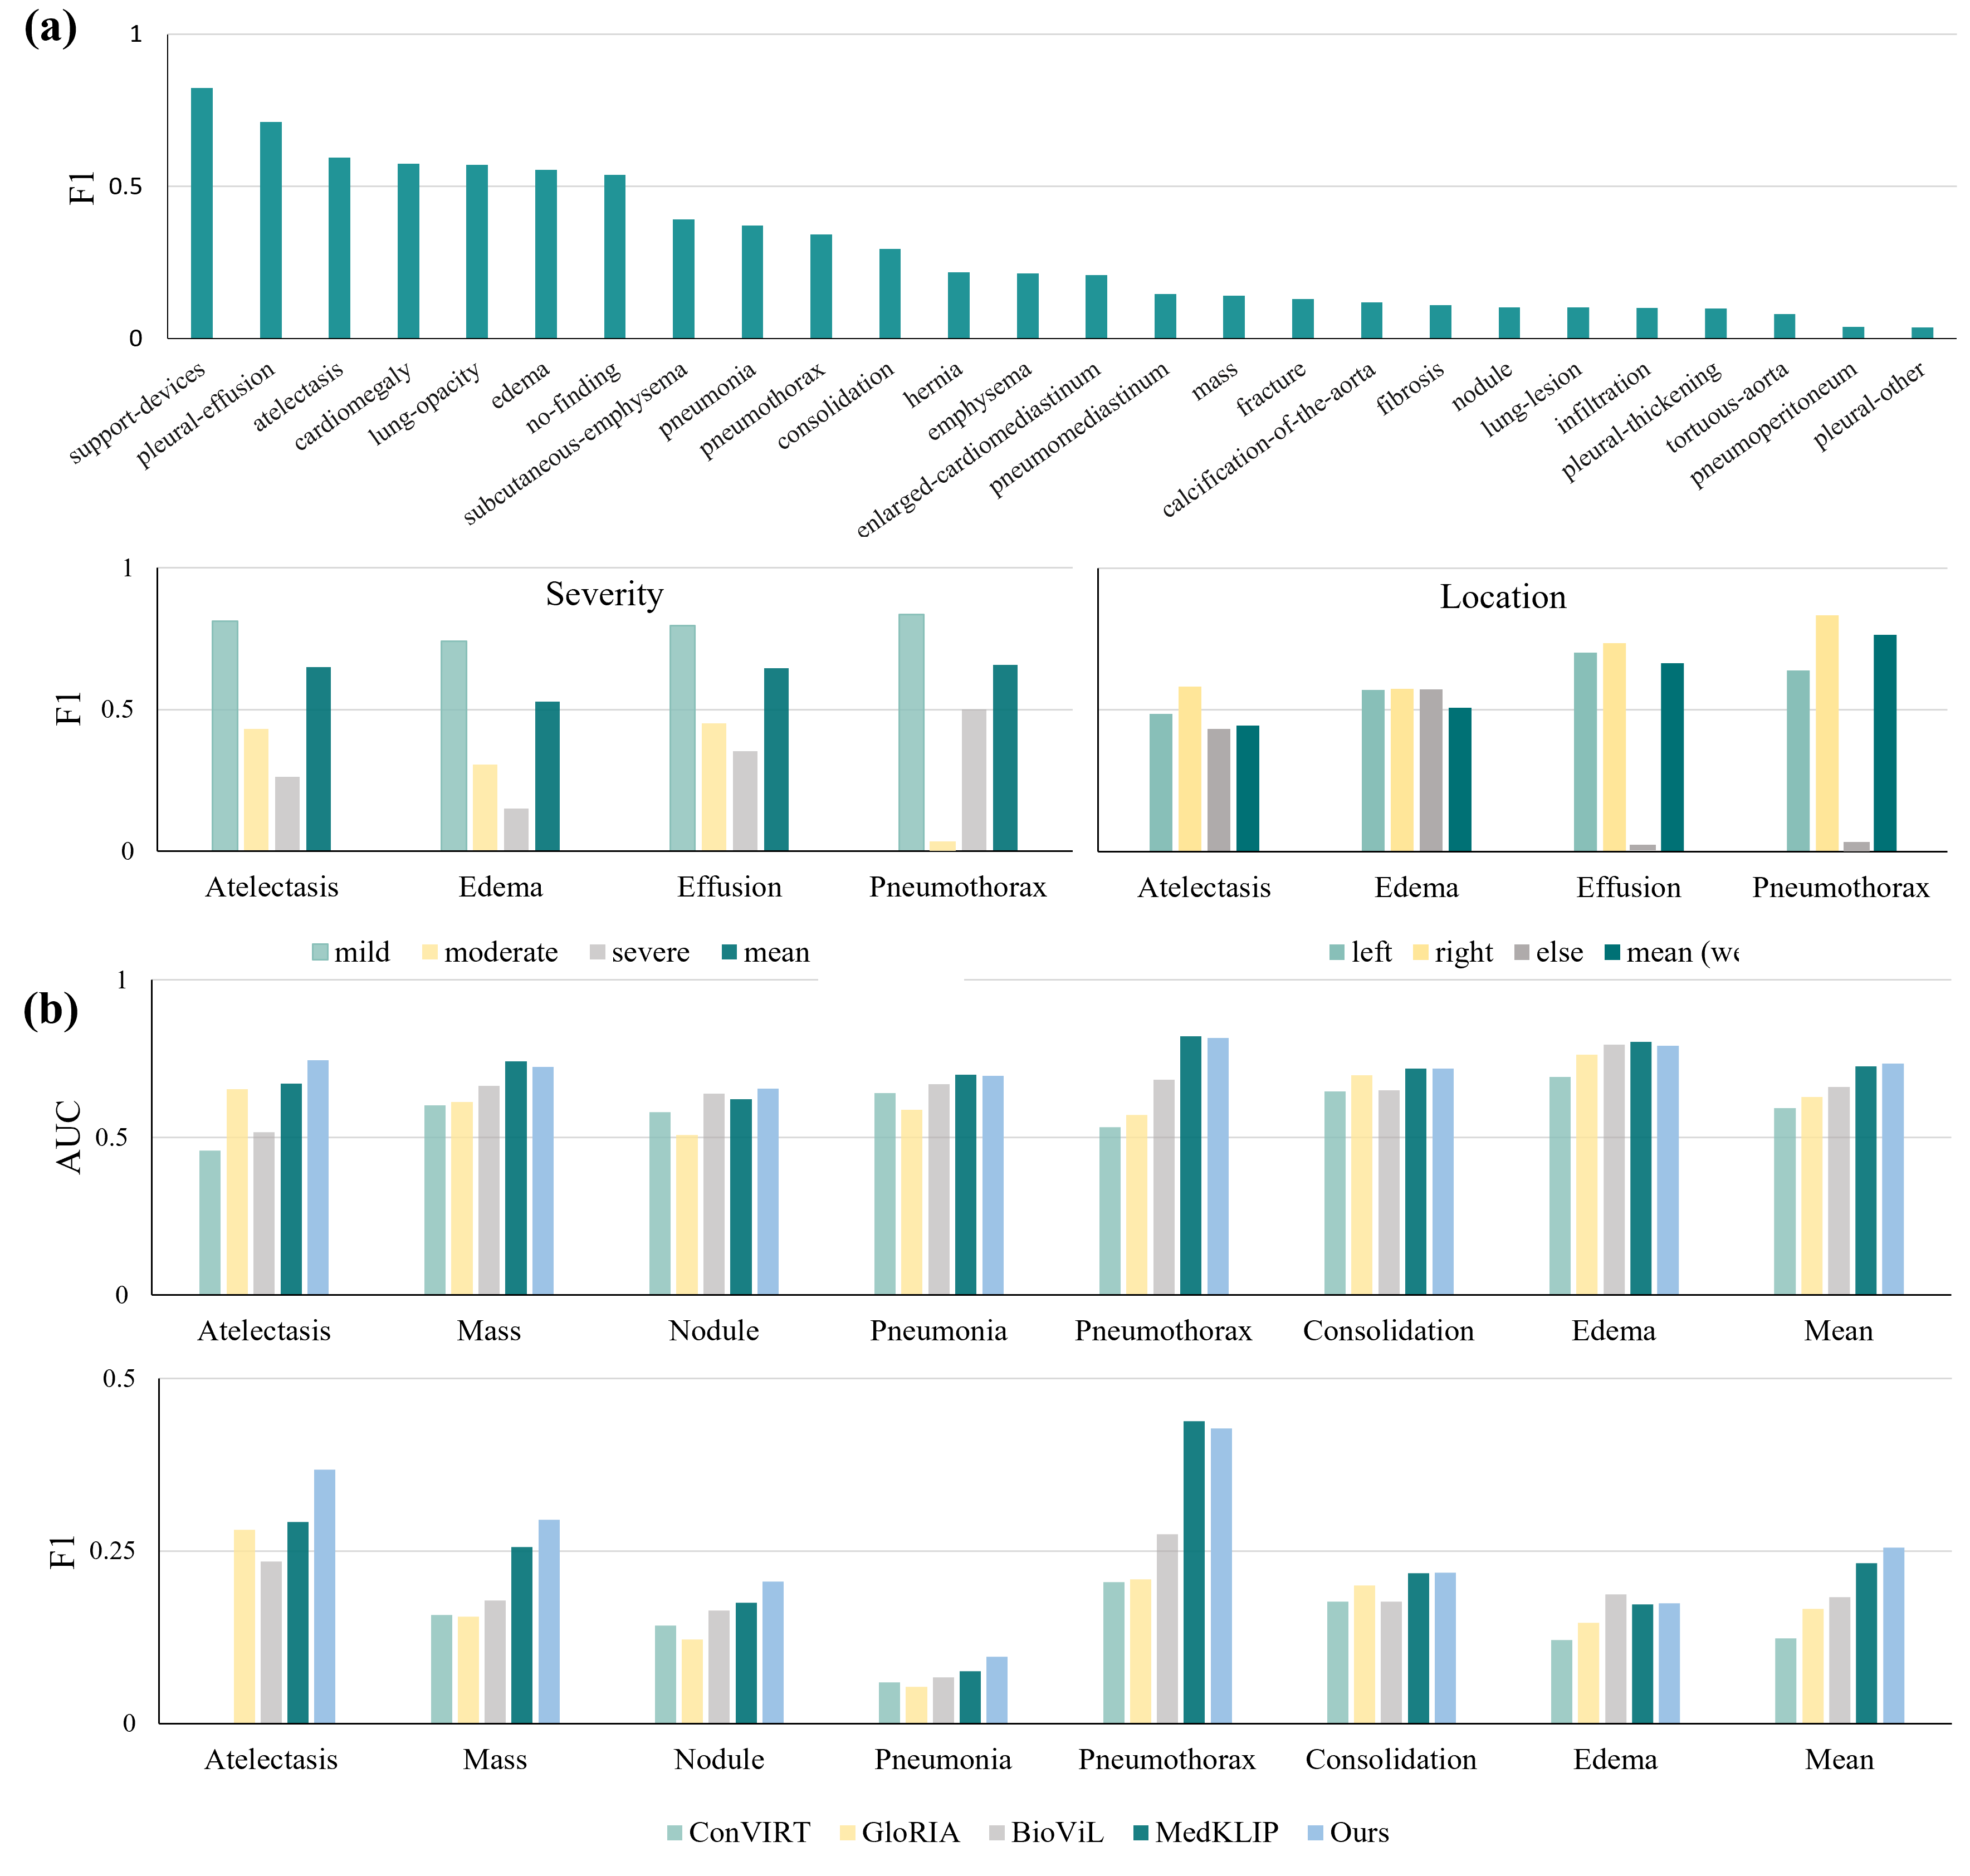
When evaluating the domain-shifted ChestXray14 dataset, our method achieves SOTA results on eight diseases (i.e., Atelectasis, Mass, Nodule, Pneumonia, Consolidation, Fibrosis, Pleural Thicken, and Herina) shown in Figure 2(b). For instance, our method achieves an AUC and F1 of 74.5% and 36.8% for Atelectasis and 65.5% and 20.6% for Nodule, respectively. These results surpass the previous best results, demonstrating the effectiveness of our method in accurately identifying and localizing relatively small abnormalities in Chest X-ray images.
2.3 Disease Localization
We herein conduct extensive experiments on MS-CXR, ChestXray14, and RSNA Pneumonia datasets to evaluate disease localization under both direct inference and 20-shot fine-tuning settings. Under the direct inference setting, our model generally achieves the best performances over all existing visual-grounding models. As shown in Table 1, OmniFM-DR gets an average ACC of 56.7%, 46.5%, and 42.7% on the ChestXray14, MS-CXR, and RSNA Pneumonia datasets respectively, surpassing other methods by a large margin, 7% to 25%. When fine-tuned on the downstream dataset with 20 shots for each label, OmniFM-DR consistently scores the highest ACC of 61.5%, 54.7%, and 55.0% on the three datasets.
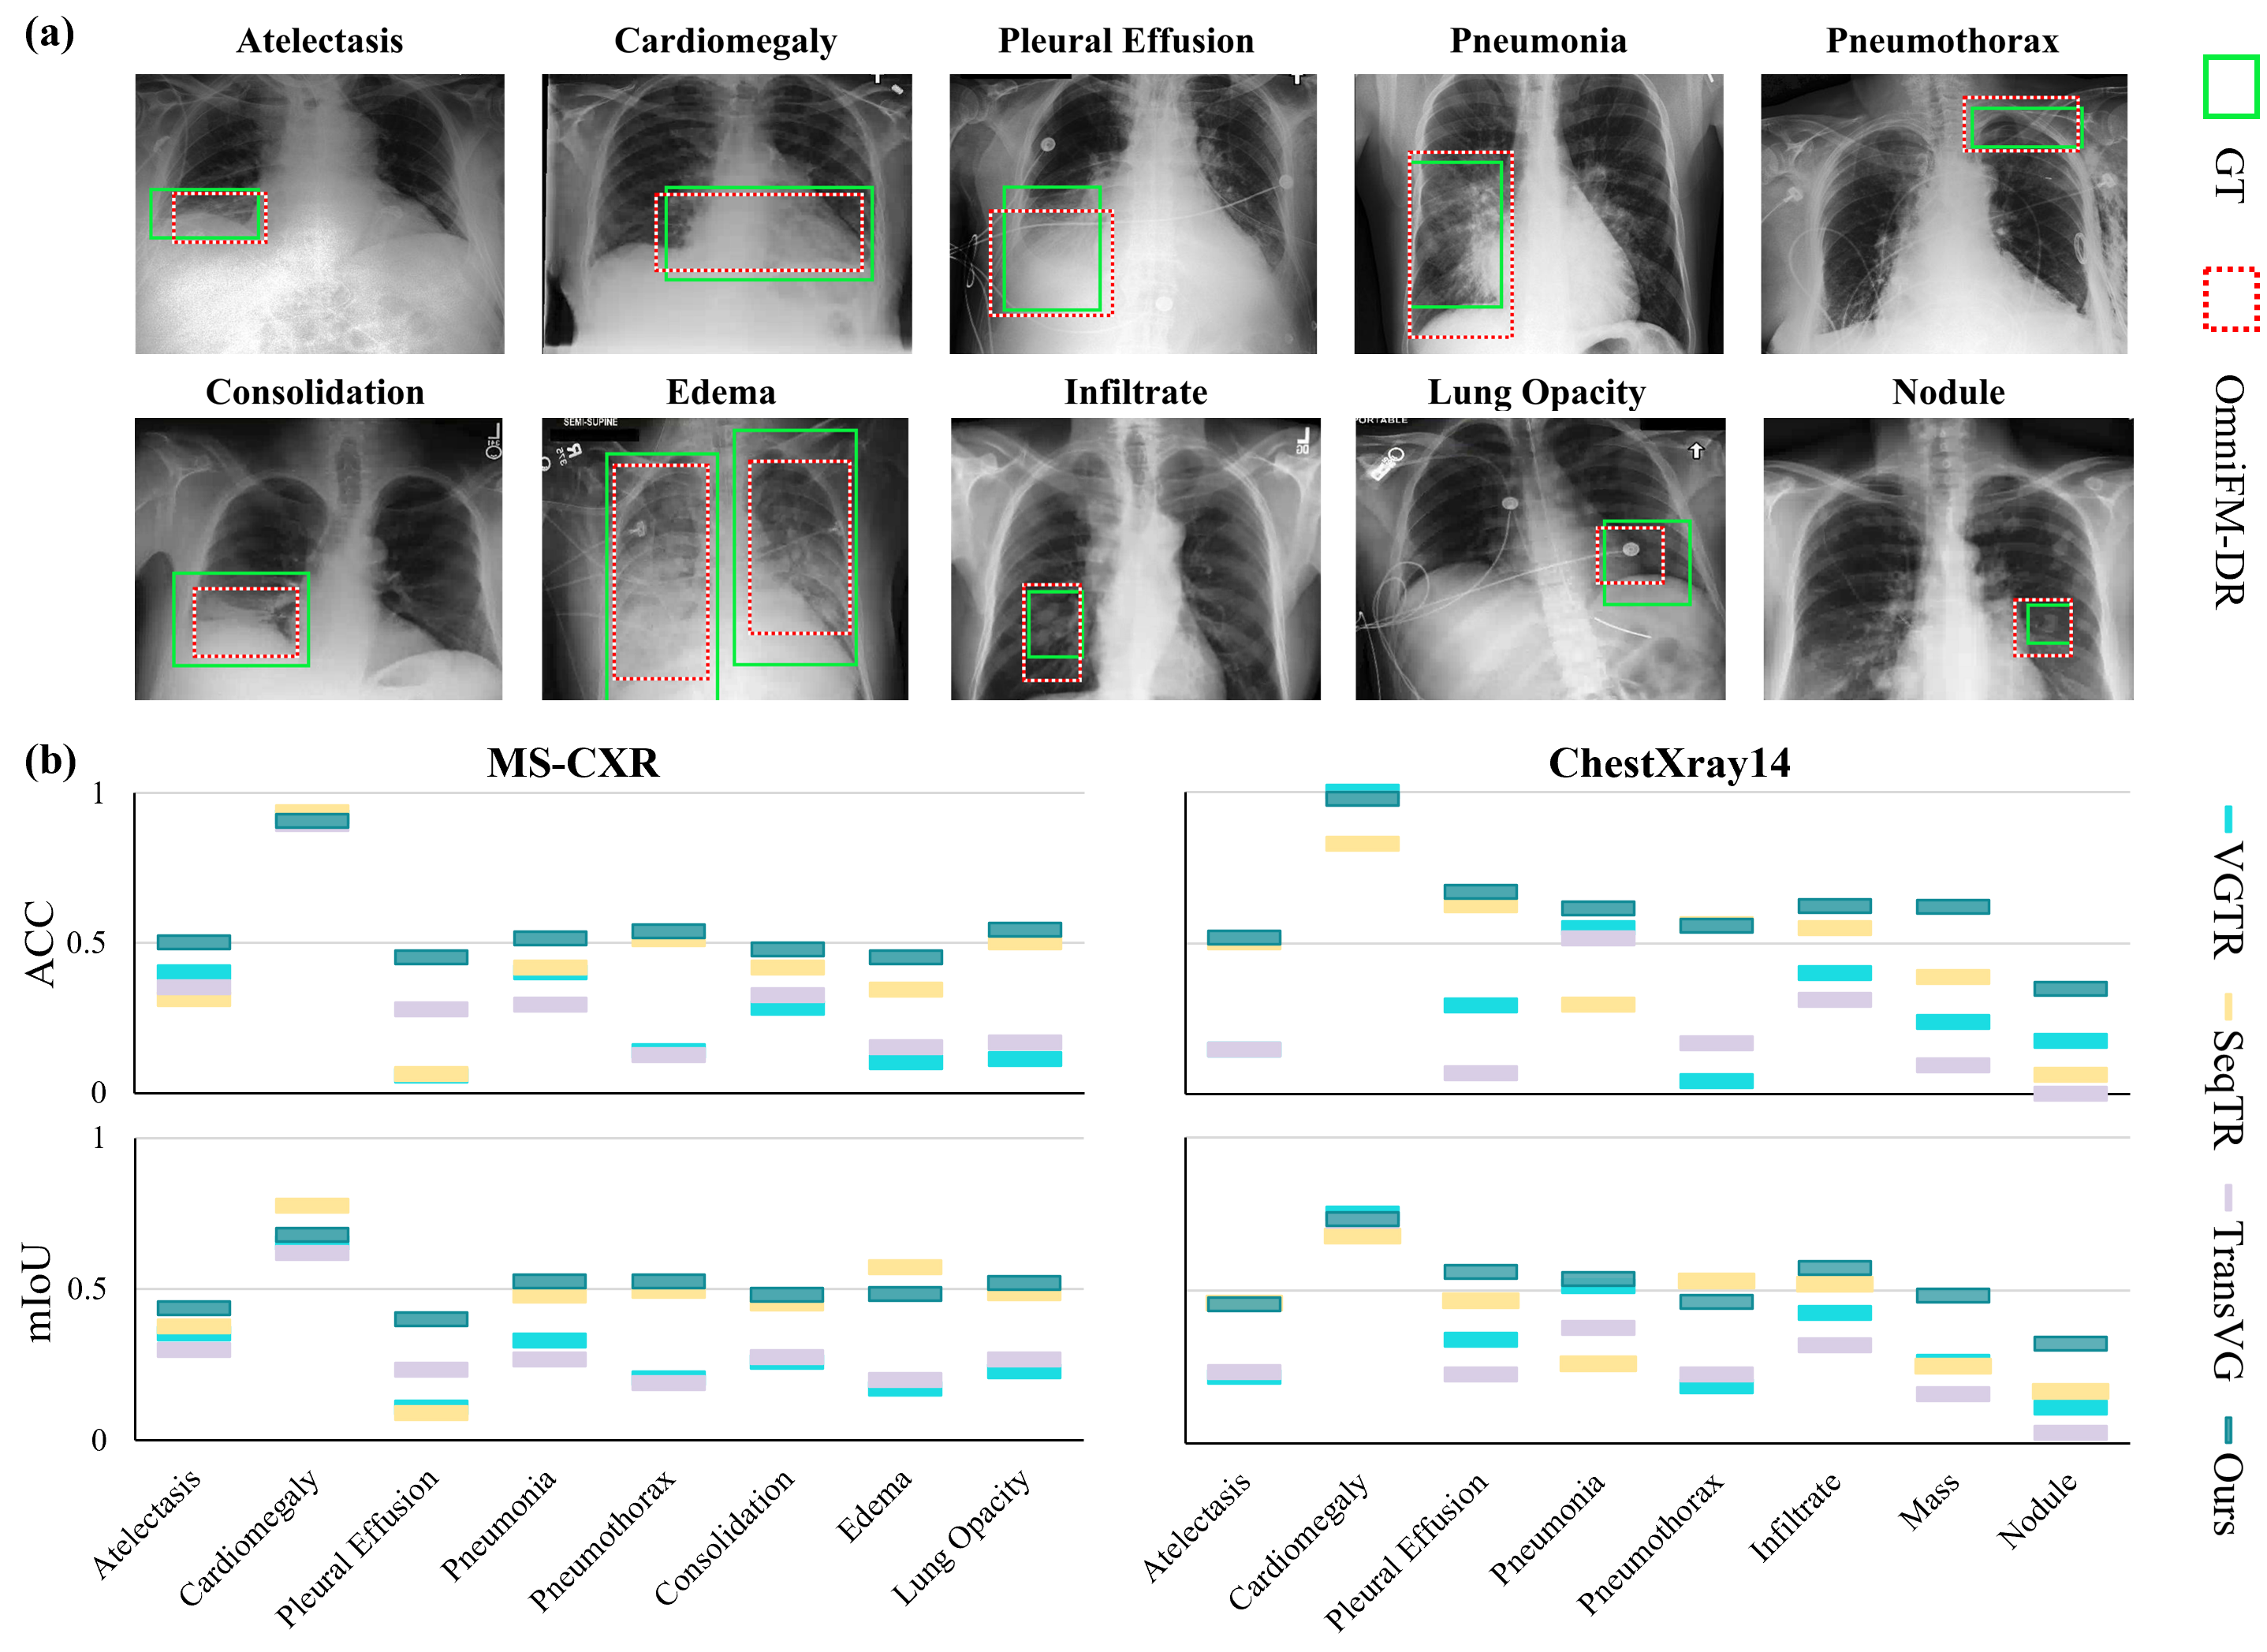
Figure 3 further presents the model’s capability of disease localization across multiple diseases and comparations of OmniFM-DR against three approaches (i.e., VGTR, SeqTR, TransVG) on MS-CXR and ChestXray14 dataset with fine-tuning setting. The two datasets share five common diseases: Cardiomegaly, Effusion, Pneumothorax, Atelectasis, and Pneumonia. Moreover, the MS-CXR dataset comprises three additional diseases (i.e., Consolidation, Edema, and Opacity), while the ChestXray14 dataset includes Infiltrate, Mass, and Nodule. It is observed that OmniFM-DR is capable of accurately identifying disease locations across multiple diseases. Furthermore, the model consistently achieves large advantages over other approaches for most disease categories. For seven of eight diseases on the MS-CXR dataset, OmniFM-DR gets significantly higher ACC and mIoU than the best-performing baseline, with the largest improvements in Pleural Effusion (>15%). Supplementary Table 2 further provides detailed comparisons of the eight diseases among OmniFM-DR and other approaches.
2.4 Segmentation
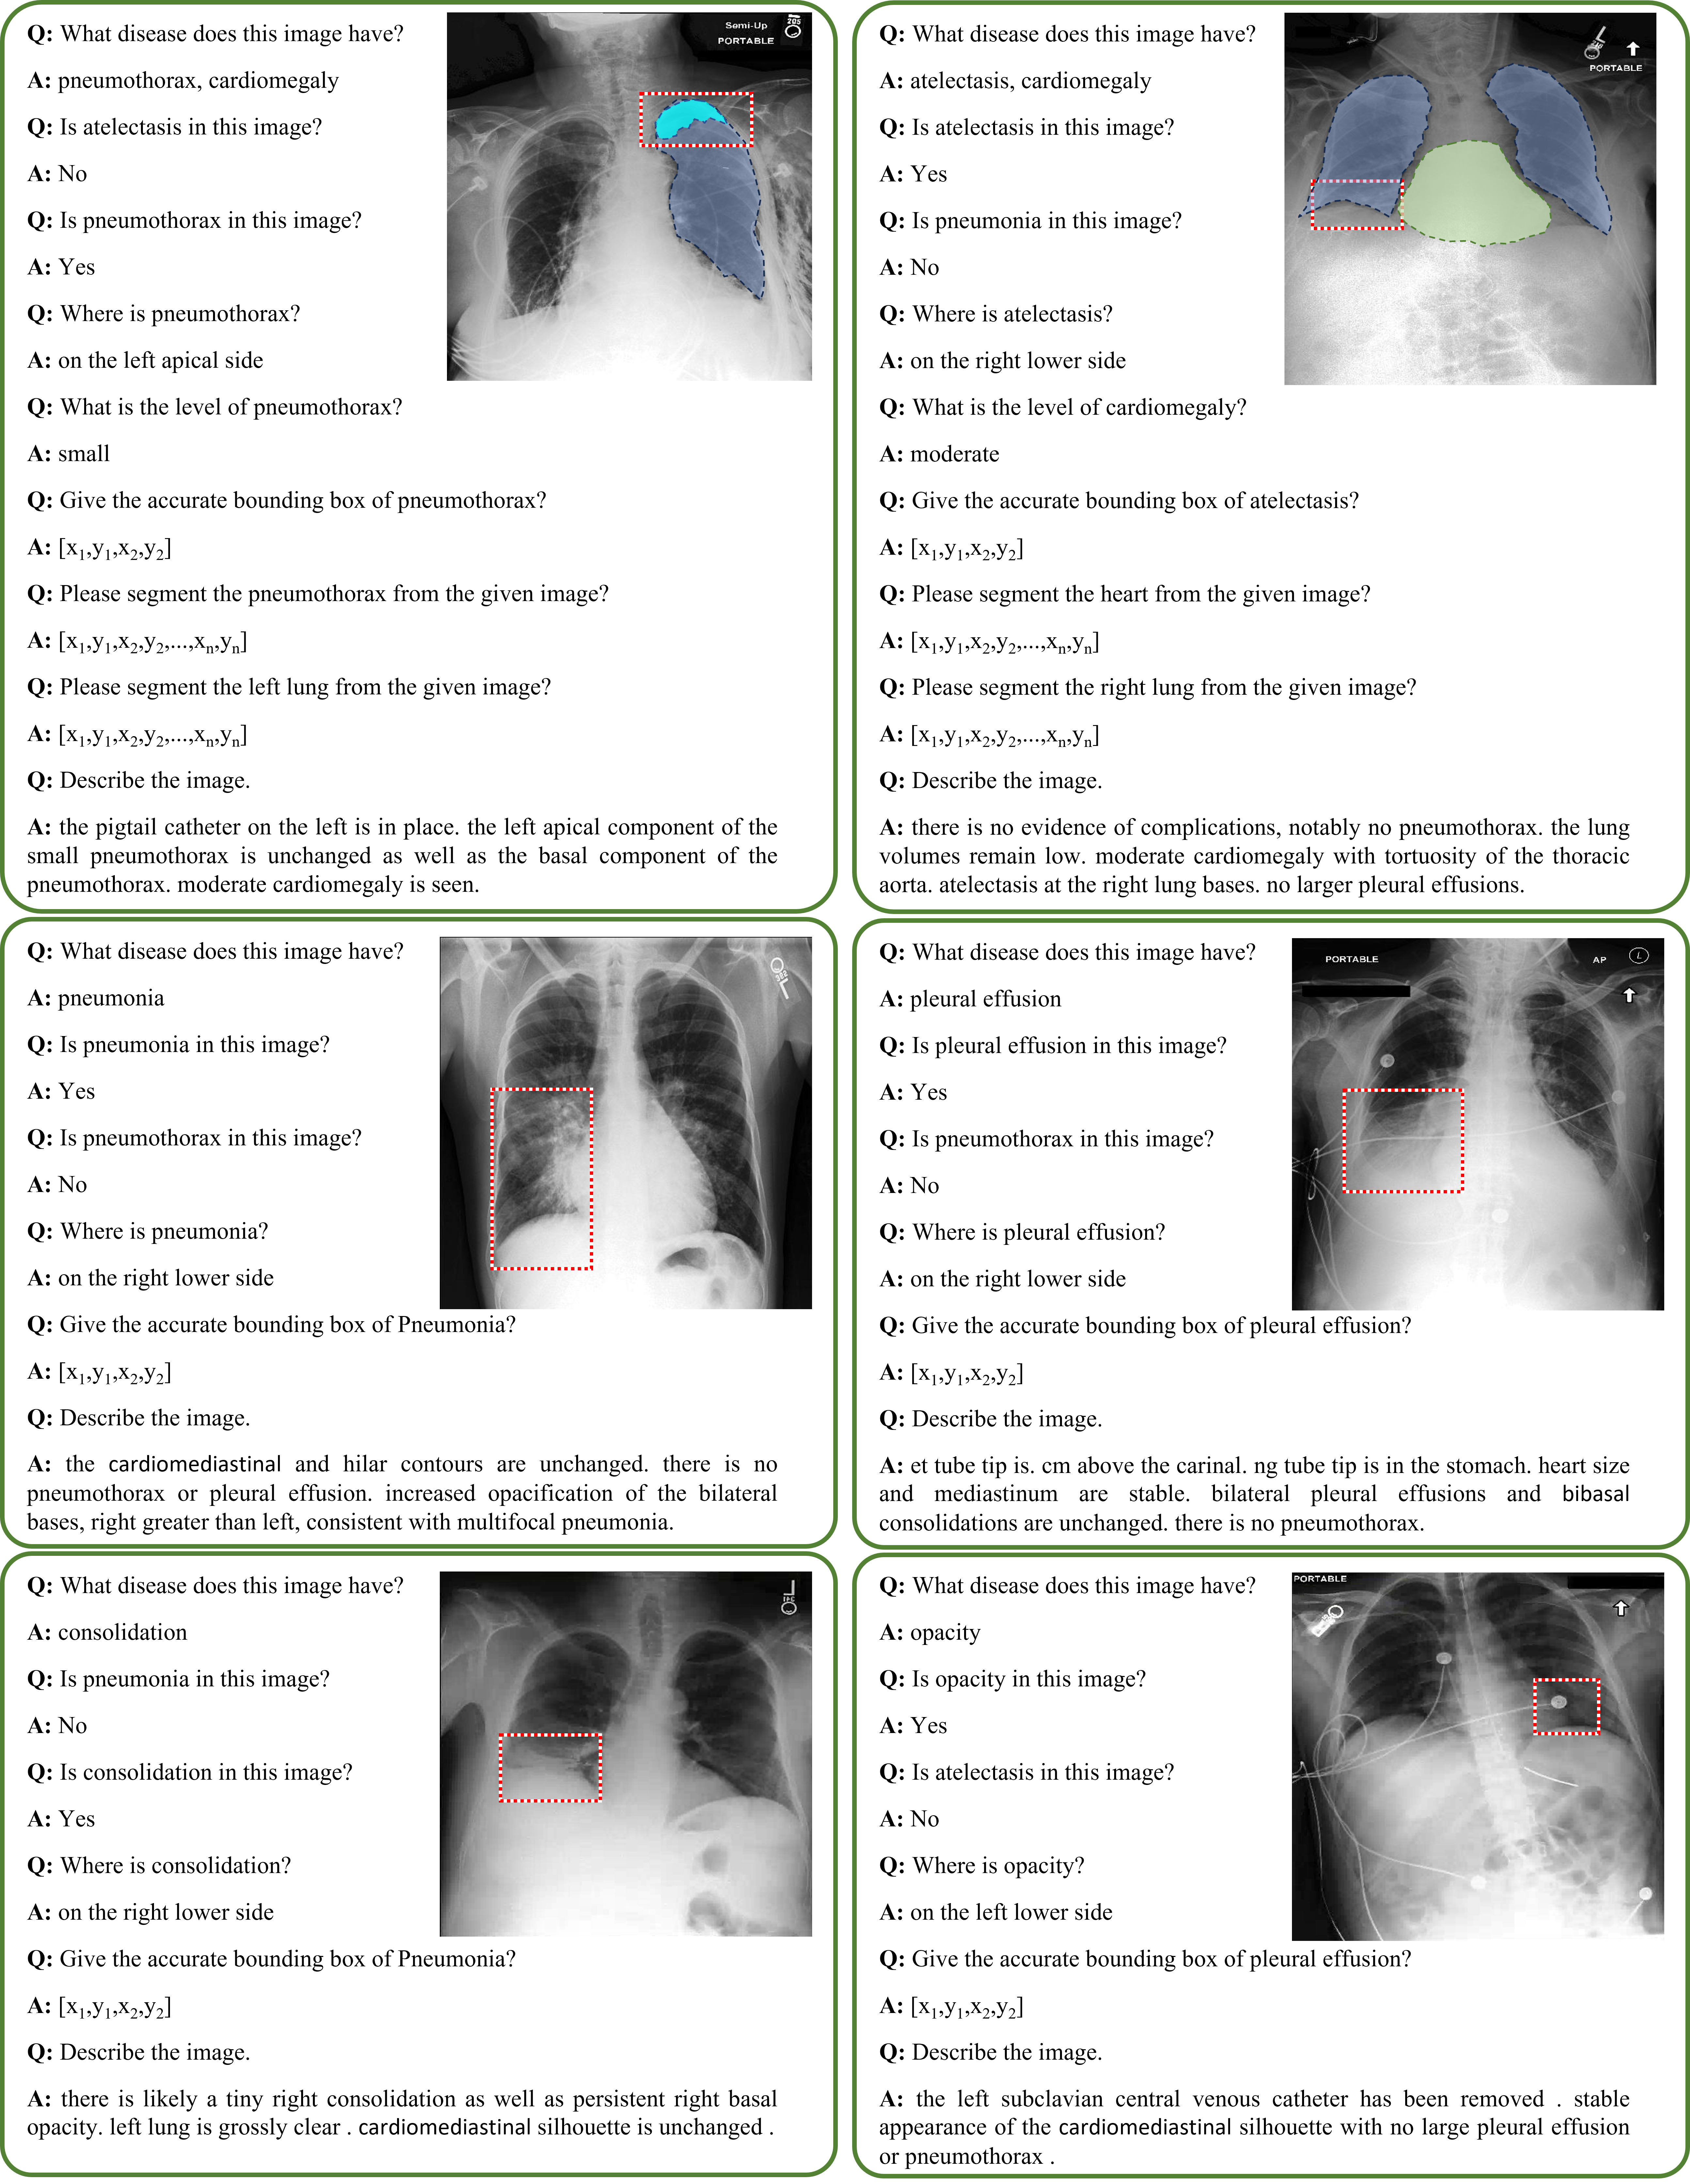
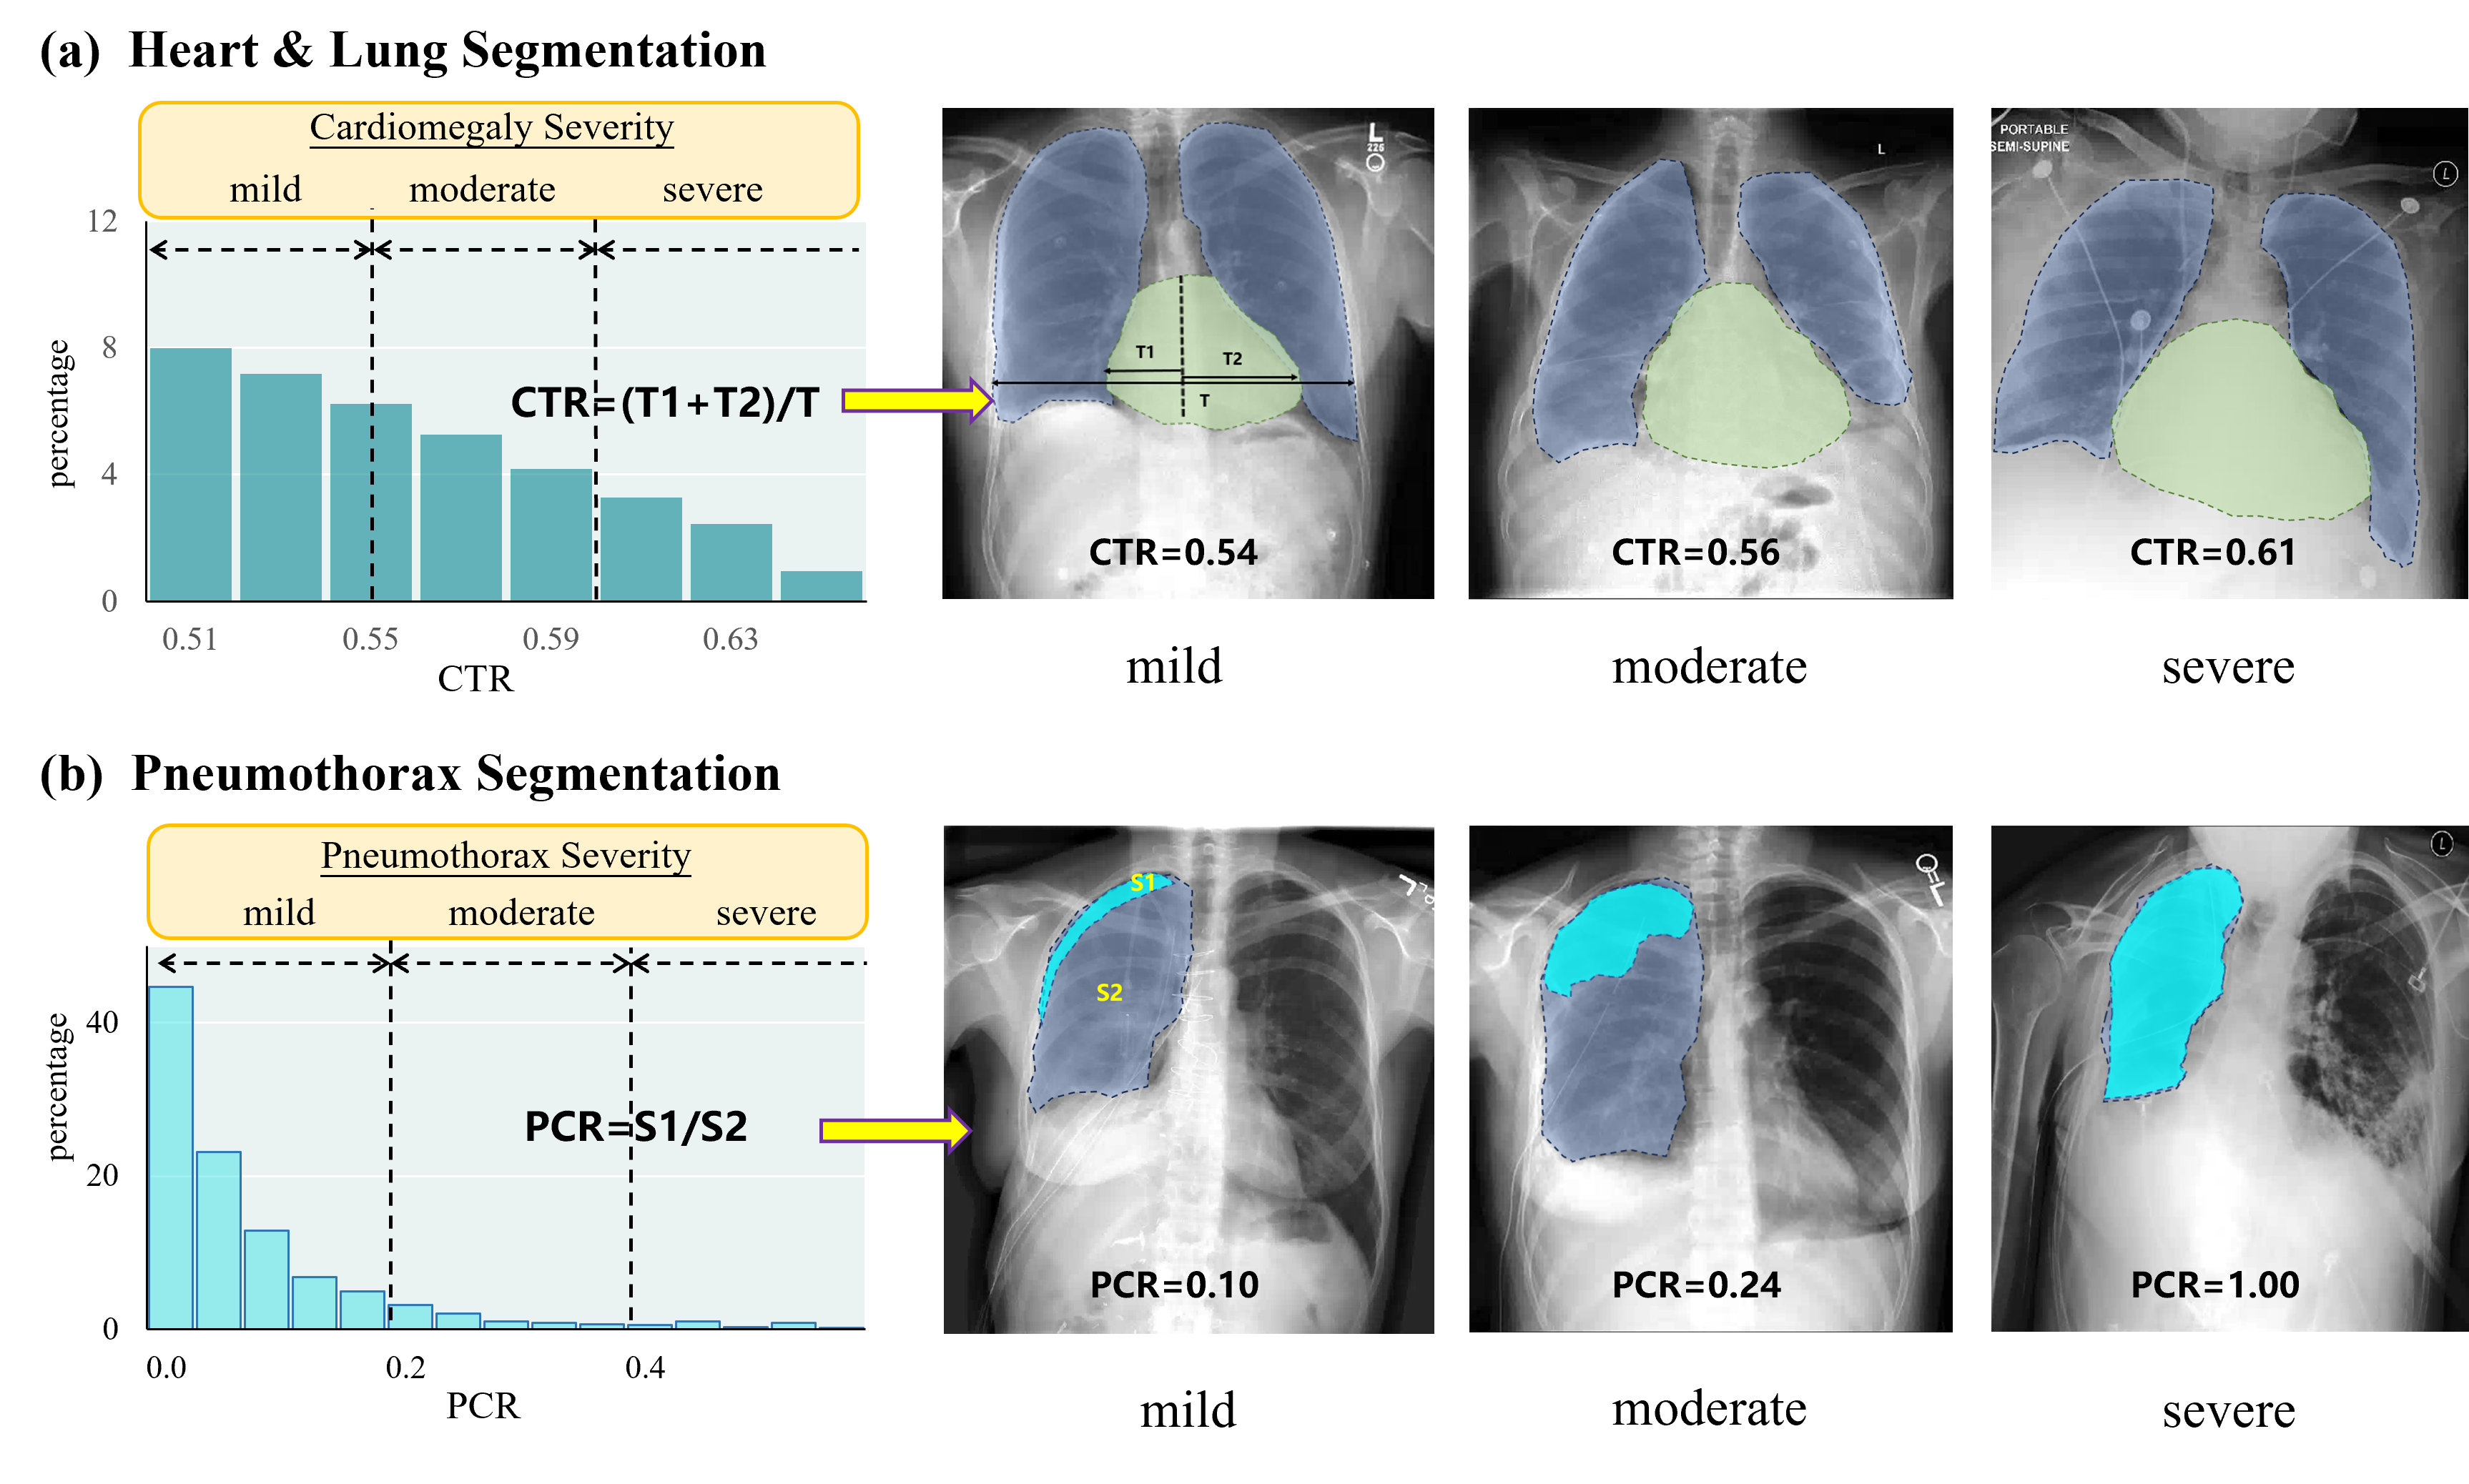
We adopt a polygon-based contour representation for the segmentation task to achieve a uniform input-output format with other tasks, i.e., predicting a list of polygon vertexes instead of region masks. As shown in Table 1, the Dice coefficient is utilized for evaluating the segmentation of lung and cardiac contours. Our unified model is comparable to pixel-based segmentation methods. To assess the severity of cardiomegaly and pneumothorax in potentially more detailed analyses, we perform post-processing on the segmented lung and cardiac masks to calculate the cardiothoracic ratio (CTR) and pneumothorax ratio (PCR). CTR is calculated as the ratio between the maximum transverse diameter of the heart and the chest, commonly used to evaluate the cardiomegaly severity as mild, moderate, or severe. The area method is used to calculate the PCR, which is represented by the ratio of the pneumothorax area to the affected lung area. Figure 4 illustrates the segmentation results of cardiomegaly and Pneumothorax with different severity. We observe that the overall performance of lung and cardiac contours is satisfactory across different CTR (see Figure 4(a)). Furthermore, Pneumothorax exhibits significant variations in location and size (see Figure 4(b)). For more accurate segmentation of mild pneumothorax, we incorporate a segmentation head with a U-Net decoder and achieve a Dice value of 59.4% and 65.0% under direct inference and fine-tune settings.
2.5 Report Generation
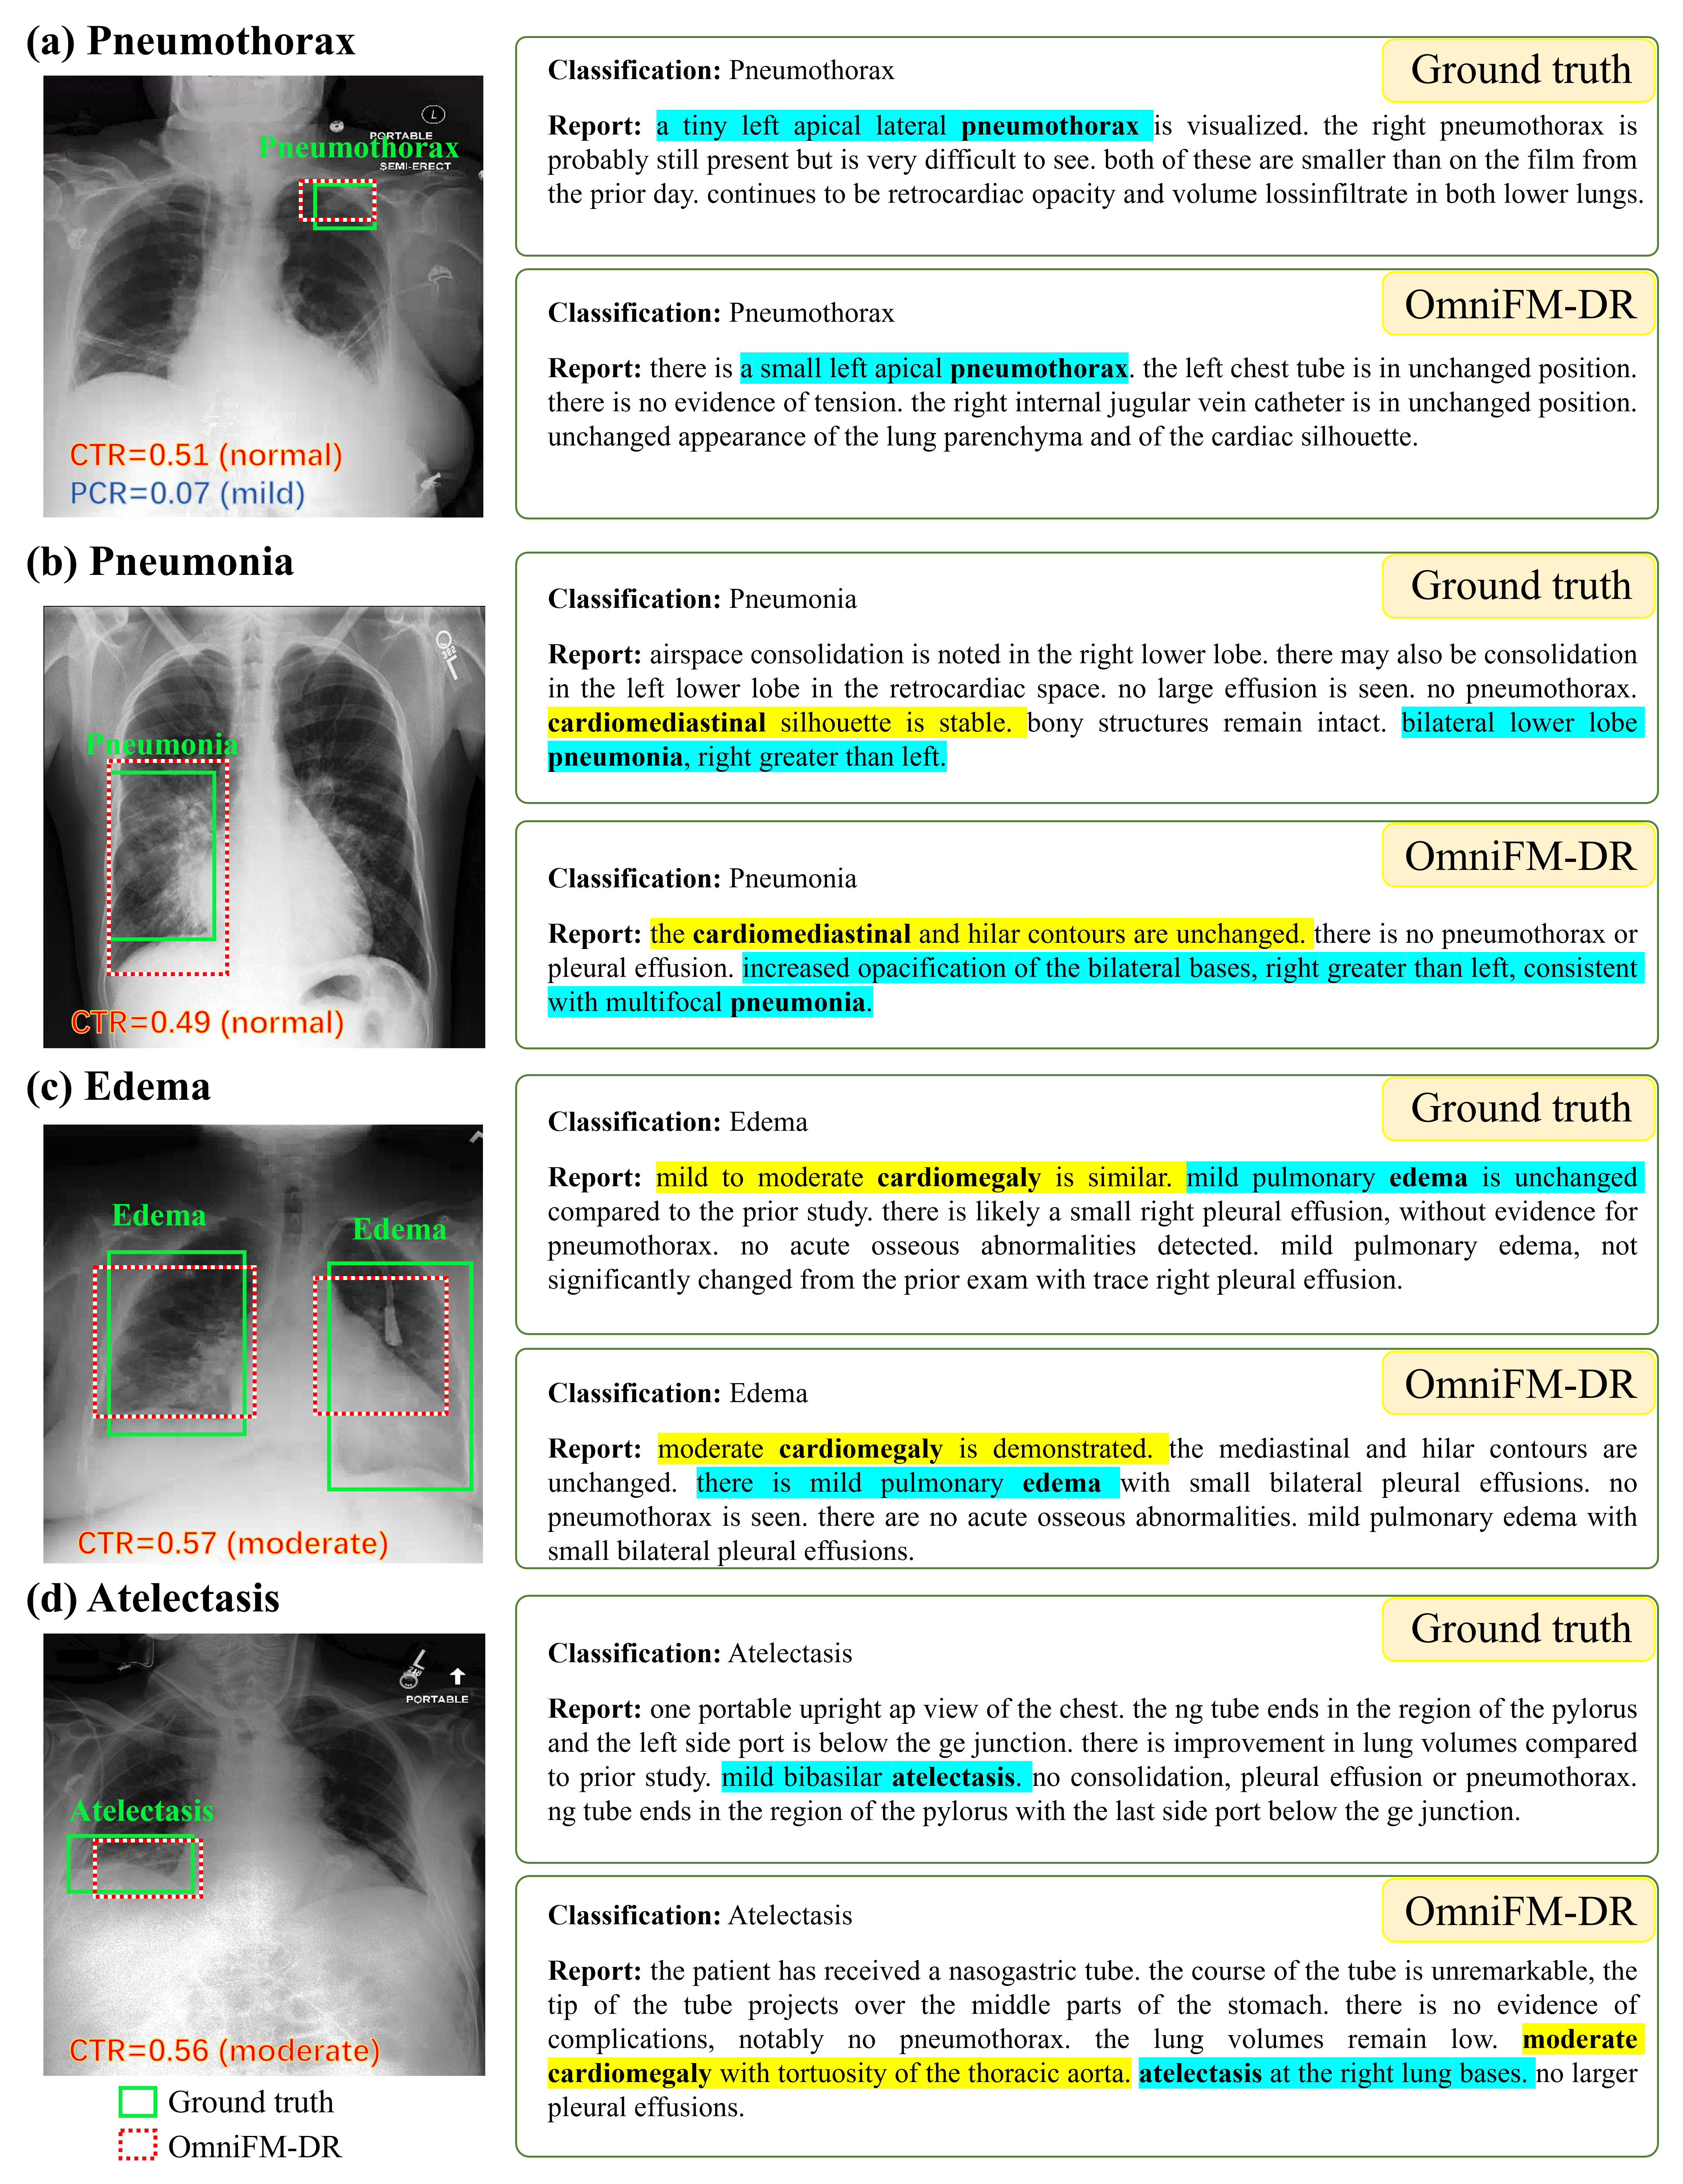
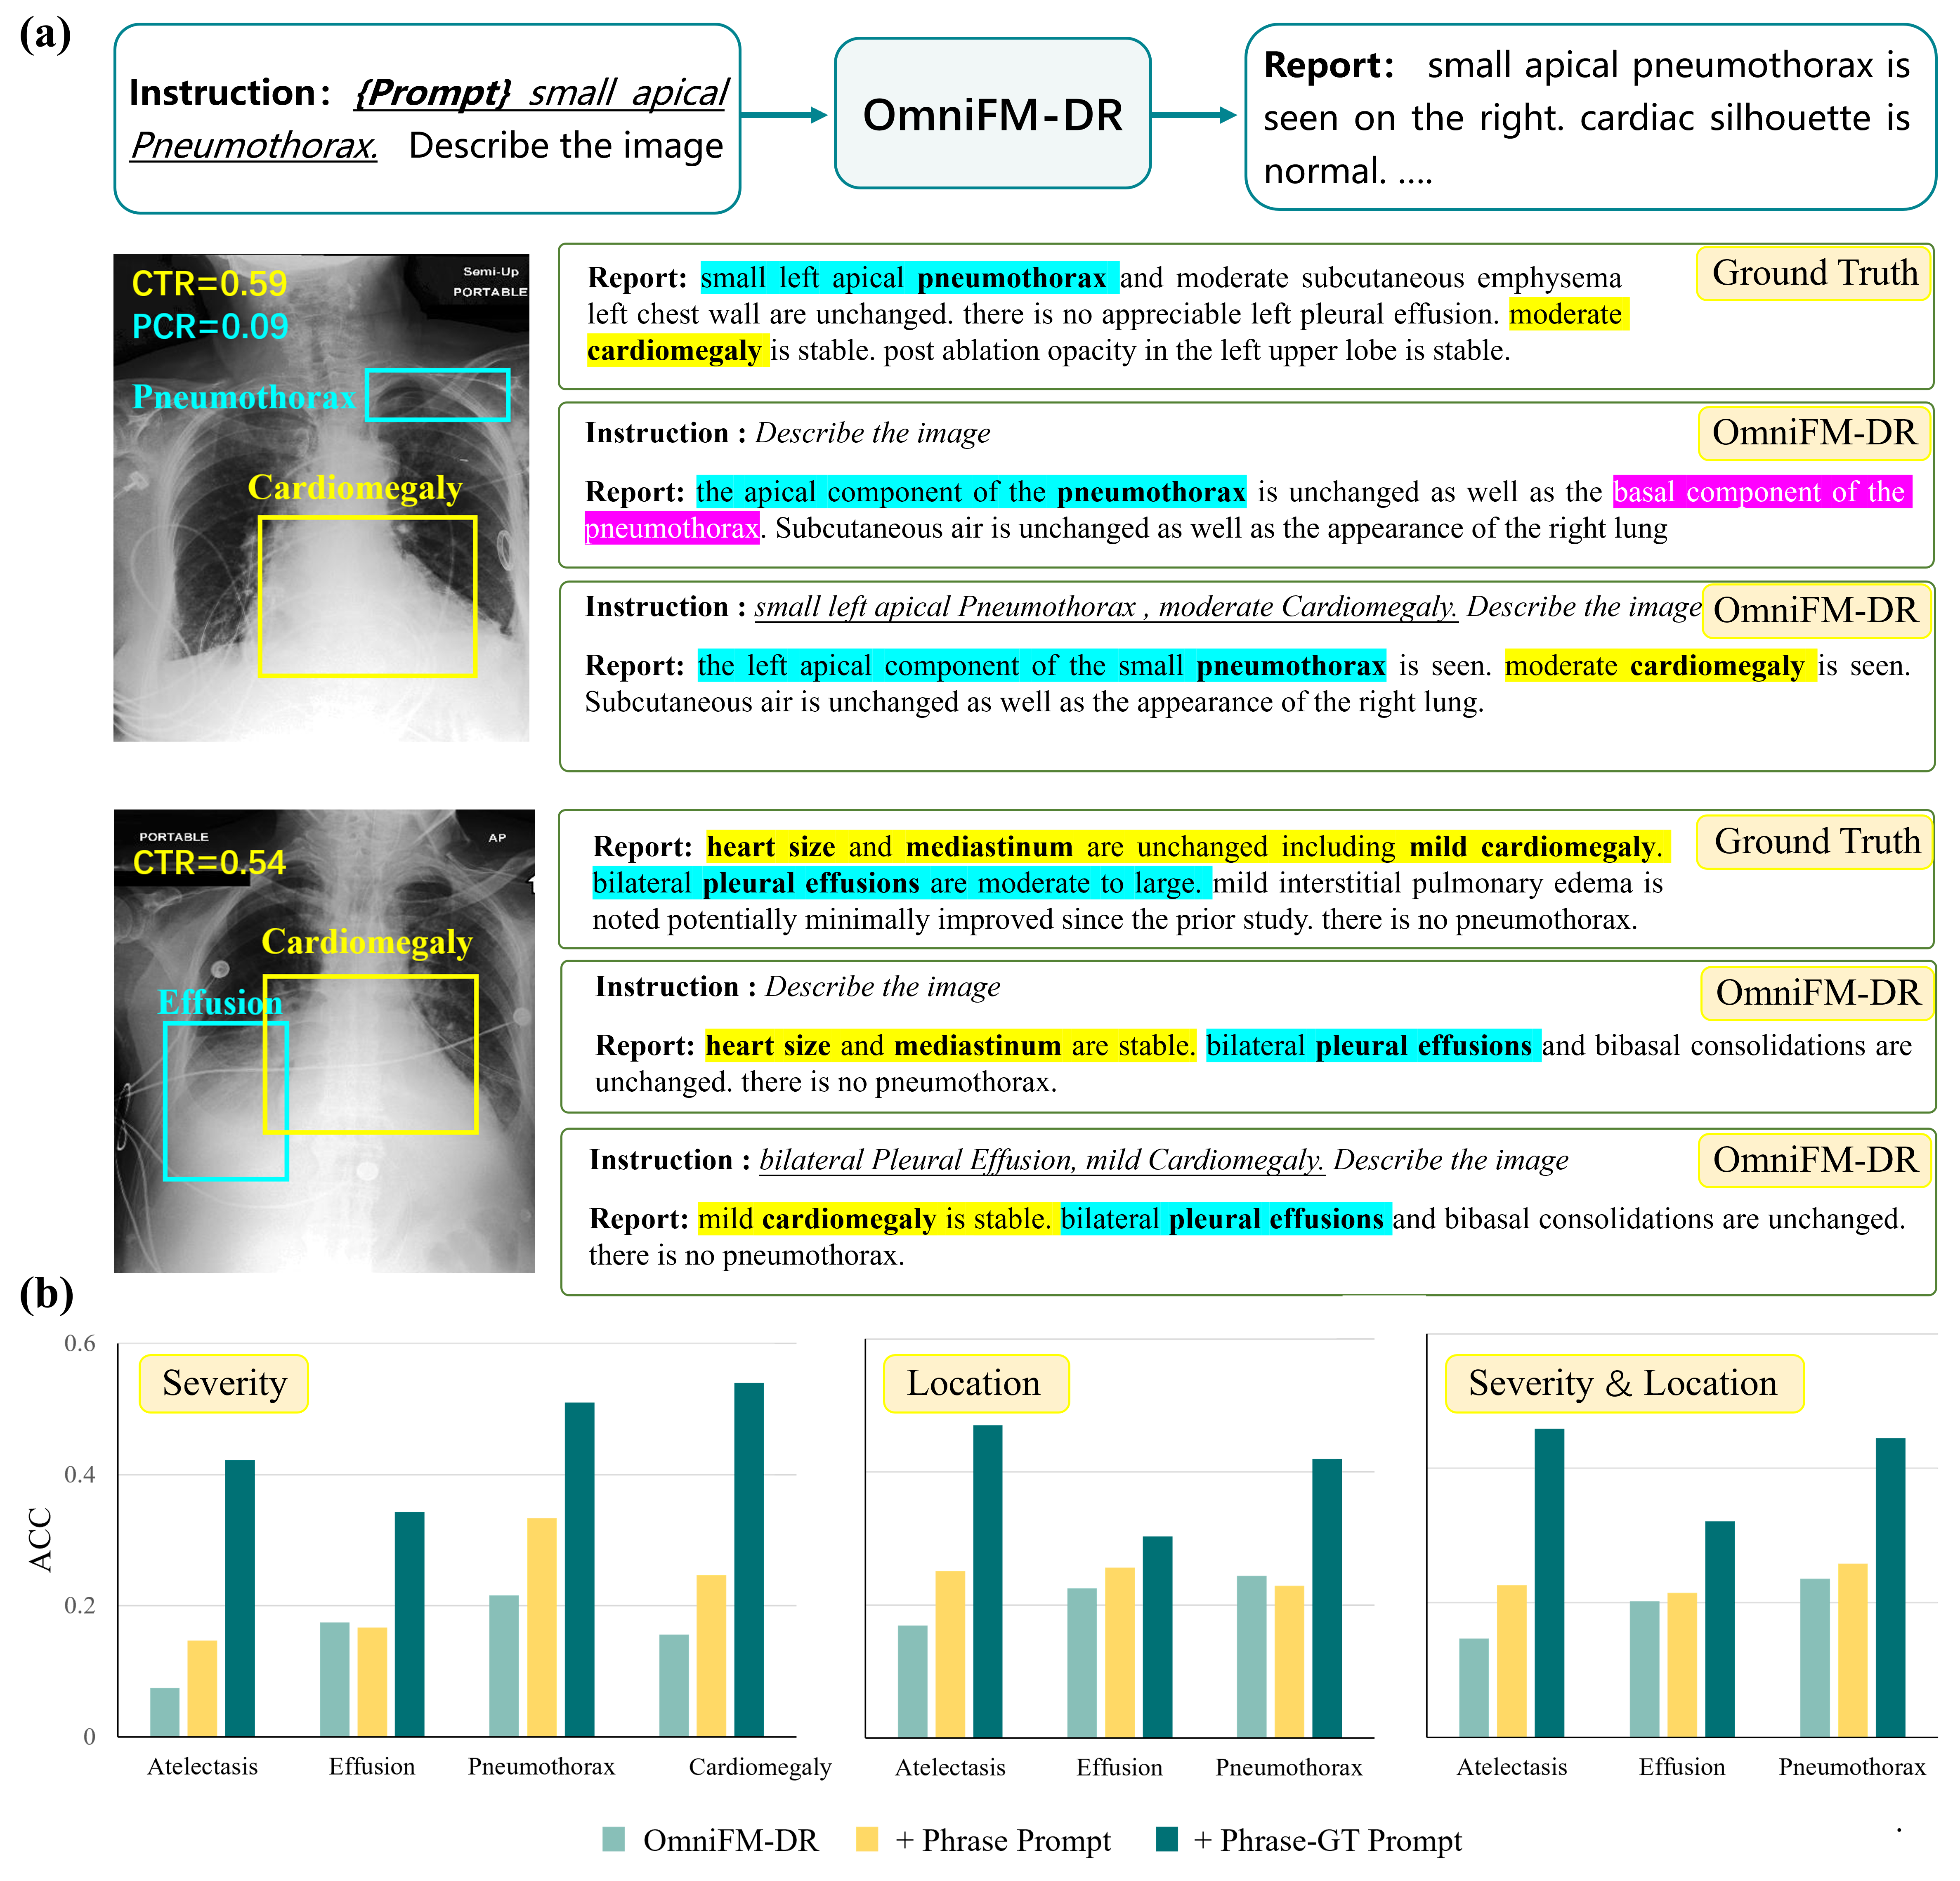
As the summary of the radiological reading process, reports contain major findings and possible disease diagnoses from the radiologists. As the unique feature of our proposed framework, we hypothesize adding pre-generated evidence could significantly improve the quality of AI-generated reports. Figure 5 demonstrates this quality improvement with the disease attributes prompt. During the inference stage, the customized prompt is initially derived from the classification task, including disease entity, severity, and rough location. The disease attribute prompt will be updated when a more accurate boundary box or severity of Pneumothorax/Cardiomegaly is available from the disease localization or segmentation task. The generated reports of typical cases of Pneumothorax and Pleural Effusion are provided in Figure 5(a). The proposed model is capable of identifying the diseases with an accurate disease localization box and generated report. Detailed descriptions of pneumothorax entities and attributes such as "small left apical pneumothorax" are highlighted by blue text in the ground truth report and are well predicted in the generated report. The location and severity information of Pneumothorax is further verified by the boundary boxes and calculated metric (i.e., PCR). On the other hand, the descriptions of disease attributes (e.g., "small" of pneumothorax, "moderate cardiomegaly") are omitted in the generated report without proper prompt. For the Effusion case, we also find the importance of proper input prompts in the task of report generation. The descriptions of pleural effusion and cardiomegaly are more detailed and accurate in the generated report with prompt. The boundary box of pleural effusion and mild cardiomegaly is indicated by the disease localization and segmentation task (i.e., CTR=0.54). With more specific prompts, the generated report shows accurate descriptions as "bilateral pleural effusion, no pneumothorax, and mild heart size." In contrast, the general model without the designed prompt provides an inaccurate assessment of cardiomegaly, as described as "stable heart size."
Figure 5(b) further compares the accuracy of three different conditions (i.e., baseline, with phrase prompt, and with phrase-GT prompt). With the help of disease attributes prompt, the accuracy of severity and location description is improved across multiple diseases such as Atelectasis, Pneumothorax, and Cardiomegaly. The proposed method surpasses the baseline in accuracy by 9% for the severity (see details in Supplementary Table 3). When the ground truth disease phrase is utilized as the prompt, we find the quality of the report improved further as an upbound for our model.
Subjective Comparison Study To assess the clinical interpretation, radiologists’ evaluations are employed to examine the quality of radiology reports. This side-by-side comparison study focuses on errors associated with the presence, location, and severity of clinical findings. Non-clinical errors, such as referring to views or previous studies that do not exist, are excluded from our evaluation.
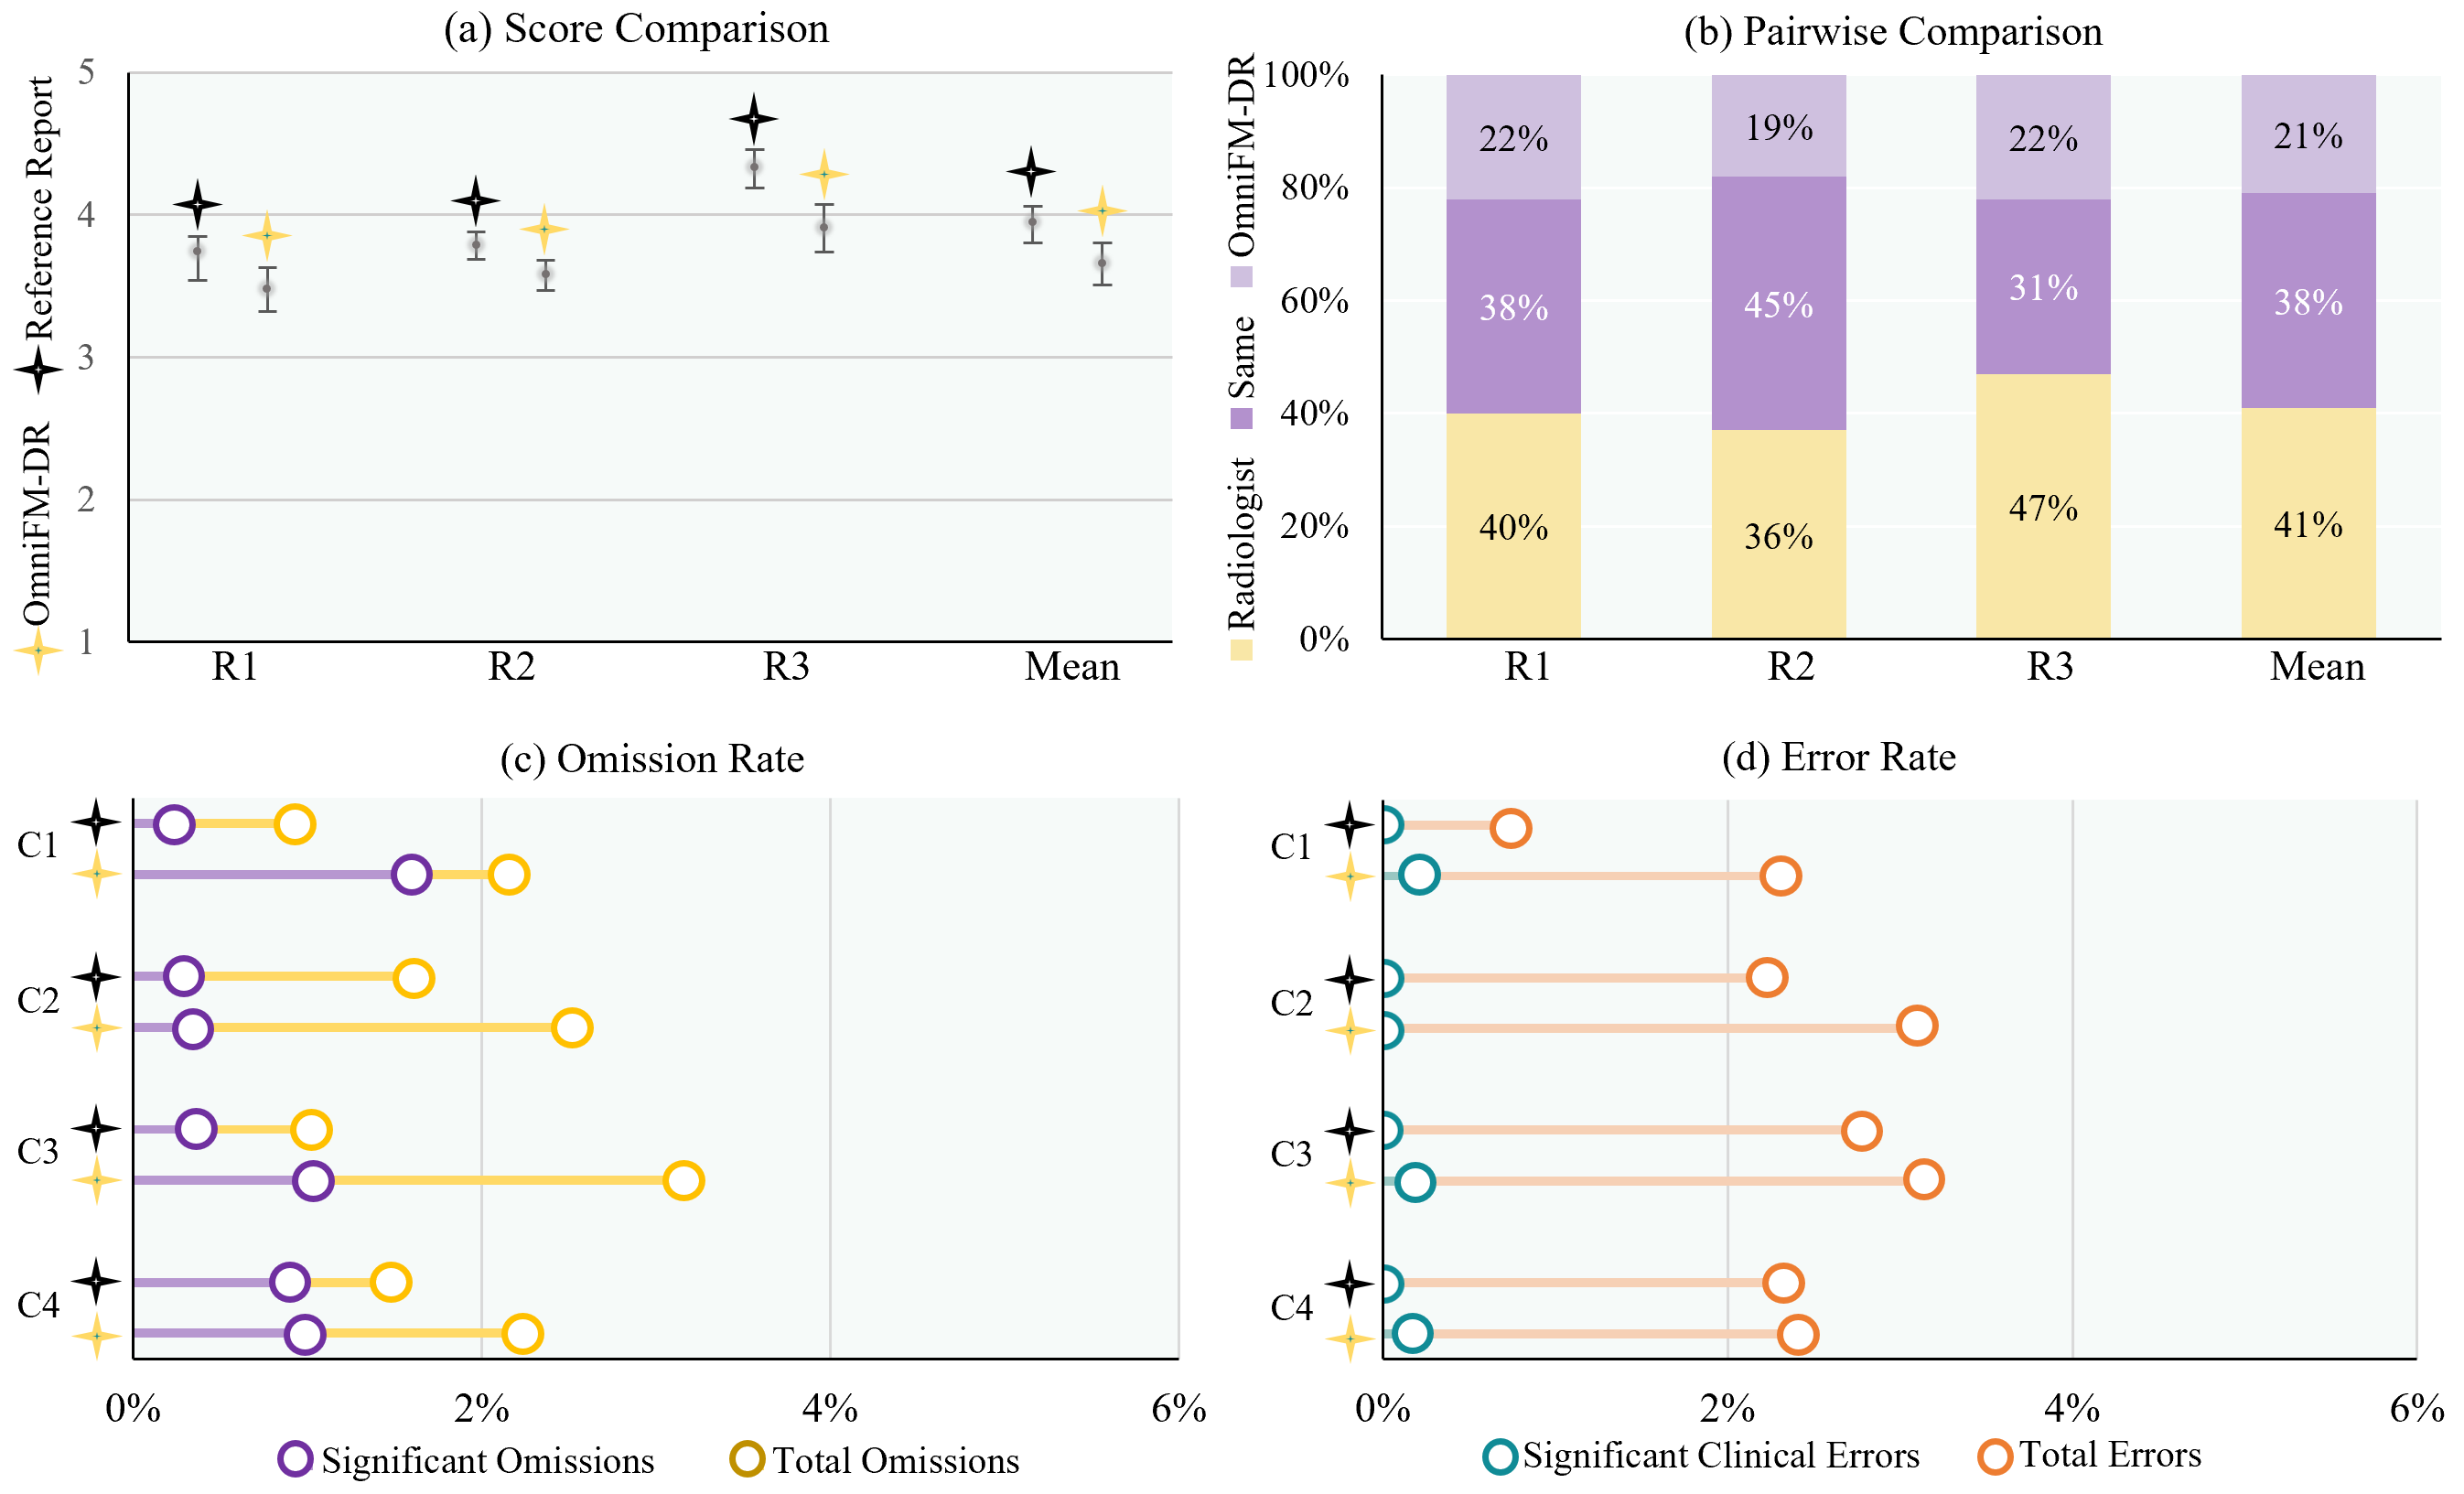
Figure 6(a) presents the average score comparison result from three radiologists. The average ratings for the radiologist-provided reference reports and generated reports are 3.74/3.48, 3.79/3.58, and 4.33/3.91, respectively. The average result across three radiologists is 3.95 (95% CI, 3.47-4.05)/3.65 (95% CI, 3.38-3.91), indicating that the quality of the generated reports is comparable to the reference reports. Figure 6(b) presents the pairwise comparison result, three radiologists believe that the quality of generated reports is equal to or even better than the original reports by 60%, 64%, and 53%, respectively. Despite the observed fluctuations in results across radiologists, the collective analysis suggests that our generated reports exhibit a comparable level of quality to the original reports generated by medical professionals.
In the detailed evaluation, omission rate refers to missed disease diagnoses and error rate refers to inaccuracies in severity or location descriptions or false disease diagnosis. We report the results on the report level. Figure 6(c) shows the total omission rate for the reference and generated reports in the four centers are as follows: 0.89%/2.11%, 1.67%/2.56%, 1.00%/3.22%, 1.44%/2.22%. On average, the omission rate for the generated reports 2.53% is close to that of the radiologist-provided reference reports, i.e., 1.25%, with a significant omission rate of 0.42%/1.00%. Figure 6(d) shows the error rate, i.e., inaccuracies in severity or location descriptions or false positives. The total error rate for the reference and generated reports in the four centers are 0.67%/2.33%, 2.22%/3.11%, 2.78%/3.11%, 2.33%/2.33%. On average, the error rate for the generated reports 2.72% is comparable to that of the radiologist-provided reference reports, i.e., 2.00%, with few clinically significant errors observed.
3 Discussion
Our research focuses on developing a single and unified model for Chest X-ray image analysis, with the goal of addressing multi-tasks for better clinical interpretation, including disease classification, localization, segmentation, and report generation. By leveraging a carefully designed instruct tuning framework and incorporating diverse training strategies, our method can effectively extract relevant features and make predictions for multiple tasks in Chest X-ray images. This allows for a comprehensive analysis and diagnosis of various diseases and abnormalities in the images. With unseen evaluation datasets, the proposed unified model has exhibited impressive performance in disease classification and grounding tasks (via direct inference), surpassing the capabilities of existing state-of-the-art methods with a few-shot fine-tune setting.
OmniFM-DR provides reliable evidence for a better explainability
It is crucial that automated medical report generators produce trustworthy, easily understandable, and accurate reports for effective utilization in practice. To achieve the desired goals, it is crucial to have high-quality explanations about how the report was generated and the process involved in reaching the diagnosis. An explainable system helps developers to pinpoint any weaknesses or inefficiencies, while clinicians can rely on the decisions made with the aid of these systems.
Here, we believe the interpretability of the reports can be validated mutually with the results obtained from other tasks within the model. For instance, the disease category, severity level, and approximate location of the lesion could be preliminary verified with the disease entity classification and attribute classification task. The disease localization task could further provide a more accurate bounding box of the lesion. For Pneumothorax and Cardiomegaly, the segmentation function could provide an accurate assessment of disease degree by postprocessing the contours of the pneumothorax/lung/heart mask. These results together contribute to a better verification of the generated reports.
Furthermore, we improve the explainability of the generated reports by incorporating customized prompts that provide information regarding disease attributes. Our results indicate that disease-specific prompts have improved recall and F1 score of disease entities — key metrics in evaluating the performance of automated report generation models. The results of this study underscore the significance of incorporating prompts (evidence) into the model, thereby contributing to the model’s performance in the report generation process. This technique can prove to be a valuable strategy for improving the overall accuracy of AI models, specifically in the medical field.
Image-instruction-label triplet dataset is designed for the promoting multi-task learning
While there exist various single-task datasets, there have been limited attempts to unify them and create benchmarks for the development of a single and more comprehensive model. As one of our major contributions, we design and plan to release a comprehensive dataset of Chest X-ray data. This dataset includes full-label annotations, enabling researchers and practitioners to explore and leverage the benefits of multi-task learning in this domain. By sharing this dataset, we aim to encourage and support further advancements in multi-task learning approaches for Chest X-ray analysis. This can potentially create new opportunities in clinical applications [36; 37; 38]. The benchmark has several limitations, including the limited size of the individual datasets and limited modality and task diversity. Another key barrier to developing models for use across an even wider variety of biomedical data types is the lack of large-scale multimodal datasets, which would permit joint learning and alignment of the modality-specific encoders with the decoder.
OmniFM-DR achieves comparable reporting results with expert radiologists
We conduct the evaluation of report quality based on the assessment of radiologists, which indicates that the model performs well on the complex multimodal task of generating radiology reports. In 59% of the cases, the generated reports are of equal or even better quality compared with the reference reports generated by medical professionals. Additionally, the average omission rate and error rate in the model-generated reports are similar to those found in reports generated by medical professionals on the same dataset. These promising findings demonstrate the rapid progress in the field of automatic radiology report generation and suggest the potential for future clinical applications.
Our proposed model exhibits competent performance across multiple tasks and enhances the explainability of the generated results. However, it still faces challenges when it comes to generalizing to unseen disease categories and undefined instructions (tasks). These limitations highlight the need for further research and development to improve the model’s ability to handle novel diseases and adapt to unfamiliar instructions. In the future, given the wider array of modalities and tasks in instruction tuning, more generalized models are expected to understand the tasks better and render modality-wise and task-wise emergent capability.
4 Material and Method
4.1 Building Dataset for Customized Instruction Tuning
In this work, we construct a multi-task dataset for joint training of disease classification, localization, segmentation, and report generation. In general, we unify the input and output labels of all sub-tasks into a uniform format for consistent modeling and joint training, i.e., a set of image-instruction-label triplets as samples shown in Figure 1(c) and more in the supplementary materials. We further built a subset including the attributes and phrases for chest X-ray images like "small base effusion, normal cardiac silhouette," which can be used as instruction for the report generation task. Additionally, the dataset underwent quality assurance by radiologists to ensure its accuracy and reliability.
Instruction Design To build and utilize multiple instruction sets (for each of four sub-tasks) during the joint training approach, we design a set of seed instructions with placeholders (later replaced with corresponding targets) and employ LLMs to create diverse related task descriptions for coarse-grained task-level customization, such as samples illustrated in Figure 1(c). Following various instructions, our model can elegantly switch among different vision-centric tasks and accomplish them in a unified manner like LLMs. More details about the organization of instructions for task-level customization, including disease classification, localization, segmentation, and report generation, are introduced in the supplementary material.
We employ a list of public datasets for training our proposed transformer model, e.g., MIMIC-CXR, VinDr-CXR, and ChestX-Det10. We first sort out the aligned lesion categories of each dataset and the associated radiology report data and detection bounding box (BBox) data. We exclude the image datasets that are included in the test and validation datasets of downstream tasks to avoid data leakage. Each dataset is described in detail as follows:
-
•
MIMIC-CXR [36] contains more than 377,110 radiograph images from over 227,835 radiographic studies. Each radiograph is paired with lesion classification and associated radiology report. We employ this dataset for multi-label classification and report generation tasks.
-
•
Padchest [39] includes 160,840 images obtained from 67,000 patients, covering six different position views. 174 different radiographic findings were labeled and used for the classification task in this study.
-
•
CXR-AL14 [40] is a large-scale dataset for chest X-ray image detection. It has more than 140,000 chest X-ray radiographs containing 253,844 bounding boxes in 14 chest abnormal object categories.
-
•
VinDr-CXR [41] includes chest radiographs with annotations for the classification of 28 common chest diseases. The dataset contains 15,000 CXR scans in the training set. We select eight diseases from the dataset along with their corresponding BBox for the disease localization task.
- •
-
•
CheXmask [43] contains 676,803 lung and heart segmentation masks of chest images from six publicly available databases: CANDID-PTX, ChestXray14, Chexpert, MIMIC-CXR, Padchest, and VinDr-CXR. We include 224,316 data for training and 10,000 data from ChestXray14 for downstream evaluation.
-
•
SIIM [44] comes from the SIIM-ACR Pneumothorax Segmentation competition and contains 12,090 images, among which approximately 3,000 cases are positive for pneumothorax disease with masks.
-
•
In-house dataset consists of 2,531 chest X-ray images, encompassing nine disease categories relevant to the disease localization task, along with BBox. All the images are captured from the front view.
4.2 Model Architecture
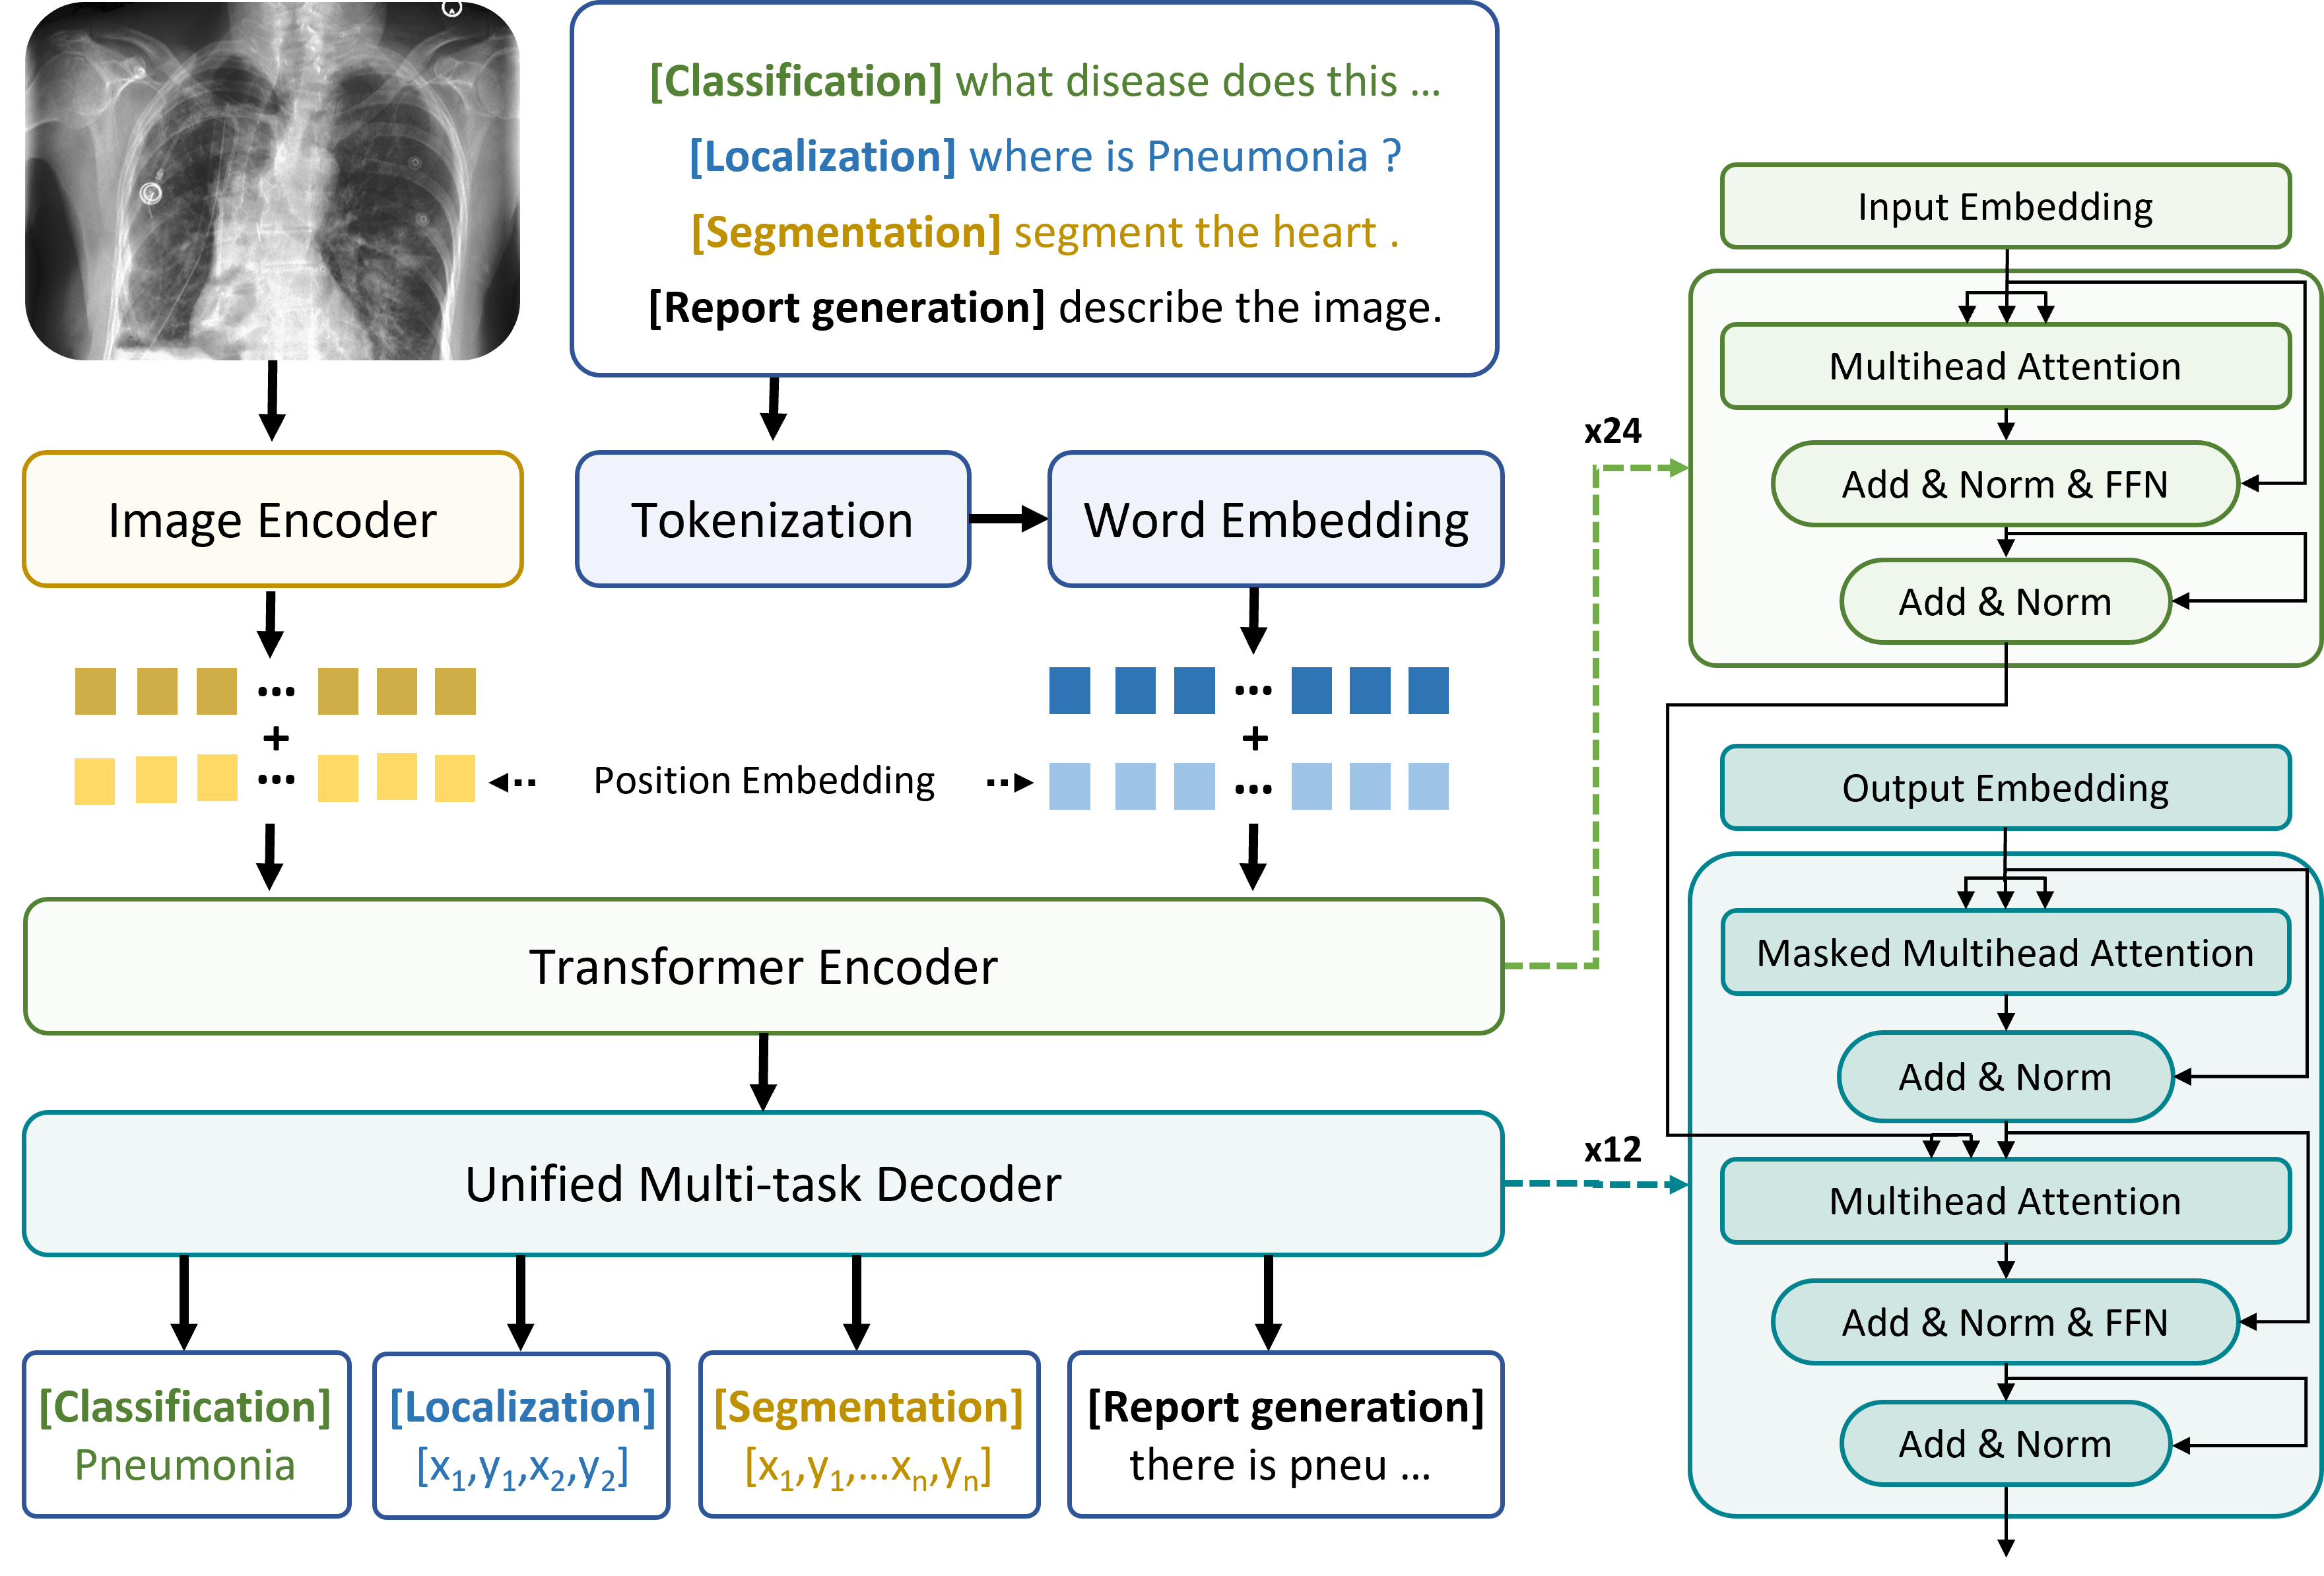
In this work, we propose a multimodal model that leverages the sequence-to-sequence learning paradigm for joint multi-task training. The specific tasks encompass disease classification, localization, segmentation, and report generation. For each task, we design specific task instructions to facilitate the model’s differentiation between tasks. Inspired by the multi-modal models [45; 46; 47; 48], OmniFM-DR leverages an encoder-decoder architecture for perceiving pixel inputs and generating the target sequence and performs unified modeling and joint training on downstream visual and language tasks as shown in Figure 7. Bounding boxes and class labels are converted into sequences of discrete tokens. This enables OmniFM-DR to robustly perform diverse language and vision tasks based on instructions, providing diverse and complex output results.
Image and Language Encoder With an input chest X-ray image , visual features are extracted by image encoder and further projected to the feature space:
| (1) |
where and are the output size of visual features, and represents the feature dimension. can be any common visual backbones and we use ResNet152 in this study. Specifically, we take output features from the 4th residual block. Visual features are then projected to a pre-defined feature dimension by using , which is composed of two linear layers. With any processed input instruction sequence , text features are extraced by language encoder:
| (2) |
where is the number of input tokens and represents the feature dimension. In our case, Bert [49] is used as a language encoder.
Multi-modality Module This module follows an encoder-decoder architecture format. Given the input visual features and text features , we first generate fused multi-modal representations by combining the image and text embeddings. These fused features serve as the keys and values in the cross-attention blocks in the decoder. By conditioning on the partial sequence predicted so far, the decoder recursively makes predictions for the token at position , effectively generating aligned descriptions across modalities.
| (3) |
In our experiments, we leverage BART [50] for multi-modal encoding and decoding. BART utilizes BERT [49] as the encoder. The decoder is based on GPT [51] and generates output sequences in an autoregressive manner.
Model joint-training and Inference We optimize the sequence-to-sequence model using cross-entropy loss as follows.
| (4) |
where is the batch size, represents the model parameters, represents the input image, stands for the input instruction, and denotes the output token at position for the sample at each batch. To enhance the quality of generation during inference, we employ various decoding techniques, such as beam search.
4.3 Downstream Finetuning and Evaluation
The benchmark evaluates four tasks, using a total of nine datasets with over 150 thousand samples. Among them, ChestX-ray14 and RSNA pneumonia datasets are utilized for evaluating the performance on the multi-label classification task, while MS-CXR, ChestX-ray14, and RSNA pneumonia datasets for the disease localization task. Meanwhile, we assess the report generation on the MIMIC-CXR dataset. Several standard metrics are introduced for various tasks. For example, F1 stands for “F1 score”, ACC stands for “Accuracy”, BLEU stands for “BiLingual Evaluation Understudy” [52], ROUGE stands for “Recall-Oriented Understudy for Gisting Evaluation” [53]. For BLEU and ROUGE, we all use 1-gram by default. We compared the proposed method with other methods across four tasks [31; 33; 32; 54; 30; 55; 34; 56; 57; 58; 59; 60; 35; 61] and the detailed comparison results can be found in the supplementary materials. The evaluation datasets include
-
•
ChestXray14 [38] is a publicly accessible dataset for classification and localization. It has 112,120 images with 14 common disease labels, with 984 images having eight localization of key findings with hand-labeled BBOX. We randomly split it into training/validation/test sets by 7:1:2 for the classification and localization task.
-
•
MS-CXR [62] consists of 1,153 samples with BBOX and concise radiology reports for eight diseases (sourced from the testing set ofMIMIC-CXR), which is utilized for the disease localization task. We randomly split it into training/validation/test sets by 7:1:2 based on the patients and evaluated the average performance of the model in all eight diseases.
-
•
RSNA Pneumonia [63] is a binary classification chest X-ray dataset that comprises 26,683 images, where each radiograph is categorized as either pneumonia or normal. We randomly sample 3,000 data from the official training set to build the test set for direct inference and finetuning experiments for disease classification and localization tasks.
-
•
JSRT [64] contains 247 chest images, among which 154 cases have lung nodules. We selected 93 healthy samples for the lung segmentation task.
-
•
MS-PS is a privately annotated pneumothorax segmentation dataset, comprising 233 images from the MS-CXR dataset. It was annotated by three expert physicians and is split into a 4:1 ratio for training and testing, respectively, for downstream pneumothorax segmentation evaluation.
4.4 Clinical Evaluation of Generated Reports
To examine the quality of generated reports from a clinical usefulness perspective, we conducted a comprehensive evaluation performed by three experienced radiologists. A total of 160 cases were evaluated, including 120 cases from three medical institutes (listed in details below) and 40 cases from the MIMIC-CXR test set. To match the intended inputs of our model, we excluded cases that mentioned multiple imaging views or comparisons to prior test results in the generated reports. Our study involved two distinct yet complementary human evaluations: (a) a parallel evaluation, where raters compared and ranked alternative reports based on their quality, and (b) an independent evaluation conducted to assess the quality of each individual report.
Ethical Statement The private data used in this retrospective study was approved by the Ethics Committee of three institutes, i.e., Fengcheng People’s Hospital, Huanggang Hospital of Traditional Chinese Medicine, and Longkou People’s Hospital. and the committees waived the consent since the retrospective research would not change the examination process of the patients. All data were adequately anonymized, and the risk of disclosing patient privacy via imaging data was minimal.
Parallel Evaluation All 160 original and generated reports were randomly chosen from a pool of four centers and evaluated by three radiologists. The radiologists were unaware of the source of the reports and reviewed them in a randomized order. The quality of the reports will be scored subjectively on a 1-5 scale, with 1 being the worst and 5 the best. The detailed guidelines are provided as follows:
-
•
Report without diagnosis errors and with comprehensive description should be scored 5;
-
•
Report with significant clinical diagnosis errors should be scored 1;
-
•
Report can be considered correct if the content is reasonable based on the given image. For instance, an accurate diagnosis of pleural effusion may not be obtained based on a frontal view image;
-
•
Report can be considered correct if there are descriptions of related diseases. For instance, lung collapse can be indicative of atelectasis;
-
•
Report with the better description should be scored higher, if two reports are error-free or exhibit similar errors;
-
•
Repetitive descriptions can be overlooked;
Independent Evaluation Radiologists were provided with one chest X-ray image paired with the disease findings, and tasked with assessing the generated reports and original reports. During the evaluation, the radiologists were unaware of the source of the reports. They aimed to determine whether there are discrepancies or errors, any missing elements, or inaccurate descriptions (e.g., location and severity) in the reports and evaluate their clinical significance referring to the methodology [65; 22]. Six types of diseases are evaluated, i.e., Pneumothorax, Pleural Effusion, Edema, Consolidation or Pneumonia (grouped together), Atelectasis, and normal. Radiologists were required to assess whether every type of error exists for each specific disease when evaluating reports. The considered errors are agreed by the radiologists and listed as follows:
-
•
False positives. Incorrect disease detection;
-
•
False negatives. Missed disease detection;
-
•
Inaccurate location. For instance, left lung pneumonia is described as right lung pneumonia;
-
•
Inaccurate severity. For instance, a minor pleural effusion is described as a major pleural effusion;
-
•
Non-existent references. For instance, "compared with previous" and "based on front-lateral image";
Code and Data Availability
Code for training and evaluation is available at https://github.com/MedHK23/OmniFM-DR. The new dataset released in this study can be found at https://huggingface.co/datasets/MedHK23/OmniFM-DR. The MultiMedBench is all open source, and the respective download link is described in Git Hub.
Author contributions
All authors have contributed fully to the concept and design of the study. LX and ZN collected the clinical data, performed the experiments, and analyzed the experiment results. XL performed the comparative experiments with other methods. LX and XW drafted the manuscript. XW, SZ, and HL supervised the projects and gave final approval of the manuscript. All authors have carefully read and approved the final manuscript.
Competing interests
The authors declare no competing interests.
References
- [1] B.J. Stevens, L. Skermer, and J. Davies. Radiographers reporting chest x-ray images: Identifying the service enablers and challenges in england, uk. Radiography, 27(4):1006–1013, 2021.
- [2] Erdi Çallı, Ecem Sogancioglu, Bram van Ginneken, Kicky G. van Leeuwen, and Keelin Murphy. Deep learning for chest x-ray analysis: A survey. Medical Image Analysis, 72:102125, 2021.
- [3] Alexey Dosovitskiy, Lucas Beyer, Alexander Kolesnikov, Dirk Weissenborn, Xiaohua Zhai, Thomas Unterthiner, Mostafa Dehghani, Matthias Minderer, Georg Heigold, Sylvain Gelly, Jakob Uszkoreit, and Neil Houlsby. An image is worth 16x16 words: Transformers for image recognition at scale, 2021.
- [4] Ze Liu, Yutong Lin, Yue Cao, Han Hu, Yixuan Wei, Zheng Zhang, Stephen Lin, and Baining Guo. Swin transformer: Hierarchical vision transformer using shifted windows, 2021.
- [5] Jacob Devlin, Ming-Wei Chang, Kenton Lee, and Kristina Toutanova. Bert: Pre-training of deep bidirectional transformers for language understanding, 2019.
- [6] Hugo Touvron, Thibaut Lavril, Gautier Izacard, Xavier Martinet, Marie-Anne Lachaux, Timothée Lacroix, Baptiste Rozière, Naman Goyal, Eric Hambro, Faisal Azhar, et al. Llama: Open and efficient foundation language models. arXiv preprint arXiv:2302.13971, 2023.
- [7] Teven Le Scao, Angela Fan, Christopher Akiki, Ellie Pavlick, Suzana Ilić, Daniel Hesslow, Roman Castagné, Alexandra Sasha Luccioni, François Yvon, Matthias Gallé, et al. Bloom: A 176b-parameter open-access multilingual language model. arXiv preprint arXiv:2211.05100, 2022.
- [8] Aakanksha Chowdhery, Sharan Narang, Jacob Devlin, Maarten Bosma, Gaurav Mishra, Adam Roberts, Paul Barham, Hyung Won Chung, Charles Sutton, Sebastian Gehrmann, et al. Palm: Scaling language modeling with pathways. arXiv preprint arXiv:2204.02311, 2022.
- [9] Susan Zhang, Stephen Roller, Naman Goyal, Mikel Artetxe, Moya Chen, Shuohui Chen, Christopher Dewan, Mona Diab, Xian Li, Xi Victoria Lin, et al. Opt: Open pre-trained transformer language models. arXiv preprint arXiv:2205.01068, 2022.
- [10] Nan Du, Yanping Huang, Andrew M Dai, Simon Tong, Dmitry Lepikhin, Yuanzhong Xu, Maxim Krikun, Yanqi Zhou, Adams Wei Yu, Orhan Firat, et al. Glam: Efficient scaling of language models with mixture-of-experts. In International Conference on Machine Learning, pages 5547–5569. PMLR, 2022.
- [11] Aohan Zeng, Xiao Liu, Zhengxiao Du, Zihan Wang, Hanyu Lai, Ming Ding, Zhuoyi Yang, Yifan Xu, Wendi Zheng, Xiao Xia, et al. Glm-130b: An open bilingual pre-trained model. arXiv preprint arXiv:2210.02414, 2022.
- [12] Tom Brown, Benjamin Mann, Nick Ryder, Melanie Subbiah, Jared D Kaplan, Prafulla Dhariwal, Arvind Neelakantan, Pranav Shyam, Girish Sastry, Amanda Askell, et al. Language models are few-shot learners. Advances in neural information processing systems, 33:1877–1901, 2020.
- [13] Long Ouyang, Jeffrey Wu, Xu Jiang, Diogo Almeida, Carroll Wainwright, Pamela Mishkin, Chong Zhang, Sandhini Agarwal, Katarina Slama, Alex Ray, et al. Training language models to follow instructions with human feedback. Advances in Neural Information Processing Systems, 35:27730–27744, 2022.
- [14] Karan Singhal, Shekoofeh Azizi, Tao Tu, S Sara Mahdavi, Jason Wei, Hyung Won Chung, Nathan Scales, Ajay Tanwani, Heather Cole-Lewis, Stephen Pfohl, et al. Large language models encode clinical knowledge. arXiv preprint arXiv:2212.13138, 2022.
- [15] Karan Singhal, Tao Tu, Juraj Gottweis, Rory Sayres, Ellery Wulczyn, Le Hou, Kevin Clark, Stephen Pfohl, Heather Cole-Lewis, Darlene Neal, et al. Towards expert-level medical question answering with large language models. arXiv preprint arXiv:2305.09617, 2023.
- [16] Jason Wei, Maarten Bosma, Vincent Y. Zhao, Kelvin Guu, Adams Wei Yu, Brian Lester, Nan Du, Andrew M. Dai, and Quoc V. Le. Finetuned language models are zero-shot learners, 2022.
- [17] Hyung Won Chung, Le Hou, Shayne Longpre, Barret Zoph, Yi Tay, William Fedus, Eric Li, Xuezhi Wang, Mostafa Dehghani, Siddhartha Brahma, et al. Scaling instruction-finetuned language models. arXiv preprint arXiv:2210.11416, 2022.
- [18] Wenliang Dai, Junnan Li, Dongxu Li, Anthony Meng Huat Tiong, Junqi Zhao, Weisheng Wang, Boyang Li, Pascale Fung, and Steven Hoi. Instructblip: Towards general-purpose vision-language models with instruction tuning, 2023.
- [19] Deyao Zhu, Jun Chen, Xiaoqian Shen, Xiang Li, and Mohamed Elhoseiny. Minigpt-4: Enhancing vision-language understanding with advanced large language models, 2023.
- [20] Haotian Liu, Chunyuan Li, Qingyang Wu, and Yong Jae Lee. Visual instruction tuning, 2023.
- [21] Laila Rasmy, Yang Xiang, Ziqian Xie, Cui Tao, and Degui Zhi. Med-bert: pretrained contextualized embeddings on large-scale structured electronic health records for disease prediction. NPJ digital medicine, 4(1):86, 2021.
- [22] Shawn Xu, Lin Yang, Christopher Kelly, Marcin Sieniek, Timo Kohlberger, Martin Ma, Wei-Hung Weng, Attila Kiraly, Sahar Kazemzadeh, Zakkai Melamed, et al. Elixr: Towards a general purpose x-ray artificial intelligence system through alignment of large language models and radiology vision encoders. arXiv preprint arXiv:2308.01317, 2023.
- [23] Kai Zhang, Jun Yu, Zhiling Yan, Yixin Liu, Eashan Adhikarla, Sunyang Fu, Xun Chen, Chen Chen, Yuyin Zhou, Xiang Li, et al. Biomedgpt: A unified and generalist biomedical generative pre-trained transformer for vision, language, and multimodal tasks. arXiv preprint arXiv:2305.17100, 2023.
- [24] Qiuhui Chen, Xinyue Hu, Zirui Wang, and Yi Hong. Medblip: Bootstrapping language-image pre-training from 3d medical images and texts, 2023.
- [25] Tao Tu, Shekoofeh Azizi, Danny Driess, Mike Schaekermann, Mohamed Amin, Pi-Chuan Chang, Andrew Carroll, Chuck Lau, Ryutaro Tanno, Ira Ktena, et al. Towards generalist biomedical ai. arXiv preprint arXiv:2307.14334, 2023.
- [26] Chaoyi Wu, Xiaoman Zhang, Ya Zhang, Yanfeng Wang, and Weidi Xie. Towards generalist foundation model for radiology, 2023.
- [27] Xinyue Hu, Lin Gu, Qiyuan An, Mengliang Zhang, Liangchen Liu, Kazuma Kobayashi, Tatsuya Harada, Ronald M. Summers, and Yingying Zhu. Expert knowledge-aware image difference graph representation learning for difference-aware medical visual question answering. In Proceedings of the 29th ACM SIGKDD Conference on Knowledge Discovery and Data Mining. ACM, aug 2023.
- [28] Michael Moor, Qian Huang, Shirley Wu, Michihiro Yasunaga, Cyril Zakka, Yash Dalmia, Eduardo Pontes Reis, Pranav Rajpurkar, and Jure Leskovec. Med-flamingo: a multimodal medical few-shot learner, 2023.
- [29] Chunyuan Li, Cliff Wong, Sheng Zhang, Naoto Usuyama, Haotian Liu, Jianwei Yang, Tristan Naumann, Hoifung Poon, and Jianfeng Gao. Llava-med: Training a large language-and-vision assistant for biomedicine in one day, 2023.
- [30] Chaoyi Wu, Xiaoman Zhang, Ya Zhang, Yanfeng Wang, and Weidi Xie. Medklip: Medical knowledge enhanced language-image pre-training in radiology, 2023.
- [31] Yuhao Zhang, Hang Jiang, Yasuhide Miura, Christopher D. Manning, and Curtis P. Langlotz. Contrastive learning of medical visual representations from paired images and text, 2022.
- [32] Benedikt Boecking, Naoto Usuyama, Shruthi Bannur, Daniel C. Castro, Anton Schwaighofer, Stephanie Hyland, Maria Wetscherek, Tristan Naumann, Aditya Nori, Javier Alvarez-Valle, Hoifung Poon, and Ozan Oktay. Making the most of text semantics to improve biomedical vision–language processing. In Lecture Notes in Computer Science, pages 1–21. Springer Nature Switzerland, 2022.
- [33] Shih-Cheng Huang, Liyue Shen, Matthew P. Lungren, and Serena Yeung. Gloria: A multimodal global-local representation learning framework for label-efficient medical image recognition. 2021 IEEE/CVF International Conference on Computer Vision (ICCV), pages 3922–3931, 2021.
- [34] Chaoyang Zhu, Yiyi Zhou, Yunhang Shen, Gen Luo, Xingjia Pan, Mingbao Lin, Chao Chen, Liujuan Cao, Xiaoshuai Sun, and Rongrong Ji. SeqTR: A simple yet universal network for visual grounding. In Lecture Notes in Computer Science, pages 598–615. Springer Nature Switzerland, 2022.
- [35] Zhihong Chen, Yaling Shen, Yan Song, and Xiang Wan. Cross-modal memory networks for radiology report generation, 2022.
- [36] Alistair EW Johnson, Tom J Pollard, Seth J Berkowitz, Nathaniel R Greenbaum, Matthew P Lungren, Chih-ying Deng, Roger G Mark, and Steven Horng. Mimic-cxr, a de-identified publicly available database of chest radiographs with free-text reports. Scientific data, 6(1):317, 2019.
- [37] Jeremy Irvin, Pranav Rajpurkar, Michael Ko, Yifan Yu, Silviana Ciurea-Ilcus, Chris Chute, Henrik Marklund, Behzad Haghgoo, Robyn Ball, Katie Shpanskaya, et al. Chexpert: A large chest radiograph dataset with uncertainty labels and expert comparison. In Proceedings of the AAAI conference on artificial intelligence, volume 33, pages 590–597, 2019.
- [38] Xiaosong Wang, Yifan Peng, Le Lu, Zhiyong Lu, Mohammadhadi Bagheri, and Ronald M Summers. Chestx-ray8: Hospital-scale chest x-ray database and benchmarks on weakly-supervised classification and localization of common thorax diseases. In Proceedings of the IEEE conference on computer vision and pattern recognition, pages 2097–2106, 2017.
- [39] Aurelia Bustos, Antonio Pertusa, Jose-Maria Salinas, and Maria de la Iglesia-Vayá. Padchest: A large chest x-ray image dataset with multi-label annotated reports. Medical Image Analysis, 66, 2020.
- [40] CXR-AL14 dataset. http://47.108.59.218/user/data/. Accessed: 2023-08-30.
- [41] Ha Q Nguyen, Khanh Lam, Linh T Le, Hieu H Pham, Dat Q Tran, Dung B Nguyen, Dung D Le, Chi M Pham, Hang TT Tong, Diep H Dinh, et al. Vindr-cxr: An open dataset of chest x-rays with radiologist’s annotations. Scientific Data, 9(1):429, 2022.
- [42] Jie Lian, Jingyu Liu, Shu Zhang, Kai Gao, Xiaoqing Liu, Dingwen Zhang, and Yizhou Yu. A structure-aware relation network for thoracic diseases detection and segmentation. IEEE Transactions on Medical Imaging, 40(8):2042–2052, 2021.
- [43] Nicolás Gaggion, Candelaria Mosquera, Lucas Mansilla, Martina Aineseder, Diego H Milone, and Enzo Ferrante. Chexmask: a large-scale dataset of anatomical segmentation masks for multi-center chest x-ray images. arXiv preprint arXiv:2307.03293, 2023.
- [44] Anna Zawacki, Carol Wu, George Shih, Julia Elliott, Mikhail Fomitchev, Mohannad Hussain, ParasLakhani, Phil Culliton, and Shunxing Bao. Siim-acr pneumothorax segmentation. Kaggle. https://kaggle.com/competitions/siim-acr-pneumothorax-segmentation, 2019.
- [45] Peng Wang, An Yang, Rui Men, Junyang Lin, Shuai Bai, Zhikang Li, Jianxin Ma, Chang Zhou, Jingren Zhou, and Hongxia Yang. Ofa: Unifying architectures, tasks, and modalities through a simple sequence-to-sequence learning framework, 2022.
- [46] Ting Chen, Saurabh Saxena, Lala Li, David J. Fleet, and Geoffrey Hinton. Pix2seq: A language modeling framework for object detection, 2022.
- [47] Ting Chen, Saurabh Saxena, Lala Li, Tsung-Yi Lin, David J. Fleet, and Geoffrey Hinton. A unified sequence interface for vision tasks, 2022.
- [48] Jiasen Lu, Christopher Clark, Rowan Zellers, Roozbeh Mottaghi, and Aniruddha Kembhavi. Unified-io: A unified model for vision, language, and multi-modal tasks, 2022.
- [49] Jacob Devlin, Ming-Wei Chang, Kenton Lee, and Kristina Toutanova. Bert: Pre-training of deep bidirectional transformers for language understanding. arXiv preprint arXiv:1810.04805, 2018.
- [50] Mike Lewis, Yinhan Liu, Naman Goyal, Marjan Ghazvininejad, Abdelrahman Mohamed, Omer Levy, Ves Stoyanov, and Luke Zettlemoyer. Bart: Denoising sequence-to-sequence pre-training for natural language generation, translation, and comprehension. arXiv preprint arXiv:1910.13461, 2019.
- [51] Alec Radford and Karthik Narasimhan. Improving language understanding by generative pre-training. 2018.
- [52] Kishore Papineni, Salim Roukos, Todd Ward, and Wei-Jing Zhu. Bleu: a method for automatic evaluation of machine translation. In Proceedings of the 40th annual meeting of the Association for Computational Linguistics, pages 311–318, 2002.
- [53] Chin-Yew Lin. Rouge: A package for automatic evaluation of summaries. In Text summarization branches out, pages 74–81, 2004.
- [54] Xiaoman Zhang, Chaoyi Wu, Ya Zhang, Yanfeng Wang, and Weidi Xie. Knowledge-enhanced visual-language pre-training on chest radiology images, 2023.
- [55] Jiajun Deng, Zhengyuan Yang, Tianlang Chen, Wengang Zhou, and Houqiang Li. Transvg: End-to-end visual grounding with transformers. In Proceedings of the IEEE/CVF International Conference on Computer Vision (ICCV), pages 1769–1779, October 2021.
- [56] Ye Du, Zehua Fu, Qingjie Liu, and Yunhong Wang. Visual grounding with transformers. 2022 IEEE International Conference on Multimedia and Expo (ICME), pages 1–6, 2022.
- [57] Muchen Li and Leonid Sigal. Referring transformer: A one-step approach to multi-task visual grounding, 2021.
- [58] Zhihao Chen, Yang Zhou, Anh Tran, Junting Zhao, Liang Wan, Gideon Ooi, Lionel Cheng, Choon Hua Thng, Xinxing Xu, Yong Liu, and Huazhu Fu. Medical phrase grounding with region-phrase context contrastive alignment, 2023.
- [59] Peter Anderson, Xiaodong He, Chris Buehler, Damien Teney, Mark Johnson, Stephen Gould, and Lei Zhang. Bottom-up and top-down attention for image captioning and visual question answering. In Proceedings of the IEEE conference on computer vision and pattern recognition, pages 6077–6086, 2018.
- [60] Steven J Rennie, Etienne Marcheret, Youssef Mroueh, Jerret Ross, and Vaibhava Goel. Self-critical sequence training for image captioning. In Proceedings of the IEEE conference on computer vision and pattern recognition, pages 7008–7024, 2017.
- [61] Fenglin Liu, Changchang Yin, Xian Wu, Shen Ge, Ping Zhang, and Xu Sun. Contrastive attention for automatic chest X-ray report generation. In Findings of the Association for Computational Linguistics: ACL-IJCNLP 2021, pages 269–280, Online, August 2021. Association for Computational Linguistics.
- [62] Benedikt Boecking, Naoto Usuyama, Shruthi Bannur, Daniel C Castro, Anton Schwaighofer, Stephanie Hyland, Maria Wetscherek, Tristan Naumann, Aditya Nori, Javier Alvarez-Valle, et al. Making the most of text semantics to improve biomedical vision–language processing. In European conference on computer vision, pages 1–21. Springer, 2022.
- [63] George Shih, Carol C Wu, Safwan S Halabi, Marc D Kohli, Luciano M Prevedello, Tessa S Cook, Arjun Sharma, Judith K Amorosa, Veronica Arteaga, Maya Galperin-Aizenberg, et al. Augmenting the national institutes of health chest radiograph dataset with expert annotations of possible pneumonia. Radiology: Artificial Intelligence, 1(1):e180041, 2019.
- [64] Junji Shiraishi, Shigehiko Katsuragawa, Junpei Ikezoe, Tsuneo Matsumoto, Takeshi Kobayashi, Ken-ichi Komatsu, Mitate Matsui, Hiroshi Fujita, Yoshie Kodera, and Kunio Doi. Development of a digital image database for chest radiographs with and without a lung nodule: receiver operating characteristic analysis of radiologists’ detection of pulmonary nodules. American Journal of Roentgenology, 174(1):71–74, 2000.
- [65] Feiyang Yu, Mark Endo, Rayan Krishnan, Ian Pan, Andy Tsai, Eduardo Pontes Reis, Eduardo Kaiser Ururahy Nunes Fonseca, Henrique Min Ho Lee, Zahra Shakeri Hossein Abad, Andrew Y Ng, et al. Evaluating progress in automatic chest x-ray radiology report generation. medRxiv, pages 2022–08, 2022.
Supplementary Material
Instruction Design
In the clinical context of chest X-ray images, physicians typically identify potential diseases, locate relevant regions, and subsequently generate a comprehensive report based on observation. This process involves tasks such as disease classification, localization, and report generation. Historically, either multiple single-task models or a single multi-task model were employed to accomplish these goals, but these approaches lacked intrinsic correlations between tasks. By utilizing multiple instruction sets during the joint training approach, we not only enable the model to learn task-related features but also activate its potential capabilities to adapt to other tasks. As described in Figure 1(c), we design a set of seed instructions with placeholders and employ LLMs to create diverse related task descriptions for coarse-grained task-level customization. Following various instructions, our model can elegantly switch among different vision-centric tasks and accomplish them in a unified manner like LLMs. Here, we introduce the organization of instructions for task-level customization, including disease classification, localization, segmentation, and report generation as follows.
Disease Classification Dataset includes entity information across 174 diseases from 0.54M images. For the entity classification task, the instruction is "What disease does this image have?". The answer includes all possible diseases present in the data, such as "pneumonia" and "atelectasis.", "Is Pneumonia in this image?". The response can be either "yes" or "no". We further extracted the textual phrases from the disease attributes (e.g., small left pneumothorax, normal cardiac silhouette) described in the original report of MIMIC-CXR and developed a subset that matches 135,751 images with phrases. The subset comprises position descriptions (e.g., left, right, base, mid) and severity descriptions (e.g., mild, moderate, severe) for ten common diseases, i.e., Cardiomegaly, Pneumonia, Effusion, Atelectasis, Edema, Consolidation, Pneumothorax, Opacity, Fracture, and Supported Devices. For the severity classification task, the instruction is "What is the level of cardiomegaly?". The response can be "moderate" or "severe". The instruction for the location classification task is like "Where is pneumothorax?". The response can be "on the left apical side".
Disease Localization Dataset incorporates CXR-AL14, VinDR-CXR, ChestX-Det, and In-house datasets, consisting of 187,097 images and corresponding BBOX for 12 diseases. The instruction given for the disease localization task is "Give the accurate bounding box of {}.". Here, the placeholder {} represents the category of the specific disease, such as "pneumonia, in the lower left lung". The response is a distinct bounding box area defined by coordinates [x1, y1, x2, y2], representing the top-left and bottom-right points.
Segmentation Dataset includes the subset of CheXmark for the segmentation task, comprising 224,316 images. We calculate the Cardiothoracic Ratio (CTR) for each image and compare it with the corresponding relationship described in the reports (e.g., CTR < 0.51: normal cardiac silhouette; 0.51 < CTR < 0.55: mild cardiomegaly; 0.55 < CTR < 0.6: moderate cardiomegaly; CTR > 0.6: severe cardiomegaly). This comparison allows us to filter the data accordingly. The SIIM dataset is collected for pneumothorax segmentation, consisting of 2,668 positive cases and 6422 negative cases. We further supplement the disease phrase subset and segmentation subsets as follows. The pneumothorax subset includes contour points (polygon vertexes, recomputed from the region mask) for 233 cases of pneumothorax. The respective instruction is "Please segment the {} from the given image." For instance, "Please segment the heart from the image." The response is a polygon area defined by a set of 30 points (coordinates).
Report Instruction Dataset includes the original MIMIC-CXR dataset of 243,324 front images, and paired radiology reports. The instruction provided for the report generation task is "describe the image". This task specifically involves generating comprehensive reports based on chest X-ray images. Such brief instruction generates reports that lack accurate descriptions. We thus incorporate disease attributions in the instruction to improve the quality of the reports. During the training stage, we extract disease entities from ground truth reports and relevant severity and position attributes of the diseases within the corresponding sentences. These attributes are then combined with the original instruction for training. During the inference stage, we construct instructions for report generation using the results of the classification, segmentation, and disease localization tasks. First, we obtain the disease category from the classification task. Then, we use disease localization to determine the location and size of the lesion and compare it with the lung mask to determine the precise positional information.
Experiment Details
In this section, we introduce the detailed setting of the direct inference and fine-tune across all four tasks.
Based on empirical findings, we set the proportional distribution of training data across each batch for classification, disease localization, report generation, and segmentation tasks to be 0.15/0.2/0.5/0.15. All the images are resized to a uniform size of 512x512 and subsequently adjusted by contrast and brightness. We selected the huge version of the OFA model as the pre-training model. We set a learning rate of , warm-up learning rate of , and dropout rate of 0.1, and train on eight V100 with batch size 256 for 30 epochs. We fine-tune all models using a learning rate of for all datasets with a batch size of 64.
• Classification and Segmentation We have selected ConVIRT[31], GLoRIA[33], and BioVil[32] as the baseline models for the disease classification task. In all three models, ResNet-50 and BERT are chosen as the visual and text encoders, respectively. To perform direct inference of classification, we adopt the methods proposed in GLoRIA and BioVil, which transform the image classification task into a text-image matching task. Specifically, the test image is fed into the image encoder to generate image features. The test disease labels are subsequently formulated as text prompts and fed into the text encoder to generate text features. We then calculate the similarity between the image and text features. The prediction scores are set with normalized similarities. For ACC and F1, we utilize the validation dataset to determine the best score threshold for each class. Furthermore, we adhere to the official training strategies and train each model for 50 epochs during the fine-tuning process. Supplementary Table 1 shows the classification tasks achieve satisfactory results across all diseases. The results are comparable with KAD[54] and MedKLIP[30] claimed SOTA.
• Disease Localization We employ TransVG, SeqTR, and VGTR as the baseline models for comparison with our OmniFM-DR. For TransVG[55], Resnet-50 is selected as the backbone. The BERT and ViT encoding length are 12 and 6 separately, while the maximum query length is set to 20, following the authors’ recommendation. TransVG[55] has been trained on five datasets and all models are validated, while the most competitive on RefCOCOg is reported in Supplementary Table 2. For SeqTR[34], we follow the default settings of RefCOCOg, and DarkNet53 is selected as the detection backbone. The corresponding pre-calculated word embeddings are used to accommodate the pre-trained models. The authors have released three models on different datasets and training settings. We validate each model and the most competitive on RefCOCOg is reported in Supplementary Table 2. For VGTR[56], we followed the default settings as RefCOCOg and selected ResNet-50 and Bi-LSTM as the vision backbone and text encoder, respectively. For the evaluation of disease localization, the IoU threshold of TransVG, SeqTR, VGTR, and OmniFM-DR is set as 0.5 consistently. The results of RefTR[57] and MedRPG[58] can not be reproduced due to the absence of code.
• Report Generation We utilize Up-down[59], Att2in[60], and R2GenCMN[35] as the baseline models for report generation. Both Up-down and Att2in employ LSTM as the text encoder. Following their official implementation, Faster R-CNN and ResNet-101 are chosen as the image encoders for Up-down and Att2in, respectively. For R2GenCMN method, ResNet-101 serves as the image encoder, while a transformer-based module is utilized as the language model. We retrain the three models following their training procedures with our preprocessed dataset and evaluate them on the official test dataset. As for OmniFM-DR, leveraging its multi-task capability, we find it beneficial to incorporate disease attributes as prompts during both the training and inference stages. During training, we include extracted phrases from radiologist reports as additional prompts. During inference, we utilize phrases predicted by our model as supplementary prompts. Supplementary Table 3 shows that our report generation task achieved SOTA on clinical efficacy metrics and comparable results on natural language processing metrics. Supplementary Figure 1 provides more examples of multi-task results generated by our model. It can be found that the proposed model is capable of identifying Pneumothorax(a), Pneumonia (b), Edema (c), and Atelectasis(d) with a disease localization box, classification, and generated report. Take Supplementary Figure 1(b) for example, the generated report demonstrates the accurate pneumonia features and position described as "increased opacification of the bilateral bases, right greater than left", which are well consistent with the blue highlighted text in the golden standard report. The disease localization and classification results also agree with the gold standard. Furthermore, the generated report shows a stable cardiomediastinal contour which could be verified by the cardiothoracic ratio of 0.4 calculated by the segmentation task. Through the validation of multi-tasks, the explainability of the generated reports could be greatly enhanced.
|
Metric |
Model |
Mean |
Atelectasis |
Cardiomegaly |
Effusion |
Infiltration |
Mass |
Nodule |
Pneumonia |
Pneumothorax |
Consolidation |
Edema |
Emphysema |
Fibrosis |
Pleural Thicken |
Hernia |
|---|---|---|---|---|---|---|---|---|---|---|---|---|---|---|---|---|
| AUC | ConVIRT[31] | 56.0 | 45.9 | 43.3 | 64.6 | 65.4 | 60.1 | 58.0 | 64.0 | 53.3 | 64.6 | 69.2 | 43.1 | 48.2 | 54.5 | 49.4 |
| GLoRIA [33] | 61.0 | 65.3 | 70.4 | 76.2 | 66.0 | 61.3 | 50.8 | 58.7 | 57.2 | 69.7 | 76.2 | 49.9 | 45.9 | 61.3 | 45.0 | |
| BioViL[32] | 66.2 | 51.7 | 68.8 | 74.3 | 60.1 | 66.3 | 63.9 | 66.9 | 68.3 | 65.0 | 79.5 | 65.6 | 63.2 | 63.7 | 69.8 | |
| MedKLIP[30] | 72.6 | 67.1 | 84.2 | 81.3 | 70.6 | 74.2 | 62.1 | 69.8 | 82.1 | 71.9 | 80.3 | 78.3 | 60.4 | 49.9 | 84.1 | |
| Ours | 73.6 | 74.5 | 76.1 | 78.8 | 60.4 | 72.3 | 65.5 | 69.6 | 81.6 | 71.9 | 79.1 | 72.6 | 64.5 | 72.1 | 90.9 | |
| F1 | ConVIRT[31] | 13.5 | 0.1 | 0.2 | 36.7 | 43.6 | 15.7 | 14.2 | 6.0 | 20.5 | 17.7 | 12.1 | 8.3 | 3.4 | 9.7 | 0.7 |
| GLoRIA [33] | 17.4 | 28.1 | 16.7 | 45.2 | 44.2 | 15.5 | 12.2 | 5.3 | 20.9 | 20.0 | 14.6 | 8.6 | 0.4 | 10.9 | 0.7 | |
| BioViL[32] | 19.2 | 23.5 | 20.9 | 43.8 | 41.4 | 17.8 | 16.4 | 6.7 | 27.4 | 17.7 | 18.7 | 12.3 | 5.6 | 11.9 | 4.5 | |
| MedKLIP[30] | 24.4 | 29.2 | 30.1 | 51.6 | 48.3 | 25.6 | 17.5 | 7.6 | 43.8 | 21.8 | 17.3 | 24.6 | 7.9 | 1.0 | 15.4 | |
| Ours | 26.3 | 36.8 | 21.9 | 48.8 | 41.1 | 29.5 | 20.6 | 9.7 | 42.8 | 21.9 | 17.4 | 16.4 | 8.9 | 17.8 | 35.1 |
| Dataset | Metric | Model | Mean |
Atelectasis |
Cardiomegaly |
Effusion |
Pneumonia |
Pneumothorax |
Consolidation |
Edema |
Opacity |
Infiltrate |
Mass |
Nodule |
|---|---|---|---|---|---|---|---|---|---|---|---|---|---|---|
| MS-CXR | ACC | VGTR[56] | 30.1 | 40.0 | 91.8 | 5.6 | 40.0 | 13.8 | 28.3 | 10.0 | 11.1 | - | - | - |
| SeqTR[34] | 43.7 | 31.3 | 93.5 | 6.25 | 41.6 | 51.3 | 41.7 | 34.4 | 50.0 | - | - | - | ||
| TransVG[55] | 32.3 | 35.0 | 89.4 | 27.8 | 29.3 | 12.5 | 32.6 | 15.0 | 16.7 | - | - | - | ||
| Ours | 54.7 | 50.0 | 90.6 | 45.0 | 51.3 | 53.7 | 47.8 | 45.0 | 54.4 | - | - | - | ||
| mIoU | VGTR[56] | 28.7 | 35.2 | 65.2 | 10.6 | 32.8 | 20.3 | 25.8 | 16.9 | 22.8 | - | - | - | |
| SeqTR[34] | 46.5 | 37.7 | 77.4 | 8.9 | 47.7 | 49.4 | 45.0 | 57.1 | 48.5 | - | - | - | ||
| TransVG[55] | 29.3 | 29.8 | 61.9 | 23.2 | 26.6 | 18.7 | 27.4 | 19.9 | 26.6 | - | - | - | ||
| Ours | 50.6 | 43.7 | 67.8 | 39.9 | 52.5 | 52.5 | 48.0 | 48.3 | 51.8 | - | - | - | ||
| ChestXray14 | ACC | VGTR[56] | 35.6 | 14.8 | 100.0 | 29.4 | 54.8 | 4.2 | - | - | - | 40.0 | 23.8 | 17.7 |
| SeqTR[34] | 47.7 | 50.3 | 82.9 | 62.5 | 29.6 | 56.3 | - | - | - | 55.0 | 38.8 | 6.3 | ||
| TransVG[55] | 28.5 | 14.8 | 97.6 | 6.9 | 51.6 | 16.7 | - | - | - | 31.1 | 9.5 | 0.0 | ||
| Ours | 61.5 | 51.8 | 97.6 | 67.0 | 61.3 | 55.8 | - | - | - | 62.2 | 61.9 | 34.7 | ||
| mIoU | VGTR[56] | 35.2 | 21.7 | 75.1 | 33.7 | 51.3 | 18.6 | - | - | - | 42.7 | 26.7 | 11.6 | |
| SeqTR[34] | 41.5 | 45.8 | 67.7 | 46.5 | 25.7 | 53.0 | - | - | - | 52.0 | 25.0 | 16.7 | ||
| TransVG[55] | 28.7 | 23.3 | 72.8 | 22.5 | 37.6 | 22.5 | - | - | - | 32.1 | 15.9 | 3.3 | ||
| Ours | 51.6 | 45.3 | 73.3 | 56.0 | 53.7 | 46.1 | - | - | - | 57.4 | 48.2 | 32.4 |
| Report | Entity | Attribute | |||||||
| BL-4 | METEOR | Rouge-L | Precision | Recall | F1 | ACC_S | ACC_L | ||
| Baseline | Ours | 10.97 | 14.02 | 26.48 | 43.22 | 31.31 | 33.29 | 18.34 | 8.17 |
| Task | - LOC | 10.85 | 14.06 | 26.49 | 44.96 | 31.06 | 33.01 | - | - |
| - CLS | 10.81 | 13.93 | 26.43 | 46.42 | 30.37 | 32.73 | - | - | |
| Prompt | + Phrase | 10.22 | 13.65 | 24.42 | 35.71 | 38.11 | 35.08 | 22.19 | 12.87 |
| + Phrase-GT | 11.42 | 14.33 | 26.99 | 71.47 | 44.82 | 49.55 | 30.18 | 23.57 | |
| Dataset | Model | BL-1 | BL-4 | METEOR | Rouge-L | Precision | Recall | F1 |
|---|---|---|---|---|---|---|---|---|
| MIMIC-CXR | Up-down[59] | 31.5 | 9.1 | 12.8 | 26.3 | 32.2 | 23.4 | 23.9 |
| Att2in[60] | 33.1 | 9.7 | 13.6 | 27.5 | 32.5 | 23.6 | 25.7 | |
| R2GenCMN[35] | 35.6 | 10.4 | 14.7 | 28.1 | 33.3 | 28.4 | 28.6 | |
| Constrastive[61] | 35.0 | 10.9 | 15.1 | 28.3 | 35.2 | 29.8 | 30.3 | |
| Ours | 35.1 | 11.0 | 14.0 | 26.5 | 43.2 | 31.3 | 33.3 |