![[Uncaptioned image]](/html/2311.00929/assets/x2.png)
![]()
|
|
Effect of Confinement and Topology: 2-TIPS vs MIPS† |
| Nayana Venkatareddy,a Jaydeep Mandal,a and Prabal K. Maiti∗a | |
|
|
2-TIPS (Two Temperature induced phase separation) refers to the phase separation phenomenon observed in mixtures of active and passive particles which are modelled using scalar activity. The active particles are connected to a thermostat at high temperature while the passive particles are connected to the thermostat at low temperature and the relative temperature difference between "hot" and "cold" particles is taken as the measure of the activity of the non-equilibrium system. The study of such binary mixtures of hot and cold particles under various kinds of confinement is an important problem in many physical and biological processes. The nature and extent of phase separation are heavily influenced by the geometry of confinement, activity, and density of the non-equilibrium binary mixture. Investigating such 3D binary mixtures confined by parallel walls, we observe that, the active and passive particles phase separate, but the extent of phase separation is reduced compared to bulk phase separation at high densities and enhanced at low densities. However, when the binary mixture of active and passive particles is confined inside a spherical cavity, the phase separation is radial for small radii of the confining sphere and the extent of phase separation is higher compared to their bulk counterparts. Confinement leads to interesting properties in the passive(cold) region like enhanced layering and high compression in the direction parallel to the confining wall. In 2D, both the bulk and confined systems of the binary mixture show a significant decrement in the extent of phase separation at higher densities. This observation is attributed to the trapping of active particles inside the passive cluster, which increases with density. Thus the 2D systems show structures more akin to dense-dilute phase co-existence, which is observed in Motility Induced Phase Separation in 2D active systems. The binary mixture constrained on the spherical surface also shows similar phase co-existence. Our analyses reveal that the coexistent densities observed in 2-TIPS on the spherical surface agree with the findings of previous studies on MIPS in active systems on a sphere. |
1 Introduction:
Active matter systems are composed of self-driven particles that can convert internal free energy to some mechanical work 1, 2, 3, 4, 5, 6, 7, 8, 9, 10, 11. Collective motion and high mechanical stress are some of the characteristics of such systems. These systems are ubiquitous in nature and range from a very small to large length scales, e.g. from a colony of bacteria to a flock of birds. The behaviour of such systems is studied using a variety of theoretical and computational models, the majority of which are vectorial in nature. Among many remarkable features shown by such systems, Motility Induced Phase Separation (MIPS) is one of the most important aspects.
For a non-equilibrium system with particles having different spatially varying speeds, the local density is inversely proportional to the local speed 12. Cates and Tailleur 13 theorised the density beyond which, the homogeneous distribution of a system of active particles gives rise to a spinodal decomposition into a dense and a dilute phase, the phenomena termed as Motility Induced Phase Separation (MIPS). In 2012, Fily 14 confirmed that a system of active Brownian particles (ABPs) in the 2D suspension phase separates in a dense and dilute region from a homogeneous structure at high densities and swimming speeds. Later, Redner 15 showed that, with increasing density of the system, the phase separation occurs at a lesser activity. Further experimental confirmations on MIPS were also observed 16, 17.
Besides purely active matter systems, studying a binary mixture of active and passive particles has significant biological and industrial applications. Such systems show various features such as phase segregation 18, 19, 20, 21 and turbulent behaviour 22. To model such binary mixtures without directionality, Weber 23 used two different diffusivities to simulate the behaviour of active and passive particles and observed phase separation between them, where ’cold’ particles (particles with smaller diffusivities) form dense clusters. Ganai , in 2014 24 explained the chromatin separation inside the nucleus using the two-temperature model. Theoretical models 25, 26, 27 and simulations 28, 29, 30, 31, 32, 33, 34 on various soft matter systems show phase separation between active (hot) and passive (cold) particles under the two-temperature picture.
What is the effect of different confinements on such binary mixtures? What is the effect of geometry and topology? Before trying to answer these questions in this work, we emphasize that the surface curvature is an important aspect that plays a key role in different biological phenomena such as collective cell motility in embryogenesis 35 or development of corneal epithelium 36 or alignment direction for particle aggregation in fluid vesicles 37. Surface curvature can also induce various topological defects on systems of passive nematogens 38, 39, 40, 41, 42, which can be controlled systematically 43. An intricate interplay between the elasticity and active interaction leads to dynamics of defect structure for active nematic shells 44. In the case of colloids, structural, thermodynamical and various other properties are also dependent on the surface curvature 45, 46. A rich array of spatiotemporal characteristics are observed in a system of active Brownian particles on spherical surface 47. Self-organisation of active systems on constrained geometries has also been studied 48. On the other hand, the study of various condensed matter systems inside confined geometry is also of physical and biological importance 49, 50, 51, 52, 53, 54. The various phenomena that follow are consequences of the interaction between the confining wall and the system, as well as the geometry of the confinement, which results in aggregation of the particles near the walls 55, 56, 57, 58, 59. The presence of wall leads to the formation of new phases which can be found only at extremely high pressure in bulk systems60. Confined geometry affects the interaction of colloidal particles as well 61, 62. Therefore, we see that there is a great influence of confinement, in general, on various kinds of soft matter systems. The geometry of the wall can also alter the ordering in various active matter properties such as MIPS63, 64, 65, 66, 67, 68. The active Brownian particles under confinement aggregate near the walls at low rotational diffusion rates63. Binary mixtures of microscopic algae and passive colloids in microfluidic channel also show accumulation of passive particles near the boundaries64.
In this paper, we have addressed the question of how confinement and topology can play an important role in the phase separation of the active and passive particles in a binary mixture, using the two-temperature model, the details of which are discussed in section 2. We first introduce confining parallel walls in a 3D periodic system and observe that, although the active and passive particles do tend to phase separate in the confined system, the extent of phase separation is enhanced at low densities and reduced at high densities compared to the free periodic boundary/bulk cases. We also observe that for confined systems with parallel walls, the degree of phase separation reduces with increase in density. Then we confine the binary mixture in a spherical cavity, where we observe, the phase separation between active and passive particles, but the nature of phase separation is radial for small radii of the cavity. With the increase in the radius of the spherical cavity, the bulk effect begins to set in. Interestingly, the extent of phase separation between active and passive particles in the spherical cavity is observed to be enhanced compared to the bulk periodic systems at all densities. Next, we study the effect of confinement in 2 dimensions. Interestingly, as opposed to 3D bulk systems, the 2D periodic/bulk systems show a decrement in phase separation as density is increased.
Similar effects are observed for the 2D confined cases as well. We also observe that for higher densities, the phase separation between active and passive particles in confined systems is reduced compared to 2D periodic systems. These phenomena are the results of increased trapping of hot particles in cold cluster. Finally, we constrain the system on the surface of the sphere and observe that phase separation between active and passive particles is again very small for high packing fractions and the structure observed on the spherical surface is compared with the motility induced phase separation observed in active systems in 2 dimensions. The details of the above-mentioned results are given in section 3. Finally, we draw our conclusion and shed some light on some of the future directions of the work in section 4
2 Simulation details:
We start with a system of an equal mixture of hot and cold particles in a cubic periodic box as has been used in our earlier works 28. The particles interact via the Lennard-Jones(LJ) potential
| (1) |
where carries the unit of energy, is the diameter of the particles and is the distance between the particles. We have used the reduced units throughout this work, where the various thermodynamic quantities are defined as follows:
temperature , pressure .
In our calculations, we take mass , measure time in units of and distances in units of .
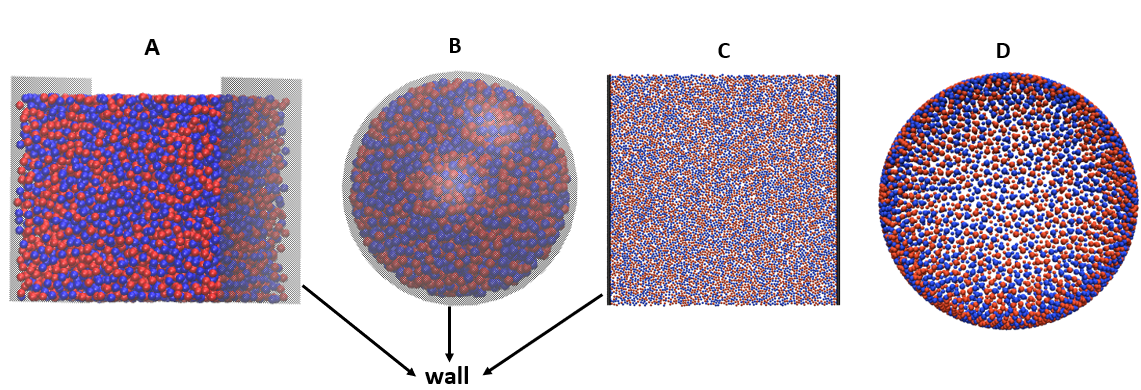
We simulate the binary mixture of hot and cold particles under four different geometrical confinements as shown in Fig:1 :
A) The 3D binary mixture of hot and cold LJ particles is confined by placing two parallel walls at the boundaries of simulation volume(Fig:1A), perpendicular to any one of the Cartesian directions (say along axis). The interactions between the wall and particles inside the simulation volume is repulsive in nature and described by the following potential.
| (2) |
where is the distance between the wall and a particle.
B) The 3D binary mixture of hot and cold particles is confined inside spherical cavities of different radii(Fig:1B). The LJ particles interact with the wall by Weeks-Chandler-Andersen (WCA) potential.
| (3) |
where is the distance between the particles and the wall.
C) We perform simulations of 2D binary mixtures of hot and cold particles in the presence of parallel walls at boundaries(Fig:1C). The interaction of the particles with the wall is given by eqn 2.
D) Finally, to study the effect of curvature, we constrain the mixture of hot and cold particles on the surface of a sphere (Fig:1D). At each timestep, all the particles obey two constraint equations:
| (4) | |||
| (5) |
where indicate the position and velocity of the -th particle on the surface of the sphere of radius . The origin of the coordinate system is taken at the center of the sphere.
The simulations were carried out via the LAMMPS software 69 in NVT ensemble. We have used the Nosé-Hoover 70 thermostat for both 3D and 2D simulations, whereas the Berendsen thermostat 71 was used to control the temperature for the system on the spherical surface. The RATTLE algorithm 72 was used to constrain the particles on the surface of the sphere. The timestep of integration was chosen to be and the time constant for the thermostats was taken as .
Initially, all the particles are assigned the same temperature and we allow the system to equilibrate.
The choice of the initial temperature is made such that the system remains in a fluid state in equilibrium for all the simulated densities both for 2D and 3D 73, 74. Accordingly, the initial temperature of the system is set at T*=2 for 3D and 2D and at T*=1 for spherical confinement (for reasons discussed in the corresponding subsection). After the equilibration, we introduce two-temperature model: connect half of the particles to a cold thermostat maintained at ( for confinement on spherical surface) and the rest of the particles to a hot thermostat initially maintained at temperature ( for confinement on spherical surface). Hence, = the total number of hot and cold particles in the system. Then we increase the temperature of hot particles from 2 to 5 to 10 …..to 80 (1 to 5 to 10….to 100 in spherical confinement). At each of the increased temperatures of hot particles , we allow the system to reach a non-equilibrium steady state for 1 million(M) time steps. Finally, we perform a production run of another 1M time steps to obtain data for further analysis.
The activity of the non-equilibrium system is measured using the relative temperature difference between the hot and cold particles, . However, due to heat exchange between hot and cold particles from collisions, the effective temperature of the cold(hot) particles obtained from equipartition theorem () is higher(lower) than the temperature imposed on cold(hot) thermostat (). Therefore the effective activity is defined as the relative effective temperature difference between the two types of particles.
| (6) |
We observe phase separation between hot and cold particles at high activities in the presence of any kind of confining walls in both 3D and 2D systems and on the surface of the sphere. To quantify the extent of phase separation in the presence of parallel walls, we calculated the order parameter for the phase separation in the following way. We divide the simulation box into sub-cells and calculate the order parameter as 28, 30
| (7) |
where are the number of hot and cold particles in each of the sub-cells, is the total number of subcells in the simulation volume and means the average over all steady state configurations. For the cases of particles on a spherical surface, to calculate order parameter , the surface is divided such that each sub-section takes almost equal areas. The polar angle was divided into larger intervals near the poles of the sphere and in smaller intervals near the equator, whereas the azimuthal angle () was divided into equal parts throughout.
However, for hot and cold particles confined inside spherical walls in 3D, dividing the simulation volume into sub-cells with equal volume is challenging. So we perform cluster analysis28, 29 on phase separated cold particles. We define two particles belong to the same cluster if the distance between them is less than cut-off distance . The cut-off distance is obtained from the first peak of the radial distribution function(RDF) of the cold particles. Using the above criteria of a cluster, we have calculated the normalized number of clusters of cold particles and the fraction of cold particles in the largest cold cluster .
3 Results:
3.1 Confinement of 3D binary mixture by parallel walls
We have observed that in the presence of confining parallel walls, the hot and cold particles phase separate at high activities. The extent of phase separation under confinement is density dependent. The degree of phase separation is reduced compared to bulk phase separation at high densities and enhanced at low densities.
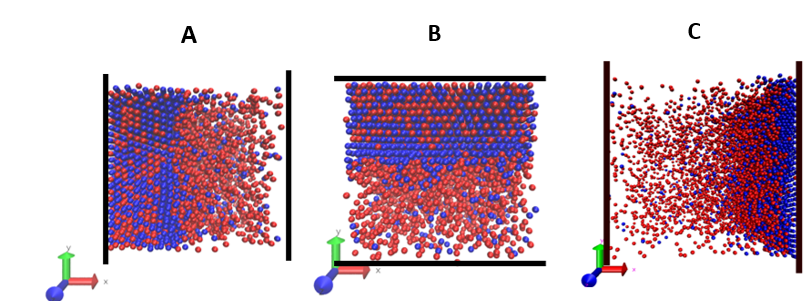
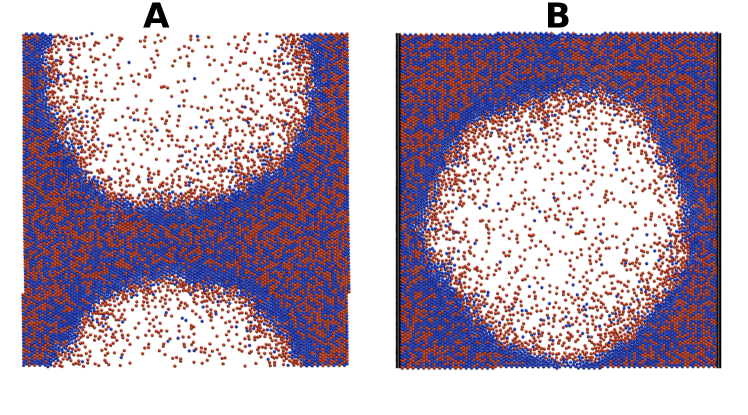
Fig:1A shows the initial configuration of the binary mixture with parallel walls perpendicular to axis when ( is the volume of the simulation box) and . The initial system of hot and cold particles is well mixed. Fig:2A and B show the instantaneous snapshot of phase separated system at when the temperature of hot particles is raised to in the presence of parallel walls perpendicular to and axis respectively. Fig:2C shows the snapshot of phase separated system at when the temperature of hot particles is raised to and confined by walls parallel to axis.
One of the distinguishing features of phase separation under parallel confinement is that the interface between phase-separated hot and cold particles is always parallel to the confining walls(See Fig 2A and B) and the phase-separated cold particles are always present in the vicinity of walls.
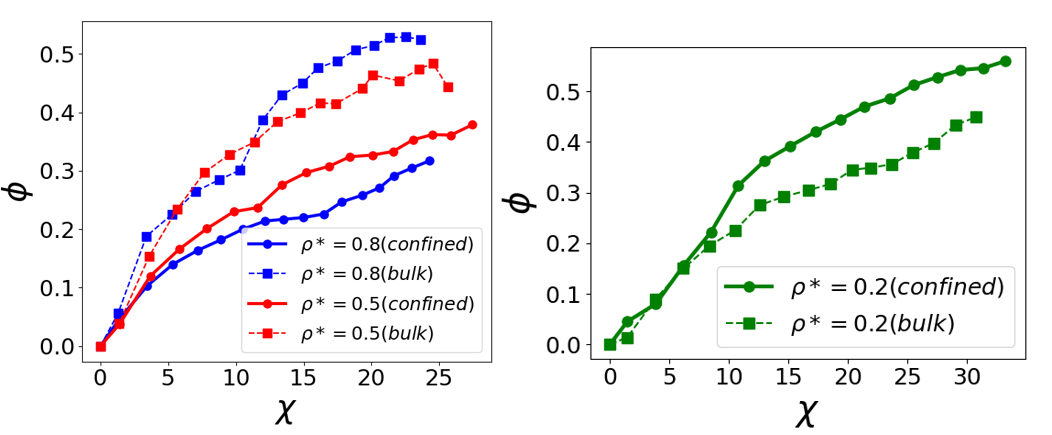
To quantify the phase separation of the binary mixture under parallel wall confinement, we have calculated the order parameter defined by equation 7 for three simulated densities =0.8, 0.5 and 0.2 and compared those with the results from bulk unconfined simulations. Fig 3 shows the plot of order parameter versus activity at various densities . The solid lines are the results of binary mixture under confinement by parallel walls while the dotted lines are the results of bulk simulation. For all densities, we see that the order parameter increases with activity indicating that the hot and cold particles phase separate at high activity. We observe that for high density of =0.8 and 0.5, the magnitude of order parameter is lower under confinement compared to bulk implying a reduction in the extent of phase separation. However, at a low density of =0.2, the value of under confinement is much greater than the value of from bulk simulations indicating a significant enhancement in extent of phase separation.
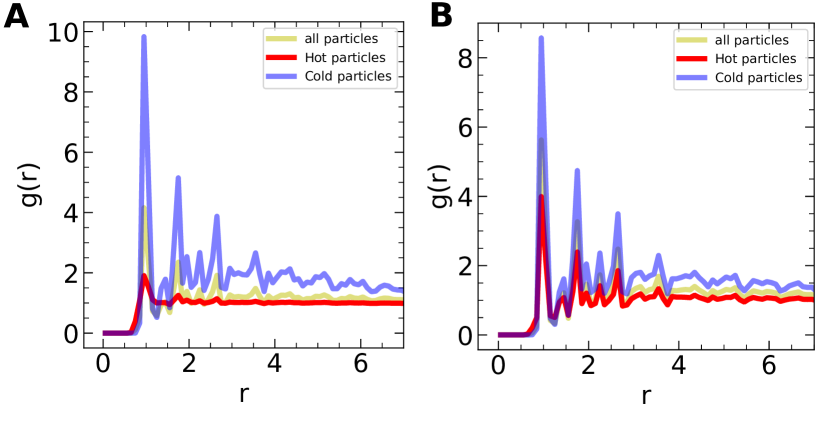
We can qualitatively understand the reason for the density-dependent reduction or enhancement of phase separation under parallel confinement by analyzing the composition of the phase-separated cold dense region. From Fig:2A, we can see that in the phase-separated cold region, a significant number of hot particles are trapped (greater than the number of hot particles trapped in the bulk simulations without walls) at a high density of =0.8. Under periodic boundary conditions, the cold region has two interfaces between hot and cold zones that facilitate the diffusion of hot particles trapped in the cold region. However, in the case of parallel confinement, the cold region is formed near the wall leading to only one interface between cold and hot particles. The wall prevents the escape or diffusion of the trapped hot particles resulting in significant number of hot particles in the cold region which leads to the reduction of order parameter compared to bulk. This can be confirmed from the radial distribution function (RDF) of hot and cold particles for =80 as shown in Fig:4. From the RDF of bulk simulations(Fig:4A) at =0.8 and =80, we can see that the cold particles are in the crystalline state but hot particles are in the gaseous state indicating that a negligible number of hot particles are trapped in the cold region. However, under confinement(Fig:4B) at =0.8 and =80, the hot particles also show crystalline structure because a significant fraction of hot particles are trapped in the cold zone. The number of hot particles trapped in the phase-separated cold region decreases with density. Hence, at a low density of =0.2, we observe an enhancement in phase separation compared with bulk. We note that our order parameter values from the simulations (Fig:3) are dependent on the initial configuration of the binary mixture. To obtain the results which are independent of the initial configuration, the heating rate must be very slow or the simulations must be run for very long time. The presence of wall in the system prevents the escape of trapped hot particles and hence would require extremely long simulation run time to reach its true steady state.
3.2 Effect of spherical confinement:
In the previous section, we studied the effects of confinement of hot and cold particles by parallel walls placed at the boundary of the simulation volume. Here, we simulate the mixture of hot and cold LJ particles inside spherical cavities of different radii to study the influence of isotropic confinement on phase separation. We have systematically studied the effect of confining radius , density and activity on the phase separation of hot and cold LJ particles.
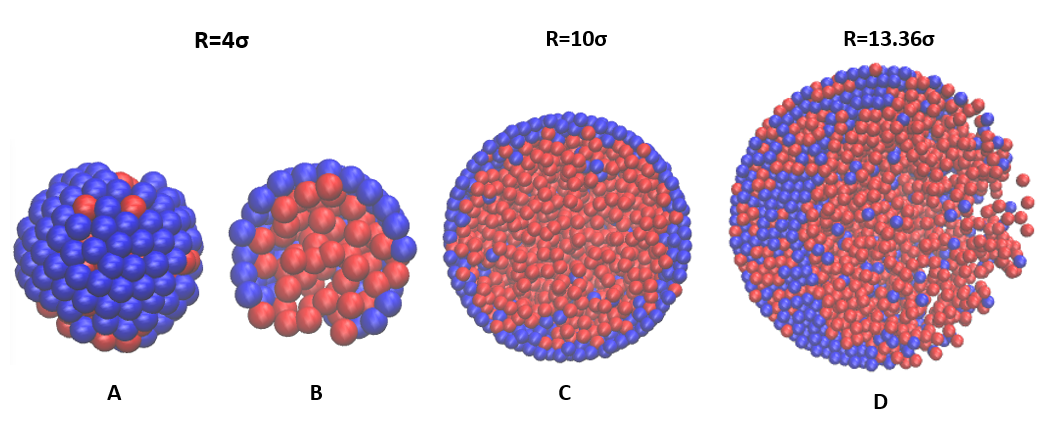
3.2.1 Effect of confining radius
We have simulated equal mixture of hot and cold LJ particles inside spherical cavities of radii , , , and , while maintaining the constant density of . Using the same procedure mentioned in section 2, starting from an equilibrium configuration, we maintain the temperature of cold particles at and increase the temperature of hot particles from to in steps of five. We observe that the phase separation between hot and cold LJ particles is heavily influenced by the geometry of confinement. Instantaneous snapshots of the phase-separated non-equilibrium system at different radii are shown in Fig 5. When both hot and cold particles are at the same temperature , the particles are well mixed (Fig:1B). For , when the temperature of hot particles is , the particles undergo radial phase separation with hot particles in the interior and cold particles at the periphery of the sphere (Fig:5A and B). This radial phase separation is also observed for at high activities (Fig:5C). However, for a larger radius of , when , the phase separation is not radial but takes place along a Cartesian direction similar to the bulk phase separation(Fig:5D). Here we would like to point out that for radii to (Fig:5A-C), the radially phase separated cold "phase" is just 1-2 layer thick as the volume of cold region is limited by the number of particles in the finite-sized system. So it is difficult to identify the co-existing phases and their interface in the phase separated system (in contrast with phase separation under parallel walls in section 3.1 where hot and cold phases co-exist with a well defined interface). Hence we refer to the above-mentioned radial phase separation as micro-phase separation75, 76. As the radius of confining sphere is increased, the phase separation becomes more similar to bulk phase separation.
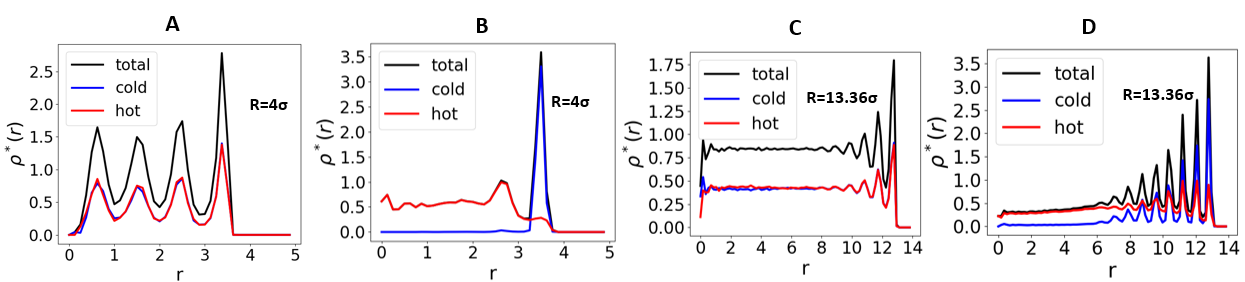
To understand the arrangement of hot and cold particles inside the sphere, we have calculated the density variation in the radial direction from the center of the sphere to the wall (Fig:6). The sphere is divided into spherical shells along the radial direction and the density of hot and cold particles is calculated in each shell. The density of both hot and cold particles oscillate along the radial direction for when and (Fig:6A) and indicates layering of the particles. Such layering of particles leading to density oscillation is well studied in equilibrium systems77, 78, 79. The magnitude of density oscillations increases with density and decreases with increase in confining volume. Fig:6B shows density variation for when where we can clearly see that cold particles are present near the wall and hot particles are present in the interior. Due to the high temperature of hot particles layering is absent in the interior. Also, we can see that the density of cold particles near the periphery is very high (higher than the density of phase-separated cold region in bulk as reported in our previous work28) and the density of the hot particles is lower than the average density. Fig:6C and D show the density variation for and when and respectively. For a large radius of in equilibrium, the density of both hot and cold particles is constant in the interior and oscillates only near the wall. When , the phase separation is not radial as we can see that cold particles are present in the range . Also the region with phase separated cold particles shows layering due to the high density of phase separated cold particles.
The phase separated cold particles in the binary mixture always seem to aggregate near the wall as if there was an effective attraction between the cold particles and the wall. This attraction between the cold particles and the wall can be quantified by using the mean radial position of cold particles(Refer Fig:S1 and Section I in Supplementary Information(SI)) which increases as the activity of the non-equilibrium system is increased. For radius to , the 3D phase separation of hot and cold particles leads to a 2D spherical shell of cold particles where the particles are arranged in 2D hexagonal lattice 80. For radius , the phase-separated cold cluster has particles arranged in HCP and FCC lattice similar to the bulk phase separation. Further details on the structure of phase separated cold particles are given in Section II of the SI.
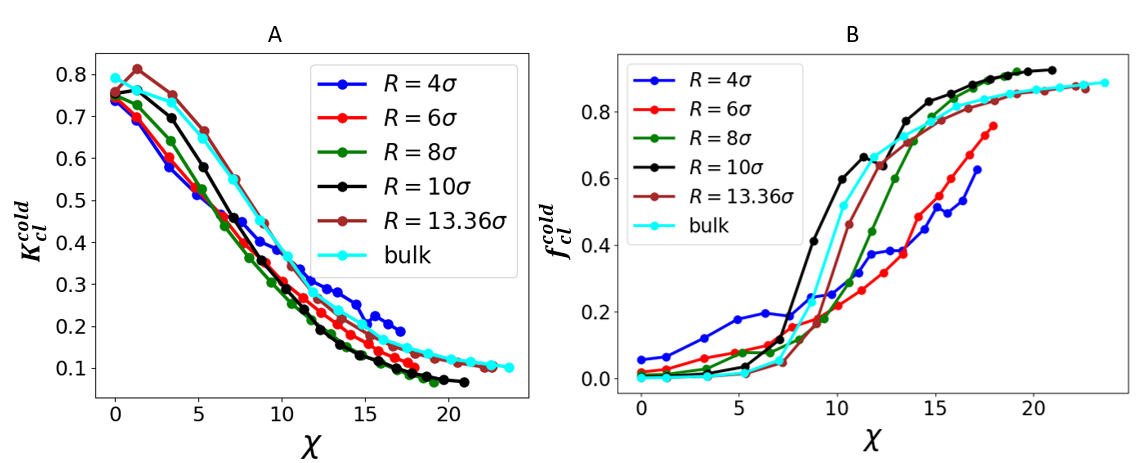
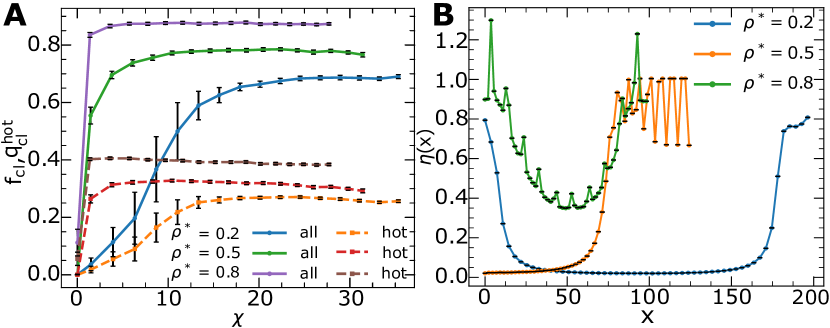
The hot and cold particles inside a spherical cavity phase separate at high activities for all radii even though the nature of phase separation depends on the radius. The hot particles due to their high temperature, force the cold particles to aggregate and form clusters. To study the number and size of the cold clusters, we perform cluster analysis of cold particles as defined in section II. Fig:7A and B give the plot of the normalized number of clusters of cold particles (normalized by the total number of cold particles ) versus activity and plot of the fraction of cold particles in the largest cluster , defined as (where is the number of cold particles in the largest cluster), versus activity respectively for different values of . Initially for low activity, the number of clusters of cold particles is large indicating that the cold particles are spread out in the simulation volume showing no phase separation. As the activity is increased, the number of clusters of cold particles decreases with activity as small clusters join to form larger clusters for all radii . We see that decreases with an increase in radii from to even below the value for bulk phase separation. So, the spherical confinement of hot and cold particles enhances phase separation compared to bulk phase separation. The plot of for closely follows the plot of bulk phase separation. The fraction of cold particles in the largest cluster is proportional to the size of the largest cold cluster. The fraction of cold particles in the largest cluster increases with activity for all radii which implies that the size of the cold cluster grows with activity. The size of the cold cluster also increases as we increase the radius from to even surpassing the bulk phase separation. For , the size of the cluster is reduced compared to its preceding radius() but closely follows the value of bulk phase separation.

3.2.2 Effect of density on phase separation inside spherical cavity.
We find that for all densities under spherical confinement, the phase separation is enhanced under confinement compared to bulk simulations. We simulate a fixed number of hot and cold particles (N=8000) inside spherical cavities at densities , , and . Since the number of particles is fixed, the radius of the sphere is varied to obtain desired density. We observe phase separation at high activities for all densities (Fig:8A). However, due to the large radii of confining spheres, the phase separation is not radial but takes place along a cartesian direction similar to the bulk phase separation. Again, to study the number and size of the cold clusters, we perform cluster analysis on cold particles as defined in section II. Fig:8B and C show plot of normalized number of clusters of cold particles versus activity and plot of fraction of cold particles in the largest cluster versus activity respectively for different densities. The results of spherically confined systems (solid lines) are compared with bulk systems (dashed lines) at all densities. As the activity increases, the number of clusters of cold particles for all densities decreases. The number of clusters of cold particles in spherically confined systems is always lower than the bulk systems. We conclude that confining a non-equilibrium system of hot and cold particles inside a sphere enhances the extent of phase separation compared to their bulk counterparts. The fraction of cold particles in the largest cluster is also higher in spherically confined systems compared to their bulk counterparts. Under spherical confinement, phase separation is enhanced even at high densities where we observe a reduction in the extent of phase separation under parallel walls. Due to the geometry of spherical confinement, the phase-separated hot and cold particles have a larger interface(See Fig:5B, C, D and 8A) relative to the interface under parallel confinement. So, the number of trapped hot particles in the cold region is lower in spherically confined systems compared to parallel confinement, which leads to an increase in the extent of phase separation.
3.3 Pressure anisotropy in confined systems
The pressure variation across the interface of phase-separated hot and cold particles has been studied in bulk systems 31, 30, 29, 34 which reveal that the high kinetic pressure of the phase-separated hot particles is balanced by the high virial pressure of the dense cold clusters. Also, pressure anisotropy has been studied in bulk31, 34 systems which reveal that in the cold region of the phase-separated system, the value of tangential pressure is always lower than the normal pressure (See Fig:4 in SI for bulk results of binary mixture of LJ particles). In case of confined systems with either parallel or spherical walls, despite the repulsive interaction of the wall with the particles, the cold particles at high activity aggregate near the walls as if there is an effective attraction between the cold particles and the wall. This attraction is also evident from the fact that the cold particles under confinement reach densities greater than their bulk counterparts. So, we investigate the effect of confinement on the tangential and normal pressures of the binary mixture in the presence of parallel walls at the boundaries of the simulation volume. The simulation volume is divided into sub-volumes along the direction perpendicular to the wall which is along the axis. The component of pressure tensor 81, 82, 83, 84in the sub-volume is given by
| (8) |
where is the kinetic part and is the configurational or virial part of the pressure tensor.
| (9) |
| (10) |
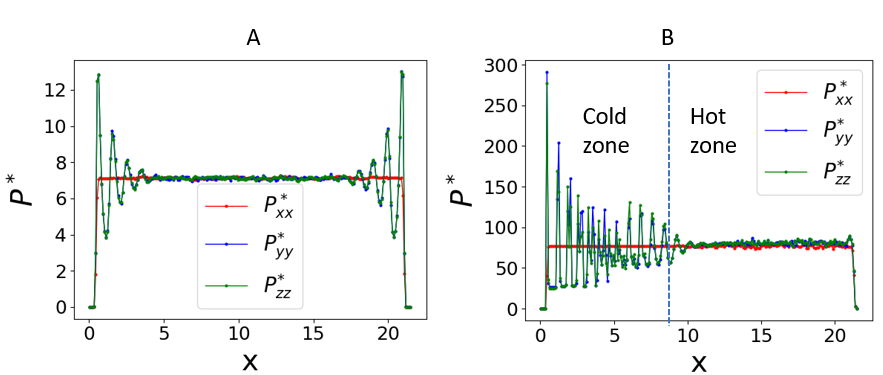
where implies summation over all the particles in sub-volume and is the velocity of particle along direction. is the force between and particles along direction, is a point on contour connecting particles and and implies that only particles and contribute to the integral if a part of contour lies in volume . Fig:9 A) and B) shows the variation of normal pressure = and tangential pressure == along direction perpendicular to parallel walls at when and respectively. The condition of mechanical equilibrium requires the normal component of pressure to be constant. In equilibrium, when , we see that normal component is constant along axis but the tangential pressures and oscillate near the walls due to layering effect. When , normal component is constant as dictated by the condition of mechanical equilibrium. The tangential pressures and in the cold region show oscillations of high amplitude(due to the high density of cold region layering effect is very much enhanced ) which exceeds the normal pressure by nearly order of magnitude. As mentioned before, the strong effective attraction of cold particles with the wall is also reflected in the pressure calculation, where in contrast to bulk, tangential pressure in the cold region is much greater than the normal pressure inducing strong compression in the cold regions perpendicular to the direction of the wall.
3.4 Effect of confinement in 2 dimensional plane
We also study the effect of dimension and confinement on the phase separation of such binary mixtures. In 3D systems, we observed that for low density (), the phase separation increases with parallel confinement (wall normal to the edges along direction), whereas the phase separation reduces with confinement for the high density (). To examine the effect of dimensions with similar parallel confinements, we have simulated a binary mixture of particles on a 2D plane (square) with different densities , where is the length of the plane. We have studied three cases: i) Periodic plane (2D bulk) ii) Plane with parallel walls in x direction (normal to direction at the edges of the simulation region, implemented by a repulsive potential described by eqn 2) (x-confined) and iii) Plane with parallel walls in both directions ( and ) (xy-confined). Each of these three confined systems was simulated at three different densities a) b) , and c) . The densities and other parameters for the simulations were chosen such that the initial configuration assumes a fluid phase.
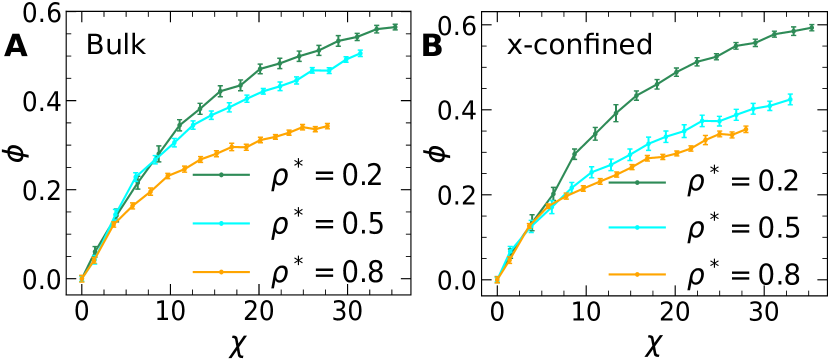
In equilibrium, at , the particles are uniformly distributed (Fig:1(C)). When two temperature scalar activity is introduced, the hot and cold particles phase separate for both the unconfined and confined systems (see Fig:10A-B). We find that the phase separation phenomenon is indeed affected by the dimension of the space. In contrast to 3D bulk results, in the 2D periodic case (2D bulk), we observe that the extent of phase separation reduces with density, as is evident from the saturation values of the order parameter, as shown in Fig:11(A). Similar findings are made for x-confined systems as well (Fig:11(B) Similar to the 3D confined systems, the 2D x-confined and xy-confined systems also reveal that the particles accumulate near the wall and form the dense cluster close to the wall. Therefore we conclude that the accumulation of particles near the walls is a phenomena independent of the spatial dimensions.
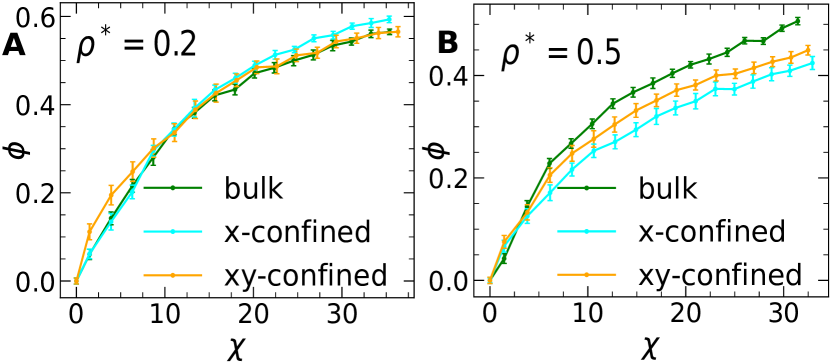
We also explore the effect of applying different confinements on the phase separation at fixed packing densities. We observe that at low densities such as , (Fig:12(A)), the effect of confinement is not prominent in the phase separation, but at higher densities , the phase separation again reduces with the insertion of wall in the system (Fig:12(B)), compared to 2D bulk systems.
As the spatial dimensions decrease from 3D to 2D, the reduced effective diffusivity of particles leads to the reduced thermal escape of the hot particles from the cold cluster. In addition, the interface between hot and cold clusters turns into a line in 2D systems from a surface in 3D systems. Also, the 2D systems can be viewed as a 3D confined system having an infinitesimal extent in one of the directions. These characteristics result in enhanced trapping of hot particles in cold clusters in two-dimensional systems. This phenomenon offers an explanation for the features observed in Fig:11(A) and (B). To quantify the trapping of hot particles, we define: , which denotes the fraction of hot and cold particles in the largest cluster with respect to the total particles in the cluster: . Also denotes the fraction of particles taking part in the largest cluster and denotes the fraction of hot particles in the largest cluster, with respect to the corresponding hot system size.
In fig. 13A) we show the behaviour of and with for 2D bulk systems. We observe that for a specific density , there is a rapid rise in the values of both the quantities with activity. This indicates that the size of the largest cluster as well as the number of trapped hot particles in the cluster rises with activity and then saturates to a certain value. We also note that the saturation value of also grows with density, which is evidence of the enhanced trapping of hot particles as density is increased. This, in turn, explains why even for 2D bulk cases, we observe reduction in the phase separation with density (fig 11 A).
We also showed in Fig:11B that for confined systems there is a reduction in the phase separation with density. In addition to the enhanced trapping as discussed earlier, we also find that the variation of the local packing fractions in the simulation region also plays a role. We divide the x-confined system into a number of slabs along x-axis and plot the local packing fraction in each slab as a function (Fig:13). The local packing fraction is defined as , where denotes the number of particles in a slab of width at a distance . Due to the ordered structures in the cold domain near the wall, the local packing fraction attains a high value, whereas the dilute hot zone gives rise to the lower values of . We notice that the maximum local packing fraction for the system increases with the initial density . To give a quantitative idea, we note that for , the maximum local packing fraction (observed near ), whereas for , (observed near ). This means that as the total density increases, the virial pressure acting on the hot particles that are trapped inside the cold cluster also rises considerably. This prohibits their diffusion to the hot zone and keeps them trapped inside the cold cluster. This sustained trapping of hot particles in the cold cluster in turn reduces the phase separation between the active and passive particles for confined systems as the density increases.
| Periodicity | % of total particles in largest cluster () | % of hot particles in cluster w.r.to cluster size () | % of cold particles in cluster w.r.to cluster size () |
|---|---|---|---|
| 2D bulk | 76.59 0.78 | 38.18 1.27 | 61.82 0.85 |
| x-confined | 89.97 0.33 | 46.54 0.43 | 53.46 0.35 |
| xy-confined | 87.44 0.37 | 45.13 0.51 | 54.87 0.37 |
In general, for 2D bulk and confined systems, as the activity is increased, the size of the largest cluster ( or ) increases. In Fig 12B), we observe that for a specific density of , there is a reduction in the extent of phase separation for confined systems compared to their bulk counterparts. This can be explained by analyzing values for the bulk and confined systems at density . For the confined system, at , the fraction of hot particles trapped in the largest cluster also is greater compared to the bulk systems ( at , see table 1). As a result, when , because the fraction of trapped hot particles is higher in confined cases than in periodic conditions, the order parameter is lower in confined systems than in bulk systems. In this way, the rise in hot particle trapping in cold clusters for confined systems explains the observed drop in phase separation order parameter for such confined systems in 2D at (Fig:12B)
We conclude this section by briefly summarising the main results of this section. We observe that when the state of confinement is fixed and the density is varied, both the 2D bulk and confined systems show a reduction of phase separation between active and passive particles with density. This phenomenon is explained by analysing the trapping of hot particles in the largest cluster in the system and also using the spatial variation of the local packing fractions of the confined systems (fig 13). Next, we observe that fixing the density and varying the state of confinement, at , the saturation value of is reduced for x-confined and xy-confined states compared to bulk systems ( Fig:12). We justify this observation via the analysis of enhanced trapping of hot particles in the cold cluster (table 1). A general finding about 2D systems is the significant amount of trapping of hot particles in the cold cluster, which rises with density in both the bulk and confined scenarios. As a result, 2D binary mixtures at high densities can be thought of as the coexistence of a dense and dilute phase. This phenomenon is typical of 2D systems, and we address it in greater depth for the case of confinement on spherical surface in the following section.
3.5 Effect of topology
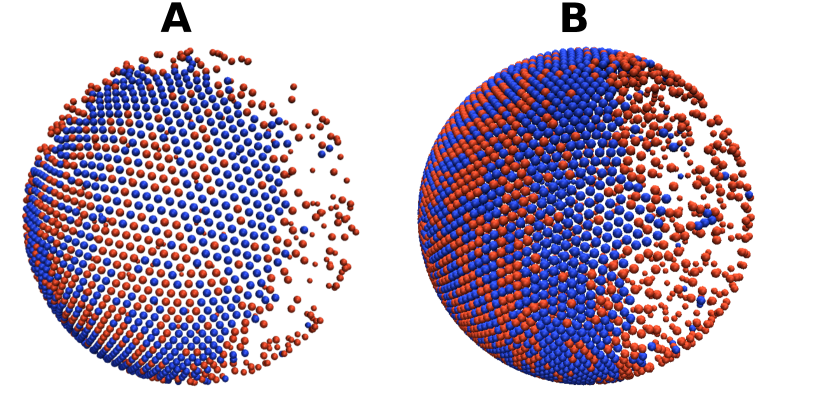
The xy-confined state of confinement describes a system where the particles are confined from all directions. A spherical surface too corresponds to a similar finite-sized confined system. Such spherical systems will also reveal the effect of curvature on the various aspect of phase separation. Thus, to study the effect of topology and curvature, we simulate a binary system of LJ particles where particles are constrained to move on the surface of the sphere. At every step, the positions and force vectors are projected back onto the local tangent plane to restrict the particles to the curved surface (eqn (4) and (5)). The equation of motion was integrated using the RATTLE algorithm 72 in LAMMPS. This algorithm yields results that, for suitably small integration timestep , are identical to those of actual motion on a spherical surface 85. In line with the prevailing practice seen in many recent studies 86, 47, 87, 88, 42, we have chosen to adhere to the convention of taking packing fraction as the measure of the concentration of the particles on the spherical surface. The packing fraction of particles on the spherical surface is defined as . Also, we restrain from studying the effect of the radius of curvature of the constraining sphere, and hence the simulations were carried out for a specific radius of the sphere, . Hence to change the packing fractions, the number of particles () is changed, keeping the radius fixed. Also, the challenge of sustaining high activity for such spherical confinement, as elaborated further in subsequent discussions, prompts us to adopt an equilibrium temperature of . The instantaneous equilibrium configuration for such a system at packing fraction , at is shown in fig 1D. The particles are in a liquid state and are homogeneously dispersed over the surface of the sphere. Implementing the two-temperature model for the simulation of non-equilibrium behaviour, the observed steady-state configuration at is shown in Fig:14B ( the corresponding snapshot for is shown in Fig:14A).
The collision between the hot and cold particles helps in the exchange of energy between the particles, due to which we observe . In addition to that, as the mechanical constraints eq. 4 and 5 imposed on the particle position and velocity at each step of the simulation, it is harder to maintain the desired activity using the equilibrium thermostats for such spherical confinements, and therefore, we obtained a significantly lesser value of the observed activity compared to the desired activity (fig 15A). The definitions of are given in section 2.
At equilibrium () the LJ particles form a liquid phase and they are homogeneously distributed over the surface of the sphere. When we increase the temperature of the hot particles to a high value (), we observe the formation of a dilute fluidlike phase, rich with hot particles, in co-existence with a solid-like dense region, which is made up of many hot particles trapped inside cold clusters (fig 14 A, B). There is a circular band of cold particles (with finite width) forming at the interface between the two regions, which is necessary for the stability of the two co-existing phases. Since the particles are constrained on the surface of the sphere, defects are inevitable in the dense solid-like region. Therefore we calculated the defect structures for the solid-like phase and found that, apart from particles having co-ordination number 6, there are disclination defects where the number of nearest neighbours of a particle can be either 7 or 5 (see SI, fig 4). These two types of defect points often stay together forming dislocations, which are also "grain boundary scars", which separate the different domains within the crystalline structure. We note that earlier simulation works 88 of a binary mixture of self-propelled active and passive particles on spherical surface exhibit various other organisations and structures depending on the interplay between the polar alignment and rotational diffusion of the active particles.
Next, We studied the effect of curved surfaces on the phase separation between the active and passive particles. In order to quantify the phase separation order parameter for such spherical surface confinement, we divide the whole surface of the sphere into equal areas. For that, the azimuthal angle and the polar angle were divided accordingly. The details are discussed in section 2.
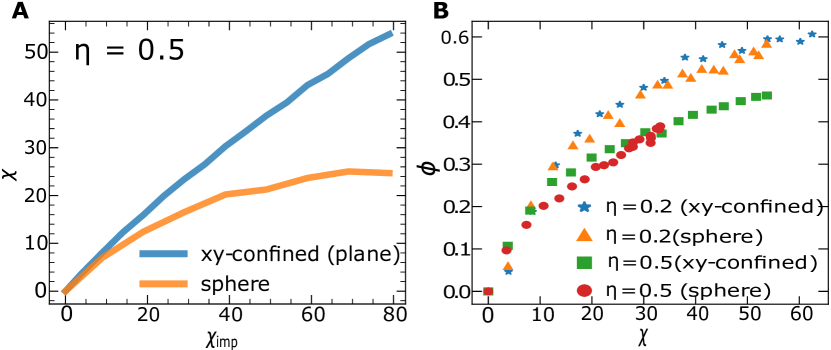
The results of order parameter calculations are shown in Fig:15B. We plotted the phase separation order parameter vs activity for two different packing fractions for spherical confinement, namely and . To compare the results with a xy-confined system, we also plotted the order parameter for the same at similar packing fractions(length of the plane) (Fig:15B). We observe that: i) for the spherical surface confinement of the LJ binary mixture, the degree of phase separation between active and passive particles decreases as the packing fraction is increased. This is the same effect as observed in any other 2D system (bulk, x-confined or xy-confined) as discussed in detail in subsection 3.4. Therefore we conclude that the reduction in the extent of phase separation between active and passive particles as the packing fraction of the particles is increased- is a general phenomenon observed in 2D systems, independent of curvature or topology of the confining surface. ii) When we compare the order parameter values between the xy-confined and spherically confined systems for a given packing fraction at different activities(), we find that the values are nearly identical. Hence, we conclude that the curvature has no substantial influence on the phase separation order parameter. Note that these comparisons are carried out by simulating the xy-confined and spherically confined systems with equal surface areas of the confining geometry, to bring out solely the effect of constant curvature of the surface.
Although we showed that the order parameters are similar for the xy-confined and spherically confined systems, there are certain aspects where these two systems differ. As discussed, one such aspect is the difference between the imposed and obtained activity (), which is larger for the spherically confined system (as shown in Fig:15(A)), the reason for which is discussed earlier.
A general observation for all considered 2D systems: bulk, planar confinement, and spherical confinement, is that as density increases, the phase separation reduces, which is the result of the increased trapping of hot particles in cold cluster. Hence, the systems can be also analysed in view of a dense-dilute phase co-existence, which is evocative of MIPS in 2D ABPs. The details are discussed in the next subsection.
3.6 2-TIPS vs MIPS
From the earlier sections we observe that, for 2D systems, the phase separation between the active and passive particles decreases at high densities. In fact, for the cases of spherical confinement, at high packing fractions (, fig 14B), we observe that the system phase separates between dilute and dense phases where a significant portion of the hot particles are trapped inside the domain of cold ones. For example, we found that , and , which means that of the total number of particles forms the largest cluster and of the particles in the largest cluster are hot particles (at ).
Therefore, for the binary mixture of active and passive particles on the spherical surface, instead of further examining the phase separation between the two types of particles, an alternative approach is to consider the system as exhibiting the coexistence between a dense crystalline solid-like region and a dilute gaseous region. The dense region is composed of particles having small velocities and in the dilute region, the particle velocities are high. This effect is reminiscent of the Motility Induced Phase separation (MIPS) that has been observed for the purely active systems, which shows a co-existence between a dense and a dilute phase. We, therefore, have studied some of the aspects of MIPS in our cases, to have the comparison between 2-TIPS and MIPS phenomena.
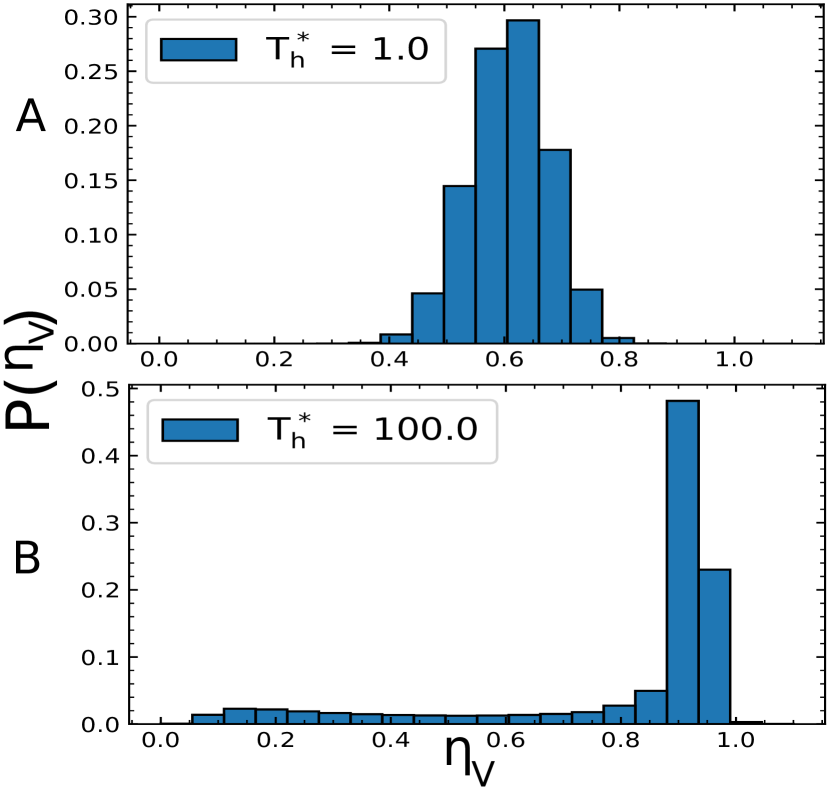
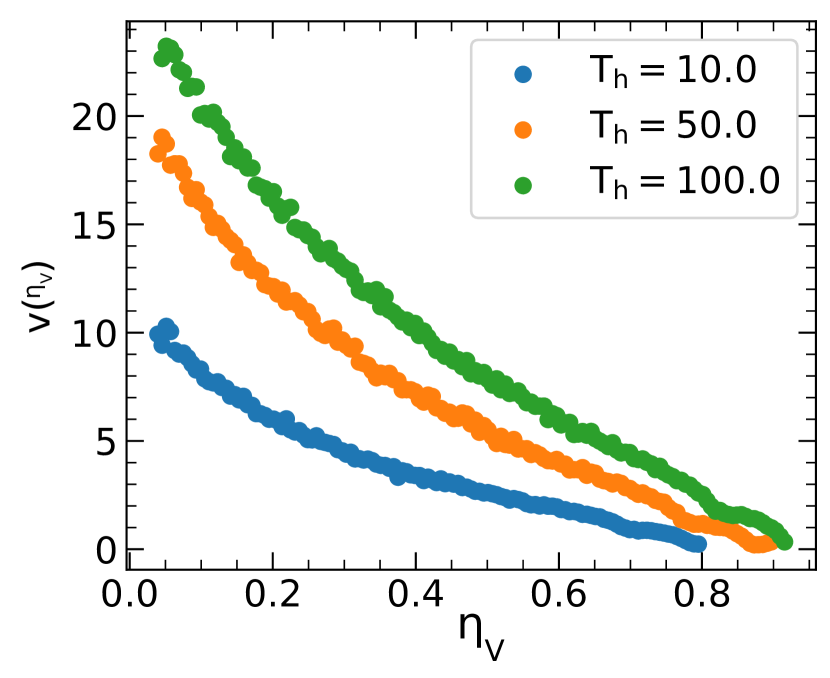
In fig 16, we calculate the Voronoi packing fraction (which is defined as , where is the Voronoi area associated with each of the particles) for each of the particles at different activities. Note that, due to the intrinsic topology of the confinement, the local packing fractions are either undefined or carry significant statistical error due to a lesser number of data points. Hence, to quantify the packing fractions of the co-existing phases, we resort to the calculation of Voronoi packing fractions associated with each particle, and not the calculation of local packing fractions. Fig:16A) shows that at equilibrium (at at ), the distribution of is a Gaussian one (with finite extent), centered around the value . At , the distribution of (Fig:16B) shows a prominent peak around the value , whereas another small peak is observed at around . This shows a co-existence of a dense and dilute phase on the spherical surface, at corresponding packing fractions . Similar values of co-existent densities were obtained by Iyer 89 in a system of ABPs on a spherical surface. Simulating a system of ABPs on a 2D plane, Redner 15 showed, starting with an initial packing fraction , the system demonstrates co-existence of two phases at packing fractions . In addition to these observations, in Fig:17, we also show the average velocity of the particles and their dependence on their Voronoi packing fractions. We see a clear decreasing behaviour of the velocities with the Voronoi packing fractions, for different activities, which is a signature characteristic of MIPS.
Note that although the co-existence of a dense and dilute region of the particles on spherical surface, and the decreasing velocity of the particles with packing fraction are some of the similarities of the 2-TIPS on the spherical surface with MIPS, there are some distinct dissimilarities too. MIPS is observed in purely active systems, whereas we are observing it in a binary mixture of active and passive systems. Also, the phase co-existence is spontaneous for purely active systems and all the particles start with equal self-propelled velocity, but in 2-TIPS at high activity, there is an inherent velocity difference in the two types of particles, manifested by the two different temperatures.
4 Conclusion:
In this work, we examined the effect of confinement, geometry and topology on the phase separation phenomena in a system of a mixture of active and passive particles using the two-temperature model. We observe that:
i) For parallel wall confinement in 3D and for all 2D systems with or without confinement, the phase separation order parameter (although increasing with activity always) decreases as density is increased, which is completely opposite to the 3D bulk behaviour.
ii) For a specific density, the parallel confinement can either enhance (3D, ) or reduce (3D, ;2D, ), or almost unalter (2D, ) the extent of phase separation between the active and passive particles compared to unconfined systems. The interface between the phase-separated dense cold cluster and the dilute gaseous hot domain is always observed to form parallel to the confining wall. Enhancement of clustering due to confinement 65 and accumulation of particles near the wall surface 90, with experimental evidence 64 has been reported earlier as well.
iii) When the particles are confined inside of a spherical cavity, we observe the active and passive particles clearly phase separate and the type of phase separation changes with increasing the radius of the spherical cavity. When the radius of the cavity is small, the phase separation is observed in the radial direction, where the cold particles occupy the periphery of the confining sphere and the hot dilute zone is formed in the interior. As the radius of the spherical cavity increases, the bulk effects set in, and the phase separation is of Cartesian type. Spherical cavity confinement is always observed to enhance the phase separation compared to bulk cases at all observed densities. The confined steady states show a compression along the direction parallel to the wall in the cold zone, another feature completely opposite to the bulk (unconfined) cases.
iv) 2D systems in general shows enhanced trapping of hot particles in the cold cluster due to the reduced diffusivity of the particles. Thus, in the case of the binary mixture constrained on the surface of a sphere, our investigation encompassed not only the analysis of phase separation between active and passive particles but also the examination of a phase coexistence scenario involving a dilute gaseous phase and a densely packed crystalline domain.
The dense crystalline phase on the surface of the sphere shows various defect structures which exist solely due to the topological constraint. These structures were compared with MIPS in 2D and various similarities as well as dissimilarities were figured out.
The future directions of this work may include the simulation of mixed systems on other topological surfaces and see whether they play any significant role in the phase separation phenomena or not. It will also be interesting to study the interplay between shape anisotropy and confinement by simulating mixtures of anisotropic particles under different geometric confinement. By changing the ratio between the active and passive particles, some critical activity can be determined for the different topological constraint cases, which would lead to some phase diagrams, which we can experimentally verify. These kinds of phase diagrams can be helpful in the experiments such as the behaviour of bacterial microswimmers on spherical liquid droplets and so on. Further analysis is required to study the dynamics of cold cluster formation both in the presence and absence of walls. The study of finite size effects and cluster dynamics along with stability analysis of the clusters will lead to a better understanding of the physics behind the phase separation processes in such binary mixtures in confined geometry and curved surfaces. We would like to publish further works along these lines in the upcoming days.
Author contributions
Nayana Venkatareddy and Jaydeep Mandal: conceptualization, methodology, investigation, visualization, formal analysis, writing. Prabal K. Maiti: conceptualization, visualization, supervision, writing-review and editing. The manuscript was written through contribution from all authors.
Conflicts of interest
There are no conflicts to declare.
Acknowledgements
NV and JM thank MHRD, India for the fellowship. PKM thanks DST, India for financial support and SERB, India for funding and computational support. We also thank Profs. Chandan Dasgupta and Sriram Ramaswamy for the insightful discussions.
Notes and references
- Marchetti et al. 2013 M. C. Marchetti, J.-F. Joanny, S. Ramaswamy, T. B. Liverpool, J. Prost, M. Rao and R. A. Simha, Reviews of modern physics, 2013, 85, 1143.
- Toner et al. 2005 J. Toner, Y. Tu and S. Ramaswamy, Annals of Physics, 2005, 318, 170–244.
- Romanczuk et al. 2012 P. Romanczuk, M. Bär, W. Ebeling, B. Lindner and L. Schimansky-Geier, The European Physical Journal Special Topics, 2012, 202, 1–162.
- Prost et al. 2015 J. Prost, F. Jülicher and J.-F. Joanny, Nature physics, 2015, 11, 111–117.
- Ramaswamy 2019 S. Ramaswamy, Nature Reviews Physics, 2019, 1, 640–642.
- Simha and Ramaswamy 2002 R. A. Simha and S. Ramaswamy, Physical review letters, 2002, 89, 058101.
- Bowick et al. 2022 M. J. Bowick, N. Fakhri, M. C. Marchetti and S. Ramaswamy, Physical Review X, 2022, 12, 010501.
- Buttinoni et al. 2013 I. Buttinoni, J. Bialké, F. Kümmel, H. Löwen, C. Bechinger and T. Speck, Phys. Rev. Lett., 2013, 110, 238301.
- Kumar and Chakrabarti 2023 P. Kumar and R. Chakrabarti, Phys. Chem. Chem. Phys., 2023, 25, 1937–1946.
- Chaki and Chakrabarti 2020 S. Chaki and R. Chakrabarti, Soft Matter, 2020, 16, 7103–7115.
- Mandal et al. 2022 R. Mandal, S. K. Nandi, C. Dasgupta, P. Sollich and N. S. Gov, Journal of Physics Communications, 2022, 6, 115001.
- Schnitzer 1993 M. J. Schnitzer, Physical Review E, 1993, 48, 2553.
- Cates and Tailleur 2015 M. E. Cates and J. Tailleur, Annu. Rev. Condens. Matter Phys., 2015, 6, 219–244.
- Fily and Marchetti 2012 Y. Fily and M. C. Marchetti, Physical review letters, 2012, 108, 235702.
- Redner et al. 2013 G. S. Redner, M. F. Hagan and A. Baskaran, Physical review letters, 2013, 110, 055701.
- Buttinoni et al. 2013 I. Buttinoni, J. Bialké, F. Kümmel, H. Löwen, C. Bechinger and T. Speck, Physical review letters, 2013, 110, 238301.
- Ginot et al. 2015 F. Ginot, I. Theurkauff, D. Levis, C. Ybert, L. Bocquet, L. Berthier and C. Cottin-Bizonne, Physical Review X, 2015, 5, 011004.
- McCandlish et al. 2012 S. R. McCandlish, A. Baskaran and M. F. Hagan, Soft Matter, 2012, 8, 2527–2534.
- Stenhammar et al. 2015 J. Stenhammar, R. Wittkowski, D. Marenduzzo and M. E. Cates, Physical review letters, 2015, 114, 018301.
- Dolai et al. 2018 P. Dolai, A. Simha and S. Mishra, Soft Matter, 2018, 14, 6137–6145.
- Singh et al. 2022 J. P. Singh, S. Pattanayak, S. Mishra and J. Chakrabarti, The Journal of Chemical Physics, 2022, 156, 214112.
- Hinz et al. 2014 D. F. Hinz, A. Panchenko, T.-Y. Kim and E. Fried, Soft Matter, 2014, 10, 9082–9089.
- Weber et al. 2013 C. A. Weber, T. Hanke, J. Deseigne, S. Léonard, O. Dauchot, E. Frey and H. Chaté, Physical review letters, 2013, 110, 208001.
- Ganai et al. 2014 N. Ganai, S. Sengupta and G. I. Menon, Nucleic acids research, 2014, 42, 4145–4159.
- Grosberg and Joanny 2015 A. Y. Grosberg and J.-F. Joanny, Physical Review E, 2015, 92, 032118.
- Grosberg and Joanny 2018 A. Y. Grosberg and J.-F. Joanny, Polymer Science, Series C, 2018, 60, 118–121.
- Netz 2020 R. R. Netz, Phys. Rev. E, 2020, 101, 022120.
- Chari et al. 2019 S. S. N. Chari, C. Dasgupta and P. K. Maiti, Soft matter, 2019, 15, 7275–7285.
- Venkatareddy et al. 2023 N. Venkatareddy, S.-T. Lin and P. K. Maiti, Phys. Rev. E, 2023, 107, 034607.
- Chattopadhyay et al. 2021 J. Chattopadhyay, S. Pannir-Sivajothi, K. Varma, S. Ramaswamy, C. Dasgupta and P. K. Maiti, Physical Review E, 2021, 104, 054610.
- Chattopadhyay et al. 2023 J. Chattopadhyay, S. Ramaswamy, C. Dasgupta and P. K. Maiti, Phys. Rev. E, 2023, 107, 024701.
- Smrek and Kremer 2017 J. Smrek and K. Kremer, Physical review letters, 2017, 118, 098002.
- Smrek and Kremer 2018 J. Smrek and K. Kremer, Entropy, 2018, 20, 520.
- Elismaili et al. 2022 M. Elismaili, D. Gonzalez-Rodriguez and H. Xu, The European Physical Journal E, 2022, 45, 86.
- Keller et al. 2008 P. J. Keller, A. D. Schmidt, J. Wittbrodt and E. H. Stelzer, science, 2008, 322, 1065–1069.
- Collinson et al. 2002 J. M. Collinson, L. Morris, A. I. Reid, T. Ramaesh, M. A. Keighren, J. H. Flockhart, R. E. Hill, S.-S. Tan, K. Ramaesh, B. Dhillon et al., Developmental dynamics: an official publication of the American Association of Anatomists, 2002, 224, 432–440.
- Vahid et al. 2017 A. Vahid, A. Šarić and T. Idema, Soft Matter, 2017, 13, 4924–4930.
- Fernández-Nieves et al. 2007 A. Fernández-Nieves, V. Vitelli, A. S. Utada, D. R. Link, M. Márquez, D. R. Nelson and D. A. Weitz, Physical review letters, 2007, 99, 157801.
- Bates 2008 M. A. Bates, The Journal of chemical physics, 2008, 128, 104707.
- Dhakal et al. 2012 S. Dhakal, F. J. Solis and M. O. De La Cruz, Physical Review E, 2012, 86, 011709.
- Shin et al. 2008 H. Shin, M. J. Bowick and X. Xing, Physical review letters, 2008, 101, 037802.
- Rajendra et al. 2023 D. Rajendra, J. Mandal, Y. Hatwalne and P. K. Maiti, Soft Matter, 2023, 19, 137–146.
- Lopez-Leon et al. 2011 T. Lopez-Leon, V. Koning, K. Devaiah, V. Vitelli and A. Fernandez-Nieves, Nature Physics, 2011, 7, 391–394.
- Zhang et al. 2016 R. Zhang, Y. Zhou, M. Rahimi and J. J. De Pablo, Nature communications, 2016, 7, 1–9.
- Law et al. 2018 J. O. Law, A. G. Wong, H. Kusumaatmaja and M. A. Miller, Molecular Physics, 2018, 116, 3008–3019.
- Law et al. 2020 J. O. Law, J. M. Dean, M. A. Miller and H. Kusumaatmaja, Soft Matter, 2020, 16, 8069–8077.
- Janssen et al. 2017 L. Janssen, A. Kaiser and H. Löwen, Scientific reports, 2017, 7, 1–13.
- Ndlec et al. 1997 F. Ndlec, T. Surrey, A. C. Maggs and S. Leibler, Nature, 1997, 389, 305–308.
- Lauga et al. 2006 E. Lauga, W. R. DiLuzio, G. M. Whitesides and H. A. Stone, Biophysical journal, 2006, 90, 400–412.
- Tailleur and Cates 2009 J. Tailleur and M. Cates, EPL (Europhysics Letters), 2009, 86, 60002.
- Harshey 2003 R. M. Harshey, Annual review of microbiology, 2003, 57, 249.
- Araújo et al. 2023 N. A. M. Araújo, L. M. C. Janssen, T. Barois, G. Boffetta, I. Cohen, A. Corbetta, O. Dauchot, M. Dijkstra, W. M. Durham, A. Dussutour, S. Garnier, H. Gelderblom, R. Golestanian, L. Isa, G. H. Koenderink, H. Löwen, R. Metzler, M. Polin, C. P. Royall, A. Šarić, A. Sengupta, C. Sykes, V. Trianni, I. Tuval, N. Vogel, J. M. Yeomans, I. Zuriguel, A. Marin and G. Volpe, Soft Matter, 2023, 19, 1695–1704.
- Binder et al. 2010 K. Binder, S. Puri, S. K. Das and J. Horbach, Journal of Statistical Physics, 2010, 138, 51–84.
- Brumby et al. 2017 P. E. Brumby, H. H. Wensink, A. J. Haslam and G. Jackson, Langmuir, 2017, 33, 11754–11770.
- Rothschild 1963 Rothschild, Nature, 1963, 198, 1221.
- Berke et al. 2008 A. P. Berke, L. Turner, H. C. Berg and E. Lauga, Physical Review Letters, 2008, 101, 038102.
- Winet et al. 1984 H. Winet, G. Bernstein and J. Head, Reproduction, 1984, 70, 511–523.
- Kudrolli et al. 2008 A. Kudrolli, G. Lumay, D. Volfson and L. S. Tsimring, Physical review letters, 2008, 100, 058001.
- Elgeti and Gompper 2009 J. Elgeti and G. Gompper, EPL (Europhysics Letters), 2009, 85, 38002.
- Coasne et al. 2014 B. Coasne, Y. Long and K. Gubbins, Molecular Simulation, 2014, 40, 721–730.
- Kreuter et al. 2013 C. Kreuter, U. Siems, P. Nielaba, P. Leiderer and A. Erbe, The European Physical Journal Special Topics, 2013, 222, 2923–2939.
- Vilfan et al. 2008 M. Vilfan, N. Osterman, M. Čopič, M. Ravnik, S. Žumer, J. Kotar, D. Babič and I. Poberaj, Physical review letters, 2008, 101, 237801.
- Yang et al. 2014 X. Yang, M. L. Manning and M. C. Marchetti, Soft Matter, 2014, 10, 6477–6484.
- Williams et al. 2022 S. Williams, R. Jeanneret, I. Tuval and M. Polin, Nature Communications, 2022, 13, 4776.
- Schönhöfer and Glotzer 2022 P. W. A. Schönhöfer and S. C. Glotzer, Soft Matter, 2022, 18, 8561–8571.
- Speck and Jack 2016 T. Speck and R. L. Jack, Phys. Rev. E, 2016, 93, 062605.
- Bera et al. 2023 A. Bera, K. Binder, S. A. Egorov and S. K. Das, Soft Matter, 2023, 19, 3386–3397.
- Wensink and Löwen 2008 H. H. Wensink and H. Löwen, Phys. Rev. E, 2008, 78, 031409.
- Thompson et al. 2022 A. P. Thompson, H. M. Aktulga, R. Berger, D. S. Bolintineanu, W. M. Brown, P. S. Crozier, P. J. in ’t Veld, A. Kohlmeyer, S. G. Moore, T. D. Nguyen, R. Shan, M. J. Stevens, J. Tranchida, C. Trott and S. J. Plimpton, Comp. Phys. Comm., 2022, 271, 108171.
- Evans and Holian 1985 D. J. Evans and B. L. Holian, The Journal of chemical physics, 1985, 83, 4069–4074.
- Berendsen et al. 1984 H. J. Berendsen, J. v. Postma, W. F. Van Gunsteren, A. DiNola and J. R. Haak, The Journal of chemical physics, 1984, 81, 3684–3690.
- Paquay and Kusters 2016 S. Paquay and R. Kusters, Biophysical journal, 2016, 110, 1226–1233.
- Johnson et al. 1993 J. K. Johnson, J. A. Zollweg and K. E. Gubbins, Molecular Physics, 1993, 78, 591–618.
- Barker et al. 1981 J. Barker, D. Henderson and F. Abraham, Physica A: Statistical Mechanics and its Applications, 1981, 106, 226–238.
- Essafri et al. 2019 I. Essafri, D. Morineau and A. Ghoufi, npj Computational Materials, 2019, 5, 42.
- Guo et al. 2014 X.-Y. Guo, T. Watermann and D. Sebastiani, The Journal of Physical Chemistry B, 2014, 118, 10207–10213.
- Peterson et al. 1988 B. K. Peterson, K. E. Gubbins, G. S. Heffelfinger, U. Marini Bettolo Marconi and F. van Swol, The Journal of Chemical Physics, 1988, 88, 6487–6500.
- Mittal et al. 2006 J. Mittal, J. R. Errington and T. M. Truskett, Phys. Rev. Lett., 2006, 96, 177804.
- Huang et al. 2013 H. C. Huang, Y. J. Yoon and S. K. Kwak, Molecular Physics, 2013, 111, 3283–3288.
- Giarritta et al. 1993 S. Giarritta, M. Ferrario and P. Giaquinta, Physica A: Statistical Mechanics and its Applications, 1993, 201, 649–665.
- Galteland et al. 2021 O. Galteland, D. Bedeaux and S. Kjelstrup, Nanomaterials, 2021, 11, 165.
- Galteland et al. 2022 O. Galteland, M. T. Rauter, K. K. Varughese, D. Bedeaux and S. Kjelstrup, arXiv preprint arXiv:2201.13060, 2022.
- Shi et al. 2023 K. Shi, E. R. Smith, E. E. Santiso and K. E. Gubbins, The Journal of Chemical Physics, 2023, 158, 040901.
- Ikeshoji et al. 2003 T. Ikeshoji, B. Hafskjold and H. Furuholt, Molecular Simulation, 2003, 29, 101–109.
- Apaza and Sandoval 2017 L. Apaza and M. Sandoval, Physical Review E, 2017, 96, 022606.
- Sknepnek and Henkes 2015 R. Sknepnek and S. Henkes, Physical Review E, 2015, 91, 022306.
- Henkes et al. 2018 S. Henkes, M. C. Marchetti and R. Sknepnek, Physical Review E, 2018, 97, 042605.
- Ai et al. 2020 B.-q. Ai, B.-y. Zhou and X.-m. Zhang, Soft Matter, 2020, 16, 4710–4717.
- Iyer et al. 2022 P. Iyer, R. G. Winkler, D. A. Fedosov and G. Gompper, arXiv preprint arXiv:2212.08561, 2022.
- Yang et al. 2014 X. Yang, M. L. Manning and M. C. Marchetti, Soft matter, 2014, 10, 6477–6484.