Optical Properties and Variability of the Be X-ray binary CPD 29 2176
Abstract
Be X-ray binaries (Be XRBs) are high-mass X-ray binaries, with a neutron star or black hole orbiting and accreting material from a non-supergiant B-star that is rotating at a near critical rate. These objects are prime targets to understand past binary interactions as the neutron star or black hole progenitor likely experienced Roche lobe overflow to spin up the Be star we observe now. The stellar variability can then allow us to explore the stellar structure of these objects. It was recently demonstrated that the high-mass X-ray binary CPD 29 2176 descended from an ultra-stripped supernova and is a prime target to evolve into an eventual binary neutron star and kilonova. We present the photometric variability from both TESS and ASAS-SN along with the spectral properties and disk variability of the system in this paper. All of the optical lines are contaminated with disk emission except for the He II 4686 absorption line. The disk variability time-scales are not the same as the orbital time scale, but could be related to the X-ray outbursts that have been recorded by Swift. We end our study with a discussion comparing CPD 29 2176 to classical Be stars and other Be X-ray binaries, finding the stellar rotation to be near a frequency of 1.5 cycles d-1, and exhibiting incoherent variability in three frequency groups.
1 Introduction
X-ray binaries are luminous X-ray sources in the sky and consist of a compact object such as a white dwarf, neutron star, or a black hole, orbiting a normal companion star which is often evolved (Paul & Naik, 2011). There are both low-mass and high-mass X-ray binaries, and in this paper we focus on the system CPD 29 2176, a high-mass X-ray binary (HMXB). HMXBs consist of a massive and/or early type B or O type star companion (Reig, 2011). HMXBs with a Be star companion, which is a rapidly-rotating, non-supergiant B star that shows spectral emission lines in at least the Balmer lines (Be stars), and a neutron star are called Be X-ray binaries (Be XRBs; Rivinius, 2019). Many of the widest systems among X-ray binaries are Be systems.
Be XRBs are usually considered close systems, meaning that mass transfer from the Be star to the compact object is ongoing (Reig, 2011). However, since Be stars are on or near the main sequence, and the periastron distance is still large compared to the stellar radius, the Be star is not filling its Roche lobe and the mass transfer is mediated by the Be disk which is considerably larger than the star itself. In Be XRBs, the orbit typically has a moderate eccentricity (e.g., Paul & Naik, 2011). Most of the time during the Be XRBs orbit, the neutron star will be far away from the circumstellar disc that surrounds the Be star. The disc is the main source of variability in Be XRBs because it evolves on a much faster timescale than other components in the binary. The disc emits optical and infrared light, which, in turn, contaminates the magnitudes, colors and the spectral lines of the underlying star. This makes it difficult to determine fundamental stellar parameters Reig et al. (2016a). However, the disc can be truncated by the compact companion, as evidenced with correlations between the maximum observed intensity of the H emission compared to either the orbital period (Reig, 2007; Antoniou et al., 2009) or the semi-major axis value.
Mass transfer from the disk onto the compact object is the source of X-rays observed in Be XRBs (Reig et al., 2016a). This equatorial disc is formed by matter expelled from the rapidly rotating Be star, although the exact mechanisms responsible for the mass ejection are still not fully understood, but may be linked to pulsation (e.g., Rivinius et al., 1998; Baade et al., 2018; Richardson et al., 2021). In a Be XRB with an eccentric orbit, the neutron star can pass close to or sometimes through the disc near periastron, which causes a major disruption to the system as kinetic energy from the in-falling matter is converted to X-ray radiation (Reig, 2011), which can trigger variations in the Be disk. Be stars often have rotational velocities at or near break-up or critical velocity. Studies have shown that a sizeable amount of Be stars rotate at 70-80% of the critical velocity (Paul & Naik, 2011). Many Be stars have been shown to have stripped companions such as sdO stars, providing evidence that they were spun up through past mass transfer in interacting binaries (e.g., Wang et al., 2018, 2021, , and references therein).
CPD 29 2176 is a fairly recently identified Be XRB. It was previously classified as B0Ve by Fernie et al. (1966), which was confirmed by both Reed & Fitzgerald (1983) and Vijapurkar & Drilling (1993). Richardson et al. (2023) found that the binary system has a history of evolution that indicates the X-ray component was formed during an ultra-stripped supernova, which produces minimal ejecta. Additionally, the binary’s orbit is similar to only one of 14 known Be X-ray binaries with published orbits in terms of both period and eccentricity.
An intriguing aspect of CPD 29 2176 is that it may be associated with a magnetar-like outburst in 2016. In March 2016, Swift BAT detected a short magnetar-like burst from an apparent new Soft Gamma Repeater, SGR 0755-2933 (Barthelmy et al., 2016). Such bursts are believed to be powered by neutron star crust fractures associated with magnetic field re-arrangements in magnetars (Thompson & Duncan, 1995). This object was monitored by Swift (e.g., Archibald et al., 2016) which placed an upper limit on pulsed fraction of the soft X-ray flux at 15% when it returned to a quiescent state. Furthermore, no pulsations were found at radio wavelengths (Surnis et al., 2016). While the object seems to possess many properties of magnetars, as evidenced by these early reported observations, Doroshenko et al. (2021) question the classification of the source as a magnetar and suggest it is a Be XRB with a normal neutron star based on an optically bright counterpart. The probability of a chance alignment in the sky of a massive star and a magnetar or isolated neutron star is low (Richardson et al., 2023), especially given the scarcity of these compact objects, making CPD 29 2176 a Be XRB given the orbit presented by Richardson et al. (2023). It is thus possible that the companion to the Be star is a magnetar rather than a normal neutron star. While Younes et al. (in prep.) find the source to be typical for a magnetar, we also caution that the astrometry of the source was accomplished with Chandra data, while the magnetar-like outburst was only observed with Swift. Instumental differences could still mean that the neutron star present in CPD 29 2176 is a standard neutron star and unrelated to the magnetar-like outburst. neutron star present is not a bona fide magnetar. Naze & Robrade (2023) showed the long-term X-ray light curve of CPD 29 2176 which shows the first, strong outburst, a potential rise towards a second outburst 300-400 d later, and two additional outbursts separated by d after a longer observational gap.
In this paper, we analyze the series of optical spectra presented for the orbital motion in Richardson et al. (2023) along with archival photometric time-series that have been recorded. We describe the observations in Section 2, and describe the photometric variations in Section 3. Section 4 describes the optical spectrum in depth with the variability in the disk emission lines shown in Section 5. We discuss our findings in Section 6 and conclude our study in Section 7.
2 Observations
2.1 Photometry
The All Sky Automated Survey (ASAS) and the All Sky Automated Survey for Supernovae (ASAS-SN) observed CPD 29 2176 over a large period of time. The ASAS data was taken from November 2000 to December 2009 with the band filter (Pojmanski, 1997, 2003). We examined the ASAS-SN with the -band filter that were taken from March 2016 to April 2018 (Shappee et al., 2014; Kochanek et al., 2017), but found that these data were saturated and thus unreliable.
The Transiting Exoplanet Survey Satellite (TESS) observed CPD 29 2176 in four 27 d sectors of its mission thus far: Sectors 7, 8, 34, and 61. We extracted the flux from the full-frame images for these observations. These sectors correspond to times around January 2019, February 2019, January 2021, and February 2023 respectively. The TESS photometric points have a precision of a few parts per 10,000 and are taken with a cadence of once every 30 minutes (sectors 7 and 8), 10 minutes (sector 34), and 200 seconds (sector 61).
2.2 Optical Spectroscopy
We collected optical spectroscopy of CPD 29 2176 with the CTIO 1.5 m telescope and echelle spectograph CHIRON from 2016-2021. CPD 29 2176 was observed 16 times between 2018 September 30 to 2019 May 20 (typically 3 spectra per night). It was observed again 2020 December 13 to 2021 January 25 (typically 2 spectra per night). The spectrograph has a spectral resolution of R 28,000 with a spectral range of 450-870 nm fixed. The spectra observed for each night were co-added and have a S/N of 50 in the continuum near the He I 5876 Å line. All spectra were normalized around the unit continuum. We analyzed the He I 5876 Å line, He I 6678 Å line, H line, and H line in the disk variability analysis presented here. These observations were also analyzed by Richardson et al. (2023), but only with the (photospheric) He II 4686 Å line.
3 The optical spectrum of CPD 29 2176
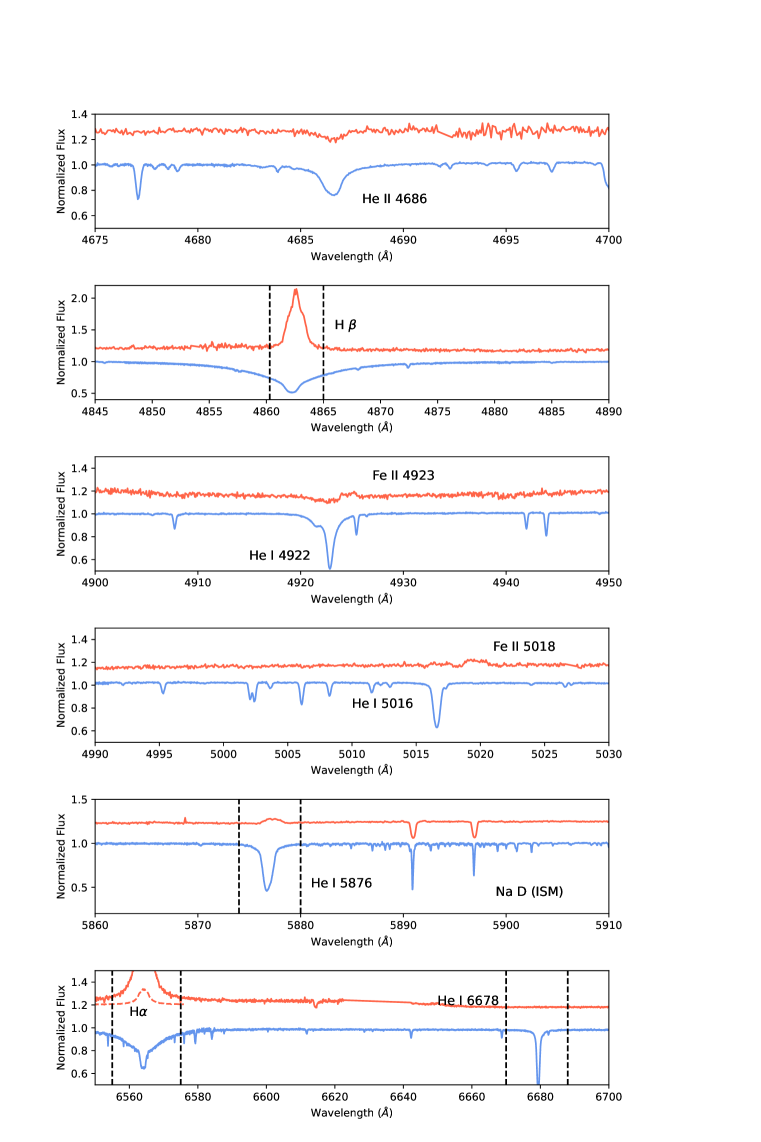
Richardson et al. (2023) presented the discovery of the orbital motion of CPD 29 2176 using optical spectroscopy obtained with the CHIRON spectrograph. Using these observations, we created an average spectrum of these spectra in order to increase the signal-to-noise ratio as well as to identify any lines of interest in the optical spectrum. As the semi-amplitude of the orbital motion is only a few km s-1, we did not shift the individual observations to the same -velocity as the lines are wider than the orbital motion amplitude. The resulting average spectrum is shown in Fig. 1, along with a comparison to a B0V standard star, Sco (Morgan & Keenan, 1973), taken with the ESPaDOnS spectrograph and obtained from the PolarBase archive (Donati et al., 1997; Petit et al., 2014). We use this star as CPD 29 2176 has been classified as a B0V star several times in the literature (Fernie et al., 1966; Reed & Fitzgerald, 1983; Vijapurkar & Drilling, 1993).
In Fig. 1, we note that the two strongest lines in the spectrum of CPD 29 2176 are the Balmer emission lines of H and H. These lines show a classic “wine bottle” shape with a narrow top on top of a broader emission. According to the models of Be stars, and the geometries presented by Hanuschik et al. (1996) and Rivinius et al. (2013), this corresponds to a near-pole on geometry for the Be disk. This agrees with the small semi-amplitude of the orbit and the proposed scenario presented by Richardson et al. (2023).
The optical He I lines appear nearly absent from the spectrum of the star, as seen around the positions of 4921, 5016, 5876, and 6678 Å in Fig. 1. Given the emission profile that is evident for the 5876 line and weak double-peaked emission profiles present at the other He I line positions, we suggest that these lines are present in the spectrum of the star, but have emission that fills the absorption for these lines. Near the He I 5876 Å emission line, we also note the two strong Na I absorption lines that are interstellar in nature.
The disk is also present and somewhat stronger in its emission for some Fe II lines in the spectrum. Evident in these observations shown in Fig. 1 are the Fe II lines that blend with He I lines, namely at 4924 and 5018 Å. These lines also show a weak but broad double-peaked geometry that is of similar width to the He I 5876 Å emission line. The presence of Fe II is only in emission, in contrast to ions such as He I which is seen in absorption for a standard B0V star and thus the observed He I lines are a mixture of both photospheric absorption and disk emission. Fe II emission can only arise from relatively cool circumstellar gas. This condition can be met in disks around early Be stars if the inner disk is sufficiently dense that it shields disk material from the ionizing stellar UV radiation. The result is a relatively cool pocket of gas at a few stellar radii (e.g., Fig. 9 in Marr et al., 2021), which is consistent with the wide doppler broadening of the Fe II emission observed in CPD 29 2176.
Lastly, we also show the weak He II absorption line at 4686 Å. This is the strongest He II line in the optical range and represents the hydrogen-like transition. The spectrum of CPD 29 2176 is dominated by strong emission lines formed in the Be decretion disk. The top panel of Fig. 1 shows the region surrounding the He II 4686 line. CPD 29 2176 shows a weak absorption line as was discussed by Richardson et al. (2023). There are multiple other weak, narrow absorption lines seen in the spectrum of the B0V standard star Sco. Likely these lines are either broadened by rotation of the Be star in CPD 29 2176 or filled by emission such that they are not present in our observations.
4 Photometric Variability
The TESS observations were collected over four sectors of the TESS mission. Each year with observations was collected with a higher cadence time-series than the previous, as is evident in the light curve presented in Fig. 2. The light curve variation is at the 1 level, and is primary stochastic but with some structure.

In Fig. 3, we present a Fourier analysis of the TESS light curve calculated with period04 (Lenz & Breger, 2005), with each sectors analyzed independently. We estimate the typical noise level for these periodograms to be about 0.014 parts per thousand. Our noise estimate is a typical value for the Fourier amplitude spectrum at high frequencies ( cycles d-1) where no coherent variations were present in the Fourier spectrum.
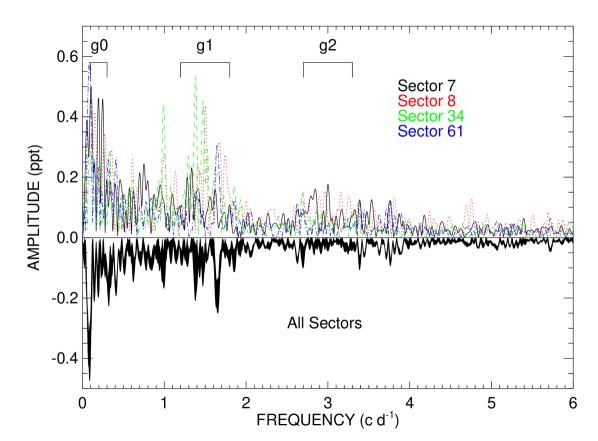
Of note in these Fourier periodograms are three regions that show power excess, representing three frequency groups in the light curve analysis. The first, which we label ‘g0’ in Fig. 3, is a low frequency group of peaks near 0.1 cycles d-1. This slow variability is very likely real and not just badly detrended systematics from the satellite but it is difficult to exactly pin down their nature. For example, these could represent difference frequencies between various oscillations in the light curve driven by pulsations, or they could represent slow, long-term evolution of the disk surrounding the Be star that is driven by a variable mass-loss rate into the disk. Such frequency groups are common in Be stars (e.g., Labadie-Bartz et al., 2022; Semaan et al., 2018; Baade et al., 2016).
We also label a strong group of frequencies ‘g1’ in Fig. 3, which is centered near 1.5 cycles d-1. The strongest peak in this region varies from sector to sector, and the Fourier analysis of the entire TESS light curve seems to show a frequency near the high-end of this group near 1.7 cycles d-1, but note that the frequency group spans from to cycles d-1. We would need a longer time-series to resolve if there are any genuine stable, coherent frequencies in the regime. However, the amplitude of these frequencies is very low, near about 0.2–0.4 parts per thousand, likely below the threshold for ground-based data sets. Similarly, there appears to be a lower-amplitude group just above the level of significance near 3 cycles d-1 group at ‘g2’. This frequency group pattern, with ‘g2’ located at twice the frequency of ‘g1’ is seen in the large majority of Be stars (Labadie-Bartz et al., 2022; Semaan et al., 2018). In the Fourier analysis of all four sectors of TESS data, we see the strongest signal in g2 is at 3.4 cycles d-1, where we also see a similar peak in each of the four sectors when analyzed separately. This frequency is about 2 the strongest frequency in g1 seen in the Fourier analysis of all four sectors.
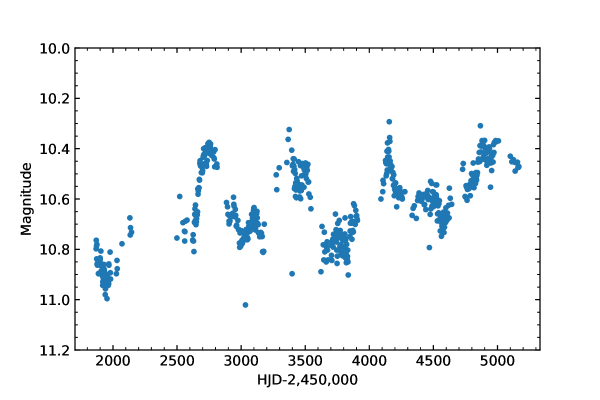
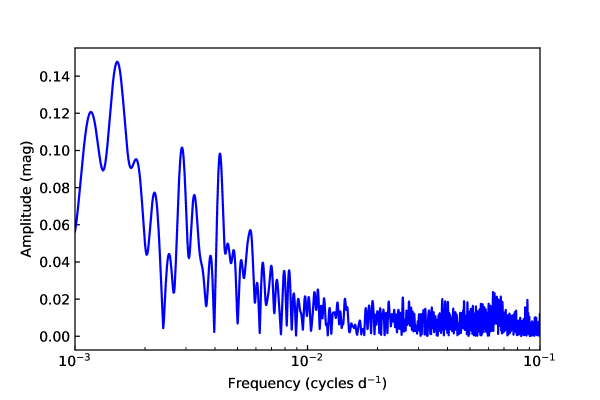
The long-term variabilty of CPD 29 2176 is best explored with the time-series from ground-based surveys such as ASAS, which we show in Fig. 4. The photometric data do not show evidences of eclipses but do show long term variations similar to other Be stars (Labadie-Bartz et al., 2017; Bernhard et al., 2018) including Be XRBs (Reig & Fabregat, 2015; Reig et al., 2023). In the ASAS data, we see multiple peaks in the light curve with a timescale of d. We examined a Fourier spectrum of the ASAS photometry using period04 (Lenz & Breger, 2005) and find a signal with a time-scale of 600-800 d, but this is not periodic as it does not phase well. We also subtracted long-term trends and found no evidence of the orbital period presented by Richardson et al. (2023). The Fourier spectrum is also shown in Fig. 4.
5 Long-term Variability of Disk lines
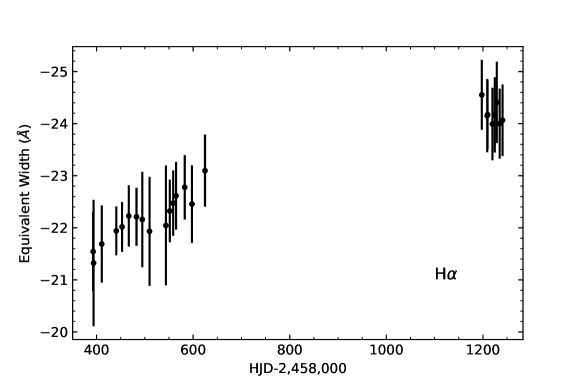
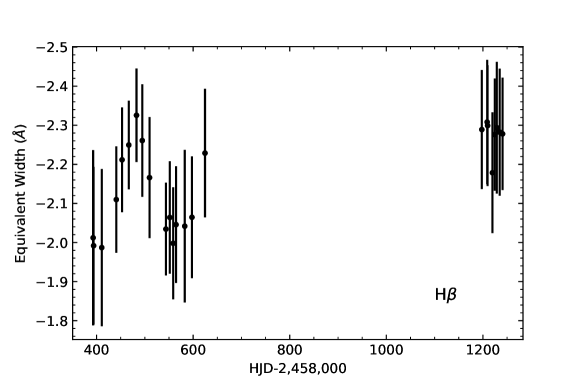
We measured the equivalent width of several disk emission lines in the CHIRON spectroscopy. We start this discussion with the H and H lines, which we show in Fig. 5. The H line is a spectral line in the Balmer series that is most influenced by the circumstellar environment (e.g., Buysschaert et al., 2017). To measure the H line, we normalized our spectra by the continuum before integrating the flux between 6552-6580 Å ( to km s-1 to secure a continuum measurement on both sides of the profile). From the equivalent widths of H, we observe a weak, but steady increase of the emission strength. The H line was measured by integrating between 4859-4865 Å ( to km s-1). These ranges were picked to reach the continuum as well as to avoid using multiple echelle orders in the measurement. The H equivalent width plot, Fig. 5, shows a small increase in the early observations that is not present in the H observations. For both data sets, the slow increases in equivalent width are longer than the orbital period of 59.6 days by Richardson et al. (2023). The equivalent widths of both H and H can be found in Table 1 along with the exposure times and the signal-to-noise ratio of the continuum near the echelle spectrograph’s blaze maximum.
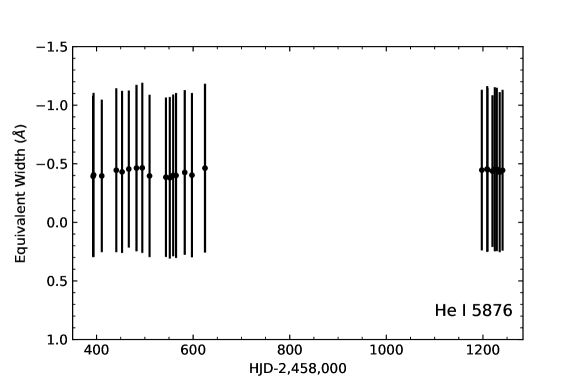
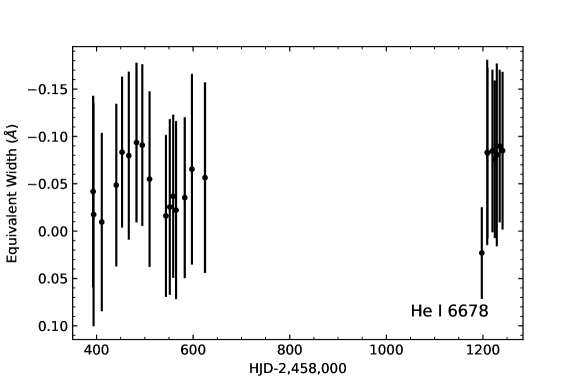
We also measured the equivalent width of two prominent helium lines in the spectra of CPD 29 2176, namely He I 5876 Å and He I 6678 Å which is shown in Fig. 6. These two helium lines are prominent in hot Be stars and tend to be in emission when the inner disk is dense. Once the spectrum was normalized, we measured the equivalent widths of the profiles over the range from 5874-5880 Å and over 6670-6688 Å for the 5876 and 6678 Å lines respectively. Neither of these lines show any statistically significant trends in their variations.
6 Discussion
The TESS photometry, ASAS photometry, and ground-based optical spectroscopy have provided us a first look into the variability of CPD 29 2176. This is an important system given the recent findings of Richardson et al. (2023), who showed that the He II 4686Å absorption line shows evidence for a circular orbit with a period of 59 d with a mass function that supports a neutron star in a nearly face-on orbit.
Thus far, we have shown that the optical light curve as observed with ASAS exhibits quasi-regular outbursts with a time-scale of 600 d. The optical spectroscopy, while too sparse to examine such long time scales, did not show signs of large disk variability with this same timescale, but did show some trends in the hydrogen line profiles. Neither these spectroscopic variations nor the photometric variations are coherent on the orbital time scale of 60 d.
CPD 29 2176 has several properties that are comparable to classical Be stars. Its H and H emission line profiles, shown in Fig. 1, have a “wine bottle” profile, which is consistent with a pole-on geometry of the disk. The binary evolution scenario presented by Richardson et al. (2023) would imply that the orbit and the Be star geometry would need to be co-planar. Thus, the disk emission line profiles support the evolutionary picture and allows us to consider the current evolutionary state of the system in comparison to other Be X-ray binaries. The disk profiles for CPD 29 2176 are not extremely variable in profile morphology or strength as evidenced in our analysis. As such, CPD 29 2176 with its circular orbit may represent a Be XRB that could be used to study a more stable geometry of a Be disk in a Be XRB. We also note that there could be an observational bias for CPD 29 2176 as the face-on geometry could also make this system appear more stable than other systems seen edge-on, at least in the azimuthal distribution of matter in the disk. In contrast, the ASAS data show regular variations that indicate mass ejections into the disk. Such photometric changes without clear spectroscopic changes show us how face-on Be stars can blind us to azimuthal changes in density perturbations while we are more sensitive to observing these mass ejections.
The majority of Be stars seem to pulsate in non-radial low order sectoral (where ) g modes where gravity is the restoring force (Rivinius et al., 2003), similar to the class of Slowly Pulsating B (SPB) stars (De Cat, 2002). The photometric amplitude of such modes depends on the stellar inclination angle. At low inclinations, sectoral modes have low amplitudes due to geometric cancellation over the integrated stellar surface, to the point where they will not impart any photometric signal at . In CPD 29 2176, there are not any obvious coherent peaks that stand out in the frequency spectrum. This is not unusual for early-type Be stars (e.g. Nazé et al., 2020b; Labadie-Bartz et al., 2022). Multiple factors may contribute to the lack of obvious coherent oscillation, including the low inclination angle, lower intrinsic g mode amplitudes in the hottest Be stars, and the large number of closely spaced signals which may mask the presence of coherent modes without a sufficiently long time baseline.
While coherent oscillations are generally associated with stellar pulsation, Be stars in particular also often display incoherent oscillations consistent with pulsation (often, but not always, in addition to coherent modes). This is most evident during times where the Be star is actively ejecting mass (Semaan et al., 2018; Labadie-Bartz et al., 2022). While mass ejection events are commonly marked by a net increase in brightness (which are not seen in the TESS light curves for CPD 29 2176), this is not always the case. If the inner disk is dense and optically thick, small additions of material will not increase the net emergent flux. This situation may be realized in CPD 29 2176, since the spectra indicate a strong disk was present at all observed times including during TESS sectors 7, 8, and 34 (note that our spectroscopic coverage does not extend to sector 61).
Given the low inclination angle, it is unlikely that such signals could be attributed to any circumstellar activity such inhomogeneous ejecta transiting the stellar disk, although this cannot strictly be ruled out with photometry alone. One plausible explanation for these incoherent signals are Rossby waves (r modes), which are expected and observed in rapid rotators (Van Reeth et al., 2016; Saio et al., 2018). Rossby waves are necessarily retrograde and tend to form frequency groups just below the rotation frequency (for ) and just below twice the rotation frequency (for ), and so on with decreasing amplitude with higher . During mass ejection, the rotational flow on the stellar surface would be disrupted, potentially generating r modes (as conjectured in Saio et al., 2018). In this scenario, if mass ejection rates vary over time (which seems to be the case in all early-type Be stars), presumably any subsequently generated r modes would not be coherent over long periods of time (e.g., from sector to sector in TESS).
Cas (B0.5 IVe) was the first discovered Be star (Secchi, 1866) and is the prototype of a subgroup of classical Be stars showing X-ray emission (Nazé et al., 2020a). However, the X-rays of Cas stars are distinguished by being hard, thermal, and of intermediate strength between normal OB stars and Be XRBs (Lopes de Oliveira et al., 2006), and the X-ray mechanism is still unknown. The optical properties of Cas and CPD 29 2176 are similar, with the main differences being due to the binary separation and the inclination angle. In both systems the binary orbits are consistent with being circular, Cas having Porb = 203.5 d (Smith et al., 2012; Nemravová et al., 2012), and CPD 29 2176 having Porb = 59 d (Richardson et al., 2023). The disk of Cas has an inclination of based on interferometric measurements (Stee et al., 2012) while CPD 29 2176 has an inclination between 10∘ and 15∘ (Richardson et al., 2023). From the ASAS photometry (Fig. 4), the variation of CPD 29 2176 in , which is among the most extreme values for classical Be stars (Bernhard et al., 2018). The geometry of CPD 29 2176 is favorable for high amplitude flux variations since face-on disks have a maximum projected area, but even so the disk of CPD 29 2176 must have a high density at times of maximum brightness (Haubois et al., 2012). This, perhaps, can be aided by the binary companion whose tidal forces cause disk material to accumulate rather than flow outwards, as the band flux only probes the more inner regions of the disk (Vieira et al., 2015). The magnitude of the band flux variation in Cas is similar, but on much longer timescales (decades) compared to CPD 29 2176 most likely due to mass loss in Cas being relatively continuous while in CPD 29 2176 at least during the ASAS observations, mass ejection was episodic.
CPD 29 2176 also shows other similarities to Cas. The frequency groups derived from the TESS photometry (Fig. 3) are similar to those seen in Cas (Labadie-Bartz et al., 2021). In contrast though, Cas does seem to show one coherent frequency in its equivalent of the ‘g2’ group during the TESS epochs, but even so this frequency was not detected in earlier observations (Henry & Smith, 2012) which instead found a, at the time, coherent signal at 1.2158 d-1 which was not apparent in the TESS data. In Be stars with groups like this, the stellar rotation frequency should be approximately the difference between the two major frequency groups (Semaan et al., 2018), so the rotation frequency for CPD 29 2176 should be near 1.4–1.6 cycles d-1. This qualitatively makes sense if you imagine the frequencies in the ‘g1’ group are a combination of prograde modes and retrograde modes, which will then bracket the rotational frequency , although we are not certain what the TESS frequencies represent yet, but this could become clearer with future coordinated spectroscopic observations at the time of TESS photometric observations or other space photometry.
The orbital period of CPD 29 2176 and our observed H strength fits into the relationship between orbital period and the maximum observed H equivalent width as originally shown in Reig et al. (1997), and subsequently in Reig (2007), Reig (2011), Antoniou et al. (2009), Coe & Kirk (2015), and Reig et al. (2016b). We show the placement of CPD 29 2176 in the population of Be XRBs in Fig. 7. The relationship between the H equivalent width and orbital period has been modeled by theory developed by Okazaki et al. (2002). The primary reason for this trend is that tidal forces from the companion truncate the Be disk, inhibiting radial growth and resulting in a shallower radial density gradient. The smaller geometric disk area then results in a reduced H equivalent width. In eccentric binary orbits, the observed emission levels are often phase dependent, but in the circular case a steady state is realized. Some disk material accretes onto the companion, while some may be ejected from the system. Similar modeling and observational results have been shown for hot, stripped companions for classical Be stars (e.g., Dulaney et al., 2017; Klement et al., 2019).
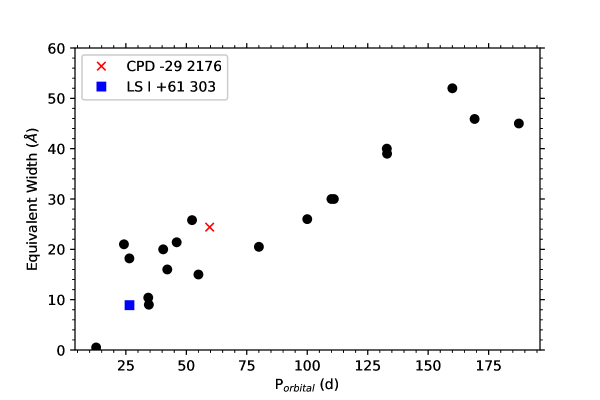
In Be stars with stable disks and a binary companion in a circular (prograde) orbit, spiral density waves are predicted (Panoglou et al., 2016, 2018). Although referred to as an wave in the disk, the leading arm of the pattern (nearer to the companion) is stronger, introducing an asymmetry (Cyr et al., 2020). The most conspicuous observable is a phase-locked pattern of variability in prominent emission lines, e.g. H (Zharikov et al., 2013; Chojnowski et al., 2018; Harmanec et al., 2020, e.g.). No such pattern is seen in the H line of CPD 29 2176 when phased to the orbital period. However, the existence of a tidally-induced wave cannot be ruled out since the main observational signatures become (perhaps negligibly) small at low inclinations and the number of spectra is small for detecting such a signature. Further, the stronger overall H emission at later epochs (Fig. 5) makes direct comparisons over the full time baseline difficult. We note that McSwain et al. (2010) described the H variability of LS I 61∘ 303 ( d, ; also highlighted in Fig. 7). Over 35 consecutive nights of spectroscopic data, McSwain et al. (2010) found a brief time prior to apastron that has a strong excess on the red side of the H profile when the neutron star moves almost directly away from the observer. McSwain et al. (2010) interpret this emission as evidence that an induced spiral density wave in the Be disk extends across the full binary separation at these phases and thus shows that these sorts of waves can exist in Be XRBs, although the face-on geometry of CPD 29 2176 may make this harder to observe directly.
All of these observables in CPD 29 2176 show a consistent picture of a nearly pole-on Be star with a compact object in a circular or low-eccentricity orbit. The pole-on nature is supported by the Be emission line morphologies, the apparent lack of coherent oscillations from TESS, and the orbital information presented by Richardson et al. (2023). The ground-based optical light curve shows regular disk activity during the times of the ASAS project, with outbursts occurring every 600-800 d without periodicity. In the X-ray regime, the light curve shown by Naze & Robrade (2023) shows possible X-ray outbursts at time scales of d. While these time-scales differ by about a factor of two, we also note that the two data sets were not contemporaneous so the disks in the system could have been very different at these two times. The system, while sharing many properties with the Be XRB LS I that was also speculated to have a magnetar companion, is distinct in that the circular orbit geometry brings about more stability than seen in more eccentric systems.
7 Conclusions
In this paper, we presented an analysis of both the spectroscopic properties and variability, along with the photometric variability of CPD 29 2176. Our findings can be summarized with the following points:
-
•
CPD 29 2176 has a spectrum that is consistent with a nearly pole-on B0Ve star. Such an inclination provides support for the evolutionary picture presented by Richardson et al. (2023), who found that the previous supernova required an “ultra-stripped” supernova and presents the system as a kilonova progenitor.
-
•
The high-precision TESS photometry shows three groups of frequencies. One is at low frequency (long time scales) and likely is related to slow, long-term variability of the Be disk. With the properties of TESS data, this refers to a time-scale of 10–20 d, although we don’t see the exact same properties with the ground-based ASAS data, but rather the ASAS strength is at longer time scales. The second frequency group near 1.5 cycles d-1 was seen in the TESS data and does not have a stable frequency over the four sectors of data collected thus far. This group likely represents stellar oscillations. The final frequency group is near 3 cycles d-1 and is probably related to the second group mentioned but with a higher azimuthal order. The inferred rotational frequency from these oscillation groups is about 1.5 cycles d-1, consistent with other Be stars.
-
•
The disk around CPD 29 2176 is fairly stable across our spectroscopic observations spanning about 2 years. There may be long-term photometric evolution of the system as seen with ground-based photometric surveys (Fig. 4), but these time scales are largely not yet covered with spectroscopy for confirmation. The variations in the ASAS photometry could be explained by disk outbursts causing the inner disk density to vary significantly as the amplitude is high so these were not minor events. The strength of the optical He I lines is relatively constant while the H profile shows some strengthening with time (Figs. 5 and 6).
-
•
The strength of the H profile fits the trend of comparing the equivalent width of H with the orbital period for Be XRBs (Fig. 7). This trend is supported by modeling of disk truncation by the compact companion for other Be XRBs.
CPD 29 2176 offers a prime laboratory to study Be XRBs with circular orbits. Such systems are seemingly rare, and we note that the system LS I which we compared CPD 29 2176 to has both high eccentricity (Antoniou et al., 2009) and was ejected from the cluster IC 1805 (Mirabel et al., 2004), meaning that while these systems both have shown evidence of magnetars as their compact companion, the evolutionary paths to form these systems are likely very different. Future studies of CPD 29 2176 will likely allow us to understand its evolution in detail and place constraints on the formation of binary neutron star systems.
The spectroscopy from CTIO was collected through the NOIRLab program nos. 2018B-0137 and 2020A-0054. This research has used data from the CTIO/SMARTS 1.5m telescope, which is operated as part of the SMARTS Consortium by RECONS (www.recons.org) members T. Henry, H. James, W.-C. Jao and L. Paredes. At the telescope, observations were carried out by R. Aviles and R. Hinojosa. This paper includes data collected by the TESS mission. Funding for the TESS mission is provided by the NASA’s Science Mission Directorate. We thank Pablo Reig for data in Fig. 7.
C.M.P. acknowledges support from the Embry-Riddle Aeronautical University’s Undergraduate Research Institute and the Arizona Space Grant. This research was partially supported through the Embry-Riddle Aeronautical University’s Faculty Innovative Research in Science and Technology (FIRST) Program and through NASA grant 80NSSC23K1049. The work of ANC is supported by NOIRLab, which is managed by the Association of Universities for Research in Astronomy (AURA) under a cooperative agreement with the National Science Foundation.
References
- Antoniou et al. (2009) Antoniou, V., Hatzidimitriou, D., Zezas, A., & Reig, P. 2009, ApJ, 707, 1080, doi: 10.1088/0004-637X/707/2/1080
- Archibald et al. (2016) Archibald, R. F., Scholz, P., & Kaspi, V. 2016, The Astronomer’s Telegram, 8868, 1
- Astropy Collaboration et al. (2013) Astropy Collaboration, Robitaille, T. P., Tollerud, E. J., et al. 2013, A&A, 558, A33, doi: 10.1051/0004-6361/201322068
- Astropy Collaboration et al. (2018) Astropy Collaboration, Price-Whelan, A. M., Sipőcz, B. M., et al. 2018, AJ, 156, 123, doi: 10.3847/1538-3881/aabc4f
- Baade et al. (2016) Baade, D., Rivinius, T., Pigulski, A., et al. 2016, A&A, 588, A56, doi: 10.1051/0004-6361/201528026
- Baade et al. (2018) Baade, D., Pigulski, A., Rivinius, T., et al. 2018, A&A, 610, A70, doi: 10.1051/0004-6361/201731187
- Barthelmy et al. (2016) Barthelmy, S. D., D’Elia, V., Gehrels, N., et al. 2016, The Astronomer’s Telegram, 8831, 1
- Bernhard et al. (2018) Bernhard, K., Otero, S., Hümmerich, S., et al. 2018, MNRAS, 479, 2909, doi: 10.1093/mnras/sty1320
- Buysschaert et al. (2017) Buysschaert, B., Neiner, C., Richardson, N. D., et al. 2017, A&A, 602, A91, doi: 10.1051/0004-6361/201630318
- Chojnowski et al. (2018) Chojnowski, S. D., Labadie-Bartz, J., Rivinius, T., et al. 2018, ApJ, 865, 76, doi: 10.3847/1538-4357/aad964
- Coe & Kirk (2015) Coe, M. J., & Kirk, J. 2015, MNRAS, 452, 969, doi: 10.1093/mnras/stv1283
- Cyr et al. (2020) Cyr, I. H., Jones, C. E., Carciofi, A. C., et al. 2020, MNRAS, 497, 3525, doi: 10.1093/mnras/staa2176
- De Cat (2002) De Cat, P. 2002, in Astronomical Society of the Pacific Conference Series, Vol. 259, IAU Colloq. 185: Radial and Nonradial Pulsationsn as Probes of Stellar Physics, ed. C. Aerts, T. R. Bedding, & J. Christensen-Dalsgaard, 196
- Donati et al. (1997) Donati, J. F., Semel, M., Carter, B. D., Rees, D. E., & Collier Cameron, A. 1997, MNRAS, 291, 658, doi: 10.1093/mnras/291.4.658
- Doroshenko et al. (2021) Doroshenko, V., Santangelo, A., Tsygankov, S. S., & Ji, L. 2021, A&A, 647, A165, doi: 10.1051/0004-6361/202039785
- Dulaney et al. (2017) Dulaney, N. A., Richardson, N. D., Gerhartz, C. J., et al. 2017, ApJ, 836, 112, doi: 10.3847/1538-4357/836/1/112
- Fernie et al. (1966) Fernie, J. D., Hiltner, W. A., & Kraft, R. P. 1966, AJ, 71, 999, doi: 10.1086/109996
- Hanuschik et al. (1996) Hanuschik, R. W., Hummel, W., Sutorius, E., Dietle, O., & Thimm, G. 1996, A&AS, 116, 309
- Harmanec et al. (2020) Harmanec, P., Lipták, J., Koubský, P., et al. 2020, A&A, 639, A32, doi: 10.1051/0004-6361/202037964
- Haubois et al. (2012) Haubois, X., Carciofi, A. C., Rivinius, T., Okazaki, A. T., & Bjorkman, J. E. 2012, ApJ, 756, 156, doi: 10.1088/0004-637X/756/2/156
- Henry & Smith (2012) Henry, G. W., & Smith, M. A. 2012, ApJ, 760, 10, doi: 10.1088/0004-637X/760/1/10
- Klement et al. (2019) Klement, R., Carciofi, A. C., Rivinius, T., et al. 2019, ApJ, 885, 147, doi: 10.3847/1538-4357/ab48e7
- Kochanek et al. (2017) Kochanek, C. S., Shappee, B. J., Stanek, K. Z., et al. 2017, PASP, 129, 104502, doi: 10.1088/1538-3873/aa80d9
- Labadie-Bartz et al. (2021) Labadie-Bartz, J., Baade, D., Carciofi, A. C., et al. 2021, MNRAS, 502, 242, doi: 10.1093/mnras/staa3913
- Labadie-Bartz et al. (2022) Labadie-Bartz, J., Carciofi, A. C., Henrique de Amorim, T., et al. 2022, AJ, 163, 226, doi: 10.3847/1538-3881/ac5abd
- Labadie-Bartz et al. (2017) Labadie-Bartz, J., Pepper, J., McSwain, M. V., et al. 2017, AJ, 153, 252, doi: 10.3847/1538-3881/aa6396
- Lenz & Breger (2005) Lenz, P., & Breger, M. 2005, Communications in Asteroseismology, 146, 53, doi: 10.1553/cia146s53
- Lopes de Oliveira et al. (2006) Lopes de Oliveira, R., Motch, C., Haberl, F., Negueruela, I., & Janot-Pacheco, E. 2006, A&A, 454, 265, doi: 10.1051/0004-6361:20054589
- Marr et al. (2021) Marr, K. C., Jones, C. E., Carciofi, A. C., et al. 2021, ApJ, 912, 76, doi: 10.3847/1538-4357/abed4c
- McSwain et al. (2010) McSwain, M. V., Grundstrom, E. D., Gies, D. R., & Ray, P. S. 2010, ApJ, 724, 379, doi: 10.1088/0004-637X/724/1/379
- Mirabel et al. (2004) Mirabel, I. F., Rodrigues, I., & Liu, Q. Z. 2004, A&A, 422, L29, doi: 10.1051/0004-6361:200400016
- Morgan & Keenan (1973) Morgan, W. W., & Keenan, P. C. 1973, ARA&A, 11, 29, doi: 10.1146/annurev.aa.11.090173.000333
- Nazé et al. (2020a) Nazé, Y., Motch, C., Rauw, G., et al. 2020a, MNRAS, 493, 2511, doi: 10.1093/mnras/staa457
- Nazé et al. (2020b) Nazé, Y., Rauw, G., & Pigulski, A. 2020b, MNRAS, 498, 3171, doi: 10.1093/mnras/staa2553
- Naze & Robrade (2023) Naze, Y., & Robrade, J. 2023, arXiv e-prints, arXiv:2307.13308, doi: 10.48550/arXiv.2307.13308
- Nemravová et al. (2012) Nemravová, J., Harmanec, P., Koubský, P., et al. 2012, A&A, 537, A59, doi: 10.1051/0004-6361/201117922
- Okazaki et al. (2002) Okazaki, A. T., Bate, M. R., Ogilvie, G. I., & Pringle, J. E. 2002, MNRAS, 337, 967, doi: 10.1046/j.1365-8711.2002.05960.x
- Panoglou et al. (2016) Panoglou, D., Carciofi, A. C., Vieira, R. G., et al. 2016, MNRAS, 461, 2616, doi: 10.1093/mnras/stw1508
- Panoglou et al. (2018) Panoglou, D., Faes, D. M., Carciofi, A. C., et al. 2018, MNRAS, 473, 3039, doi: 10.1093/mnras/stx2497
- Paul & Naik (2011) Paul, B., & Naik, S. 2011, Bulletin of the Astronomical Society of India, 39, 429. https://arxiv.org/abs/1110.4446
- Petit et al. (2014) Petit, P., Louge, T., Théado, S., et al. 2014, PASP, 126, 469, doi: 10.1086/676976
- Pojmanski (1997) Pojmanski, G. 1997, Acta Astron., 47, 467, doi: 10.48550/arXiv.astro-ph/9712146
- Pojmanski (2003) —. 2003, Acta Astron., 53, 341
- Reed & Fitzgerald (1983) Reed, B. C., & Fitzgerald, M. P. 1983, MNRAS, 205, 241, doi: 10.1093/mnras/205.2.241
- Reig (2007) Reig, P. 2007, MNRAS, 377, 867, doi: 10.1111/j.1365-2966.2007.11657.x
- Reig (2011) —. 2011, Ap&SS, 332, 1, doi: 10.1007/s10509-010-0575-8
- Reig & Fabregat (2015) Reig, P., & Fabregat, J. 2015, A&A, 574, A33, doi: 10.1051/0004-6361/201425008
- Reig et al. (1997) Reig, P., Fabregat, J., & Coe, M. J. 1997, A&A, 322, 193
- Reig et al. (2016a) Reig, P., Nersesian, A., Zezas, A., Gkouvelis, L., & Coe, M. J. 2016a, A&A, 590, A122, doi: 10.1051/0004-6361/201628271
- Reig et al. (2016b) —. 2016b, A&A, 590, A122, doi: 10.1051/0004-6361/201628271
- Reig et al. (2023) Reig, P., Tzouvanou, A., Blinov, D., & Pantoulas, V. 2023, A&A, 671, A48, doi: 10.1051/0004-6361/202245598
- Richardson et al. (2021) Richardson, N. D., Thizy, O., Bjorkman, J. E., et al. 2021, MNRAS, 508, 2002, doi: 10.1093/mnras/stab2759
- Richardson et al. (2023) Richardson, N. D., Pavao, C. M., Eldridge, J. J., et al. 2023, Nature, 614, 45, doi: 10.1038/s41586-022-05618-9
- Rivinius (2019) Rivinius, T. 2019, IAU Symposium, 346, 105, doi: 10.1017/S1743921318008207
- Rivinius et al. (1998) Rivinius, T., Baade, D., Stefl, S., et al. 1998, in Astronomical Society of the Pacific Conference Series, Vol. 135, A Half Century of Stellar Pulsation Interpretation, ed. P. A. Bradley & J. A. Guzik, 343
- Rivinius et al. (2003) Rivinius, T., Baade, D., & Štefl, S. 2003, A&A, 411, 229, doi: 10.1051/0004-6361:20031285
- Rivinius et al. (2013) Rivinius, T., Carciofi, A. C., & Martayan, C. 2013, A&A Rev., 21, 69, doi: 10.1007/s00159-013-0069-0
- Saio et al. (2018) Saio, H., Kurtz, D. W., Murphy, S. J., Antoci, V. L., & Lee, U. 2018, MNRAS, 474, 2774, doi: 10.1093/mnras/stx2962
- Secchi (1866) Secchi, A. 1866, Astronomische Nachrichten, 68, 63, doi: 10.1002/asna.18670680405
- Semaan et al. (2018) Semaan, T., Hubert, A. M., Zorec, J., et al. 2018, A&A, 613, A70, doi: 10.1051/0004-6361/201629243
- Shappee et al. (2014) Shappee, B. J., Prieto, J. L., Grupe, D., et al. 2014, ApJ, 788, 48, doi: 10.1088/0004-637X/788/1/48
- Smith et al. (2012) Smith, M. A., Lopes de Oliveira, R., Motch, C., et al. 2012, A&A, 540, A53, doi: 10.1051/0004-6361/201118342
- Stee et al. (2012) Stee, P., Delaa, O., Monnier, J. D., et al. 2012, A&A, 545, A59, doi: 10.1051/0004-6361/201219234
- Surnis et al. (2016) Surnis, M. P., Maan, Y., Joshi, B. C., & Manoharan, P. K. 2016, The Astronomer’s Telegram, 8943, 1
- Thompson & Duncan (1995) Thompson, C., & Duncan, R. C. 1995, MNRAS, 275, 255, doi: 10.1093/mnras/275.2.255
- Van Reeth et al. (2016) Van Reeth, T., Tkachenko, A., & Aerts, C. 2016, A&A, 593, A120, doi: 10.1051/0004-6361/201628616
- Vieira et al. (2015) Vieira, R. G., Carciofi, A. C., & Bjorkman, J. E. 2015, MNRAS, 454, 2107, doi: 10.1093/mnras/stv2074
- Vijapurkar & Drilling (1993) Vijapurkar, J., & Drilling, J. S. 1993, ApJS, 89, 293, doi: 10.1086/191849
- Wang et al. (2018) Wang, L., Gies, D. R., & Peters, G. J. 2018, ApJ, 853, 156, doi: 10.3847/1538-4357/aaa4b8
- Wang et al. (2021) Wang, L., Gies, D. R., Peters, G. J., et al. 2021, AJ, 161, 248, doi: 10.3847/1538-3881/abf144
- Zharikov et al. (2013) Zharikov, S. V., Miroshnichenko, A. S., Pollmann, E., et al. 2013, A&A, 560, A30, doi: 10.1051/0004-6361/201322114
| HJD-2,450,000 | Exposure | S/N(5850 Å) | Wλ H | Wλ H | Wλ He I (5876) | Wλ He I (6678) |
|---|---|---|---|---|---|---|
| 8392.8792 | 1x900 s | 35 | ||||
| 8393.8875 | 1x900 s | 23 | ||||
| 8410.7982 | 3x900 s | 53 | ||||
| 8440.8389 | 3x900 s | 78 | ||||
| 8452.8008 | 3x900 s | 67 | ||||
| 8466.7714 | 3x900 s | 89 | ||||
| 8482.7012 | 3x900 s | 67 | ||||
| 8494.6486 | 3x900 s | 46 | ||||
| 8509.6697 | 3x900 s | 32 | ||||
| 8543.5658 | 3x900 s | 44 | ||||
| 8551.6850 | 3x900 s | 40 | ||||
| 8558.6199 | 3x900 s | 61 | ||||
| 8564.5627 | 3x900 s | 52 | ||||
| 8582.5988 | 3x900 s | 58 | ||||
| 8597.5355 | 3x900 s | 32 | ||||
| 8624.5316 | 3x900 s | 50 | ||||
| 9197.7618 | 2x900 s | 66 | ||||
| 9208.7543 | 2x900 s | 35 | ||||
| 9209.7026 | 2x900 s | 46 | ||||
| 9219.7222 | 2x900 s | 64 | ||||
| 9224.6465 | 2x900 s | 74 | ||||
| 9228.7730 | 2x900 s | 81 | ||||
| 9234.6194 | 2x900 s | 32 | ||||
| 9240.6824 | 2x900 s | 42 |