Fast, multicolour optical sectioning over extended fields of view by combining interferometric SIM with machine learning
Edward N. Ward,1 Rebecca M. McClelland,1 Jacob R. Lamb,1 Roger Rubio-Sánchez,1,2 Charles N. Christensen,1 Bismoy Mazumder,1 Sofia Kapsiani,1 Luca Mascheroni,1 Lorenzo Di Michele,1,2 Gabriele S. Kaminski Schierle,1 and Clemens F. Kaminski1
1Department of Chemical Engineering and Biotechnology, University of Cambridge, Cambridge, CB3 0AS, UK
2fabriCELL, Molecular Sciences Research Hub, Imperial College London, London, W12 0BZ, UK
1 Abstract
Structured illumination can reject out-of-focus signal from a sample, enabling high-speed and high-contrast imaging over large areas with widefield detection optics. Currently, this optical-sectioning technique is limited by image reconstruction artefacts and the need for sequential imaging of multiple colour channels. We combine multicolour interferometric pattern generation with machine-learning processing, permitting high-contrast, real-time reconstruction of image data. The method is insensitive to background noise and unevenly phase-stepped illumination patterns. We validate the method in silico and demonstrate its application on diverse specimens, ranging from fixed and live biological cells to synthetic biosystems, imaging at up to 37 Hz across a 44 44 field of view.
2 Introduction
Widefield fluorescence microscopy permits the imaging of biological structures with a high specificity, however, out-of-focus light limits image contrast. Unless planar excitation profiles are used for illumination – such as in lightsheet [1] or HiLo [2] microscopy – fluorescent probes located above and below the focal plane contribute to the signal collected in the final image.
Scanning confocal microscopy circumvents this problem through the use of a pinhole to physically reject out-of-focus signal. While this is effective at increasing contrast, only a single point in the sample can be imaged at a time and images must be built up sequentially, pixel-by-pixel, greatly increasing acquisition time. Furthermore, high excitation powers are required to compensate for the signal lost through the pinhole.
A different approach to achieve optical sectioning (OS) is through structured illumination microscopy (SIM) [3]. Here, a fluorescent sample is illuminated by patterned excitation light and the emitted fluorescence is imaged with widefield detection. In super-resolution SIM, interference patterns are produced by the interaction of the patterned excitation with the structures of the sample and these interference patterns are used to extract high-resolution information about the sample [4, 5]. OS-SIM makes use of the fact that the modulation depth of the excitation pattern is highest in the in-focus plane and decreases rapidly with distance from it. Hence, the in- and out-of-focus structures can be distinguished by differences in stripe contrast. To achieve this, the sample is typically illuminated with a sinusoidal stripe pattern, and three sequential images are acquired as the pattern is shifted in phase over the sample. Under these conditions, only the in-focus structures will show a change in intensity between the phase shifted images and therefore these can be extracted and the three raw images reconstructed into one optically sectioned image. This method was pioneered by Neil et al. [3] who used the squared difference (SD) between the three phases to reconstruct the image:
| (1) |
where is the reconstructed image and represents the n-th phase image of the sample under striped illumination with the phase shifted by /3. Phase stepping in this way ensures a uniform average illumination and prevents striping artefacts in the reconstructed image. While simple to implement, this method is highly sensitive to noise, which becomes amplified in the SD reconstruction. Additionally, even small movements of the sample or deviations from the ideal phase step size introduce reconstruction artefacts. While recent efforts have improved on this early method, reconstructions remain prone to artefacts which require substantial filtering and post-processing [6].
To address these issues, we propose a method for OS-SIM which combines interferometric pattern generation with machine learning (ML): ML-OS-SIM. We use two complimentary neural networks to reconstruct OS-SIM data: a fast network for real-time reconstructions and a heavier network for post-acquisition reconstructions. In combination with an interferometric SIM setup [7], we achieve OS-SIM reconstructions in multiple colour channels simultaneously. Using the fast-reconstruction network, we demonstrate on-the-fly processing of OS-SIM data during acquisition, allowing users to immediately and intuitively visualise reconstructions as they navigate the sample. The software to achieve this is packaged in a user-friendly GUI which, combined with the simplicity of the interferometric SIM design, makes the method easy to implement on existing microscope setups.
3 Methods
3.1 Hardware implementation
For optimal reconstructions of OS-SIM data, the spatial frequency of the striped illumination pattern must be half of the maximum spatial frequency observable by the microscope [3]. As the resolution limit changes with wavelength, the periodicity of the pattern must also be changed when switching between colours. In SIM setups based on spatial light modulators, digital micro-mirror devices or diffraction gratings, this means that only a single colour can be imaged at a time, slowing down image acquisition and, crucially, introducing a temporal offset between acquisitions of different colour channels. To overcome these issues, we use an interferometric method to generate the fringe patterns (Fig. S1) [7]. This method has the advantage that the periodicity of the structured illumination fringes depends on the wavelength of the excitation light, meaning the fringe spacing is optimised for all wavelengths simultaneously. The setup makes use of a Michelson interferometer and phase stepping is achieved by laterally sweeping the pattern across the sample with a galvanometric mirror element. In our setup, fluorescence signal from the sample is collected and split into three colours using an image splitting device, permitting the simultaneous imaging of multiple colour channels. A Python graphical user interface enables hardware control and display of reconstructed images in real time (Fig. S3). All source code is available in a GitHub repository [8].
3.2 Machine learning networks
Machine learning (ML) has become a powerful enabler for the pre-processing, post-processing and reconstruction of super-resolution SIM data [9]. Compared to classical methods, ML can increase reconstruction quality and does not require the estimation of system parameters. ML has also been applied to the reconstruction of OS-SIM data [10, 11], but the impact of sample motion and uneven phase steps on reconstruction quality has not been addressed. Here, we leverage recent advances in ML and optimise two distinct neural networks specifically for the reconstruction of interferometrically generated OS-SIM data. By using two networks, we are able to achieve real-time reconstructions at the point of acquisition, and high-fidelity reconstructions post-acquisition, yielding optimised results even for moving samples.
In the first instance, ML-OS-SIM reconstructions were performed using a lightweight convolutional neural network (CNN) based on the residual channel attention network (RCAN) architecture (Supplementary note 4B) [12]. This RCAN model has a low memory footprint and can perform reconstructions on low-end consumer graphics cards at rates compatible with live reconstructions during imaging.
For high-fidelity image reconstruction post-acquisition, we use video super-resolution (VSR) reconstruction, a video transformer network based on the shifted-window architecture (Supplementary note 4A) [13, 14]. While more computationally intensive, this network is specifically optimised to reconstruct data from moving structures, mimicking dynamic biological samples [15].
To mitigate the challenges posed by training on experimentally acquired OS-SIM data, we simulated large datasets and employed transfer learning to train the network. This approach offers several advantages: firstly, for supervised learning, the ground truth is known, ensuring that the networks do not learn to generate the artefacts produced by classical reconstruction algorithms. Secondly, large and diverse training datasets can be generated, enabling the models to learn the reconstruction process without overfitting to limited experimental datasets. Thirdly, it is possible to train the network to be robust to the specific challenges associated with reconstructing interferometric OS-SIM data (Supplementary note 4C). This is particularly important when the phase changes of the pattern differ from the ideal, evenly spaced phases required for other reconstruction methods to work.
4 Results and Discussion
4.1 Machine learning reconstructions suppress noise and out-of-focus light from volumetric data
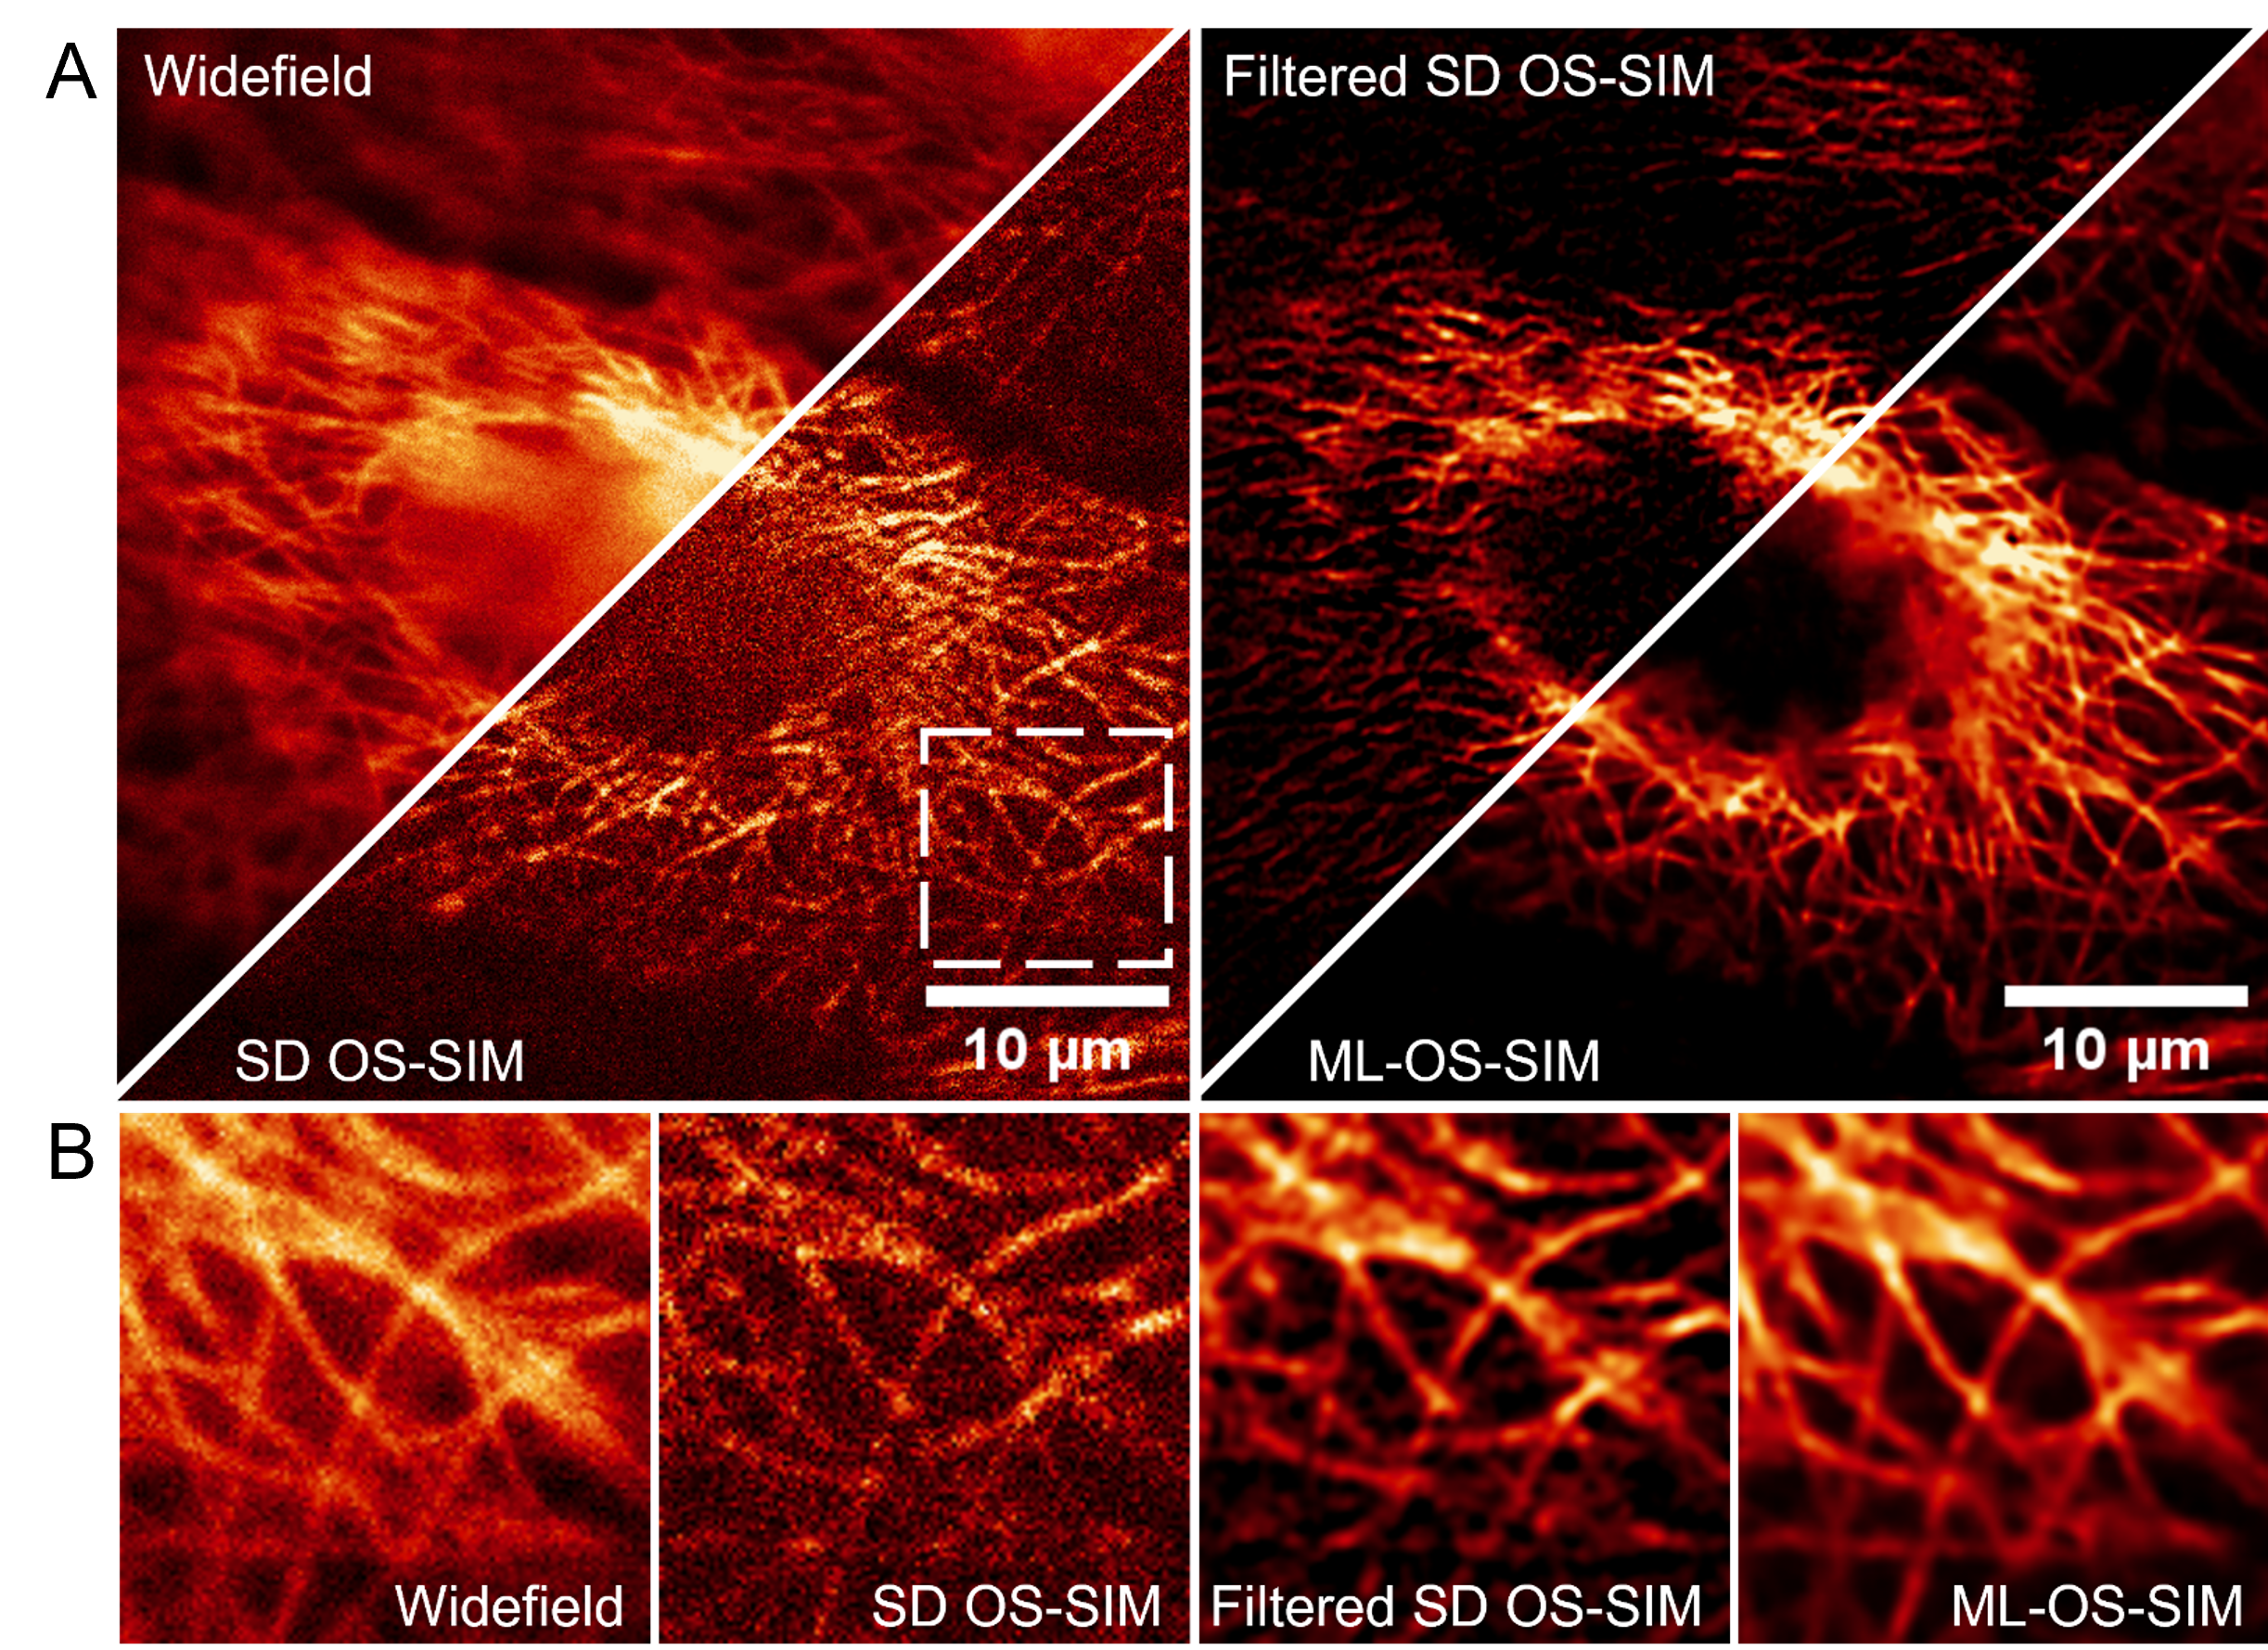
We first validated the ML reconstruction technique on volumetric data from fixed biological structures (Fig. 1). OS-SIM data from a fixed sample of Vero cells were reconstructed into optically sectioned images using ML and compared to the SD and filtered SD approaches [3, 6]. All OS-SIM methods exhibit a reduction in the out-of-focus signal, however, the ML approach performs much better in the presence of background noise. To quantify this improvement, the ML reconstructions were tested on simulated biological samples (Figs. S3 and S4). Successful reconstructions of OS-SIM data were possible at approximately one fifth of the signal level where SD approaches fail.
4.2 ML-OS-SIM can image faster than point scanning confocal microscopy with similar imaging performance
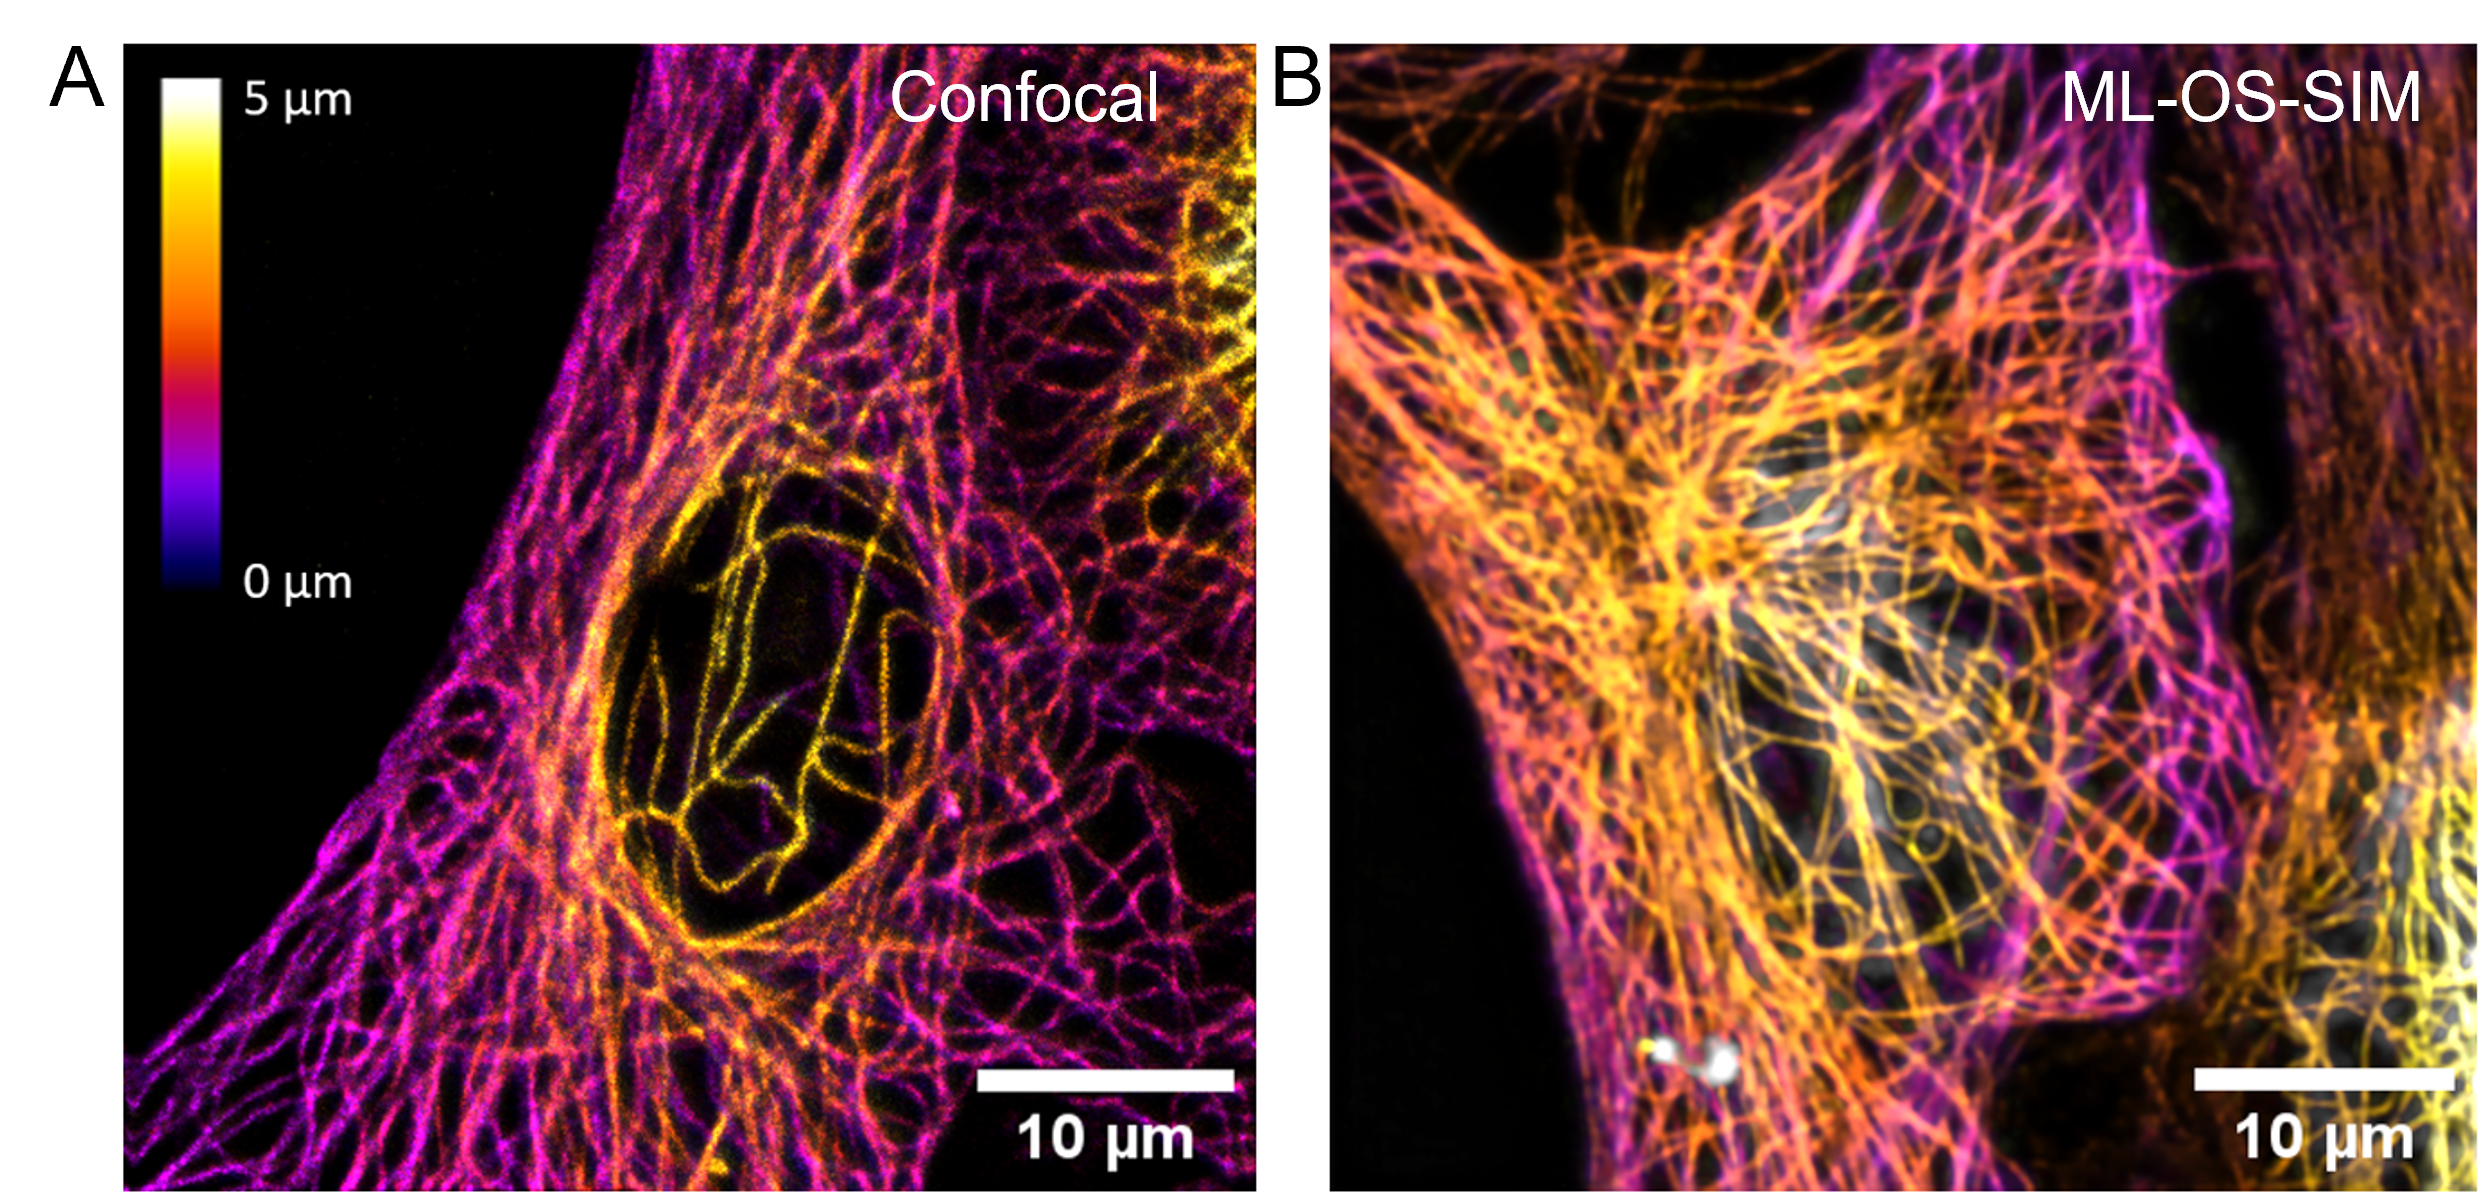
To demonstrate the speed improvement possible with interferometric ML-OS-SIM, the system was compared to point scanning confocal microscopy (Fig. 2). The camera exposure time was adjusted to produce reconstructions of a similar quality to confocal images of the same sample. In both images, background light is effectively removed and the 3D microtubule network of the cell can be resolved free from artefacts. However, ML-OS-SIM imaging was considerably faster: a 44 44 5 volume could be imaged in ¡ 2 s, whereas scanning confocal imaging took 2 min 36 s. That is, ML-OS-SIM was approximately 78 times faster. This speed advantage, in combination with the lower illumination laser power required, results in less photodamage and photobleaching to delicate samples (Supplementary note 1). An advantage of ML-OS-SIM is that a single detector can be used in conjunction with detection-splitting optics, whereas a confocal system would require an additional detector for each channel.
4.3 ML-OS-SIM enables the volumetric imaging of structures in multiple colours
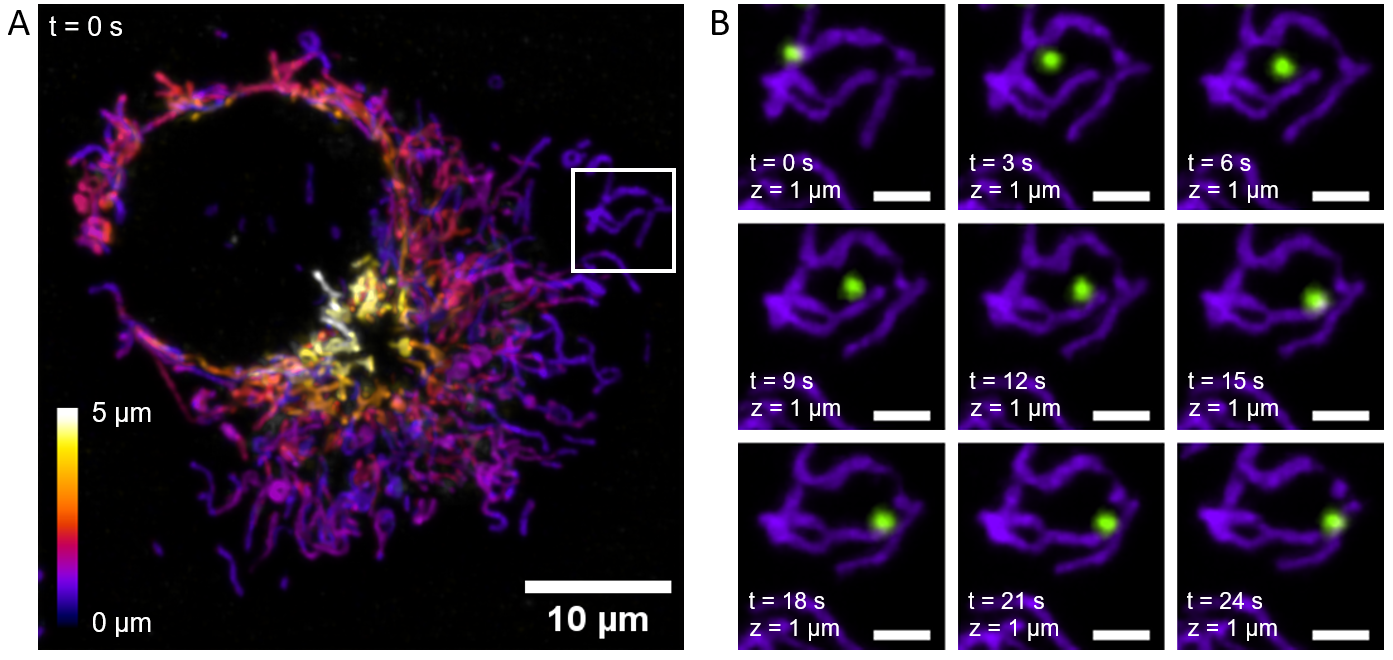
To demonstrate the capabilities of the technique for biological imaging, live cells were imaged in multiple colours across a 5 axial range (Fig. 3). Figure 3A depicts a maximum intensity projection of the mitochondrial network of a live cell imaged at a snapshot in time where the colourmap indicates the depth within the cell. No movement or striping artefacts are discernible in the image. Furthermore, the multicolour capability of the system allows several structures to be visualised without a temporal delay between colour channels. Figure 3B shows a two-channel time series of projections from the volumetric data. Here, a lysosome (green) can be seen to push a mitochondrial structure (purple) out of the way as it is transported through the cell.
4.4 Multicolour 3D imaging of DNA-nanotechnology biomimetic behaviours with ML-OS-SIM
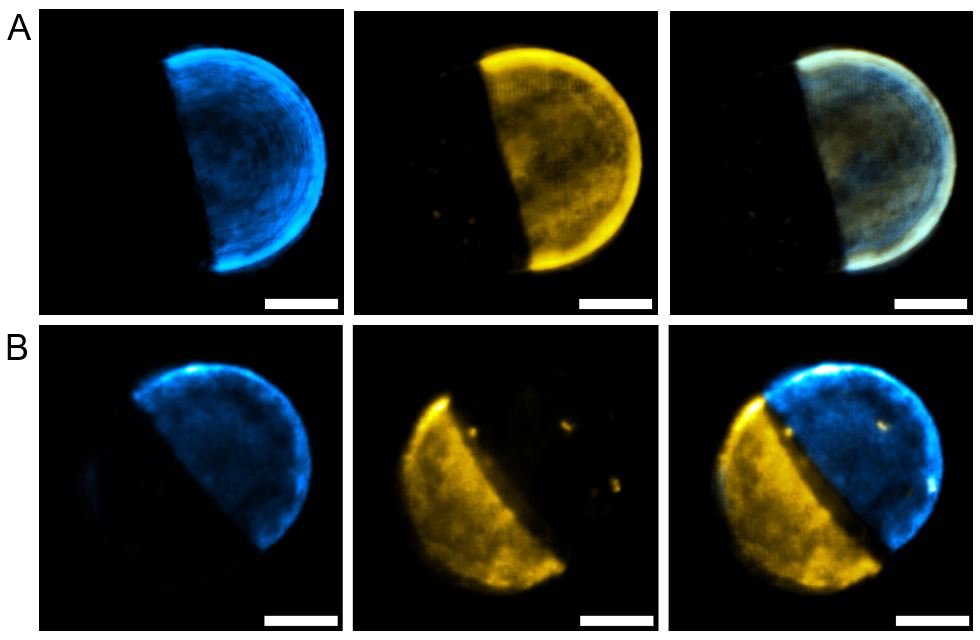
In addition to biological samples, the contrast enhancement afforded by our ML-OS-SIM strategy enables the visualisation of processes in synthetic cell science. Recently, the synergy between lipid-membrane phase behaviour and the tools of DNA nanotechnology has gained traction to engineer bio-inspired responses in cell-like objects [17, 18]. Figure 4 shows ML-OS-SIM images of DNA nanostructures tethered to phase-separated lipid membranes. The fast ML-OS-SIM technique allows for the reconstruction of multicolour 3D views of DNA-functionalised giant vesicles that can sustain biomimetic cargo transport pathways across their membrane surface (Fig. 4) [16]. Chemical stimulus, in the form of DNA oligonucleotides, triggers the lateral re-organisation of DNA nanostructures, leading to the transport of fluorescently labelled DNA cargoes (blue), away from the liquid-disordered phase (yellow) to liquid-ordered lipid domains (Supplementary note 9). The responsive DNA nanostructures harness established strand displacement mechanisms [19, 20] and the preferential tendency of different hydrophobic anchors in membrane-bound DNA to enrich distinct lipid domains [16]. The speed of ML-OS-SIM enables 3D imaging of the structures, allowing for better visualisation and understanding of the re-organisation process [16].
5 Conclusion
To date, OS-SIM has been limited by the unavailability of robust reconstruction algorithms and the inability to image live samples in multiple colours. Here, we demonstrate that these limitations can be overcome by combining ML reconstruction methods with interferometric SIM. We demonstrate fast, multicolour ML-OS-SIM at speeds of up to 37 Hz, across a 44 44 field of view, with the option to view real-time reconstruction of OS-SIM data. The widefield detection method employed in ML-OS-SIM means that sectioning ability comparable to confocal microscopy can be achieved but at imaging speeds two orders of magnitude faster, with reduced photodamage to the sample. Additionally, we demonstrate that when combined with interferometric pattern generation, this can achieve multi-label imaging with no temporal lag, allowing for the interactions between structures to be visualised in 3D. These capabilities are typically only afforded by lightsheet imaging modalities but at the cost of greatly increased system complexity and non-conventional imaging geometries. OS-SIM with ML reconstruction offers a simpler alternative to lightsheet microscopy and is ideally suited to the imaging of dynamic samples in multiple colours.
6 Acknowledgments
The authors would like to thank Lisa Hecker for her help constructing the interferometric setup. C.F.K. acknowledges funding from the UK Engineering and Physical Sciences Research Council (EP/L015889/1 and EP/H018301/1), the Wellcome Trust (3-3249/Z/16/Z and 089703/Z/09/Z), the UK Medical Research Council (MR/K015850/1 and MR/K02292X/1), and Infinitus Ltd. R.R.S. acknowledges funding from the Biotechnology and Biological Sciences Research Council through a BBSRC Discovery Fellowship (BB/X010228/1). R.R.S. and L.D.M. acknowledge funding from the European Research Council (ERC) under the Horizon 2020 Research and Innovation Programme (ERC-STG No 851667 NANOCELL). L.D.M. acknowledges funding from a Royal Society University Research Fellowship (UF160152, URFR221009). G.S.K.S. acknowledges funding from the Wellcome Trust (065807/Z/01/Z) (203249/Z/16/Z), the UK Medical Research Council (MRC) (MR/K02292X/1), Alzheimer Research UK (ARUK) (ARUK-PG013-14), Michael J Fox Foundation (16238 and 022159), and Infinitus China Ltd. S.K. acknowledges funding from the UK Engineering and Physical Sciences Research Council (EPSRC) grant EP/S023046/1 for the Centre for Doctoral Training in Sensor Technologies for a Healthy and Sustainable Future. R.M.M. and J.R.L. acknowledge funding from the UK Engineering and Physical Sciences Research Council (EP/S022139/1).
7 Code Availability
Code available from https://github.com/edward-n-ward/ML-OS-SIM.
References
- [1] J. Huisken, J. Swoger, D. Bene, J. Wittbrodt, and E. H. K. Stelzer, “Optical Sectioning Deep Inside Live Embryos by Selective Plane Illumination Microscopy,” Science, vol. 305, no. 5686, pp. 1007–1009, 2004. [Online]. Available: www.sciencemag.org/cgi/content/full/305/5686/1007/
- [2] M. Tokunaga, N. Imamoto, and K. Sakata-Sogawa, “Highly inclined thin illumination enables clear single-molecule imaging in cells,” Nature Methods, vol. 5, no. 2, pp. 159–161, 2 2008. [Online]. Available: doi.org/10.1038/nmeth1171
- [3] M. A. A. Neil, R. Juškaitis, and T. Wilson, “Method of obtaining optical sectioning by using structured light in a conventional microscope,” Optics Letters, vol. 22, no. 24, pp. 1905–1907, 1997. [Online]. Available: https://doi.org/10.1364/ol.22.001905
- [4] R. Heintzmann and C. G. Cremer, “Laterally modulated excitation microscopy: improvement of resolution by using a diffraction grating,” in Optical Biopsies and Microscopic Techniques III, vol. 3568. SPIE, 1 1999, pp. 185–196.
- [5] M. G. L. Gustafsson, “Surpassing the lateral resolution limit by a factor of two using structured illumination microscopy,” Journal of Microscopy, vol. 198, pp. 82–87, 2000. [Online]. Available: https://doi.org/10.1046/j.1365-2818.2000.00710.x
- [6] Z. Li, Q. Zhang, S.-W. Chou, Z. Newman, R. Turcotte, R. Natan, Q. Dai, E. Y. Isacoff, and N. Ji, “Fast widefield imaging of neuronal structure and function with optical sectioning in vivo,” Sci. Adv, vol. 6, 2020. [Online]. Available: https://www.science.org
- [7] E. N. Ward, L. Hecker, C. N. Christensen, J. R. Lamb, M. Lu, L. Mascheroni, C. W. Chung, A. Wang, C. J. Rowlands, G. S. Schierle, and C. F. Kaminski, “Machine learning assisted interferometric structured illumination microscopy for dynamic biological imaging,” Nature Communications, vol. 13, no. 1, 12 2022. [Online]. Available: https://doi.org/10.1038/s41467-022-35307-0
- [8] E. Ward, “https://github.com/edward-n-ward/ML-OS-SIM,” 2023. [Online]. Available: https://github.com/edward-n-ward/ML-OS-SIM
- [9] X. Chen, S. Zhong, Y. Hou, R. Cao, W. Wang, D. Li, Q. Dai, D. Kim, and P. Xi, “Superresolution structured illumination microscopy reconstruction algorithms: a review,” Light: Science & Applications, vol. 12, no. 1, p. 172, 7 2023. [Online]. Available: doi.org/10.1038/s41377-023-01204-4
- [10] X. Zhang, Y. Chen, K. Ning, C. Zhou, Y. Han, H. Gong, and J. Yuan, “Deep learning optical-sectioning method,” Optics Express, vol. 26, no. 23, p. 30762, 11 2018. [Online]. Available: doi.org/10.1364/OE.26.030762
- [11] C. Chai, C. Chen, X. Liu, and Z. Lei, “Deep learning based one-shot optically-sectioned structured illumination microscopy for surface measurement,” Optics Express, vol. 29, no. 3, p. 4010, 2 2021. [Online]. Available: doi.org/10.1364/oe.415210
- [12] Y. Zhang, K. Li, K. Li, L. Wang, B. Zhong, and Y. Fu, “Image Super-Resolution Using Very Deep Residual Channel Attention Networks,” ArXiv, 7 2018. [Online]. Available: https://doi.org/10.48550/arXiv.1807.02758
- [13] J. Liang, J. Cao, G. Sun, K. Zhang, L. Van Gool, and R. Timofte, “SwinIR: Image Restoration Using Swin Transformer,” ArXiv, 8 2021. [Online]. Available: https://doi.org/10.48550/arXiv.2108.10257
- [14] A. Dosovitskiy, L. Beyer, A. Kolesnikov, D. Weissenborn, X. Zhai, T. Unterthiner, M. Dehghani, M. Minderer, G. Heigold, S. Gelly, J. Uszkoreit, and N. Houlsby, “An Image is Worth 16x16 Words: Transformers for Image Recognition at Scale,” ArXiv, 10 2020. [Online]. Available: https://doi.org/10.48550/arXiv.2010.11929
- [15] C. N. Christensen, M. Lu, E. N. Ward, P. Lio, and C. F. Kaminski, “Spatio-temporal Vision Transformer for Super-resolution Microscopy,” ArXiv, 2 2022. [Online]. Available: http://arxiv.org/abs/2203.00030
- [16] R. Rubio-Sánchez, S. E. Barker, M. Walczak, P. Cicuta, and L. D. Michele, “A Modular, Dynamic, DNA-Based Platform for Regulating Cargo Distribution and Transport between Lipid Domains,” Nano Letters, vol. 21, no. 7, pp. 2800–2808, 4 2021. [Online]. Available: https://doi.org/10.1021/acs.nanolett.0c04867
- [17] M. Langecker, V. Arnaut, J. List, and F. C. Simmel, “DNA Nanostructures Interacting with Lipid Bilayer Membranes,” Accounts of Chemical Research, vol. 47, no. 6, pp. 1807–1815, 6 2014. [Online]. Available: doi.org/10.1021/ar500051r
- [18] R. Rubio-Sánchez, G. Fabrini, P. Cicuta, and L. Di Michele, “Amphiphilic DNA nanostructures for bottom-up synthetic biology,” Chemical Communications, vol. 57, no. 95, pp. 12 725–12 740, 2021. [Online]. Available: doi.org/10.1039/d1cc04311k
- [19] D. Y. Zhang and E. Winfree, “Control of DNA Strand Displacement Kinetics Using Toehold Exchange,” Journal of the American Chemical Society, vol. 131, no. 47, pp. 17 303–17 314, 12 2009.
- [20] D. Y. Zhang and G. Seelig, “Dynamic DNA nanotechnology using strand-displacement reactions,” Nature Chemistry, vol. 3, no. 2, pp. 103–113, 2 2011.