The Gas Accretion Rate of Galaxies over
Abstract
We present here estimates of the average rates of accretion of neutral gas onto main-sequence galaxies and the conversion of atomic gas to molecular gas in these galaxies at two key epochs in galaxy evolution: (i) , towards the end of the epoch of peak star-formation activity in the Universe, and (ii) , when the star-formation activity declines by an order of magnitude. We determine the net gas accretion rate and the molecular gas formation rate by combining the relations between the stellar mass and the atomic gas mass, the molecular gas mass, and the star-formation rate (SFR) at three epochs, , , and , with the assumption that galaxies evolve continuously on the star-forming main-sequence. We find that, for all galaxies, is far lower than the average SFR at ; however, is similar to during this interval. Conversely, both and are significantly lower than over the later interval, . We find that massive main-sequence galaxies had already acquired most of their present-day baryonic mass by . At , the rapid conversion of the existing atomic gas to molecular gas was sufficient to maintain a high average SFR, despite the low net gas accretion rate. However, at later times, the combination of the lower net gas accretion rate and the lower molecular gas formation rate leads to a decline in the fuel available for star-formation, and results in the observed decrease in the SFR density of the Universe over the last 8 Gyr.
1 Introduction
The evolution of galaxies is driven by the baryon cycle in which the baryonic constituents of galaxies and their circumgalactic mediums (CGMs) interact with each other and convert from one form to another (e.g. Péroux & Howk, 2020). The key processes in the baryon cycle are (i) the accretion of mostly ionized gas from the CGM onto the “disks” of galaxies, forming neutral atomic hydrogen (Hi) in the disks, (ii) the cooling of Hi and its conversion to molecular hydrogen (), (iii) the gravitational collapse and fragmentation of molecular clouds to form stars, and (iv) the expulsion of gas from the interstellar mediums (ISMs) of galaxies in outflows driven by stars or active galactic nuclei (AGNs), with some fraction of this gas later returning to the galaxy disk.
Measurements of the rates at which the above processes occur in galaxies, how the rates compare to each other, and how they evolve with redshift are critical to understanding galaxy evolution. Unfortunately, only the redshift evolution of the stellar properties of galaxies and their star-formation rates (SFR) are well determined today. For example, we have known for over two decades that the SFR density of the Universe peaks in the redshift range and then declines by an order of magnitude from to (e.g. Madau & Dickinson, 2014). Further, of the star-formation activity of the Universe out to occurs on the “star-forming main sequence” (e.g. Rodighiero et al., 2011) — a tight relationship between the SFR and the stellar mass () of galaxies (e.g. Noeske et al., 2007; Whitaker et al., 2014). At a fixed stellar mass, the SFR of galaxies on the main sequence declines by a factor of from to the present time (e.g. Whitaker et al., 2014; Popesso et al., 2022).
Unlike the SFR of a galaxy, it is very challenging to observationally determine the gas accretion rate and the rate at which Hi is converted to . While there have been suggestions in the literature that a low gas accretion rate at late times might account for various observational results (e.g. Bouché et al., 2010; Møller et al., 2013; Walter et al., 2020; Chowdhury et al., 2020), the lack of actual measurements of the accretion rate has been a key limitation in our understanding of the processes that drive the redshift evolution of the star-formation activity of the Universe. For example, Walter et al. (2020) used the redshift evolution of the cosmological SFR density, the cosmological Hi mass density, and the cosmological mass density to estimate the rate of global flow of gas, and global conversion of Hi to . However, such global rates, averaged over cosmological volumes, are difficult to interpret and do not provide any information on the differences between different galaxy populations, such as the dependence of the accretion rate on galaxy stellar mass, environment, morphology, etc. Conversely, Bouché et al. (2010) used a toy “reservoir” model, in which gas accretion is quenched above a halo mass of , to argue that the decline in SFR density from may be driven by the decline in the gas accretion rate. This model was found to yield the observed main-sequence and Tully-Fisher scaling relations at different redshifts (see also Møller et al., 2013, for the mass-metallicity relation). However, its predicted gas fractions (% at ) are lower than the values recently measured (% at ) by Chowdhury et al. (2022a).
The net gas accretion rate (i.e. the difference between the gas inflow and outflow rates) and the formation rate can be determined if one knows the dependences of the Hi and masses of galaxies on their stellar masses (i.e. the and scaling relations; Scoville et al., 2017; Bera et al., 2023a), along with the standard assumption that star-forming galaxies evolve along the main sequence (e.g. Renzini, 2009; Peng et al., 2010; Leitner, 2012; Speagle et al., 2014; Scoville et al., 2017). For the molecular component, various observational tracers (primarily CO rotational lines and dust continuum emission) have been used to determine the relation of galaxies out to (e.g. Tacconi et al., 2020). However, the weakness of the Hi 21 cm line, the only tracer of the Hi mass of galaxies, has meant that, until very recently, estimates of the relation were limited to the local Universe (e.g. Catinella et al., 2018; Parkash et al., 2018).
The Hi 21 cm stacking approach, based on combining the Hi 21 cm emission signals from a large number of galaxies with accurately known positions and redshifts, allows one to overcome the intrinsic weakness of the Hi 21 cm line and measure the average Hi properties of galaxy populations at cosmological distances (Zwaan, 2000; Chengalur et al., 2001). This approach has been recently used to measure the Hi properties of star-forming galaxies out to (e.g. Bera et al., 2019, 2022, 2023b; Chowdhury et al., 2020, 2021, 2022b). Recently, Chowdhury et al. (2022c) applied the Hi 21 cm stacking approach to data from the Giant Metrewave Radio Telescope (GMRT) Cold-Hi AT (CAT) survey, a 510-hr Hi 21 cm emission survey of galaxies at (Chowdhury et al., 2022b), to obtain the first measurement of the scaling relation at .
In this Letter, we combine measurements of the scaling relation at from the GMRT-CAT survey with estimates of the star-forming main-sequence relation and the scaling relation from the literature, and the assumption of the continuity of galaxy evolution along the main sequence, to determine the average formation rate and the average net gas accretion rate in star-forming galaxies over the redshift intervals and .
Throughout this work, we assume a Chabrier initial mass function (IMF) for estimates of the stellar masses and SFRs. Further, we use a flat Lambda-cold dark matter cosmology, with , , and km s-1 Mpc-1.
2 Determination of the Gas Accretion Rate and the Formation Rate
2.1 Formalism
The formalism used in this work to determine the net gas accretion rate and the formation rate of star-forming galaxies was introduced by Scoville et al. (2017), and recently refined by Bera et al. (2023a) to include the relation. In this approach, the build-up of the stellar mass of a galaxy, with an initial stellar mass () at the initial epoch (), is tracked to determine the final stellar mass () at the final epoch (). This is done by assuming that the galaxy remains on the star-forming main-sequence over the entire period, such that
| (1) |
where is the main-sequence relation at the time , and is the fraction of the stellar mass returned to the ISM via stellar winds or supernovae ( for a Chabrier IMF; Leitner & Kravtsov, 2011; Madau & Dickinson, 2014). We define here the average star-formation rate between the epochs and , such that
| (2) |
where is the time interval between the two epochs of interest. Measurements of the star-forming main-sequence (e.g. Whitaker et al., 2014; Popesso et al., 2022) can then be used to track the evolution of the stellar mass of a main-sequence galaxy using Equation 1, and this can be combined with Equation 2 to determine using the following relation.
| (3) |
Next, the final molecular gas reservoir111Throughout this Letter, and are used to refer to gas masses that include the mass contribution of Helium, , of the galaxy at time is related to the initial molecular gas reservoir, , at time via
| (4) |
where is the average molecular gas formation rate between the two epochs of interest, i.e. the difference between the rate at which Hi is converted to and that at which is dissociated to Hi. Given that the initial and final stellar masses are known, one can use measurements of the molecular gas mass as a function of stellar mass at both epochs to determine and which can then be combined with Equation 4 to obtain using the following relation.
| (5) |
Finally, the neutral atomic gas mass, , of the galaxy at time is related to the initial neutral atomic gas mass, , at time via the relation
| (6) |
where is the net accretion rate of neutral atomic gas onto the disk of the galaxy, i.e. the difference between the neutral atomic gas inflow and outflow rates. Again, measurements of as a function of stellar mass at the two epochs can be used to determine and , which can be combined with Equation 6 to obtain using the following relation:
| (7) |
We note that in the above formalism, the stellar mass returned to the ISM is assumed to be mostly in the ionised state and is hence not explicitly included in Equations 4-7. It is entirely possible that some fraction of this gas cools to form Hi or over the time interval between and . However, we emphasize that even assuming that all of the stellar mass that is returned to the ISM cools to form Hi would not significantly alter the key conclusions of this work.
We use the above formalism to estimate , , and over two redshift intervals: (a) to , covering the end of the epoch of peak cosmic star-formation activity, and (b) to , covering the decline of star-formation activity over the last Gyr (e.g. Madau & Dickinson, 2014). The choice of these redshift intervals is driven by our recent measurements of the average Hi content of stellar mass-matched samples of star-forming galaxies at and (Chowdhury et al., 2022d), and the measurement of the scaling relation over the redshift range (Chowdhury et al., 2022c). In the following subsections, we briefly describe the relations that were used to estimate SFR, , and for star-forming galaxies at , , and , specifically (i) the star-forming main-sequence relation (e.g. Whitaker et al., 2014; Popesso et al., 2022), (ii) the relation (Tacconi et al., 2020), and (iii) the relation (Catinella et al., 2018; Chowdhury et al., 2022c).
2.2 The Star-Forming Main-Sequence
We use the star-forming main-sequence relation of Popesso et al. (2022) to estimate the build-up of the stellar mass of galaxies via Equation 1. These authors converted a large number of literature measurements of the main sequence at to a common calibration, to find that the data are consistent with a relation that is linear at low stellar masses and flattens above a characteristic stellar mass (see also Whitaker et al., 2014). We will use the following main-sequence relation, obtained via a second-order polynomial fit to the dependence of on (Popesso et al., 2022):
| (8) |
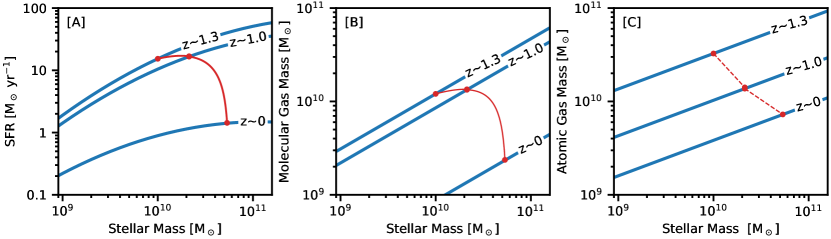
where is the age of the Universe at the epoch of interest and the fit parameters are , , , , and (Popesso et al., 2022). The main-sequence relations at , , and , obtained using Equation 8, are shown as the solid blue curves in Figure 1[A].
In passing, we emphasize that the main conclusions of this work are unchanged on using the second main-sequence relation of Popesso et al. (2022), which asymptotically approaches a maximum SFR value with increasing stellar mass, or the main-sequence relation of Whitaker et al. (2014), which is commonly used in the literature.
2.3 The Relation
For the relation, we follow Tacconi et al. (2020), who compiled literature estimates of the molecular gas mass of 2052 galaxies with at . The molecular gas masses were estimated using different tracers such as the CO rotational lines (e.g. Daddi et al., 2010; Tacconi et al., 2013; Saintonge et al., 2017), the far-infrared dust continuum (e.g. Santini et al., 2014), and the 1 mm dust continuum (e.g. Scoville et al., 2016). Tacconi et al. (2020) corrected the measurements obtained from the different tracers for any zero-point offsets, to put them on the same scale, and obtained the following relation for the dependence of the molecular gas mass of main-sequence galaxies on redshift and stellar mass:222We note that the relation in Tacconi et al. (2020) also includes a term giving the dependence on the offset from the main-sequence relation. We have dropped this term as our study is restricted to galaxies lying on the main sequence.
2.4 The Relation
We determine the relation at and from the measurements of the average Hi mass of main-sequence galaxies at these redshifts in the GMRT-CAT1 survey (Chowdhury et al., 2022b). This survey covered the Hi 21 cm line of 11,419 main-sequence galaxies at with stellar masses . Chowdhury et al. (2022c) divided the sample of 11,419 galaxies into three stellar-mass subsamples, and measured the average Hi mass of the galaxies in each subsample, and fitted a linear relation to the and estimates to determine the relation at . They found that the slope of the relation at is consistent with that at . However, the intercept of the relation at is higher than that of the local relation by a factor of .
Chowdhury et al. (2022c) also determined the relation for blue (NUVr) galaxies at from measurements of galaxies covered in the extended GALEX Arecibo Sloan Digital Sky Survey (xGASS; Catinella et al., 2018): xGASS is an Arecibo telescope Hi 21 cm survey of a sample of stellar mass-selected galaxies at , with stellar masses in the range . They obtained the relation , where . Since the slope of the relation for the GMRT-CAT1 galaxies at is the same as that of the relation at , we will assume that the slope of the relation is constant, and equal to (i.e. the xGASS slope), over the entire redshift range .
Next, Chowdhury et al. (2022d) subdivided the DEEP2 galaxies into two redshift bins, at and , to measure the average Hi mass of main-sequence galaxies at average redshifts of and . They obtained average Hi masses of at and at , both for average stellar masses of . We determine the intercepts of the relations at and by requiring that the relations are consistent with the above measurements for galaxies with at each redshift. This yields the scaling relations
| (10) |
and
| (11) |
We note that the above relations yield, at each redshift, the mean value for a distribution of galaxies at a given . However, the main-sequence relation of Equation 8 and the relation of Equation 9 yield, respectively, the median SFR and the median at a given stellar mass. For a log-normal distribution of Hi masses, which is typically the case (e.g Saintonge & Catinella, 2022), the mean Hi mass is different from the median Hi mass. For consistency with the main-sequence and the relations, we hence correct our mean relations to obtain the median relations (e.g. Bera et al., 2022; Chowdhury et al., 2022c). Assuming that the Hi masses of galaxies at and follow log-normal distributions with a scatter identical to the 0.4 dex scatter measured for the relation at (Catinella et al., 2018), the median relations lie 0.184 dex lower than the corresponding mean relations. The median scaling relations are then:
| (12) |
and
| (13) |
Finally, we also correct the above median relations for the mass contribution of helium, assuming , to obtain
| (14) |
where the values of the coefficient are at , at , and at . The solid blue lines in Figure 1[C] show the median relation at , , and .
In passing, we note that, over the last two decades, different Hi 21 cm surveys have measured the scaling relation for various galaxy populations at , each with different galaxy selection criteria (e.g. Barnes et al., 2001; Giovanelli et al., 2005; Huang et al., 2012; Bothwell et al., 2013; Dénes et al., 2014; Catinella et al., 2018; Parkash et al., 2018). The scaling relations obtained from “blind” Hi 21 cm surveys (e.g. Barnes et al., 2001; Giovanelli et al., 2005) are biased towards Hi-rich galaxies, yielding relations that lie above those obtained from Hi 21 cm surveys of optically-selected galaxies (e.g. Huang et al., 2012; Catinella et al., 2018). The relation at from the GMRT-CAT survey, as well as the main-sequence relation and the relation used in this work, are all obtained from optically-selected galaxy samples. We hence chose to use the scaling relation obtained from the blue galaxies in the optically-selected xGASS sample (Catinella et al., 2018) as the reference relation at .
3 Results
We use the formalism of Section 2.1 with the main-sequence relation (Equation 8), the relation (Equation 9), and the relation (Equation 14), to estimate , , and as a function of stellar mass over the redshift intervals and . We emphasize that this implicitly assumes that star-forming galaxies evolve along the main sequence (e.g. Renzini, 2009; Peng et al., 2010; Speagle et al., 2014; Scoville et al., 2017).
3.1 The Evolution of a Milky-Way-like Galaxy from to
We illustrate the formalism of Section 2.1 for the case of a massive galaxy with at . We use Equation 1 and the main-sequence relation of Equation 8 to evolve the galaxy; the evolutionary track of the galaxy in the SFR plane is shown in the red curve in Figure 1[A]. We find that the stellar mass of the galaxy increases to at . Using Equation 3, we find that the time-averaged SFR of the galaxy between and is yr-1. We use the relation of Equation 9 to find that the molecular gas mass of the galaxy increases from at to at . Using Equation 5, this yields a time-averaged molecular gas formation rate of , very similar to the average SFR, , over the same interval. Finally, we use the relation of Equation 14 to find that the atomic gas mass of the galaxy declines from at to at . We use Equation 7 to find that the net accretion rate of the galaxy over this interval is yr-1. We thus find that the net accretion rate of a main-sequence galaxy with a stellar mass of at , over the interval to , is far lower than both the average SFR and the molecular gas formation rate over the same period.
Following the same galaxy down to , we find that the stellar mass increases to (similar to that of the Milky Way), while the molecular gas mass and atomic gas mass both decline, to values of and , respectively, at . We note that that these stellar, atomic, and molecular gas masses are similar to those of the Milky Way (e.g. Kalberla & Kerp, 2009). Using Equations 3–7, we obtain yr-1, yr-1, and yr-1 over the 8-Gyr interval from to . We thus find that both and are lower than during the interval to ; this is unlike the situation in the interval to , where was similar to . Further, both and are significantly lower in the interval than at ; however, the time-averaged net gas accretion rate over is higher than that over .
3.2 The Net Gas Accretion and Molecular Gas Formation Rates as a Function of Stellar Mass

We apply a similar analysis to main-sequence galaxies with initial stellar masses (at ) in the range , similar to the range of stellar masses over which the GMRT-CAT survey obtained the relation (Chowdhury et al., 2022c). Figure 2[A] shows, as a function of stellar mass at , our estimates of , , and over the interval to , while Figure 2[B] shows the same quantities for the lower redshift interval to , again plotted against the final stellar mass, at . We note that the confidence intervals shown in Figure 2 take into account the uncertainties in the relation and the relation, but not that in the main-sequence relation; the uncertainties in our estimates of and are dominated by those in the former two scaling relations.
Figure 2[A] shows that, except for the most massive galaxies, the time-averaged molecular gas formation rate is similar to the net average SFR over the higher-redshift interval to . Both and are for galaxies with at . Remarkably, Figure 2[A] also shows that for main-sequence galaxies over the entire stellar mass range is far lower than both and . Indeed, our estimate of is consistent with no net accretion of neutral gas onto the disks of star-forming galaxies over the redshift range to . This essentially implies that the Hi that is consumed in molecular gas formation (and later, star-formation) is not replenished in main-sequence galaxies towards the end of the epoch of galaxy assembly.
For the most massive galaxies, with at , Fig. 2[A] indicates that the net gas accretion rate is negative, i.e. that outflows dominate infall in such galaxies over the redshift range to . Evidence has indeed been found for stronger outflows in higher stellar-mass galaxies at these redshifts: for example, Weiner et al. (2009) find that the outflow velocity in DEEP2 galaxies at scales , implying that the outflowing material may escape from high-mass galaxies. However, we emphasize that the result that outflows dominate infall in high-mass galaxies remains tentative, due to the uncertainties in the different scaling relations.
In the lower-redshift interval ( to ), Figure 2[B] shows that yr-1, typically far lower (except for the lowest stellar-mass galaxies) than for the same galaxy in the higher redshift interval, to . This is a direct consequence of the redshift evolution of the main-sequence relation (e.g. Whitaker et al., 2014; Popesso et al., 2022). Further, it can be seen from the figure that is lower than for galaxies over the entire stellar-mass range. This is different from the behavior in the higher-redshift interval, where Figure 2[A] shows that for all, except the most massive, galaxies. Finally, we find that the net average gas accretion rate of main-sequence galaxies over the lower redshift interval is comparable to for galaxies with today; however, continues to be lower than the average SFR, especially for galaxies today with stellar masses similar to or larger than that of the Milky Way.
3.3 The Build-up of Baryons in Main-Sequence Galaxies over the past Gyr
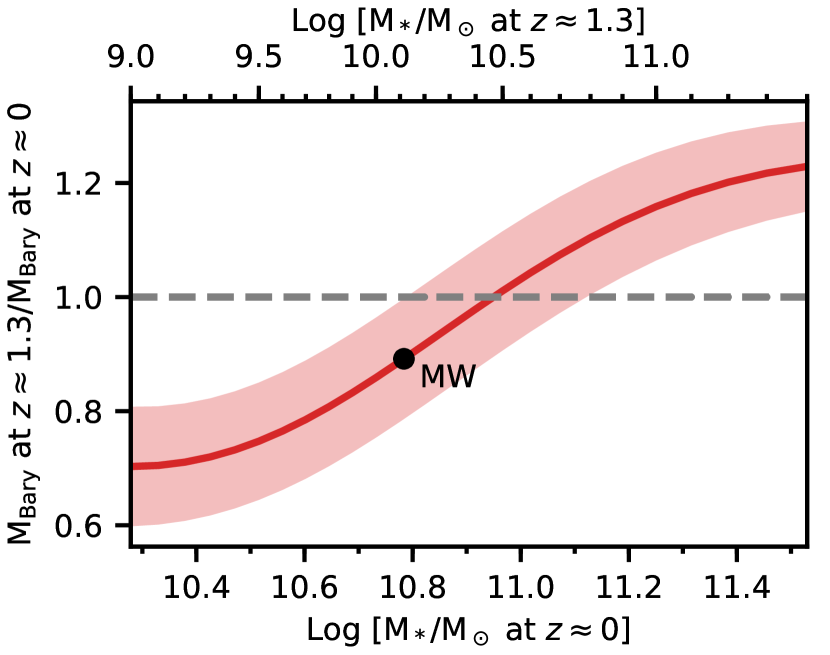
Our formalism can be used to track the build-up of baryons in galaxies333We emphasize that this does not include the baryons in the CGM. from to the present epoch. For this, we combine the estimates of the stellar mass, molecular gas mass, and atomic gas mass to estimate the baryonic mass of main-sequence galaxies at , , and . Again, we emphasize that we assume that the ionized gas mass within galaxies can be neglected relative to the stellar and neutral gas masses, and that we are not considering the CGM here. Figure 3 shows, as a function of the stellar mass of galaxies today, the fraction of the baryonic mass in individual galaxies today that was already within the galaxy by . It can be seen that most of the baryonic mass in star-forming galaxies with at was already in place by . Indeed, Figure 3 indicates that the baryonic mass in the disk of the most massive galaxies, with at , has actually declined over the past Gyr, by % in galaxies with at . The bulk of the evolution in massive galaxies over the last Gyr thus appears to involve the conversion of the baryonic material from atomic gas to molecular gas, and thence to stars, rather than acquisition of fresh gas from the CGM. Conversely, gas accretion from the CGM continues to play an important role in the evolution of low stellar-mass galaxies, with at . Such galaxies have acquired significant amounts of baryonic material from the CGM over the past Gyr, with the largest fractional increase in the baryonic mass (%) taking place in the lowest stellar-mass galaxies, with at
4 Discussion
Our results show that the net average gas accretion rate in main-sequence galaxies is lower than the average SFR in both redshift intervals, to , and to . This implies that the gas accretion rate does not keep pace with the SFR in main-sequence galaxies at : the star-formation activity in such galaxies is driven by the Hi that is present in their disks from earlier times. Our results thus suggest that the net gas accretion was significantly more efficient at high redshifts, , causing the build-up of Hi in the disks of main-sequence galaxies. It is plausible that this efficient accretion is via the cold mode, with gas flowing along filaments onto the disks of galaxies (e.g. Kereš et al., 2005; Dekel et al., 2009). In this scenario, the large Hi reservoirs resulted in a very efficient conversion of Hi to at , consistent with our estimate of a high , comparable to , over . This efficient Hi-to- conversion, in turn, triggers the high star-formation activity in galaxies at these redshifts, resulting in the observed era of high star-formation activity over , the epoch of galaxy assembly (Madau & Dickinson, 2014)
At later times, , a combination of physical processes are likely to have led to the observed low net gas accretion rate of Figure 2[B]. These include a transition to inefficient hot-mode accretion in massive galaxies, due to the increase in the masses of their dark matter halos (e.g. Dekel & Birnboim, 2006), an increased efficiency of stellar- and AGN-driven outflows in massive galaxies that remove gas from galaxies (e.g. Weiner et al., 2009; Veilleux et al., 2020), interactions between neighbouring galaxies that disrupt the smooth cold-mode filamentary flows, etc. The low net gas accretion rate at , combined with the very high SFR and high molecular gas formation rate, implies that the Hi reservoir is consumed on a very short timescale of Gyr (Chowdhury et al., 2022b). This results in a decline in the average Hi content of galaxies by (Chowdhury et al., 2022d), and in a lower average molecular gas formation rate at later times, as seen in Figure 2[B] at . The resulting decline in the amount of molecular gas available for star formation causes a decline in the star-formation activity in individual galaxies, especially in the more massive systems that dominate the SFR density of the Universe at . The low net gas accretion rate at is thus the primary cause of the observed decline in the SFR density of the Universe at . We emphasize that the above scenario is consistent with the measurements of the large Hi and reservoirs of main-sequence galaxies at , and the decline in the neutral-gas content of these galaxies at later times (Chowdhury et al., 2022d, b, a; Tacconi et al., 2020).
Our estimates of , , and over are the time-averaged rates over a relatively long, Gyr, interval. This implies that there could be significant evolution in each of these quantities between and that is not captured by the averages in Figure 2[B]. Indeed, Bera et al. (2023a) apply a similar formalism to find that galaxies over the last Gyr, from to , have , while is lower than the other two444We note, for ease of comparison, that Figure 4 of Bera et al. (2023a) shows the rate of change of the molecular gas content of galaxies, i.e. , rather than as defined in Equation 4; similar conclusions are reached using either metric.. They hence conclude that the decline in the star-formation activity over the past Gyr is primarily due to inefficient conversion of Hi to (Bera et al., 2023a). Combining the two results, it then appears that for the first few Gyrs after , the star-formation activity continues to be limited by the accretion of Hi onto galaxies, but at later times, even though the relatively low SFRs of galaxies are now comparable to their gas accretion rates, the star-formation activity continues to decline, but now primarily due to the low molecular gas formation rate. However, we caution that. the ranges of stellar mass explored in the study of Bera et al. (2023a) and this work are very different, with the typical stellar masses here being far higher than those in Bera et al. (2023a). In addition, as pointed out by Bera et al. (2023a), the small cosmic volume covered in their study implies that their scaling relation may be affected by cosmic variance.
5 Summary
In this Letter, we have combined our measurement of the scaling relation in main-sequence galaxies at from the GMRT-CAT1 survey, with estimates of the main-sequence relation and the relation, and the assumption of the continuity of main-sequence evolution, to determine the net average gas accretion rate and the molecular gas formation rate in main-sequence galaxies over two interesting intervals, to , at the end of the epoch of galaxy assembly, and to , the period when the SFR density of the Universe declines by an order of magnitude. We find that the average molecular gas formation rate is comparable to the average SFR in the former interval, but that the net gas accretion rate is significantly lower than both and . The low net gas accretion rate results in a depletion of the Hi reservoir in massive galaxies by , and causes the decline in the SFR density of the Universe at lower redshifts. In the lower-redshift interval, both and are lower than for all stellar masses; this results in the consumption of both the Hi and reservoirs, and a continuing decline in the SFR density of the Universe down to the present epoch. We also find that most of the baryonic contents of massive main-sequence galaxies, with at , was already in place Gyr ago, while low-mass galaxies, with at , have built up approximately of their baryonic content over this period.
References
- Astropy Collaboration et al. (2013) Astropy Collaboration, Robitaille, T. P., Tollerud, E. J., et al. 2013, A&A, 558, A33, doi: 10.1051/0004-6361/201322068
- Barnes et al. (2001) Barnes, D. G., Staveley-Smith, L., de Blok, W. J. G., et al. 2001, MNRAS, 322, 486, doi: 10.1046/j.1365-8711.2001.04102.x
- Bera et al. (2019) Bera, A., Kanekar, N., Chengalur, J. N., & Bagla, J. S. 2019, ApJ, 882, L7, doi: 10.3847/2041-8213/ab3656
- Bera et al. (2022) —. 2022, ApJ, 940, L10, doi: 10.3847/2041-8213/ac9d32
- Bera et al. (2023a) —. 2023a, ApJ, 956, L15, doi: 10.3847/2041-8213/acf71a
- Bera et al. (2023b) —. 2023b, ApJ, 950, L18, doi: 10.3847/2041-8213/acd0b3
- Bothwell et al. (2013) Bothwell, M. S., Maiolino, R., Kennicutt, R., et al. 2013, MNRAS, 433, 1425, doi: 10.1093/mnras/stt817
- Bouché et al. (2010) Bouché, N., Dekel, A., Genzel, R., et al. 2010, ApJ, 718, 1001, doi: 10.1088/0004-637X/718/2/1001
- Catinella et al. (2018) Catinella, B., Saintonge, A., Janowiecki, S., et al. 2018, MNRAS, 476, 875, doi: 10.1093/mnras/sty089
- Chengalur et al. (2001) Chengalur, J. N., Braun, R., & Wieringa, M. 2001, A&A, 372, 768, doi: 10.1051/0004-6361:20010547
- Chowdhury et al. (2022a) Chowdhury, A., Kanekar, N., & Chengalur, J. N. 2022a, ApJ, 935, L5, doi: 10.3847/2041-8213/ac8150
- Chowdhury et al. (2022b) —. 2022b, ApJ, 937, 103, doi: 10.3847/1538-4357/ac7d52
- Chowdhury et al. (2022c) —. 2022c, ApJ, 941, L6, doi: 10.3847/2041-8213/ac9d8a
- Chowdhury et al. (2022d) —. 2022d, ApJ, 931, L34, doi: 10.3847/2041-8213/ac6de7
- Chowdhury et al. (2020) Chowdhury, A., Kanekar, N., Chengalur, J. N., Sethi, S., & Dwarakanath, K. S. 2020, Nature, 586, 369, doi: 10.1038/s41586-020-2794-7
- Chowdhury et al. (2021) Chowdhury, A., Kanekar, N., Das, B., Dwarakanath, K. S., & Sethi, S. 2021, ApJ, 913, L24, doi: 10.3847/2041-8213/abfcc7
- Daddi et al. (2010) Daddi, E., Bournaud, F., Walter, F., et al. 2010, ApJ, 713, 686, doi: 10.1088/0004-637X/713/1/686
- Dekel & Birnboim (2006) Dekel, A., & Birnboim, Y. 2006, MNRAS, 368, 2, doi: 10.1111/j.1365-2966.2006.10145.x
- Dekel et al. (2009) Dekel, A., Birnboim, Y., Engel, G., et al. 2009, Nature, 457, 451, doi: 10.1038/nature07648
- Dénes et al. (2014) Dénes, H., Kilborn, V. A., & Koribalski, B. S. 2014, MNRAS, 444, 667
- Giovanelli et al. (2005) Giovanelli, R., Haynes, M. P., Kent, B. R., et al. 2005, AJ, 130, 2598, doi: 10.1086/497431
- Huang et al. (2012) Huang, S., Haynes, M. P., Giovanelli, R., & Brinchmann, J. 2012, ApJ, 756, 113, doi: 10.1088/0004-637X/756/2/113
- Kalberla & Kerp (2009) Kalberla, P. M. W., & Kerp, J. 2009, ARA&A, 47, 27, doi: 10.1146/annurev-astro-082708-101823
- Kereš et al. (2005) Kereš, D., Katz, N., Weinberg, D. H., & Davé, R. 2005, MNRAS, 363, 2, doi: 10.1111/j.1365-2966.2005.09451.x
- Leitner (2012) Leitner, S. N. 2012, ApJ, 745, 149, doi: 10.1088/0004-637X/745/2/149
- Leitner & Kravtsov (2011) Leitner, S. N., & Kravtsov, A. V. 2011, ApJ, 734, 48, doi: 10.1088/0004-637X/734/1/48
- Madau & Dickinson (2014) Madau, P., & Dickinson, M. 2014, ARA&A, 52, 415, doi: 10.1146/annurev-astro-081811-125615
- Møller et al. (2013) Møller, P., Fynbo, J. P. U., Ledoux, C., & Nilsson, K. K. 2013, MNRAS, 430, 2680, doi: 10.1093/mnras/stt067
- Noeske et al. (2007) Noeske, K. G., Weiner, B. J., Faber, S. M., et al. 2007, ApJ, 660, L43, doi: 10.1086/517926
- Parkash et al. (2018) Parkash, V., Brown, M. J. I., Jarrett, T. H., & Bonne, N. J. 2018, ApJ, 864, 40, doi: 10.3847/1538-4357/aad3b9
- Peng et al. (2010) Peng, Y.-j., Lilly, S. J., Kovač, K., et al. 2010, ApJ, 721, 193, doi: 10.1088/0004-637X/721/1/193
- Péroux & Howk (2020) Péroux, C., & Howk, J. C. 2020, ARA&A, 58, 363, doi: 10.1146/annurev-astro-021820-120014
- Popesso et al. (2022) Popesso, P., Concas, A., Cresci, G., et al. 2022, MNRAS, doi: 10.1093/mnras/stac3214
- Renzini (2009) Renzini, A. 2009, MNRAS, 398, L58, doi: 10.1111/j.1745-3933.2009.00710.x
- Rodighiero et al. (2011) Rodighiero, G., Daddi, E., Baronchelli, I., et al. 2011, ApJ, 739, L40, doi: 10.1088/2041-8205/739/2/L40
- Saintonge & Catinella (2022) Saintonge, A., & Catinella, B. 2022, arXiv e-prints, arXiv:2202.00690. https://arxiv.org/abs/2202.00690
- Saintonge et al. (2017) Saintonge, A., Catinella, B., Tacconi, L. J., et al. 2017, ApJS, 233, 22, doi: 10.3847/1538-4365/aa97e0
- Santini et al. (2014) Santini, P., Maiolino, R., Magnelli, B., et al. 2014, A&A, 562, A30, doi: 10.1051/0004-6361/201322835
- Scoville et al. (2016) Scoville, N., Sheth, K., Aussel, H., et al. 2016, ApJ, 820, 83, doi: 10.3847/0004-637X/820/2/83
- Scoville et al. (2017) Scoville, N., Lee, N., Vanden Bout, P., et al. 2017, ApJ, 837, 150, doi: 10.3847/1538-4357/aa61a0
- Speagle et al. (2014) Speagle, J. S., Steinhardt, C. L., Capak, P. L., & Silverman, J. D. 2014, ApJS, 214, 15, doi: 10.1088/0067-0049/214/2/15
- Tacconi et al. (2020) Tacconi, L. J., Genzel, R., & Sternberg, A. 2020, ARA&A, 58, 157, doi: 10.1146/annurev-astro-082812-141034
- Tacconi et al. (2013) Tacconi, L. J., Neri, R., Genzel, R., et al. 2013, ApJ, 768, 74, doi: 10.1088/0004-637X/768/1/74
- Veilleux et al. (2020) Veilleux, S., Maiolino, R., Bolatto, A. D., & Aalto, S. 2020, A&A Rev., 28, 2, doi: 10.1007/s00159-019-0121-9
- Walter et al. (2020) Walter, F., Carilli, C., Neeleman, M., et al. 2020, ApJ, 902, 111, doi: 10.3847/1538-4357/abb82e
- Weiner et al. (2009) Weiner, B. J., Coil, A. L., Prochaska, J. X., et al. 2009, ApJ, 692, 187, doi: 10.1088/0004-637X/692/1/187
- Whitaker et al. (2014) Whitaker, K. E., Franx, M., Leja, J., et al. 2014, ApJ, 795, 104, doi: 10.1088/0004-637X/795/2/104
- Zwaan (2000) Zwaan, M. A. 2000, PhD thesis, Ph.D. Thesis, Groningen: Rijksuniversiteit, 2000