scX: A user-friendly tool for scRNA-seq exploration.
Tomás Vega Waichman , M. Luz Vercesi , Ariel A. Berardino , Maximiliano S. Beckel , Damiana Giacomini , Natalí B. Rasetto , Magalí Herrero , Daniela J. Di Bella , Paola Arlotta , Alejandro F. Schinder and Ariel Chernomoretz
1 Integrative Systems Biology Lab, Leloir Institute, Buenos Aires, C1405 BWE, Argentina.
2 Instituto de Investigaciones Bioquímicas de Buenos Aires, Consejo Nacional de Investigaciones Científicas y Técnicas (CONICET), Buenos Aires, C1425 FQB, Argentina.
3 Laboratory of Neuronal Plasticity, Leloir Institute, Buenos Aires, C1405 BWE, Argentina.
4 Dept. of Stem Cells and Regenerative Biology, Harvard University & Stanley Center for Psychiatric Research, Broad Institute of MIT and Harvard, Cambridge, MA, USA.
5 Departamento de Física, Facultad de Ciencias Exactas y Naturales, Universidad de Buenos Aires, Instituto de Física de Buenos Aires, Consejo Nacional de Investigaciones Científicas y Técnicas (CONICET), Buenos Aires, Argentina
Abstract
Single-cell RNA sequencing (scRNAseq) has revolutionized our ability to explore biological systems by enabling the study of gene expression at the individual cell level. However, handling and analyzing this data often require specialized expertise. In this contribution, we present scX, an R package built on top of the Shiny framework, designed to simplify the analysis, exploration, and visualization of single-cell experiments. scX offers straightforward access to essential scRNAseq analyses, encompassing marker identification, gene expression profiling, and differential gene expression analysis. Implemented as a local web application with an intuitive graphical interface, scX allows users to create customized, publication-ready plots. Additionally, it seamlessly integrates with popular single-cell Seurat and SingleCellExperiment R objects, facilitating the rapid processing and visualization of diverse datasets. In summary, scX serves as a valuable tool for effortless exploration and sharing of single-cell data, alleviating some of the complexities associated with scRNAseq analysis.
1 Introduction
After nearly fifteen years of continuous development, single-cell transcriptomics continues to have a profound impact on the biomedical research field [1, 2, 3, 4, 5]. Over the years, various data-processing pipelines have been proposed [6, 7, 8, 9, 10], as well as visualization tools that aimed to ease the analysis of this type of high-throughput assays [11]. SCope [12], iSEE [13], Loom Viewer, and ShinyCell[14] are noteworthy tools that primarily concentrate on data visualization, offering a diverse range of plots and graphical data representations. There are also alternative tools, such as ASAP [15], SPRING[16], and scViewer[17], that incorporate single-cell data analysis features. Although they may prove to be useful for certain analyses, they are somewhat limited in terms of interactivity and graphical diversity, thereby restricting users’ ability to visually represent their analyses.
Here we present scX, an R package that deploys a Shiny-based application developed for researchers to explore single-cell datasets using a variety of tools that are not typically consolidated into a single software solution. This includes interactive 3D visualizations of low-dimensional embeddings, the identification of markers for specific cell groups (including ones defined on-the-fly), analysis of differentially expressed genes under various conditions, and exploratory data analysis capabilities through the use of a wide array of publication-ready plot types (including heatmaps, violin plots, box plots, spike plots, and dot plots). These tools allow for comprehensive data analysis that may be enriched with continuous and/or categorical metadata to foster a biologically meaningful characterization of the data under study.
2 Methods
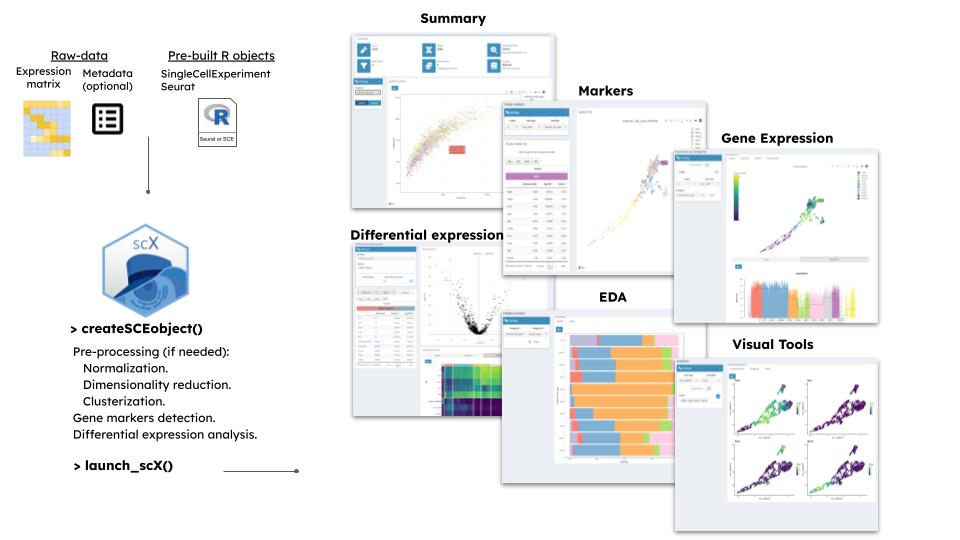
The scX app can be simply launched after executing two R functions. Starting from a provided count matrix, SingleCellExperiment object, or a Seurat object, the function ”createSCEobject” creates the object which is subsequently utilized within the application. This function automatically executes, in case the corresponding information is absent in the input dataset, a series of preprocessing steps, including the calculation of quality control metrics, normalization of the gene-expression matrix, identification of the most variable genes, estimation of 2-dim and 3-dim dimensionality reductions embeddings (PCA, t-SNE, UMAP), and community detection. Additionally, differential expression analysis and marker gene identification tasks are performed for one or more user-specified partitions. To carry out all these steps, we rely on the scran and scater Bioconductor packages [18, 19]. The function ”launch_scX”, on the other hand, launches the scX Shiny app. In the following sections, we will describe the design principles and main functional modules implemented in the application (see Fig. 1).
2.1 Summary module
A summary of the primary descriptive details of the working dataset, such as the number of cells and genes, the mean number of genes detected per cell, the number of different user-specified partitions included as metadata, and the average library size, is presented in the Summary module. Furthermore, the number of counts and detected features can be visually displayed in relation to various metadata covariates, allowing the evaluation of potential batch-related issues.
2.2 Markers module
The ’Cluster markers’ section facilitates the analysis of marker genes, identified through the use of the findMarkers function from the scran package at the pre-processing step. These markers are analyzed for any user-specified partition, typically representing cell types or cell states. When a cell displayed in the embedding is selected, a table of marker genes specific to the partition to which that cell belongs is generated. This table includes metrics for each gene marker. The table can be saved in various formats, including .csv, .xlsx, .pdf, or copied to the clipboard. By clicking on a gene in the table the corresponding expression profile can be visualized in the embedding window. Additional graphical characterizations are provided as violin and spike plots presented at the bottom of the page. In the ’Find new markers’ section, you can investigate markers for on-the-fly defined sets of cells, which can be directly selected from the embedding window using the box or lasso tools. scX calculates marker genes for the cells of interest, and the marker table, along with the corresponding cell list, can be downloaded. Similarly to the previous section, clicking on a marker row generates a visualization of the marker’s expression pattern in the embedding dataset. Additional graphical characterizations in the form of violin and spike plots are also produced.
2.3 Gene Expression module
The ’Gene Expression’ module facilitates the exploration of expression patterns for one or more genes of interest. Expression changes in response to different categorical and/or numerical covariates can be assessed, and coexpression patterns between pairs of genes can be analyzed. In the ’Categories’ section, one or more genes of interest can be selected (or uploaded from a file). The module displays the average expression of these genes across the embedded dataset in the ’Scatter’ window. Visualization options, including heatmaps, dot plots, and stacked violin plots, are also available for analyzing the expression of these genes concerning different categorical covariates found in the metadata. The ’Field’ section allows for the analysis of gene expression in conjunction with numerical covariates that may be present in the metadata within the SCE object. This can include variables like the number of counts or pseudotime values. Below the embedding, a line plot illustrates the average expression of the selected genes as a function of the chosen variables, and a spike plot. Additionally, heatmaps with columns sorted according to the selected numerical variable, which can be further categorized based on a chosen categorical variable, and multiline plots comparing the expression profile of the genes of interest along the analyzed numerical covariate are available. Finally, the ’Co-expression’ section allows for the examination of coexpression patterns between selected gene pairs in the embedding space window. The percentage of co-detection events within categorized groups of cells can also be assessed and visualized.
2.4 Differential Expression module
In this section, differential expression analysis between two clusters can be conducted. Differentially expressed genes were identified using the findMarkers function from the scran package, at the preprocessing step. Interactive selection of threshold values for both logFC (logarithm of fold change) and the FDR (False Discovery Rate) significance level is available. The list of differentially expressed genes is downloadable in various formats, including csv, pdf, and xlsx. This section also generates a Volcano plot graphical representation, along with visualizations like violin plots, spike plots, heatmaps, and dot plots, facilitating a more comprehensive understanding of expression patterns for up- and down-regulated genes.
2.5 Exploratory Data Analysis module
This module allows for the exploration of relationships between the covariates included in the metadata of the SCE object. In the ’Categories’ section, you can use bar plots to analyze one- or two-dimensional distribution functions involving categorical covariates. The ’Matrix’ tab also allows the generation of bi-variate count tables.The ’Field’ section of this module enables the exploration of how the value of one or more continuous covariates changes concerning another variable, which can be either numerical or categorical. Different types of plots, including box plots, heatmaps, dot plots, or stacked violin plots, can be generated to assist in this analysis.
2.6 Visual tools module
This module provides many tools to produce publication-ready pdf plots with more complex or specific layouts involving gene expression patterns and covariate variables.
3 Conclusions
We developed scX, a Shiny-based application that enhances collaboration between bioinformaticians and experimental biologists in joint projects. The platform is user-friendly and highly interactive, fostering a collaborative environment that could significantly advance the development of joint projects.
4 Code availablity
Source code can be downloaded from https://github.com/chernolabs/scX. User manual available at https://chernolabs.github.io/scX/
Acknowledgements
D.G., A.C., and A.F.S. are investigators in the Consejo Nacional de Investigaciones Científicas y Técnicas (CONICET). N.B.R, A.A.B. M.H. and M.B. were supported by CONICET fellowships. This work was supported by grants the National Institute of Neurological Disorders and Stroke (NINDS) and Fogarty International Center (FIC) (R01NS103758) to P.A. and A.F.S., and the Argentine Agency for the Promotion of Science and Technology (PICT-2020-0046 and PICT-2021-0077) to A.F.S., (PICT 2018-03713) to A.C. and (PICT 2017-0389) to D.G.
References
- 1. Aviv Regev, Sarah A Teichmann, Eric S Lander, Ido Amit, Christophe Benoist, Ewan Birney, Bernd Bodenmiller, Peter Campbell, Piero Carninci, Menna Clatworthy, Hans Clevers, Bart Deplancke, Ian Dunham, James Eberwine, Roland Eils, Wolfgang Enard, Andrew Farmer, Lars Fugger, Berthold Göttgens, Nir Hacohen, Muzlifah Haniffa, Martin Hemberg, Seung Kim, Paul Klenerman, Arnold Kriegstein, Ed Lein, Sten Linnarsson, Emma Lundberg, Joakim Lundeberg, Partha Majumder, John C Marioni, Miriam Merad, Musa Mhlanga, Martijn Nawijn, Mihai Netea, Garry Nolan, Dana Pe’er, Anthony Phillipakis, Chris P Ponting, Stephen Quake, Wolf Reik, Orit Rozenblatt-Rosen, Joshua Sanes, Rahul Satija, Ton N Schumacher, Alex Shalek, Ehud Shapiro, Padmanee Sharma, Jay W Shin, Oliver Stegle, Michael Stratton, Michael J T Stubbington, Fabian J Theis, Matthias Uhlen, Alexander van Oudenaarden, Allon Wagner, Fiona Watt, Jonathan Weissman, Barbara Wold, Ramnik Xavier, Nir Yosef, and Human Cell Atlas Meeting Participants. The human cell atlas. Elife, 6, December 2017.
- 2. Seitaro Nomura. Single-cell genomics to understand disease pathogenesis. J. Hum. Genet., 66(1):75–84, January 2021.
- 3. Mario L Suvà and Itay Tirosh. Single-cell RNA sequencing in cancer: Lessons learned and emerging challenges. Mol. Cell, 75(1):7–12, July 2019.
- 4. Jennifer E Rood, Aidan Maartens, Anna Hupalowska, Sarah A Teichmann, and Aviv Regev. Impact of the human cell atlas on medicine. Nat. Med., 28(12):2486–2496, December 2022.
- 5. Lisa Sikkema, Ciro Ramírez-Suástegui, Daniel C Strobl, Tessa E Gillett, Luke Zappia, Elo Madissoon, Nikolay S Markov, Laure-Emmanuelle Zaragosi, Yuge Ji, Meshal Ansari, Marie-Jeanne Arguel, Leonie Apperloo, Martin Banchero, Christophe Bécavin, Marijn Berg, Evgeny Chichelnitskiy, Mei-I Chung, Antoine Collin, Aurore C A Gay, Janine Gote-Schniering, Baharak Hooshiar Kashani, Kemal Inecik, Manu Jain, Theodore S Kapellos, Tessa M Kole, Sylvie Leroy, Christoph H Mayr, Amanda J Oliver, Michael von Papen, Lance Peter, Chase J Taylor, Thomas Walzthoeni, Chuan Xu, Linh T Bui, Carlo De Donno, Leander Dony, Alen Faiz, Minzhe Guo, Austin J Gutierrez, Lukas Heumos, Ni Huang, Ignacio L Ibarra, Nathan D Jackson, Preetish Kadur Lakshminarasimha Murthy, Mohammad Lotfollahi, Tracy Tabib, Carlos Talavera-López, Kyle J Travaglini, Anna Wilbrey-Clark, Kaylee B Worlock, Masahiro Yoshida, Lung Biological Network Consortium, Maarten van den Berge, Yohan Bossé, Tushar J Desai, Oliver Eickelberg, Naftali Kaminski, Mark A Krasnow, Robert Lafyatis, Marko Z Nikolic, Joseph E Powell, Jayaraj Rajagopal, Mauricio Rojas, Orit Rozenblatt-Rosen, Max A Seibold, Dean Sheppard, Douglas P Shepherd, Don D Sin, Wim Timens, Alexander M Tsankov, Jeffrey Whitsett, Yan Xu, Nicholas E Banovich, Pascal Barbry, Thu Elizabeth Duong, Christine S Falk, Kerstin B Meyer, Jonathan A Kropski, Dana Pe’er, Herbert B Schiller, Purushothama Rao Tata, Joachim L Schultze, Sara A Teichmann, Alexander V Misharin, Martijn C Nawijn, Malte D Luecken, and Fabian J Theis. An integrated cell atlas of the lung in health and disease. Nat. Med., 29(6):1563–1577, June 2023.
- 6. F Alexander Wolf, Philipp Angerer, and Fabian J Theis. SCANPY: large-scale single-cell gene expression data analysis. Genome Biol., 19(1):15, February 2018.
- 7. Andrew Butler, Paul Hoffman, Peter Smibert, Efthymia Papalexi, and Rahul Satija. Integrating single-cell transcriptomic data across different conditions, technologies, and species. Nat. Biotechnol., 36(5):411–420, June 2018.
- 8. Malte D Luecken and Fabian J Theis. Current best practices in single-cell RNA-seq analysis: a tutorial. Mol. Syst. Biol., 15(6):e8746, June 2019.
- 9. Robert A Amezquita, Aaron T L Lun, Etienne Becht, Vince J Carey, Lindsay N Carpp, Ludwig Geistlinger, Federico Marini, Kevin Rue-Albrecht, Davide Risso, Charlotte Soneson, Levi Waldron, Hervé Pagès, Mike L Smith, Wolfgang Huber, Martin Morgan, Raphael Gottardo, and Stephanie C Hicks. Orchestrating single-cell analysis with bioconductor. Nat. Methods, 17(2):137–145, February 2020.
- 10. Tallulah S Andrews, Vladimir Yu Kiselev, Davis McCarthy, and Martin Hemberg. Tutorial: guidelines for the computational analysis of single-cell RNA sequencing data. Nat. Protoc., 16(1):1–9, January 2021.
- 11. Batuhan Cakir, Martin Prete, Ni Huang, Stijn van Dongen, Pinar Pir, and Vladimir Yu Kiselev. Comparison of visualization tools for single-cell RNAseq data. NAR Genom. Bioinform., 2(3):lqaa052, September 2020.
- 12. Kristofer Davie, Jasper Janssens, Duygu Koldere, Maxime De Waegeneer, Uli Pech, Łukasz Kreft, Sara Aibar, Samira Makhzami, Valerie Christiaens, Carmen Bravo González-Blas, Suresh Poovathingal, Gert Hulselmans, Katina I Spanier, Thomas Moerman, Bram Vanspauwen, Sarah Geurs, Thierry Voet, Jeroen Lammertyn, Bernard Thienpont, Sha Liu, Nikos Konstantinides, Mark Fiers, Patrik Verstreken, and Stein Aerts. A single-cell transcriptome atlas of the aging drosophila brain. Cell, 174(4):982–998.e20, August 2018.
- 13. Kevin Rue-Albrecht, Federico Marini, Charlotte Soneson, and Aaron T L Lun. ISEE: Interactive SummarizedExperiment explorer. F1000Res., 7:741, June 2018.
- 14. John F Ouyang, Uma S Kamaraj, Elaine Y Cao, and Owen J L Rackham. ShinyCell: simple and sharable visualization of single-cell gene expression data. Bioinformatics, 37(19):3374–3376, October 2021.
- 15. Fabrice P A David, Maria Litovchenko, Bart Deplancke, and Vincent Gardeux. ASAP 2020 update: an open, scalable and interactive web-based portal for (single-cell) omics analyses. Nucleic Acids Research, 48(W1):W403–W414, 05 2020.
- 16. Caleb Weinreb, Samuel Wolock, and Allon M Klein. SPRING: a kinetic interface for visualizing high dimensional single-cell expression data. Bioinformatics, 34(7):1246–1248, 12 2017.
- 17. Abhijeet R. Patil, Gaurav Kumar, Huanyu Zhou, and Liling Warren. scviewer: An interactive single-cell gene expression visualization tool. Cells, 12(11):1489, May 2023.
- 18. Davis J McCarthy, Kieran R Campbell, Aaron T L Lun, and Quin F Wills. Scater: pre-processing, quality control, normalization and visualization of single-cell RNA-seq data in R. Bioinformatics, 33(8):1179–1186, April 2017.
- 19. Aaron T L Lun, Davis J McCarthy, and John C Marioni. A step-by-step workflow for low-level analysis of single-cell RNA-seq data with bioconductor. F1000Res., 5:2122, August 2016.