11email: romain.meyer@unige.ch 22institutetext: Max-Planck Institute for Astronomy, Königstuhl 17, 69118 Heidelberg, Germany 33institutetext: Center for Astrophysics — Harvard & Smithsonian, 60 Garden Street, Cambridge, MA 02138, USA 44institutetext: MIT Kavli Institute for Astrophysics and Space Research, 77 Massachusetts Ave., Cambridge, MA 02139, USA 55institutetext: Cosmic Dawn Center (DAWN), Niels Bohr Institute, University of Copenhagen, Jagtvej 128, København N, DK-2200, Denmark
NOEMA reveals the true nature of luminous red JWST galaxy candidates
The first year of JWST has revealed a surprisingly large number of luminous galaxy candidates beyond . While some galaxies have already been spectroscopically confirmed, there is mounting evidence that a subsample of the candidates with particularly red inferred UV colours are, in fact, lower redshift contaminants. These interlopers are often found to be ‘HST-dark’ or ‘optically faint’ galaxies at , a population that is key to improving our understanding of dust-obscured star formation throughout cosmic time. This paper demonstrates the complementarity of ground-based mm-interferometry and JWST infrared imaging to unveil the true nature of red 1.5-2.0 dropouts that have been selected as ultra-high-redshift galaxy candidates. We present NOEMA Polyfix follow-up observations of four JWST red 1.5-2.0 dropouts selected by Yan et al. (2023a) as ultra-high-redshift candidates in the PEARLS-IDF field. The new NOEMA observations constrain the rest-frame far-infrared continuum emission and efficiently discriminate between intermediate- and high-redshift solutions. We report NOEMA continuum detections of all our target galaxies at observed frequencies of and , with FIR slopes indicating a redshift of . We modelled their optical-to-FIR spectral energy distribution (SED) with multiple SED codes, finding that they are not galaxies but dust-obscured, massive star-forming galaxies at instead. The contribution to the cosmic star formation rate density (CSFRD) of such sources is not negligible at (; or of the total CSFRD), in line with previous studies of optically faint and sub-millimeter galaxies. This work showcases a new way to select intermediate- to high-redshift dust-obscured galaxies in JWST fields with minimal wavelength coverage. This approach opens up a new window onto obscured star formation at intermediate redshifts, whilst removing contaminants with red colours from searches at ultra-high redshifts.
Key Words.:
Galaxies: high-redshift, Techniques: interferometric, Submillimeter: galaxies1 Introduction
The first year of operation of JWST has transformed our view of early galaxy evolution. In particular, the imaging sensitivity and near-infrared coverage up to of the NIRCam instrument (Rieke et al., 2023) has been unveiling new galaxies undetected even in the deepest HST observations. These objects fall in two broad categories: 1) ultra-high-redshift candidates () invisible in HST due to the Lyman- break caused by the neutral intergalactic medium and 2) a collection of massive, intermediate-redshift () galaxies with red colours and high dust attenuation making them extremely faint at the wavelengths probed by HST ().
Ultra-high-redshift galaxies have been the focus of multiple studies in the first deep fields observed with JWST, with numerous candidates claimed at , as well as some up to (Finkelstein et al., 2022, 2023a; Naidu et al., 2022; Harikane et al., 2023; Donnan et al., 2022; Adams et al., 2022; Yan et al., 2023a, b). An excess at the bright end of the UV luminosity function could indicate enhanced star formation rate efficiencies in the first 500 Myr, but caution is still necessary as most of the objects still only have photometric redshifts. Whilst multiple objects have been successfully confirmed with spectroscopy (e.g. Arrabal Haro et al., 2023a, b; Wang et al., 2023; Harikane et al., 2023; Bunker et al., 2023; Curtis-Lake et al., 2023), catastrophic outliers have already been identified, with galaxies with extreme dust and/or line emission properties masquerading as candidates (Naidu et al., 2022; Zavala et al., 2023; Arrabal Haro et al., 2023a; Wang et al., 2023). Some studies, recognising the likely contamination of high-redshift samples by lower redshift dusty galaxies, have already proposed additional criteria (e.g. between low- and high-z solutions, integral of ) to complement the initial photometric redshift selection (e.g. Finkelstein et al., 2023a; Harikane et al., 2023). These different definitions of robust high-redshift candidate lead to disagreements on the exact number of candidates in each field (Bouwens et al., 2023). Whilst such ad hoc prescription have successfully led to large fraction of objects confirmed with spectroscopy (e.g. Finkelstein et al., 2023b; Harikane et al., 2023), the nature of the dusty, likely lower-redshift contaminants remains speculative in the absence of dedicated follow-up observations.
The JWST-detected population of dusty galaxies has been identified as an extension of ‘HST-dark’, ‘ALMA-only’, optically faint infrared, or dusty star-forming galaxies (DSFGs) thought to be responsible for most of the obscured star formation at high redshift (e.g. Blain et al., 1999; Smail et al., 2002; Chapman et al., 2005; Barger et al., 2012; Swinbank et al., 2014; Elbaz et al., 2011; Casey et al., 2014, 2018; Wang et al., 2019; Alcalde Pampliega et al., 2019; Williams et al., 2019; Fudamoto et al., 2020; Dudzevičiūtė et al., 2020; Shu et al., 2022; Xiao et al., 2023). Their detection and study with JWST shows that these names only described a particular selection function for objects with a wide range of properties (Nelson et al., 2023; Rodighiero et al., 2022; Pérez-González et al., 2023; Barrufet et al., 2023; Smail et al., 2023; Barger & Cowie, 2023). Broadly speaking, these studies find that optically faint galaxies detected now with JWST are intermediate- to high-redshift (), dusty () with a large fraction of obscured star formation or passive galaxies, and could contribute a significant fraction of the cosmic star formation rate density at . However, this picture is evolving rapidly as their census is still incomplete and new ways of identifying such optically invisible galaxy are still in development. In particular, large numbers of these objects might be hidden in ultra-high-redshift candidates lists, based on the detection of a break at .
The purpose of this Letter is to demonstrate the power of millimeter observations to determine the nature of ambiguous 1.5–2.0 red dropouts detected in JWST imaging data. Specifically, we present follow-up observations of four 1.5–2.0 red dropouts selected by Yan et al. (2023a) in the PEARLS survey with a limited number of JWST/NIRCam imaging filters (F150W, F277W, F356W, and F444W). We show that most SED fitting codes, using standard parameters, either prefer or have degenerate or bimodel posterior redshift solutions. Here, we present NOEMA 1 mm detections of their FIR continuum ( detection rate) to demonstrate that such observations break the degeneracy between intermediate- and high-redshift photometric redshift solutions. Our SED modelling of the red 1.5–2.0 dropouts shows that they are massive, dusty galaxies at similar to so-called ‘HST-dark’ galaxies (see also Zavala et al., 2023).
Throughout this letter, we use a concordance cosmology with , , and . Magnitudes are indicated in the AB system (Oke, 1974).
2 NOEMA observations
We studied four objects detected in JWST F200W, F356W, and F444W imaging of the PEARLS survey (Windhorst et al., 2023) and selected as ultra-high-redshift candidates based on their colours (Yan et al., 2023a). The four targets of this work were chosen to be the brightest, but also the reddest in the Yan et al. (2023a) sample (F150D_JWIDF_E01,F150D_JWIDF_H17, F200D_JWIDF_M03, and F200D_JWIDF_H08), guaranteeing a detection at if their redshift is , or if they are at (see further Section 3 and Appendix A). For completeness, their HST and JWST photometry from Yan et al. (2023a) is reproduced in Table 1, alongside our NOEMA FIR continuum measurements.
| ID | [AB] | [AB] | [AB] | [AB] | [AB] | [mJy] | [mJy] |
|---|---|---|---|---|---|---|---|
| F150D_JWIDF_E01 | |||||||
| F150D_JWIDF_H17 | |||||||
| F200D_JWIDF_H08 | |||||||
| F200D_JWIDF_M03 |
The targets were observed with NOEMA in Band 3 between December 17-18 2022. The targets were set at the phase center and observed for h (on-source) in track-sharing mode. Two targets are close (potentially interacting/merging; F150DE01 and F200DH08) and are observed simultaneously in the same pointing. The spectral setups were tuned at a nominal central frequency of in the upper sideband and in the lower sideband.
The data was calibrated and reduced at IRAM (remotely) using the latest CLIC package in the GILDAS framework. We flag a small fraction of the tracks affected by poor weather conditions and baselines with bad phase solutions. We image the continuum in the lower and upper sidebands separately using natural weighting and Hogbom cleaning down to in MAPPING with circular support regions centered on the JWST target positions. The final synthesized beam size is () and the final continuum rms achieved is at , respectively.
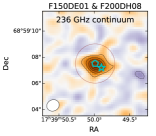
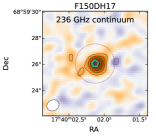
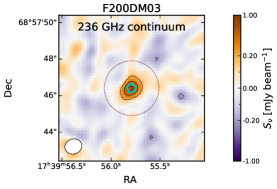
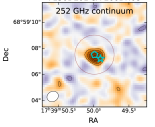
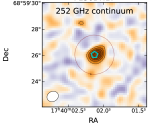
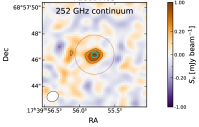
We show the continuum imaging of the targets in Fig. 1, where all the sources are clearly detected at –15. No additional continuum sources were detected in the NOEMA field of view (). The sources are only marginally resolved and the difference between the aperture-integrated fluxes and that of the central pixel is at most depending on the aperture size used. Thus, we simply measured the continuum fluxes in the central brightest pixel, which is equivalent to the total flux within one (synthesised) beam. This also avoids any complications when comparing the fluxes between the two sidebands.
The two close galaxies F150DE01 and F200DH08 are not resolved, with a total continuum flux of . Based on the assumption that both objects are of a similar nature, we assign half of the flux to each galaxy and use a fiducial relative error of reflecting the uncertainty on the fraction of flux originating from each object. This has little impact on our results as the redshift and nature of the sources is already sufficiently constrained by continuum detection. The continuum flux densities and errors for all sources are presented in Table 1.
We also produced datacubes for each sideband with 20 MHz-wide channels. The rms noise in the cube per channel. For each source, we extract spectra in apertures as well as in the central pixel only and we find no emission line in the frequency range covered by our observations ( GHz, GHz).
3 Multi-wavelength SED modelling and the nature of red 1.5–2.0 dropouts
We modelled the SED of the four red dropouts using five different codes: EAZY Brammer et al. (2012), CIGALE (Boquien et al., 2019), BAGPIPES (Carnall et al., 2018), and PROSPECTOR Johnson et al. (2021). We briefly review the parameters used to run each code below.
EAZY:
The most important choice when using EAZY is the choice of templates. We ran EAZY twice: once with the tweak_FSPS_templates, augmented with the three bluer templates (with and without Lyman- emission) from Larson et al. (2023), and a second time with the blue_sfhz222https://github.com/gbrammer/eazy-photoz/tree/master/templates/sfhz templates with redshift-dependent star formation histories. We fit the data between redshift 0 and 20, using no prior on the luminosity, and applied template error using the values derived from the COSMOS2020 dataset.
CIGALE:
We ran a grid of CIGALE models using a delayed star formation rate history () and a recent burst, using the SSP models from Bruzual & Charlot (2003) with a Chabrier (2003) IMF and a fixed metallicity of . We varied the nebular line emission contribution with (in steps of 0.5) with a fixed gas metallicity of and fixed electron density of . The dust attenuation was modelled with the dustatt_modified_starburst module that uses the Calzetti et al. (2000) attenuation for the continuum, with and a MW-like attenuation curve for the emission lines. The models were fitted within in steps of .
We also fit the near-infrared to FIR photometry with CIGALE templates, including an AGN contribution using SKIRTOR templates (Stalevski et al., 2016). We find that the addition of AGN template does not improve the of the best-fit solutions and that the contribution of AGN to the observed photometry is negligible in the best-fit composite SEDs. We thus proceed by fitting the available photometry with pure stellar light SEDs.
BAGPIPES:
We used the latest version of BAGPIPES (Carnall et al., 2018) with a delayed star formation history (), the dust attenuation from Calzetti et al. (2000), with , nebular line emission with , metallicities spanning . BAGPIPES uses Bruzual & Charlot (2003) SSP models with a Kroupa (2001) IMF, and we use a fixed metallicity , matching that used in CIGALE. As BAGPIPES does not include a special treatment of non-detections, we set the fluxes of upper limits to and use the upper limit as the error when fitting the spectra.
Prospector:
We ran Prospector using a uniform redshift prior and a delayed-tau SFH history. The physical parameters priors follow the choices of Tacchella et al. (2022), for instance, the gas and stellar metallicity, dust properties, and nebular emission parameters (see Table 1 and Section 3.4 of Tacchella et al., 2022), except for the dust extinction , where we used a uniform prior to match that used for the BAGPIPES and CIGALE runs above.
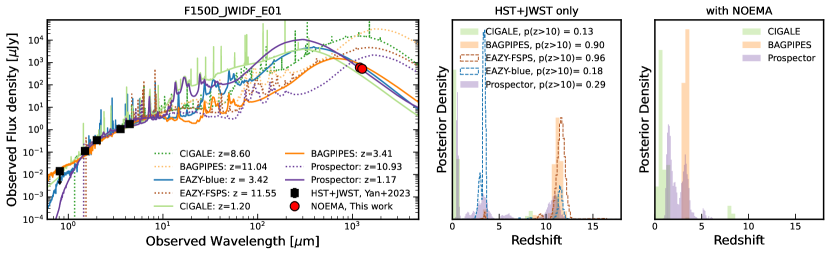
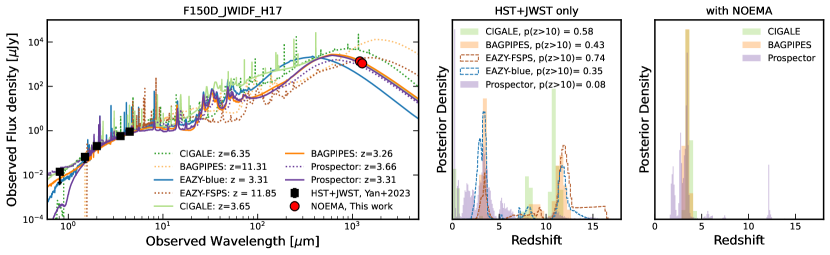
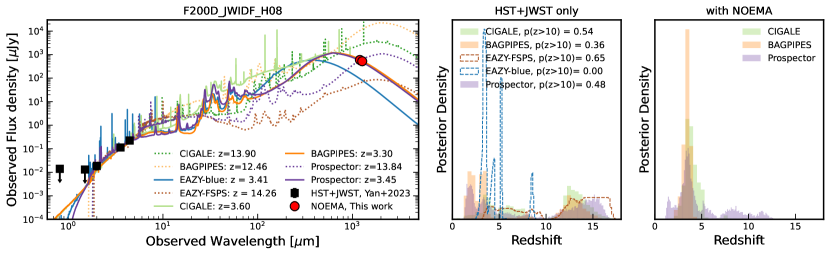
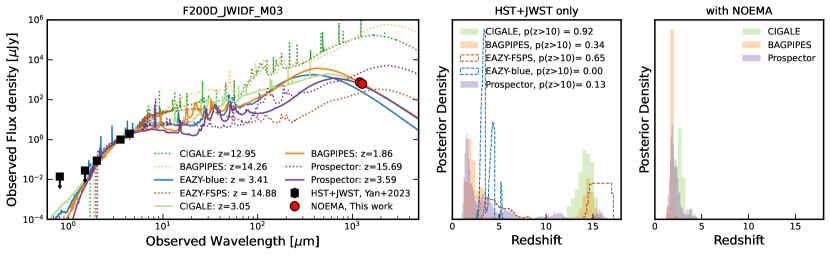
We fit the photometry of each object (see Table 1) with and without our NOEMA 1mm constraints. We show in Figure 2 the best-fit SEDs and the posterior redshift distributions. The first result is that a majority of the codes, in the absence of FIR constraints, either prefer a high-redshift () solution or allow one (with a solution peaking at least at half the likelihood of the intermediate redshift solution). The notable exception is EAZY using the new blue_shfz_13 templates, which consistently prefers the lower redshift solution, although the posterior redshift distribution for F150W dropouts still contains solutions at . The different performance of the blue_shfz_13 templates can be explained by the inferred rest-frame UV slopes of our targets if they would be at . To derive the inferred rest-frame UV slopes, we fit the rest-frame UV () of all the models from BAGPIPES, with a power law of . We find UV slopes for the solutions , for F150D_JWIDF_E01, F150D_JWIDF_H17, F200D_JWIDF_H08, and F200D_JWIDF_M03, respectively. These values are much higher than that the typical measured in confirmed galaxies (e.g. Bunker et al., 2023; Curtis-Lake et al., 2023). The absence of extremely red templates at high-redshift in the blue_shfz_13 set therefore explains the lower photometric redshift solutions for this particular EAZY run.
Prospector also prefers lower-redshift solutions, although the probability for a is still significant (, see Fig. 2). However, we note that the Prospector results heavily depend on the choice of priors for the various physical parameters. Indeed, the maximum-likelihood solutions (plotted in dotted purple in Fig. 2) are for F150D_JWIDF_E01, F150D_JWIDF_H17, F200D_JWIDF_H08, and F200D_JWIDF_M03, respectively. We also find the posterior redshift distribution to be strongly dependent on the dust parameters priors, for instance, a lognormal prior for the dust extinction will result in solution being strongly preferred. The Prospector results are likely prior-dominated due to the low number of continuum datapoints.
The second important result is that the addition of the NOEMA observations completely transforms the posterior redshift distribution, as also shown in Zavala et al. (2023). Indeed, once the FIR continuum constraints are included in the fits, an intermediate redshift solution () is strongly preferred in all codes.333We did not fit the full optical-to-FIR SED with EAZY as the accuracy of the photo-z has not been tested with FIR data, even though the template extend to that regime (private communication, G. Brammer). In our tests we indeed find that the inclusion of constraints in the mm-regime do not change the photometric redshifts inferred..
| ID | ||||
|---|---|---|---|---|
| [mag] | ||||
| BAGPIPES | ||||
| F200D_M03 | ||||
| F200D_H08 | ||||
| F150D_H17 | ||||
| F150D_E01 | ||||
| CIGALE | ||||
| F200D_M03 | ||||
| F200D_H08 | ||||
| F150D_H17 | ||||
| F150D_E01 | ||||
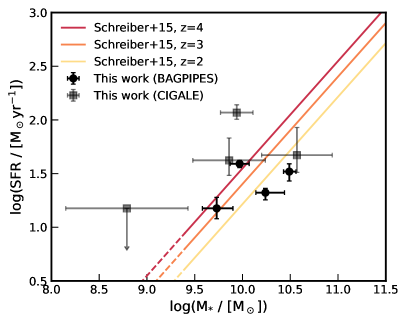
Using BAGPIPES and CIGALE to fit their optical-to-FIR SED, we find that the four sources are galaxies at intermediate redshift (), with star formation rates of SFR, stellar masses of , and high obscuration (). CIGALE tends to prefer solutions with lower redshifts, along with higher masses and dust attenuations, but the BAGPIPES and CIGALE results are consistent within the errors (see further Table 4 for the full results of the two codes). The most important conclusion is that these objects are obscured galaxies at that lie on the galaxy main sequence (see Fig. 3), similarly to the HST-faint/JWST-detected objects reported by Barrufet et al. (2023).
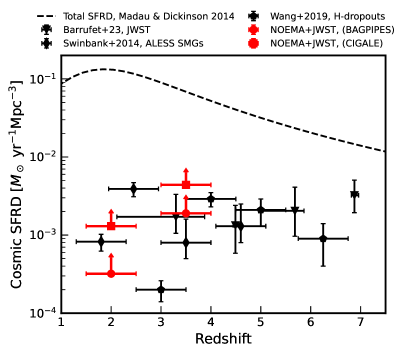
We used the best-fit BAGPIPES spectrum to derive the obscured and unobscured star formation rate, using the Kennicutt & Evans (2012) conversion factors from the rest-frame FIR () and UV () luminosities. We find that that all galaxies are highly obscured, with a negligible contribution of the unobscured SFR to the total SFR, with . We also estimate the contribution of these objects to the total cosmic star formation rate density using the median SFR of the BAGPIPES/CIGALE posterior and the area of the PEARLS-IDF field our targets were selected from ( arcmin2). Using a wide redshift bin and ignoring the effect of the unknown selection function, we find lower limits on the cosmic SFR density (CSFRD) of at and at , where the range of values encompasses the scatter between the CIGALE and BAGPIPES results (see Table 4). The CSFRD we derive for the four sources is in good agreement with the literature constraints on the contribution of obscured galaxies to the CSFRD at these redshifts (see Fig. 4, right panel; and e.g. Blain et al., 1999; Chapman et al., 2005; Barger et al., 2012; Swinbank et al., 2014; Wang et al., 2019; Dudzevičiūtė et al., 2020; Shu et al., 2022; Barrufet et al., 2023), representing a contribution to the total CSFRD at .
4 Conclusions
We present a NOEMA follow-up study of red 1.5–2.0 dropouts in JWST PEARLS-IDF, showing that sub-mm follow-up is highly efficient at unveiling their true nature. Their FIR continuum emission is detected at a signal-to-noise ration of S/N in our the 236, 252 GHz observations, with typical values of . Our SED modelling shows that such a faint continuum in the mm-regime unambiguously argues against an ultra-high-redshift () nature (Fig. 5 and Appendix A). Instead, the 1.5–2.0 breaks and red JWST colours are shown to select massive, star-forming, and dust-obscured galaxies at , extending the main sequence of SMGs and optically faint galaxies. These objects contribute a non-negligible fraction of the CSFRD at (), as found in previous studies specifically targeting optically faint ‘HST-dark’ or DSFGs galaxies. This demonstrates the efficiency of combining mm continuum observations with infrared imaging in a limited number of JWST filters to probe obscured star-formation beyond cosmic noon.
This work show specific cases where a simple break selection is prone to select optically faint galaxies instead of ultra-high-redshift galaxies when no further criteria on the UV slopes of star-formation rate histories have been applied. Fortunately, we have demonstrated that red objects can be robustly identified with observations of their rest-frame FIR (see also Zavala et al., 2023). The expected peak FIR continuum of (and the characteristic continuum slope; see Fig. 5) can be detected at in min of on-source time with ALMA (NOEMA), representing a highly efficient alternative to spectroscopic follow-up with JWST. We note that this is a different situation to previous works focusing on JWST high-redshift objects with blue colours. There, expensive redshift looking for rest-frame FIR emission lines must be conducted as the continuum is likely too faint to be detected and does not significantly constrain the redshift of the galaxy (e.g. Kaasinen et al., 2023; Bakx et al., 2023; Popping, 2023; Fujimoto et al., 2023).
We have also demonstrated that the use of bluer templates at higher redshift, such as those made recently available with EAZY (blue_sfhz_13), improve the photo-z selection and characterisation of red dropouts in the absence of observations in the mm regime. However, we note that these templates find a non-negligible high-redshift probability for the two F150W dropouts (e.g. and , see Fig. 2). Similarly, Prospector is found to prefer lower-redshift galaxies even in the absence of FIR constraints. Yet it also gives broad posterior redshift distributions, which allow for a solution, even when including our NOEMA constraints. Whilst some studies have already rejected such objects with a substantial low-redshift probability from samples with a variety of additional criteria (e.g. Finkelstein et al., 2023a, b; Harikane et al., 2023), further tests of these templates and redshift priors with statistical samples of spectroscopically-confirmed red JWST-only galaxies are still necessary to improve the robustness of photometric redshifts. Another unexplored avenue is the use of morphology priors, as in the case of the red objects studied in this work or those in Nelson et al. (2023), for instance, which have elongated or disky morphologies; these are evidently in stark contrast with the almost point-like sources confirmed so far. Finally, for surveys with a large enough field of view, a CSFRD prior could be imposed to guide the ensemble prediction for all galaxies in the field (see more in the appendix ).
In summary, distinguishing obscured star-forming galaxies from ultra-high-redshift galaxies with sparse JWST wavelength coverage is difficult when using standard SED codes (templates), although dedicated templates and/or appropriate priors could improve some of the photometric redshifts. However, follow-up (sub-)mm observations of the FIR continuum provide a highly efficient way to determine the nature of high-redshift dusty star-forming galaxies.
Acknowledgements.
The authors thank the anonymous referee for comments and suggestions which improved this Letter. RAM thanks the IRAM support staff and in particular J. Orkisz for the observations and data reduction. RAM, LAB, FW acknowledge support from the ERC Advanced Grant 740246 (Cosmic_Gas). RAM, PO acknowledge support from the Swiss National Science Foundation (SNSF) through project grant 200020_207349.This work is based on observations carried out under project number W22EG with the IRAM NOEMA Interferometer. IRAM is supported by INSU/CNRS (France), MPG (Germany) and IGN (Spain).
This work made use of the following Python packages: numpy (Harris et al., 2020), matplotlib (Hunter, 2007), scipy (Virtanen et al., 2020), Astropy (Astropy Collaboration et al., 2013, 2018, 2022), interferopy (Boogaard, Meyer, & Novak, 2021), BAGPIPES (Carnall et al., 2018) , EAZY Brammer et al. (2012), CIGALE Boquien et al. (2019), and PROSPECTOR Johnson et al. (2021).
References
- Adams et al. (2022) Adams, N. J., Conselice, C. J., Ferreira, L., et al. 2022, Monthly Notices of the Royal Astronomical Society, 518, 4755
- Alcalde Pampliega et al. (2019) Alcalde Pampliega, B., Pérez-González, P. G., Barro, G., et al. 2019, The Astrophysical Journal, 876, 135
- Arrabal Haro et al. (2023a) Arrabal Haro, P., Dickinson, M., Finkelstein, S. L., et al. 2023a, The Astrophysical Journal Letters, 951, L22
- Arrabal Haro et al. (2023b) Arrabal Haro, P., Dickinson, M., Finkelstein, S. L., et al. 2023b, Nature, 622, 707
- Astropy Collaboration et al. (2022) Astropy Collaboration, Price-Whelan, A. M., Lim, P. L., et al. 2022, ApJ, 935, 167
- Astropy Collaboration et al. (2018) Astropy Collaboration, Price-Whelan, A. M., Sipőcz, B. M., et al. 2018, AJ, 156, 123
- Astropy Collaboration et al. (2013) Astropy Collaboration, Robitaille, T. P., Tollerud, E. J., et al. 2013, A&A, 558, A33
- Bakx et al. (2023) Bakx, T. J. L. C., Zavala, J. A., Mitsuhashi, I., et al. 2023, MNRAS, 519, 5076
- Barger & Cowie (2023) Barger, A. J. & Cowie, L. L. 2023, ApJ, 956, 95
- Barger et al. (2012) Barger, A. J., Wang, W. H., Cowie, L. L., et al. 2012, ApJ, 761, 89
- Barrufet et al. (2023) Barrufet, L., Oesch, P. A., Weibel, A., et al. 2023, Monthly Notices of the Royal Astronomical Society, 522, 449
- Blain et al. (1999) Blain, A. W., Smail, I., Ivison, R. J., & Kneib, J. P. 1999, MNRAS, 302, 632
- Boogaard et al. (2021) Boogaard, L., Meyer, R. A., & Novak, M. 2021, Interferopy: analysing datacubes from radio-to-submm observations, 10.5281/ZENODO.5775603
- Boquien et al. (2019) Boquien, M., Burgarella, D., Roehlly, Y., et al. 2019, Astronomy & Astrophysics, 622, A103
- Bouwens et al. (2023) Bouwens, R. J., Stefanon, M., Brammer, G., et al. 2023, Monthly Notices of the Royal Astronomical Society, 523, 1036
- Brammer et al. (2012) Brammer, G. B., van Dokkum, P. G., Franx, M., et al. 2012, The Astrophysical Journal Supplement Series, 200, 13
- Bruzual & Charlot (2003) Bruzual, G. & Charlot, S. 2003, Monthly Notices of the Royal Astronomical Society, 344, 1000
- Bunker et al. (2023) Bunker, A. J., Cameron, A. J., Curtis-Lake, E., et al. 2023
- Bunker et al. (2023) Bunker, A. J., Saxena, A., Cameron, A. J., et al. 2023, A&A, 677, A88
- Calzetti et al. (2000) Calzetti, D., Armus, L., Bohlin, R. C., et al. 2000, The Astrophysical Journal, 533, 682
- Carnall et al. (2018) Carnall, A. C., McLure, R. J., Dunlop, J. S., & Davé, R. 2018, Monthly Notices of the Royal Astronomical Society, 480, 4379
- Casey et al. (2018) Casey, C. M., Hodge, J., Zavala, J. A., et al. 2018, The Astrophysical Journal, 862, 78
- Casey et al. (2014) Casey, C. M., Narayanan, D., & Cooray, A. 2014, Physics Reports, 541, 45
- Chabrier (2003) Chabrier, G. 2003, Publications of the Astronomical Society of the Pacific, 115, 763
- Chapman et al. (2005) Chapman, S. C., Blain, A. W., Smail, I., & Ivison, R. J. 2005, ApJ, 622, 772
- Curtis-Lake et al. (2023) Curtis-Lake, E., Carniani, S., Cameron, A., et al. 2023, Nature Astronomy 2023 7:5, 7, 622
- Donnan et al. (2022) Donnan, C. T., McLeod, D. J., Dunlop, J. S., et al. 2022, Monthly Notices of the Royal Astronomical Society, 518, 6011
- Dudzevičiūtė et al. (2020) Dudzevičiūtė, U., Smail, I., Swinbank, A. M., et al. 2020, MNRAS, 494, 3828
- Elbaz et al. (2011) Elbaz, D., Dickinson, M., Hwang, H. S., et al. 2011, A&A, 533, 119
- Finkelstein et al. (2023a) Finkelstein, S. L., Bagley, M. B., Ferguson, H. C., et al. 2023a, ApJ, 946, L13
- Finkelstein et al. (2022) Finkelstein, S. L., Bagley, M. B., Haro, P. A., et al. 2022, The Astrophysical Journal Letters, 940, L55
- Finkelstein et al. (2023b) Finkelstein, S. L., Leung, G. C. K., Bagley, M. B., et al. 2023b, arXiv e-prints, arXiv:2311.04279
- Fudamoto et al. (2020) Fudamoto, Y., Oesch, P. A., Faisst, A., et al. 2020, Astronomy & Astrophysics, 643, A4
- Fujimoto et al. (2023) Fujimoto, S., Finkelstein, S. L., Burgarella, D., et al. 2023, ApJ, 955, 130
- Harikane et al. (2023) Harikane, Y., Nakajima, K., Ouchi, M., et al. 2023, arXiv e-prints, arXiv:2304.06658
- Harikane et al. (2023) Harikane, Y., Ouchi, M., Oguri, M., et al. 2023, The Astrophysical Journal Supplement Series, 265, 5
- Harris et al. (2020) Harris, C. R., Millman, K. J., van der Walt, S. J., et al. 2020, Nature, 585, 357
- Hunter (2007) Hunter, J. D. 2007, Computing in Science and Engineering, 9, 90
- Johnson et al. (2021) Johnson, B. D., Leja, J., Conroy, C., & Speagle, J. S. 2021, The Astrophysical Journal Supplement Series, 254, 22
- Kaasinen et al. (2023) Kaasinen, M., van Marrewijk, J., Popping, G., et al. 2023, A&A, 671, A29
- Kennicutt & Evans (2012) Kennicutt, R. C. & Evans, N. J. 2012, Annual Review of Astronomy and Astrophysics, 50, 531
- Kroupa (2001) Kroupa, P. 2001, MNRAS, 322, 231
- Larson et al. (2023) Larson, R. L., Hutchison, T. A., Bagley, M., et al. 2023, ApJ, 958, 141
- Madau & Dickinson (2014) Madau, P. & Dickinson, M. 2014, Annual Review of Astronomy and Astrophysics, 52, 415
- Naidu et al. (2022) Naidu, R. P., Oesch, P. A., Setton, D. J., et al. 2022, arXiv e-prints, arXiv:2208.02794
- Naidu et al. (2022) Naidu, R. P., Oesch, P. A., van Dokkum, P., et al. 2022, The Astrophysical Journal Letters, 940, L14
- Nelson et al. (2023) Nelson, E. J., Suess, K. A., Bezanson, R., et al. 2023, ApJ, 948, L18
- Oke (1974) Oke, J. B. 1974, The Astrophysical Journal Supplement Series, 27, 21
- Popping (2023) Popping, G. 2023, A&A, 669, L8
- Pérez-González et al. (2023) Pérez-González, P. G., Barro, G., Annunziatella, M., et al. 2023, The Astrophysical Journal Letters, 946, L16
- Rieke et al. (2023) Rieke, M. J., Kelly, D. M., Misselt, K., et al. 2023, Publications of the Astronomical Society of the Pacific, 135, 028001
- Rodighiero et al. (2022) Rodighiero, G., Bisigello, L., Iani, E., et al. 2022, Monthly Notices of the Royal Astronomical Society: Letters, 518, L19
- Schreiber et al. (2015) Schreiber, C., Pannella, M., Elbaz, D., et al. 2015, Astronomy & Astrophysics, 575, A74
- Shu et al. (2022) Shu, X., Yang, L., Liu, D., et al. 2022, ApJ, 926, 155
- Smail et al. (2023) Smail, I., Dudzevičiūtė, U., Gurwell, M., et al. 2023, ApJ, 958, 36
- Smail et al. (2002) Smail, I., Ivison, R. J., Blain, A. W., & Kneib, J. P. 2002, MNRAS, 331, 495
- Stalevski et al. (2016) Stalevski, M., Ricci, C., Ueda, Y., et al. 2016, Monthly Notices of the Royal Astronomical Society, 458, 2288
- Swinbank et al. (2014) Swinbank, A. M., Simpson, J. M., Smail, I., et al. 2014, Monthly Notices of the Royal Astronomical Society, 438, 1267
- Tacchella et al. (2022) Tacchella, S., Johnson, B. D., Robertson, B. E., et al. 2022, MNRAS, 000, 1
- Virtanen et al. (2020) Virtanen, P., Gommers, R., Oliphant, T. E., et al. 2020, Nature Methods, 17, 261
- Wang et al. (2023) Wang, B., Leja, J., Bezanson, R., et al. 2023, The Astrophysical Journal Letters, 944, L58
- Wang et al. (2019) Wang, T., Schreiber, C., Elbaz, D., et al. 2019, Nature, 572, 211
- Williams et al. (2019) Williams, C. C., Labbe, I., Spilker, J., et al. 2019, ApJ, 884, 154
- Windhorst et al. (2023) Windhorst, R. A., Cohen, S. H., Jansen, R. A., et al. 2023, The Astronomical Journal, 165, 13
- Xiao et al. (2023) Xiao, M.-Y., Elbaz, D., Gómez-Guijarro, C., et al. 2023, Astronomy & Astrophysics, 672, A18
- Yan et al. (2023a) Yan, H., Cohen, S. H., Windhorst, R. A., et al. 2023a, The Astrophysical Journal Letters, 942, L8
- Yan et al. (2023b) Yan, H., Ma, Z., Ling, C., Cheng, C., & Huang, J.-S. 2023b, The Astrophysical Journal Letters, 942, L9
- Zavala et al. (2023) Zavala, J. A., Buat, V., Casey, C. M., et al. 2023, The Astrophysical Journal Letters, 943, L9
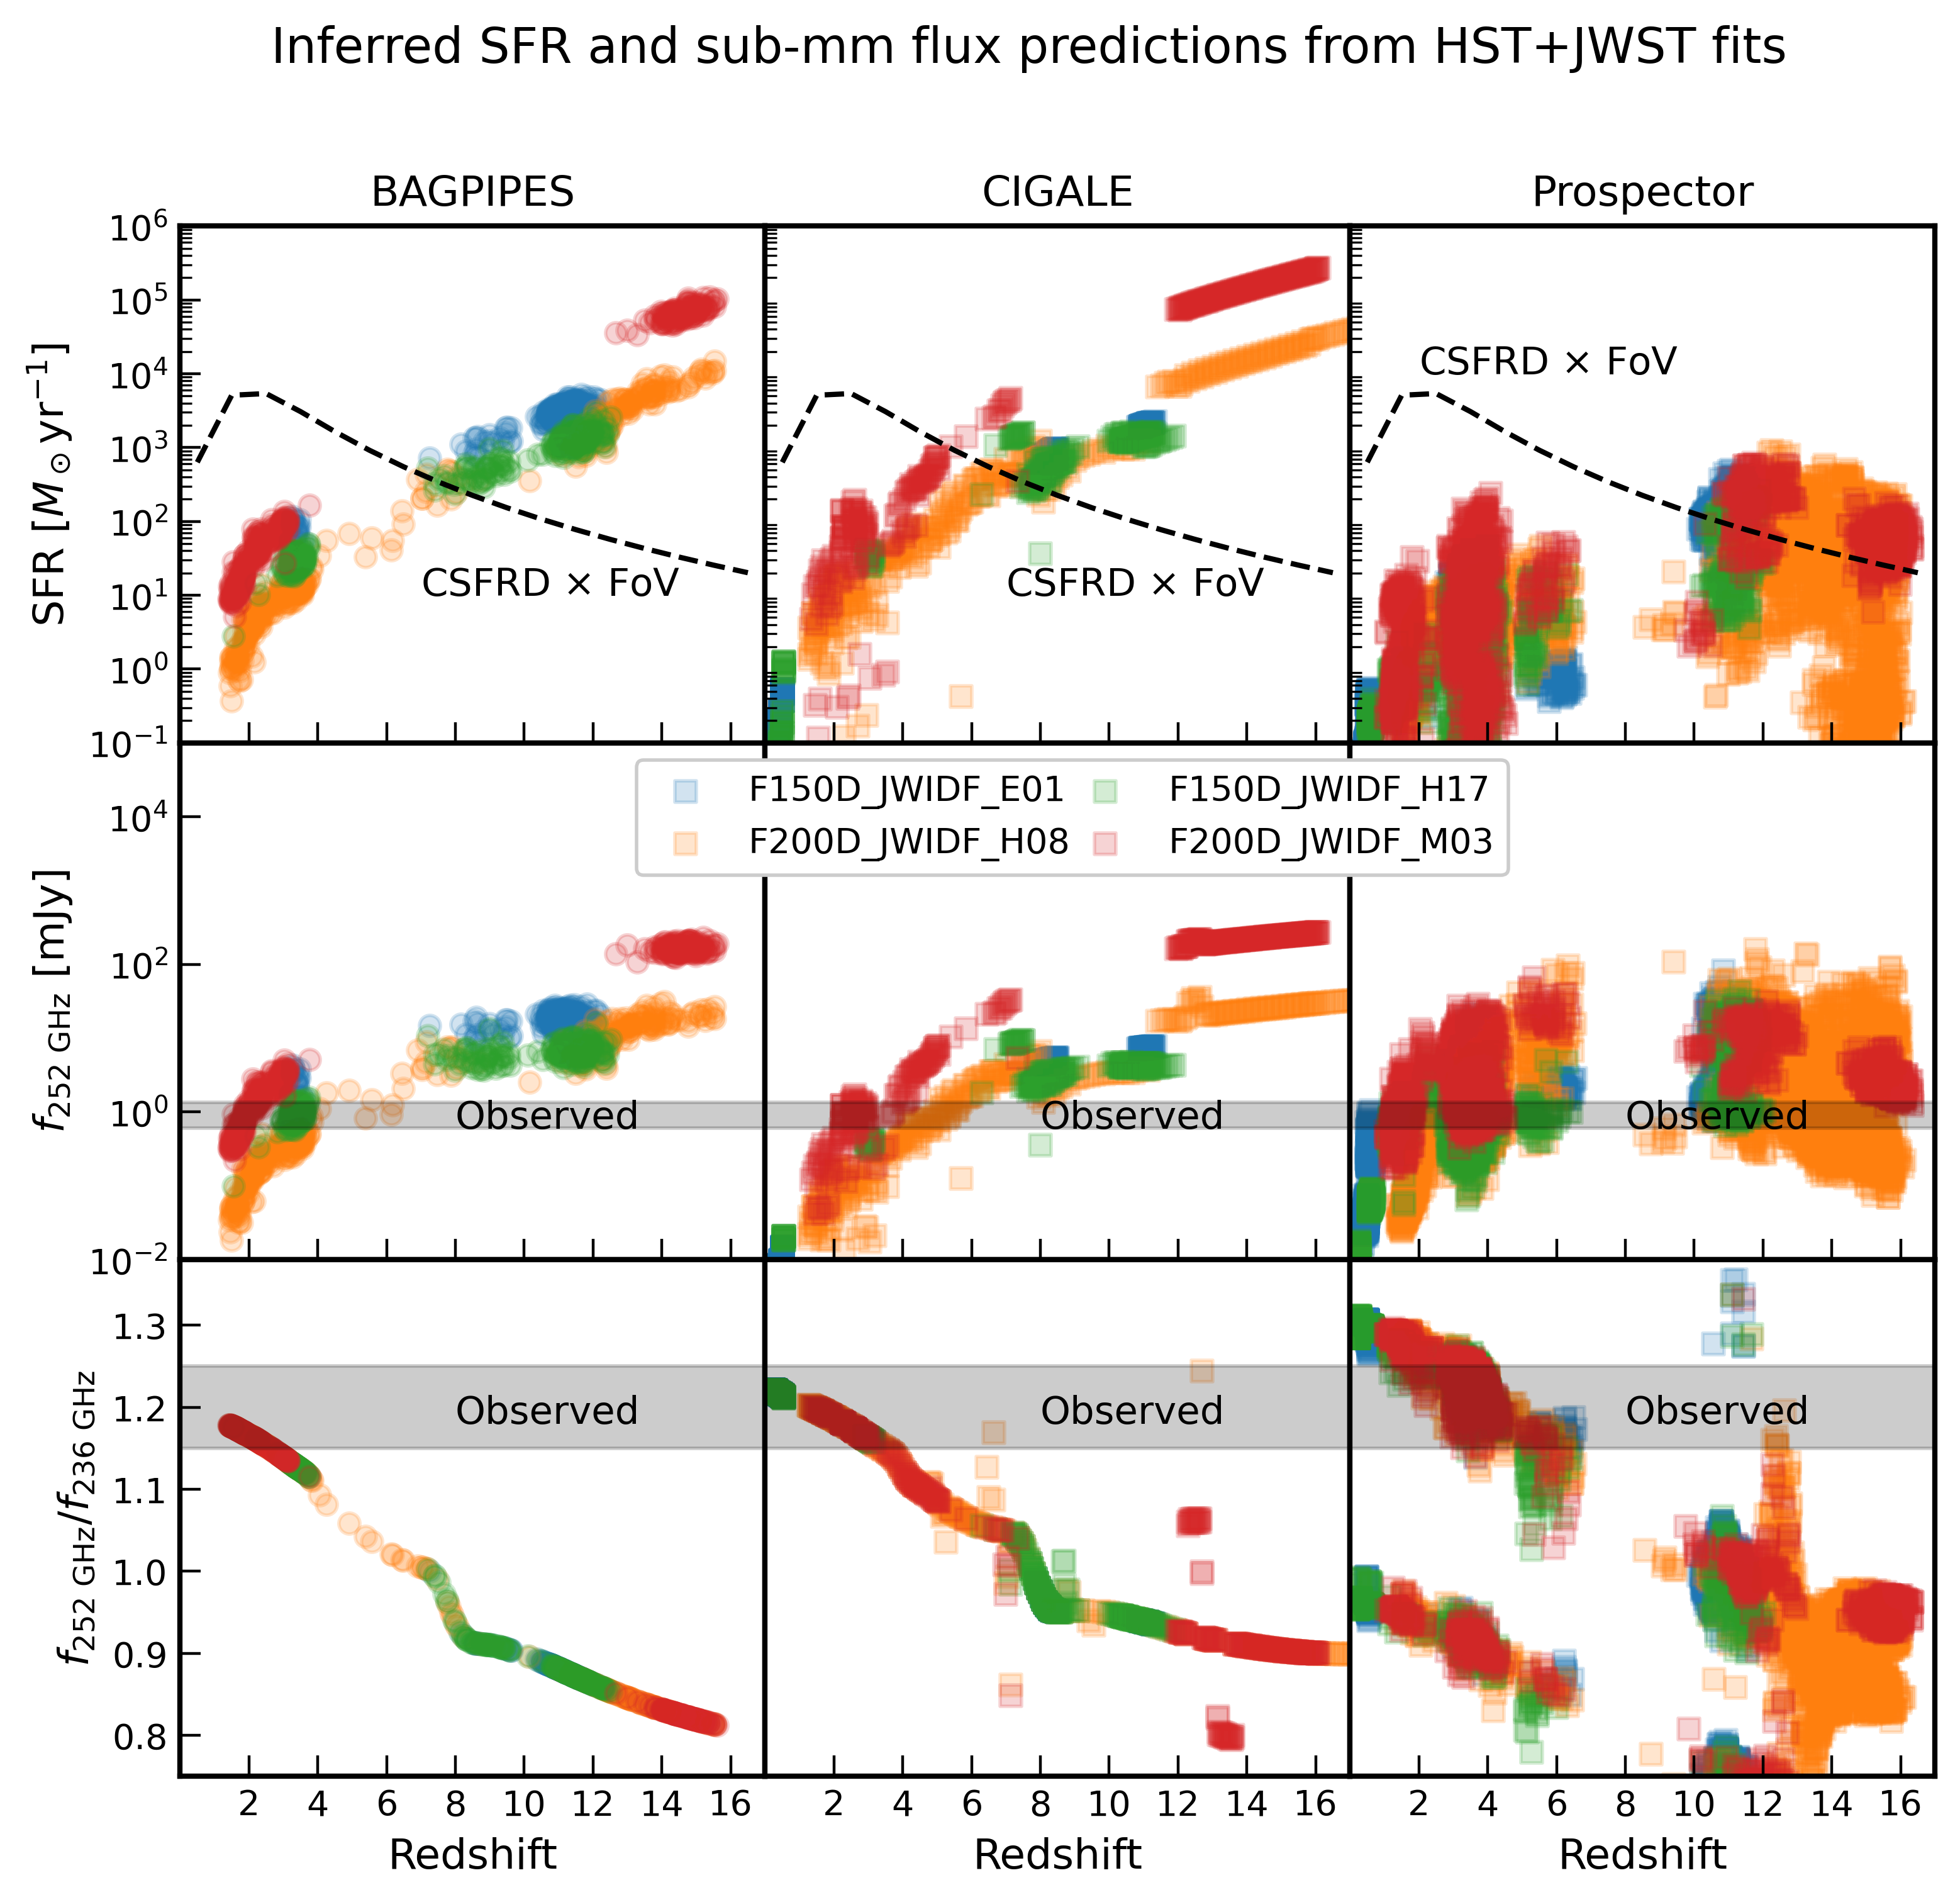
Appendix A Obscured SFR and rest-frame FIR SED predictions from JWST-only photometry
In this appendix, we explore the low-, intermediate-, and high-redshift solutions of BAGPIPES, CIGALE and Prospector fitted only to the HST and JWST photometry of the red objects considered in this work. In particular, we show in Fig. 1, the predictions for the rest-frame FIR continuum fluxes and the SFR implied by the red JWST slopes as a function of redshift. For CIGALE and Prospector we show only the highest likelihood solutions, and for BAGPIPES we sampled the full posterior as it is quite compact in parameter space. We find that for all SED codes, the inferred SFR and observed sub-mm fluxes increase strongly as a function of redshift. In fact, the inferred SFR are in tension with the extrapolated CSFRD at . This suggests that CSFRD priors could be used for large samples of JWST objects in wide fields to refine photometric redshifts. For BAGPIPES and CIGALE, the NOEMA fluxes are predicted to rise by two or three orders of magnitudes, between and , with relatively small scatter at any redshift (factor ). The NOEMA flux ratio between the two sidebands of a single Polyfix tuning () evolves quasi-linearly with redshift, reflecting the simple dust continuum emission model. The situation is more nuanced with Prospector, where more complex dust modelling leads to a larger scatter in the SFR and predicted dust continuum emission, albeit with the same redshift trends. Therefore, we conclude that ALMA/NOEMA should identify red candidates with in min. For objects with blue rest-frame UV colours, the situation is different as the presence of strong continuum dust emission is not expected (e.g. Kaasinen et al., 2023; Bakx et al., 2023; Popping, 2023; Fujimoto et al., 2023).