These authors contributed equally to this work.
These authors contributed equally to this work.
These authors contributed equally to this work.
[1,2]\fnmPasquale \surScarlino
1]\orgdivHybrid Quantum Circuit Laboratory, Institute of Physics and Center for Quantum Science and Engineering, \orgnameÉcole Polytéchnique Fédérale de Lausanne (EPFL), \orgaddress\cityLausanne, \postcode1015, \countrySwitzerland 2]\orgdivCenter for Quantum Science and Engineering, \orgnameÉcole Polytéchnique Fédérale de Lausanne (EPFL), \orgaddress\cityLausanne, \postcode1015, \countrySwitzerland 3]\orgdivDepartment of Physics, \orgnameUniversity of Basel, \orgaddress\streetKlingelbergstrasse 82, \cityBasel, \postcode4056, \countrySwitzerland
4]\orgnameInstitute of Science and Technology Austria, \orgaddress\streetAm Campus 1, \cityKlosterneuburg, \postcode3400, \countryAustria
5]\orgdivL-NESS, Physics Department, \orgnamePolitecnico di Milano, \orgaddress\streetvia Anzani 42, \cityComo, \postcode22100, \countryItaly
Strong hole-photon coupling in planar Ge: probing the charge degree and Wigner molecule states
Abstract
Semiconductor quantum dots (QDs) in planar germanium (Ge) heterostructures have emerged as front-runners for future hole-based quantum processors. Notably, the large spin-orbit interaction of holes offers rapid, coherent electrical control of spin states, which can be further beneficial for interfacing hole spins to microwave photons in superconducting circuits via coherent charge-photon coupling. Here, we present strong coupling between a hole charge qubit, defined in a double quantum dot (DQD) in a planar Ge, and microwave photons in a high-impedance () superconducting quantum interference device (SQUID) array resonator. Our investigation reveals vacuum-Rabi splittings with coupling strengths up to , and a cooperativity of , dependent on DQD tuning, confirming the strong charge-photon coupling regime within planar Ge. Furthermore, utilizing the frequency tunability of our resonator, we explore the quenched energy splitting associated with strongly-correlated Wigner molecule (WM) states that emerge in Ge QDs. The observed enhanced coherence of the WM excited state signals the presence of distinct symmetries within related spin functions, serving as a precursor to the strong coupling between photons and spin-charge hybrid qubits in planar Ge. This work paves the way towards coherent quantum connections between remote hole qubits in planar Ge, required to scale up hole-based quantum processors.
keywords:
Strong charge-photon coupling, Hole qubit, Quantum dot, cQED, Ge/SiGe heterostructure, Wigner molecule1 Introduction
Semiconductor quantum dots (QDs) represent a promising platform for advanced quantum information processing [1, 2, 3]. Particularly, hole confinement in QDs enables rapid electric spin manipulation due to a large spin-orbit interaction [4, 5, 6, 7, 8]. QD-based hole qubit systems have been implemented in various platforms including fin field-effect transistors (finFETs) [9, 10] , Ge/Si core/shell nanowires [11, 5], and planar Ge/SiGe heterostructures [12, 4, 13]. Among these, planar Ge stand out due to its exceptional characteristics [6], including high hole mobility ( [14]), low charge noise [15], and a low effective mass [16]. Furthermore, nuclear isotope purification can be performed, effectively mitigating magnetic field noise and enhancing the qubit coherence [6]. Building on all these advantages, recent works have demonstrated, coherent single- and two-qubit operations [4, 13], scalable multi-qubit array architecture [12, 17], and coherent spin shuttling [18] in planar Ge.
In the context of circuit quantum electrodynamics (cQED), the hybridization of microwave photons in superconducting cavities with QD-based qubits holds enormous potential for various applications [19, 20, 21, 22] . However, achieving strong light-matter coupling is a fundamental requirement for these endeavors. While several previous experiments have successfully demonstrated strong coupling for electrons hosted in Si [23, 24], GaAs [25, 26], InAs nanowires [27], and in holes silicon finFETs [28], the strong coupling of holes in planar Ge has remained elusive [29, 30].
Previous hybrid cQED experiments primarily focused on resonator interacting with the ground and first excited states of double-dot (DQD) charge- or spin-two level systems. In fact, in typical QD structures, additional single-dot orbital states usually lie at energies higher than GHz, making them inaccessible to microwave resonators [31]. However, low excitation energies can arise from Coulomb-interaction-induced redistribution of multiple charges confined in a single QD, leading to the formation of strongly correlated Wigner molecule (WM) states [32]. These states, facilitated by anisotropic QD confinement, result in energy gaps below 10 GHz and have been observed in GaAs [33, 34], Si [35], and carbon nanotube [36] QDs.
Wigner molecularization has profound implications for quantum information processing, offering an encoding for spin-charge hybrid qubits [37, 34]. If not properly controlled, it can significantly reduce the fidelity of conventional readout schemes in spin qubits [38]. In Ge, WMs enable anomalous splittings of spin energy levels without the need for magnetic fields [39]. These findings also suggest that WMs could serve as a valuable interface between QD qubits and superconducting circuits in hybrid architectures.
In this study, we establish strong coupling between a microwave photon and a DQD-based hole charge qubit in a planar Ge/SiGe heterostructure, using a high-impedance frequency-tunable resonator based on superconducting quantum interference devices (SQUID) [26]. We explore different DQD configurations and achieve a charge-photon vacuum-Rabi splitting (charge decoherence rate) up to MHz (down to MHz). We estimate a system cooperativity of , among the highest reported for QDs charge-resonator hybrid systems to date [25]. Our device geometry facilitates formation of WMs in Ge, unveiling a quenched energy spectrum of WM states in the DQD. Leveraging the frequency tunability of the SQUID array resonator, we perform resonant energy spectroscopy of WM states in the DQD and extract their energy spectra. By exploring several pairs of adjacent inter-dot configurations, we observe selective coupling to the resonator based on the parity of the DQD hole number and enhanced coherence rates for certain excited WM states, which we attribute to states with a different spin structure [40, 34].
2 Architecture for hybrid circuit QED with holes in planar Ge
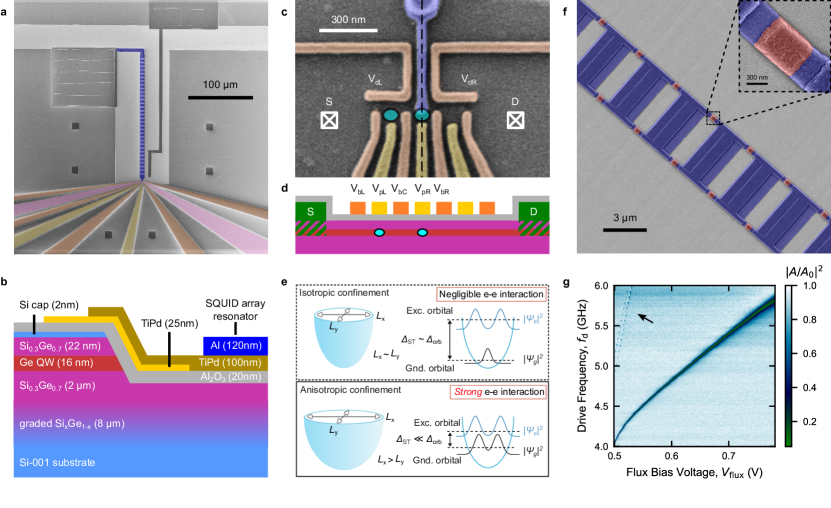
Fig. 1a shows the hybrid superconductor-semiconductor device fabricated on a Ge/SiGe heterostructure [42]. As shown in Fig. 1b, the 16 nm Ge quantum well (QW), hosting the 2-dimensional hole gas (2DHG), is 24 nm below the surface. A conductive channel, defined by selectively etching the Ge QW, hosts a DQD (cyan ellipses in Figs. 1c, d) defined by metallic gate electrodes. The gate layout of our device supports relatively large QDs (diameter 100 nm). Since the Coulomb interactions significantly exceed the single-particle orbital energy resulting from confinement, we anticipate a decreased singlet-triplet energy gap [32], as illustrated in Fig. 1e. This Coulomb interaction fosters the emergence of Wigner molecule (WM) states, even in the presence of a slight anisotropy in the QD (see Supplementary Note S4) [38].
The right dot is coupled to the superconducting resonator (Fig. 1f) via the violet electrode in Fig. 1c (see Supplemenatary Note S1) [26]. This is designed to maximize the capacitive coupling by completely overlapping one QD and, therefore, to efficiently couple to the DQD via transverse charge-photon interaction [26, 25, 23]. The resonator consists of an array of N = 32 SQUIDs (Fig. 1f) with an inductance of nH/SQUID, resulting in an equivalent lumped impedance of [26]. The high-impedance resonator enhances the qubit-photon coupling strength by maximizing the vacuum voltage fluctuation , according to the relation , with the resonator differential lever arm [28]. The resonator is also capacitively coupled to a 50 waveguide (the photon feedline) on one side, and grounded on the other end, forming a hanged quarter-wave resonator (Fig. 1a) [26]. We probe the microwave response of the hybrid system recording the feedline transmission () at powers corresponding to less than one photon on average in the resonator (see Supplementary Note S2). By exploiting the external magnetic flux dependence of the critical current of the SQUIDs [43] (see Supplementary Note S1), the resonator frequency can be tuned from GHz to well below 4 GHz (see Fig. 1g).
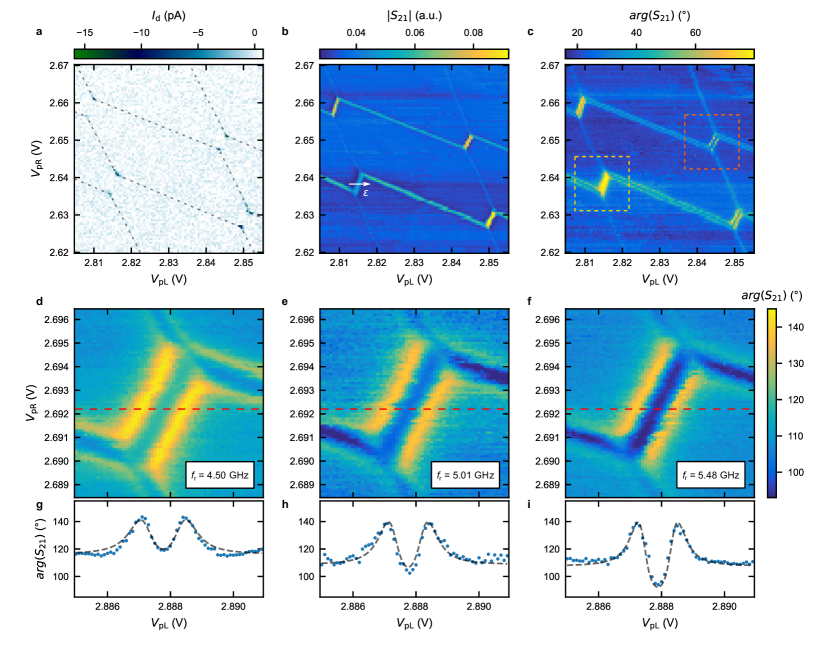
Fig. 2a shows a region of the DQD stability diagram spanned by and , measured by probing the dc current through the DQD [45]. To characterize the charge-photon coupling, we simultaneously monitor the feedline transmission at the frequency GHz (see Figs. 2b, c). While the dc transport measurement, for the explored configuration, only exhibits the DQD triple points [45], the resonator response reveals not only the inter-dot transitions, but also the QD-reservoir ones, facilitating an extensive characterization of the QD devices. Extended Data Figure 1 reports a zoom-out of the charge stability diagram shown in Fig. 2a - c.
Close to an inter-dot transition, the DQD system can be approximated by a simplified charge qubit Hamiltonian, given by with corresponding eigenenergies . Here, represents the Pauli operator [26] and () is the DQD energy detuning (tunnel coupling). The transverse charge-photon interaction , with denoting the effective charge-photon coupling strength, hybridizes the qubit with the resonator (see Supplementary Note S3). As a result, the phase of the feedline transmission (Fig. 2c) exhibits a different response depending on whether the qubit energy is higher (yellow dashed box) or lower (orange dashed box) than the bare resonator energy.
While tuning the qubit frequency, , to be close to () is essential to ensure a significant dispersive resonator response, it can be challenging depending on the DQD gate layout [28]. The tunable resonator presented here offers an additional means to efficiently investigate the qubits by varying across . In Figs. 2d - f we record the phase of the feedline transmission to reconstruct the DQD stability diagram for the same inter-dot transition at three different values of : lower than (Fig. 2d), resonant with (Fig. 2e) and higher than (Fig. 2f) GHz. Line-cuts along the inter-dot transition (Fig. 2g - i) are simultaneously fitted to a master equation model (black dashed lines in Fig. 2g - i), extracting a common tunnel coupling of GHz, qubit decoherence MHz, and charge-photon coupling strengths MHz (see Methods). To quantify the quality of the DQD-resonator interface, we evaluate the ratio between the coupling and the decoherence rates, by computing the cooperativity [46]. Using MHz, extracted from a bare resonator fit at 5 GHz, along with the aforementioned parameters, we estimate 1, indicating the possibility to observe strong coupling.
3 Strong hole charge-photon coupling
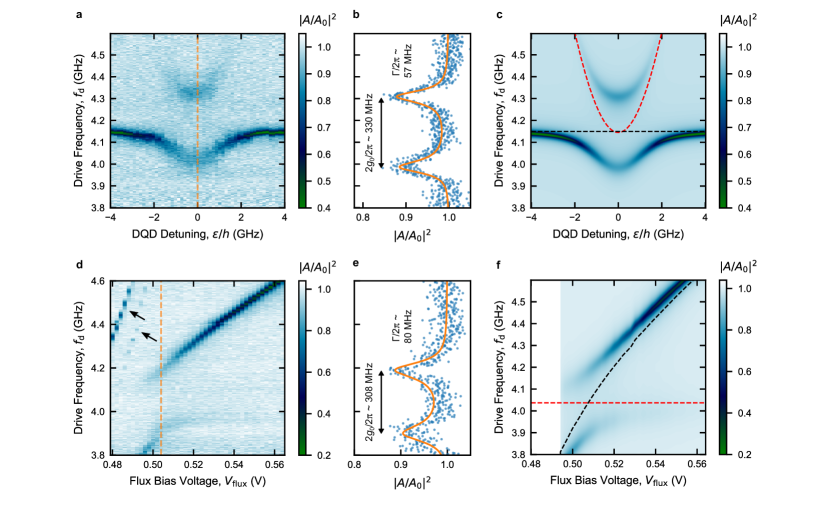
We now probe the charge-photon interaction at (sweet spot), where the electric dipole moment of the holes in the DQD is maximal. Fig. 3a shows the normalized feedline transmission amplitude as a function of and with changed to cross an inter-dot transition (as depicted by the white arrow in Fig. 2b ). Near , the two subsystems maximally hybridize, resulting in a vacuum-Rabi mode splitting of [23, 26], represented by the line-cut in Fig. 3b along the orange dashed line in Fig. 3a. By fitting to the master equation model (solid line in Fig. 3b, see Methods), we find: MHz. The simulated feedline transmission, based on these parameters, closely matches the experimental data (see Fig. 3c). This results in a cooperativity of (with MHz), which highlights the strong charge-photon coupling in planar Ge.
In Extended Data Figure 2a, we explore an alternative DQD charge transition, which features an enhanced . Fitting the line-cut in Extended Data Figure 2b to the master equation model, we extract parameters MHz, and calculate a cooperativity of (with MHz). Here, the high MHz, enabled by the high-impedance SQUID array resonator, allows us to achieve the strong coupling regime, even with a substantial qubit decoherence rate . We speculate that the difference between the values of and extracted from the two datasets in Figs. 3a - c and Extended Data Figure 2 may arise from distinct effective electric dipole moments associated with the two DQD electrostatic configurations [25]. To account for the frequency dependence of the coupling strength between the resonator and DQD, we calculate the resonator’s differential lever arm = in the two configurations. We find values of 0.18 and 0.25 eV/V (see Methods), respectively, indicating a higher coupling of the resonator to the detuning degree of freedom in the second case, albeit at the cost of a larger [25].
Our resonator’s frequency tunability offers a convenient way to investigate vacuum-Rabi splitting while keeping the DQD electrostatic configuration constant. In Fig. 3d, we examine the same DQD charge transition as in Fig. 3a, recording (for a fixed ) while varying the magnetic flux through the SQUID loops to tune from 3.8 to 4.6 GHz. This allows us to reach the resonant condition between the DQD two-level system and the resonator, while keeping the DQD gate voltages unchanged. The line-cut at the resonant point, taken along the orange dashed line in Fig. 3d, reported in Fig. 3e, reveals the vacuum-Rabi mode splitting of the DQD-resonator hybridized system. Fitting this line-cut to the master equation model, we find the parameters MHz, corresponding to a cooperativity (with MHz). The extracted system parameters obtained from the different measurements are summarized in Extended Data Table 1.
4 Tunable high-impedance resonator for qubit spectroscopy
We leverage the resonator frequency tunability to conduct resonant energy spectroscopy of the DQD charge qubit, in the same DQD configuration as in Fig. 3d, and keeping the DQD at a fixed [26]. This spectroscopy aims to reconstruct the qubit’s energy dispersion. In contrast to the measurements in Fig. 3, where , here we extend our investigation also to higher resonator frequencies, .
In Fig. 4a, we present the measured normalized feedline transmission as a function of and for three different values of , as indicated by dashed lines in the bottom panel of Fig. 4c. The schematics in Fig. 4c illustrate the charge qubit energy level diagram (top panel) and the excitation energy spectrum (bottom panel) along . Notably, clear avoided crossings are observed in Fig. 4a when the charge qubit gets in resonance with the resonator (). Additional details on the charge qubit spectroscopy are available in Extended Data Figure 3.
These spectroscopy measurements also provide valuable insights into the evolution of the effective charge-photon coupling strength , as a function of the DQD detuning . By fitting all five datasets presented in Extended Data Figure 3a to the master equation model, we accurately reproduce the charge qubit-resonator hybridized spectra, as shown in Fig. 4b. From these spectra, we extract the renormalized charge-photon coupling strengths , and present them as a function of in Fig. 4d, alongside . Notably, while the evolution of does not exhibit a distinct trend within the measured frequency range, consistently decreases with increasing . This decrease corresponds to the anticipated quenching of the DQD electric dipole moment at finite detuning due to charge localization, resulting in , as indicated by the black dashed line in Fig. 4c [26].
5 Hybrid circuit QED with Wigner molecules
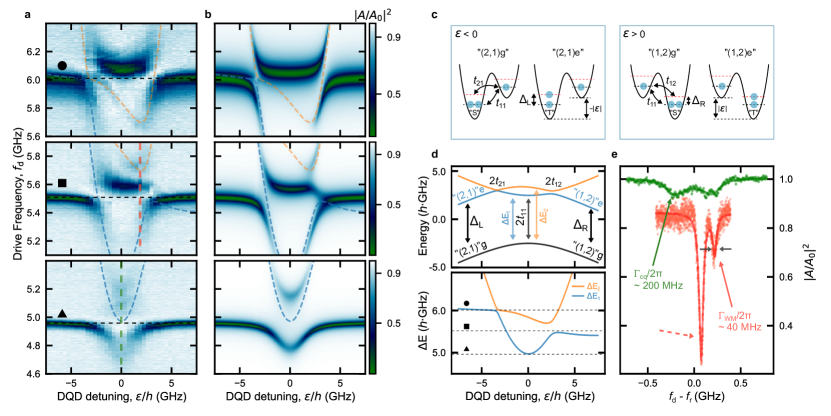
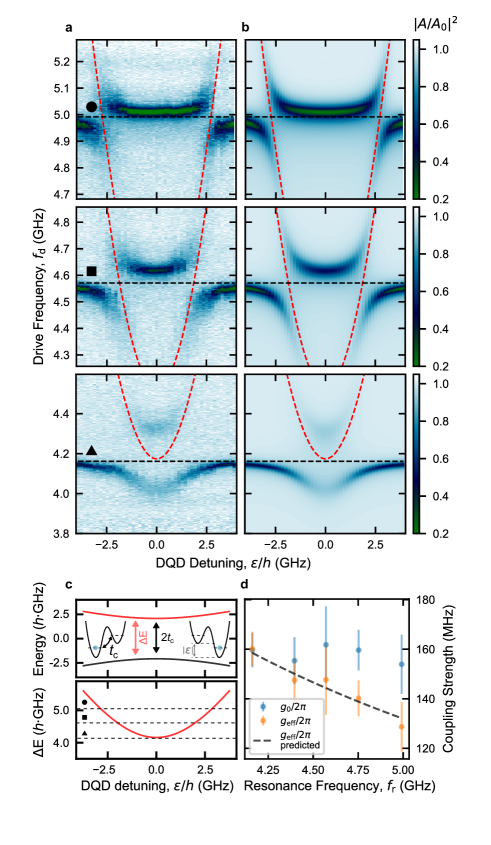
Strikingly, our investigation of multiple adjacent inter-dot transitions reveals that the conventional charge qubit-like spectroscopy, as illustrated in Fig. 4, featuring a single two-level system coupled to the resonator, fails to describe several cases. For instance, in Fig. 5a, we present three independent measurements of the normalized feedline transmission, as a function of and , obtained for the same DQD configuration but in correspondence to three different resonance frequencies (indicated by black dashed lines denoted by a black circle, square, and triangle). See Extended Data Figure 4 for more detailed spectroscopies. These measurements unveil unconventional features, including anomalous spectroscopy diagrams, asymmetric in , additional avoided crossings, and distinct spectroscopic lines that deviate significantly from the conventional model for a resonator hybridized with a two-level system and have not been previously documented.
The anomalous spectrum of these DQD configurations is captured by an extended model that includes an excited state in each QD, whose energy is close to . Specifically, we adopt a Hamiltonian similar to the one used in prior studies [47, 40], and numerically simulate the DQD spectrum and feedline transmission. Within an effective configuration (see Methods), the two holes in the left QD can occupy either the ground state, forming g”, or the exchange-split excited state, forming e” (Fig. 5c, ). We empirically determine the Hamiltonian parameters, including GHz ( GHz), i.e. the in the left (right) QD, that accurately reproduce both the energy and excitation spectra, reported respectively in the top and bottom panels of Fig. 5d. We also estimate the tunnel coupling strengths between the state of the left QD and the state of the right QD, . Furthermore, we use input-output theory to analyze the interaction between the resonator and the multi-level QD system, enabling us to accurately reproduce the spectrum of the hybridized system, as depicted in Fig. 5b (see Methods and Supplementary Note S5).
We note that the extracted values of are orders of magnitude smaller than the expected orbital energy gap ( GHz) based on the dimensions of our QDs. Instead, these extracted excitation energies are consistent with Wigner molecularization within each QD. To support this interpretation, in Supplementary Note S4 we present a preliminary model for WMs in planar Ge, which suggests that the small anisotropy in our QD confinement, in conjunction with electron-electron interactions, can result in WM states with GHz. Although a more comprehensive investigation based on full-configuration-interaction calculations is necessary to precisely characterize the energy scales within the DQD [35, 37], our preliminary analysis provides clear evidence that the observed features in Fig. 5a are related to WMs.
To bolster our assertion, we note that WM states exhibit a distinct spin structure, with the ground state supporting the anti-symmetric spin singlet, and the excited state corresponding to the symmetric spin triplet of the paired holes in a single QD [40, 33] (see Fig. 5c). This symmetry implies that the relaxation process from the upper energy branch to the ground state involves a spin-changing process which can be considerably slower compared to the bare charge relaxation processes [40, 33]. We explore this distinction in Fig. 5e, which presents two line-cuts along , marked by the red and green dashed lines in the middle and bottom panels of Fig. 5a. In comparison to the bare charge qubit decoherence rate MHz extracted from the fit to the master equation (green solid line in Fig. 5e), the second excited state spectrum (denoted by a red solid arrow in Fig. 5e) is characterized by a significantly narrower linewidth MHz (extracted from the fit to the Lorentzian), providing further evidence supporting the presence of WM states. This asymmetry in DQD-resonator spectroscopy, attributed to the formation of WM states with excitation energy very close to that of the resonator, has been detected across multiple inter-dot transitions. Extended Data Figure 5 reports another instance of a similar WM spectrum exhibiting MHz.
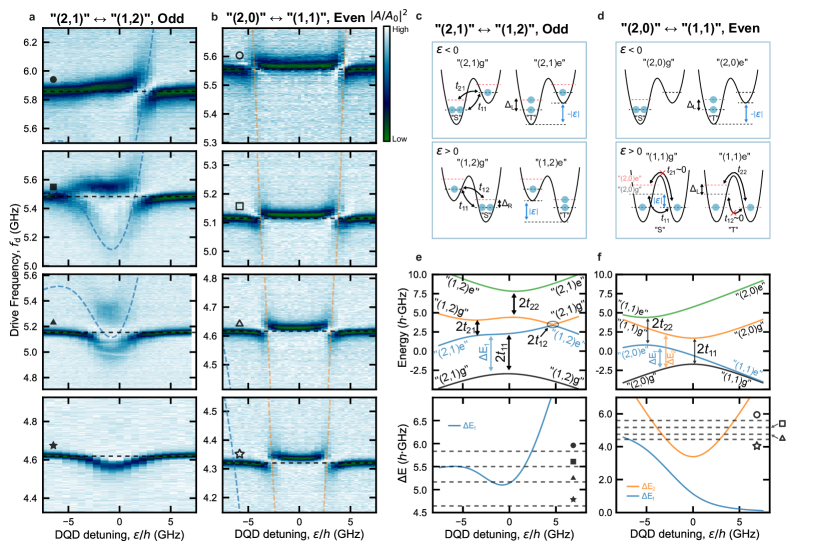
To further explore these unconventional DQD spectra in relation to the creation of WM, we delve into the expected dependence on the parity of hole number, distinguishing between even and odd DQD occupation. This distinction leads to different spin structures for the lowest two energy states. In Figs. 6a and b, we investigate two neighboring inter-dot transitions involving respectively effective charge configurations, and (see Supplementary Note S6 for the corresponding stability diagram).
In the configuration (Fig. 6a), characterized by an odd total number of holes, the ground and first excited states have the same spin quantum number. Consequently, finite tunneling rates exist between them () (see Figs.6c, e) [40]. This results in a finite exchange interaction between g” and e”, enabling their electrical coupling to the resonator, in accordance with the spin selection rule. To faithfully replicate both the energy and the excitation spectra, as shown in Fig. 6e, it is essential to assume a sizable tunnel coupling between different exchange-split states within the respective QDs () and a relatively small GHz.
In contrast, for the adjacent even configuration, denoted as ” (see Fig. 6b and 6d), with an additional hole in the right QD compared to the odd configuration, the total spin numbers of the ground (singlet) and first excited states (triplets) in the DQD are different. Consequently, a transition between these states requires magnetic interactions, such as spin-orbit coupling or g-factor anisotropies, both of which are negligible in our experimental setup ( 1 mT) [48, 42]. As a result, in modeling the even configuration, we set the tunneling rates , resulting in a negligible coupling of the ground-excited state transition to the resonator. Furthermore, in the configuration, the negligible exchange interaction, arising from the spatial separation of the holes (Fig. 6d), allows us to set in the model Hamiltonian. This leads to the energy level spectrum depicted in Fig. 6f. Consequently, Fig. 6b exhibits a conventional charge-qubit-like spectrum, corresponding to the charge transition between . We also demonstrate that the master equation model constructed using our extended effective Hamiltonians closely reproduces the measured spectra of the hybridized multi-level DQD-resonator system (Figs. 6a and b) for both odd and even configurations, as reported in Extended Data Figure 6. To further validate our model, we detect a potential indication of Pauli spin blockade [49] at the even inter-dot transition (see Supplementary Note S6), from which we extract GHz via bias spectroscopy. This value is consistent with the estimated GHz obtained from the master equation model of the spectra observed in Fig. 6a , further strengthening the evidence for the presence of Wigner molecule states in our DQD.
6 Conclusions
In this study, we have demonstrated the potential of a hybrid architecture combining a superconductor cavity with semiconductor QDs for advancing hole-based quantum information processing in planar germanium. Leveraging a high-impedance Josephson junction-based resonator with tunable frequency, we have demonstrated strong hole charge-photon coupling. This achievement is substantiated by our observation of charge-photon vacuum-Rabi mode splitting and the high cooperativity value () estimated for our hybrid system. Furthermore, the frequency tunability of our resonator has enabled us to successfully resolve strongly correlated Wigner molecule states within QDs in planar Ge structures. The distinct spin structure of the Wigner molecule spectrum leads to significantly reduced decoherence rates in higher excited levels, a promising development for establishing strong spin-photon coupling. The interaction between QD Wigner molecules and a frequency-tunable resonator provides an alternative avenue for exploring complex many-body electronic states in multi-level QDs. Our findings not only facilitate coherent photon coupling with spin-charge hybrid qubits but also support in-depth studies of strongly correlated electronic states in open systems. In conclusion, we have demonstrated the ability to coherently exchange a photon with holes in planar Ge, marking a critical step toward achieving long-distance spin-spin entanglement. Our work lays the foundation for future research on hole-photon coupling and long-range interactions of hole-based qubits, paving the way for the development of large-scale quantum processors.
ACKNOWLEDGEMENTS
The authors thank Simone Frasca, Vincent Jouanny, Guillaume Beaulieu, Camille Roy, Dominic Dahinden, Davide Lombardo, Daniel Chrastina and Siddhart Gautam for contributing in some cleanroom fabrication steps, the measurement setup, device simulations, data analysis and for the useful discussions.
P.S. acknowledges support from the SNSF through grant 200021_200418, and SERI through grant 101042765 / SEFRI MB22.00081. S.B, D.L and P.S acknowledge support from the NCCR Spin Qubit in Silicon (NCCR-SPIN) Grant No. 51NF40-180604. G.I. and S.C. acknowledge support from the Horizon Europe Project IGNITE ID 101070193. G.K. acknowledges support from the FWF via the P32235 and I05060 projects.
Contributions
F.D.P., F.O., W.J. and P.S. conceived the project.
F.D.P. and F.O. fabricated the device and built the experimental setup.
F.D.P., F.O. developed the fabrication recipe with inputs from M.J. and G.K..
F.D.P., F.O. and M.J. designed the hybrid device.
F.D.P., F.O. and W.J. performed the electrical measurements.
F.D.P., F.O. and W.J. analyzed the data.
W.J. and S.B. derived the theoretical model and simulated the Wigner molecule states.
G.I. and S.C. designed the SiGe heterostructure and performed the growth.
P.S., D.L. and G.K. initiated the project.
P.S., D.L. supervised the project.
F.D.P., F.O., W.J. and P.S. wrote the manuscript with inputs from the authors.
F.D.P., F.O., W.J. contributed equally to this work.
7 Methods
Device fabrication
The hybrid triple QD device is fabricated on a Ge/SiGe heterostructure grown by low-energy plasma-enhanced chemical vapor deposition (LEPECVD) using a forward grading technique (see Fig. 1b) [42]. The device fabrication is entirely carried out at the Center of MicroNano Technology (CMi) at EPFL. As a first step, 60 nm Pt markers and ohmic contacts are patterned by E-beam lithography (EBL), evaporation and lift-off. Immediately before the deposition, a 20 s diluted HF (1%) dip removes the native oxide in the opened regions to ensure a low resistive ohmic contact. The two-dimensional hole gas (2DHG) is self-accumulated in the 16 nm Ge quantum well (QW). Therefore, a 110 s reactive ion etching (RIE) etches 80-90 nm, leaving only a conductive channel from one ohmic contact to the other. The reacting plasma is SF6, CHF3 and O2 based and the mask is patterned via EBL. A 15 s buffered HF (BHF) dip etches away the native oxide immediately before the gate oxide deposition, a 20 nm atomic layer deposition (ALD) Al2O3. The deposition temperature is 300°C. Then, a 15 min rapid thermal annealing (RTA) in forming gases (N2/H2 5%) at 300°C decreases the channel sheet resistance to /sq. The single-layer gates are patterned in two steps by EBL, evaporation and lift-off. This ensures that the thin 3/22 nm Ti/Pd gates are patched on the etched step by 3/97 nm ones, routed out to the bonding pads. The superconducting part of the device is again patterned in two steps by EBL, evaporation and lift-off. First, the waveguide and the ground plane (120 nm of Al) and, lastly, the SQUID array resonator, following the conventional Dolan-bridge double angle evaporation method for Josephson Junctions (JJs). The bottom Al layer is 35 nm thick, whereas the top one 130 nm. The tunneling oxide barrier is grown by filling the chamber with O2 at a pressure of 2 Torr for 20 min (static oxidation) without breaking the vacuum. From measurements of the SQUID array resistance at room temperature, we estimate a critical current of about 522 nA per SQUID.
Fitting procedure for a conventional cavity-dressed charge qubit
The experimental data shown in this work reporting the feedline transmission are fitted to a master equation model (see Supplementary Note S3 for the full derivation) and normalized by a background trace to remove the standing wave pattern present in the feedline transmission. The background reference trace is obtained by tuning the resonance frequency of the resonator outside the frequency region of interest by making use of the superconducting coil and recording a high-power trace. The complex transmission of a resonator hanged to a 50 feedline and coupled to a charge qubit reads as:
| (1) |
where is the resonator-drive detuning, the total resonator linewidth given by both coupling to the waveguide and internal losses , the charge-photon coupling strength, the DQD detuning, the inter-dot tunneling coupling, the DQD susceptibility, the qubit-drive detuning and the charge qubit linewidth. , , , and are correction factors that take into account the non-ideal response of the cavity due to the environment. Further information is provided in Supplementary Note S3. The resonator parameters , and , as well as the environmental factors, are obtained by separately fitting for the bare uncoupled resonator.
The simultaneous fit of the line-cuts reported in Figs. 2g - i is performed using common fitting parameters for and , while letting to be different for the three datasets. In order to convert the voltage axis to DQD detuning , the differential lever arms and are extracted from Coulomb diamond and DQD charge stability diagram measurements. Here, () is the electrochemical potential of the left (right) QD, () is the lever arm for the left (right) plunger gate and () is the cross-lever arm for the left (right) plunger gate.
While Fig. 3b is a frequency line-cut of Fig. 3a at the resonance point, Fig. 3e is obtained from a separate measurement with higher resolution and integration time. The resonator parameters used for generating Fig. 3f were obtained from fitting the bare resonator as a function of the magnetic flux, similar to the measurement in Fig. 1g. Note that here, the lowest frequency of the measurement is 3.8 GHz, limited by the bandwidth of the cryogenic circulators. To help interpret the different extracted for the datasets in Figs. 3a and d, the resonator differential lever arm is calculated for both cases, following the relation [28]. Using (1.6 k) and GHz (4.149 GHz) for Fig. 3a (Fig. 3d), we get V (V) and eV/V (0.18 eV/V). For further details about the resonator equivalent lumped impedance and its frequency dependence see Supplementary Notes S2.
The fits presented in Fig. 4b and Extended Data Figure 3 is performed to the entire 2D datasets (see panels a of relative figures) rather than to single line-cuts. Here, the inter-dot tunnel coupling rate is only fitted for the lowest frequency measurement and kept constant for subsequent fits. Additionally, the differential lever arm of the left plunger gate is used as a fitting parameter and the obtained fitted values are in good agreement with the values extracted from DQD stability diagram measurements.
Hamiltonian for WM simulation
To numerically reproduce the hybridized DQD-resonator spectra obtained from the microwave feedline transmission shown in Figs. 5, 6, Extended Data Figures 4, 5, we need, as a first step, to identify the multi-level energy spectra characterizing the DQD in each configuration.
We model the DQD assuming a 4 4 toy-model Hamiltonian identical to the spin-charge hybrid qubit defined by three-particles in a DQD [40, 47], as reported below. The Hamiltonian is written in the position basis , where L (R) denotes the charge state with the excess hole in the left (right) QD. g and e presents the ground and excited state of the corresponding charge configuration respectively. Specifically, in the case of the odd total number of holes in the DQD, L = (2n + 2, 2m + 1) with R = (2n + 1, 2m + 2). Here, we use the notation (p, q) to denote the DQD charge number configuration with p (q) representing the number of holes in the left (right) QD. Throughout this work, the 2n (2m) core-holes in the left (right) QD plays no role, reducing the effective DQD charge number to L = “(2, 1)”, and R = “(1, 2)” respectively. Similarly, in the even configuration, the relevant charge states effectively become L = “(2, 0)”, and R = “(1, 1)”. Consequently, the basis in which the Hamiltonian is expressed is [, , , ] in the odd configuration and [, , , ] in the even one (see Fig. 6c and d for the schematic visualisation of these states). In this basis, the DQD Hamiltonian reads:
| (2) |
Here, is the DQD detuning, is the singlet-triplet splitting in the left (right) QD and denotes the tunnel coupling between the state of left QD and state of right QD. We also include to account for the different lever-arm of the excited states [37].
The Hamiltonian eigenvalues are used to reconstruct the energy spectra (eigenenergies vs ) reported in Fig. 5d and Fig. 6e,f (top panels), whereas the excitation spectra, i.e. the energy differences between excited states and the ground state, are displayed in the bottom respective panels.
In the odd total hole number configuration, , with k = g, e (Fig. 5, Fig. 6a), the ground and the first excited state can have the same spin numbers. For example and can form the spin doublet states with the energy splitting given by the exchange interaction of the paired holes in the left QD [40]. Thereby, finite tunnel coupling between ground and exchange-split excited states is allowed, e.g. , by spin-selectrion rules [40]. Both the QDs can have GHz (close to resonator frequency) when a WM is formed in each QD.
In contrast, in the even configuration, (Fig. 6b), the ground and the first excited states cannot have the same spin quantum number [49]. For this reason, the terms , the transition rates for (corresponding to a ) and (corresponding to a ) are negligible in our setup with mT (see Fig. 6d) [48, 42]. Also, due to the negligible exchange interaction between the unpaired holes in the configuration, we set in the even case. Because the number of holes in the left QD is the same as in the odd case, we keep the same value of as in the odd case.
The aforementioned Hamiltonian, combined with the generalized input-output theory for a multi-level DQD system interacting with a superconducting resonator (see Supplementary Note S5), reproduces the features observed in the panels of Fig. 5a and 6a, b. The relevant Hamiltonian parameters are shown in Extended Data Table 3, and Extended Data Table 5.
It is worth noting that a similar model can be applied to investigate a resonator coupled to a generic multi-level DQD system, thus offering opportunities to explore valley-orbit states in silicon coupled to superconducting resonators [50].
8 Extended Data
![[Uncaptioned image]](/html/2310.20661/assets/x7.png)
![[Uncaptioned image]](/html/2310.20661/assets/x8.png)
| Parameter | Figs. 3a - c | Figs. 3d - f | Extended Data Figure 2 |
|---|---|---|---|
| (GHz) | 2.072 | 2.018 | 2.712 |
| (GHz) | 4.149 | 4.052 | 5.432∗ |
| (MHz) | 165 | 154 | 260 |
| (MHz) | 57 | 80 | 192 |
| (MHz) | 19 | 23 | 61 |
| (MHz) | 8 | 9 | 42 |
| 100 | 52 | 23 |
![[Uncaptioned image]](/html/2310.20661/assets/x9.png)
| Parameter | Panel 1 | Panel 2 | Panel 3 | Panel 4 | Panel 5 |
|---|---|---|---|---|---|
| (GHz) | 4.162 | 4.396 | 4.571 | 4.752 | 4.992 |
| (MHz) | 160 | 148 | 148 | 140 | 129 |
| () | 0.027 | 0.025 | 0.026 | 0.026 | 0.024 |
| (MHz) | 19 | 20 | 22 | 32 | 37 |
| (MHz) | 8 | 11 | 13 | 21 | 22 |
![[Uncaptioned image]](/html/2310.20661/assets/x10.png)
| Parameter | Fig. 5 (GHz) |
|---|---|
| 5.42 | |
| 4.76 | |
| 2.49 | |
| 0.25 | |
| 0.12 | |
| 1.71 | |
| 0.19 |
![[Uncaptioned image]](/html/2310.20661/assets/x11.png)
| Parameter | Value (GHz) |
|---|---|
| 5.03 | |
| 4.45 | |
| 2.00 | |
| 0.50 | |
| 0.22 | |
| 1.90 | |
| 0.13 |
![[Uncaptioned image]](/html/2310.20661/assets/x12.png)
| Parameter | Fig. 6a, Odd (GHz) | Fig. 6b, Even (GHz) |
|---|---|---|
| 5.48 | 5.48 | |
| 6.50∗ | 0.00 | |
| 2.65 | 1.70 | |
| 0.30∗ | 0.00 | |
| 1.25 | 0.00 | |
| 1.70∗ | 1.80 | |
| 0.19 | 0.12 |
References
- \bibcommenthead
- Burkard et al. [2023] Burkard, G., Ladd, T.D., Pan, A., Nichol, J.M., Petta, J.R.: Semiconductor spin qubits. Rev. Mod. Phys. 95(2), 025003 (2023) https://doi.org/10.1103/RevModPhys.95.025003
- Takeda et al. [2022] Takeda, K., Noiri, A., Nakajima, T., Kobayashi, T., Tarucha, S.: Quantum error correction with silicon spin qubits. Nature 608(7924), 682–686 (2022) https://doi.org/10.1038/s41586-022-04986-6
- Philips et al. [2022] Philips, S.G.J., Madzik, M.T., Amitonov, S.V., de Snoo, S.L., Russ, M., Kalhor, N., Volk, C., Lawrie, W.I.L., Brousse, D., Tryputen, L., Wuetz, B.P., Sammak, A., Veldhorst, M., Scappucci, G., Vandersypen, L.M.K.: Universal control of a six-qubit quantum processor in silicon. Nature 609(7929), 919–924 (2022) https://doi.org/10.1038/s41586-022-05117-x
- Hendrickx et al. [2020] Hendrickx, N.W., Franke, D.P., Sammak, A., Scappucci, G., Veldhorst, M.: Fast two-qubit logic with holes in germanium. Nature 577(7791), 487–491 (2020) https://doi.org/10.1038/s41586-019-1919-3
- Froning et al. [2021] Froning, F.N.M., Camenzind, L.C., Molen, O.A.H., Li, A., Bakkers, E.P.A.M., Zumbühl, D.M., Braakman, F.R.: Ultrafast hole spin qubit with gate-tunable spin–orbit switch functionality. Nat. Nanotechnol. 16(3), 308–312 (2021) https://doi.org/10.1038/s41565-020-00828-6
- Scappucci et al. [2021] Scappucci, G., Kloeffel, C., Zwanenburg, F.A., Loss, D., Myronov, M., Zhang, J.-J., De Franceschi, S., Katsaros, G., Veldhorst, M.: The germanium quantum information route. Nat Rev Mater 6(10), 926–943 (2021) https://doi.org/10.1038/s41578-020-00262-z
- Bulaev and Loss [2007] Bulaev, D.V., Loss, D.: Electric Dipole Spin Resonance for Heavy Holes in Quantum Dots. Physical Review Letters 98(9), 097202 (2007) https://doi.org/10.1103/PhysRevLett.98.097202
- Bulaev and Loss [2005] Bulaev, D.V., Loss, D.: Spin Relaxation and Decoherence of Holes in Quantum Dots. Physical Review Letters 95(7), 076805 (2005) https://doi.org/10.1103/PhysRevLett.95.076805
- Voisin et al. [2016] Voisin, B., Maurand, R., Barraud, S., Vinet, M., Jehl, X., Sanquer, M., Renard, J., De Franceschi, S.: Electrical Control of g-Factor in a Few-Hole Silicon Nanowire MOSFET. Nano Lett. 16(1), 88–92 (2016) https://doi.org/10.1021/acs.nanolett.5b02920
- Geyer et al. [2022] Geyer, S., Hetényi, B., Bosco, S., Camenzind, L.C., Eggli, R.S., Fuhrer, A., Loss, D., Warburton, R.J., Zumbühl, D.M., Kuhlmann, A.V.: Two-qubit logic with anisotropic exchange in a fin field-effect transistor (2022) arxiv:2212.02308 [cond-mat, physics:quant-ph]
- Kloeffel et al. [2011] Kloeffel, C., Trif, M., Loss, D.: Strong spin-orbit interaction and helical hole states in Ge/Si nanowires. Physical Review B 84(19), 195314 (2011) https://doi.org/10.1103/PhysRevB.84.195314
- Hendrickx et al. [2021] Hendrickx, N.W., Lawrie, W.I.L., Russ, M., van Riggelen, F., de Snoo, S.L., Schouten, R.N., Sammak, A., Scappucci, G., Veldhorst, M.: A four-qubit germanium quantum processor. Nature 591(7851), 580–585 (2021) https://doi.org/10.1038/s41586-021-03332-6
- Hendrickx et al. [2020] Hendrickx, N.W., Lawrie, W.I.L., Petit, L., Sammak, A., Scappucci, G., Veldhorst, M.: A single-hole spin qubit. Nat Commun 11(1), 3478 (2020) https://doi.org/10.1038/s41467-020-17211-7
- Stehouwer et al. [2023] Stehouwer, L.E.A., Tosato, A., Degli Esposti, D., Costa, D., Veldhorst, M., Sammak, A., Scappucci, G.: Germanium wafers for strained quantum wells with low disorder. Appl. Phys. Lett. 123(9), 092101 (2023) https://doi.org/10.1063/5.0158262
- Hendrickx et al. [2018] Hendrickx, N.W., Franke, D.P., Sammak, A., Kouwenhoven, M., Sabbagh, D., Yeoh, L., Li, R., Tagliaferri, M.L.V., Virgilio, M., Capellini, G., Scappucci, G., Veldhorst, M.: Gate-controlled quantum dots and superconductivity in planar germanium. Nature Communications 9(2835) (2018) https://doi.org/%****␣Main.bbl␣Line␣325␣****10.1038/s41467-018-05299-x
- Sammak et al. [2019] Sammak, A., Sabbagh, D., Hendrickx, N.W., Lodari, M., Paquelet Wuetz, B., Tosato, A., Yeoh, L., Bollani, M., Virgilio, M., Schubert, M.A., Zaumseil, P., Capellini, G., Veldhorst, M., Scappucci, G.: Shallow and undoped germanium quantum wells: A playground for spin and hybrid quantum technology. Advanced Functional Materials 29(14), 1807613 (2019) https://doi.org/10.1002/adfm.201807613 https://onlinelibrary.wiley.com/doi/pdf/10.1002/adfm.201807613
- Borsoi et al. [2023] Borsoi, F., Hendrickx, N.W., John, V., Meyer, M., Motz, S., van Riggelen, F., Sammak, A., de Snoo, S.L., Scappucci, G., Veldhorst, M.: Shared control of a 16 semiconductor quantum dot crossbar array. Nat. Nanotechnol., 1–7 (2023) https://doi.org/10.1038/s41565-023-01491-3
- van Riggelen-Doelman et al. [2023] van Riggelen-Doelman, F., Wang, C.-A., de Snoo, S.L., Lawrie, W.I.L., Hendrickx, N.W., Rimbach-Russ, M., Sammak, A., Scappucci, G., Déprez, C., Veldhorst, M.: Coherent spin qubit shuttling through germanium quantum dots (2023) arxiv:2308.02406 [cond-mat, physics:quant-ph]
- Harvey-Collard et al. [2022] Harvey-Collard, P., Dijkema, J., Zheng, G., Sammak, A., Scappucci, G., Vandersypen, L.M.K.: Coherent Spin-Spin Coupling Mediated by Virtual Microwave Photons. Phys. Rev. X 12(2), 021026 (2022) https://doi.org/10.1103/PhysRevX.12.021026
- van Woerkom et al. [2018] van Woerkom, D.J., Scarlino, P., Ungerer, J.H., Müller, C., Koski, J.V., Landig, A.J., Reichl, C., Wegscheider, W., Ihn, T., Ensslin, K., Wallraff, A.: Microwave Photon-Mediated Interactions between Semiconductor Qubits. Phys. Rev. X 8(4), 041018 (2018) https://doi.org/10.1103/PhysRevX.8.041018
- Kim et al. [2022] Kim, C.W., Nichol, J.M., Jordan, A.N., Franco, I.: Analog Quantum Simulation of the Dynamics of Open Quantum Systems with Quantum Dots and Microelectronic Circuits. PRX Quantum 3(4), 040308 (2022) https://doi.org/%****␣Main.bbl␣Line␣450␣****10.1103/PRXQuantum.3.040308
- Wong and Vavilov [2017] Wong, C.H., Vavilov, M.G.: Quantum efficiency of a single microwave photon detector based on a semiconductor double quantum dot. Phys. Rev. A 95(1), 012325 (2017) https://doi.org/10.1103/PhysRevA.95.012325
- Mi et al. [2017] Mi, X., Cady, J.V., Zajac, D.M., Deelman, P.W., Petta, J.R.: Strong coupling of a single electron in silicon to a microwave photon. Science 355(6321), 156–158 (2017) https://doi.org/10.1126/science.aal2469
- Samkharadze et al. [2018] Samkharadze, N., Zheng, G., Kalhor, N., Brousse, D., Sammak, A., Mendes, U.C., Blais, A., Scappucci, G., Vandersypen, L.M.K.: Strong spin-photon coupling in silicon. Science 359(6380), 1123–1127 (2018) https://doi.org/10.1126/science.aar4054
- Scarlino et al. [2022] Scarlino, P., Ungerer, J.H., van Woerkom, D.J., Mancini, M., Stano, P., Müller, C., Landig, A.J., Koski, J.V., Reichl, C., Wegscheider, W., Ihn, T., Ensslin, K., Wallraff, A.: In situ Tuning of the Electric-Dipole Strength of a Double-Dot Charge Qubit: Charge-Noise Protection and Ultrastrong Coupling. Phys. Rev. X 12(3), 031004 (2022) https://doi.org/10.1103/PhysRevX.12.031004
- Stockklauser et al. [2017] Stockklauser, A., Scarlino, P., Koski, J.V., Gasparinetti, S., Andersen, C.K., Reichl, C., Wegscheider, W., Ihn, T., Ensslin, K., Wallraff, A.: Strong Coupling Cavity QED with Gate-Defined Double Quantum Dots Enabled by a High Impedance Resonator. Phys. Rev. X 7(1), 011030 (2017) https://doi.org/10.1103/PhysRevX.7.011030
- Ungerer et al. [2023] Ungerer, J.H., Pally, A., Kononov, A., Lehmann, S., Ridderbos, J., Potts, P.P., Thelander, C., Dick, K.A., Maisi, V.F., Scarlino, P., Baumgartner, A., Schönenberger, C.: Strong coupling between a microwave photon and a singlet-triplet qubit (2023) arXiv:2303.16825 [cond-mat.mes-hall]
- Yu et al. [2023] Yu, C.X., Zihlmann, S., Abadillo-Uriel, J.C., Michal, V.P., Rambal, N., Niebojewski, H., Bedecarrats, T., Vinet, M., Dumur, E., Filippone, M., Bertrand, B., De Franceschi, S., Niquet, Y.-M., Maurand, R.: Strong coupling between a photon and a hole spin in silicon 18(7), 741–746 (2023) https://doi.org/10.1038/s41565-023-01332-3
- Kang et al. [2023] Kang, Y., Li, Z.-H., Kong, Z.-Z., Li, F.-G., Hao, T.-Y., Wei, Z.-C., Deng, S.-Y., Wang, B.-C., Li, H.-O., Wang, G.-L., Guo, G.-C., Cao, G., Guo, G.-P.: Coupling of Hole Double Quantum Dot in Planar Germanium to a Microwave Cavity. arXiv (2023). https://doi.org/10.48550/arXiv.2310.08145
- Wang et al. [2019] Wang, R., Deacon, R.S., Sun, J., Yao, J., Lieber, C.M., Ishibashi, K.: Gate Tunable Hole Charge Qubit Formed in a Ge/Si Nanowire Double Quantum Dot Coupled to Microwave Photons. Nano Letters 19(2), 1052–1060 (2019) https://doi.org/10.1021/acs.nanolett.8b04343
- Hanson et al. [2003] Hanson, R., Witkamp, B., Vandersypen, L.M.K., Van Beveren, L.H.W., Elzerman, J.M., Kouwenhoven, L.P.: Zeeman Energy and Spin Relaxation in a One-Electron Quantum Dot. Phys. Rev. Lett. 91(19), 196802 (2003) https://doi.org/10.1103/PhysRevLett.91.196802
- Golovach et al. [2008] Golovach, V.N., Khaetskii, A., Loss, D.: Spin relaxation at the singlet-triplet crossing in a quantum dot. Physical Review B 77(4), 045328 (2008) https://doi.org/10.1103/PhysRevB.77.045328
- Jang et al. [2023] Jang, W., Kim, J., Park, J., Kim, G., Cho, M.-K., Jang, H., Sim, S., Kang, B., Jung, H., Umansky, V., Kim, D.: Wigner-molecularization-enabled dynamic nuclear polarization. Nat Commun 14(1), 2948 (2023) https://doi.org/10.1038/s41467-023-38649-5
- Jang et al. [2021] Jang, W., Cho, M.-K., Jang, H., Kim, J., Park, J., Kim, G., Kang, B., Jung, H., Umansky, V., Kim, D.: Single-Shot Readout of a Driven Hybrid Qubit in a GaAs Double Quantum Dot. Nano Lett. 21(12), 4999–5005 (2021) https://doi.org/10.1021/acs.nanolett.1c00783
- Corrigan et al. [2021] Corrigan, J., Dodson, J.P., Ercan, H.E., Abadillo-Uriel, J.C., Thorgrimsson, B., Knapp, T.J., Holman, N., McJunkin, T., Neyens, S.F., MacQuarrie, E.R., Foote, R.H., Edge, L.F., Friesen, M., Coppersmith, S.N., Eriksson, M.A.: Coherent Control and Spectroscopy of a Semiconductor Quantum Dot Wigner Molecule. Phys. Rev. Lett. 127(12), 127701 (2021) https://doi.org/10.1103/PhysRevLett.127.127701
- Pecker et al. [2013] Pecker, S., Kuemmeth, F., Secchi, A., Rontani, M., Ralph, D.C., McEuen, P.L., Ilani, S.: Observation and spectroscopy of a two-electron Wigner molecule in an ultraclean carbon nanotube. Nature Phys 9(9), 576–581 (2013) https://doi.org/10.1038/nphys2692
- Yannouleas and Landman [2022] Yannouleas, C., Landman, U.: Molecular formations and spectra due to electron correlations in three-electron hybrid double-well qubits. Phys. Rev. B 105(20), 205302 (2022) https://doi.org/%****␣Main.bbl␣Line␣775␣****10.1103/PhysRevB.105.205302
- Abadillo-Uriel et al. [2021] Abadillo-Uriel, J.C., Martinez, B., Filippone, M., Niquet, Y.-M.: Two-body Wigner molecularization in asymmetric quantum dot spin qubits. Phys. Rev. B 104(19), 195305 (2021) https://doi.org/10.1103/PhysRevB.104.195305
- Hetényi et al. [2022] Hetényi, B., Bosco, S., Loss, D.: Anomalous Zero-Field Splitting for Hole Spin Qubits in Si and Ge Quantum Dots. Phys. Rev. Lett. 129(11), 116805 (2022) https://doi.org/10.1103/PhysRevLett.129.116805
- Shi et al. [2012] Shi, Z., Simmons, C.B., Prance, J.R., Gamble, J.K., Koh, T.S., Shim, Y.-P., Hu, X., Savage, D.E., Lagally, M.G., Eriksson, M.A., Friesen, M., Coppersmith, S.N.: Fast Hybrid Silicon Double-Quantum-Dot Qubit. Phys. Rev. Lett. 108(14), 140503 (2012) https://doi.org/10.1103/PhysRevLett.108.140503
- Masluk et al. [2012] Masluk, N.A., Pop, I.M., Kamal, A., Minev, Z.K., Devoret, M.H.: Microwave characterization of josephson junction arrays: Implementing a low loss superinductance. Phys. Rev. Lett. 109, 137002 (2012) https://doi.org/10.1103/PhysRevLett.109.137002
- Jirovec et al. [2021] Jirovec, D., Hofmann, A., Ballabio, A., Mutter, P.M., Tavani, G., Botifoll, M., Crippa, A., Kukucka, J., Sagi, O., Martins, F., Saez-Mollejo, J., Prieto, I., Borovkov, M., Arbiol, J., Chrastina, D., Isella, G., Katsaros, G.: A singlet-triplet hole spin qubit in planar Ge. Nat. Mater. 20(8), 1106–1112 (2021) https://doi.org/10.1038/s41563-021-01022-2
- Castellanos-Beltran and Lehnert [2007] Castellanos-Beltran, M.A., Lehnert, K.W.: Widely tunable parametric amplifier based on a superconducting quantum interference device array resonator. Applied Physics Letters 91(8), 083509 (2007) https://doi.org/10.1063/1.2773988
- Frey et al. [2012] Frey, T., Leek, P.J., Beck, M., Faist, J., Wallraff, A., Ensslin, K., Ihn, T., Büttiker, M.: Quantum dot admittance probed at microwave frequencies with an on-chip resonator. Phys. Rev. B 86(11), 115303 (2012) https://doi.org/10.1103/PhysRevB.86.115303
- van der Wiel et al. [2002] Wiel, W.G., De Franceschi, S., Elzerman, J.M., Fujisawa, T., Tarucha, S., Kouwenhoven, L.P.: Electron transport through double quantum dots. Rev. Mod. Phys. 75, 1–22 (2002) https://doi.org/10.1103/RevModPhys.75.1
- Clerk et al. [2020] Clerk, A.A., Lehnert, K.W., Bertet, P., Petta, J.R., Nakamura, Y.: Hybrid quantum systems with circuit quantum electrodynamics. Nature Physics 19(3), 257–267 (2020) https://doi.org/10.1038/s41567-020-0797-9
- Shi et al. [2014] Shi, Z., Simmons, C.B., Ward, D.R., Prance, J.R., Wu, X., Koh, T.S., Gamble, J.K., Savage, D.E., Lagally, M.G., Friesen, M., Coppersmith, S.N., Eriksson, M.A.: Fast coherent manipulation of three-electron states in a double quantum dot. Nat Commun 5(1), 3020 (2014) https://doi.org/10.1038/ncomms4020
- Nichol et al. [2015] Nichol, J.M., Harvey, S.P., Shulman, M.D., Pal, A., Umansky, V., Rashba, E.I., Halperin, B.I., Yacoby, A.: Quenching of dynamic nuclear polarization by spin–orbit coupling in GaAs quantum dots. Nat Commun 6(1), 7682 (2015) https://doi.org/10.1038/ncomms8682
- Johnson et al. [2005] Johnson, A.C., Petta, J.R., Marcus, C.M., Hanson, M.P., Gossard, A.C.: Singlet-triplet spin blockade and charge sensing in a few-electron double quantum dot. Physical Review B 72(16), 165308 (2005) https://doi.org/10.1103/PhysRevB.72.165308
- Borjans et al. [2021] Borjans, F., Zhang, X., Mi, X., Cheng, G., Yao, N., Jackson, C.A.C., Edge, L.F., Petta, J.R.: Probing the Variation of the Intervalley Tunnel Coupling in a Silicon Triple Quantum Dot. PRX Quantum 2(2), 020309 (2021) https://doi.org/10.1103/PRXQuantum.2.020309