[1,2]\fnmHanieh \surFattahi
1]\orgnameMax Planck Institute for the Science of Light, \orgaddress\streetStaudstrasse 2, \cityErlangen, \postcode91058, \countryGermany
2]\orgdivDepartment of Physics, \orgnameFriedrich-Alexander-Universität Erlangen-Nürnberg, \orgaddress\streetStaudstrasse 7, \cityErlangen, \postcode91058, \countryGermany
Near-Petahertz Fieldoscopy of Liquid
Abstract
Measuring transient optical field is pivotal not only for understanding ultrafast phenomena but also for quantitative detection of various molecular species in a sample. In this work, we demonstrate near-petahertz electric field detection of a few femtosecond pulses with 2oo attosecond temporal resolution, 108 detection dynamic range in electric field and sub-femtojoule detection sensitivity, exceeding those reported by the current methods. By field-resolved detection of the impulsively excited molecules in the liquid phase, termed “femtosecond fieldoscopy”, we demonstrate temporal isolation of the response of the target molecules from those of the environment and the excitation pulse. In a proof-of-concept analysis of aqueous and liquid samples, we demonstrate field-sensitive detection of combination bands of 4.13 mol ethanol for the first time. This method expands the scope of aqueous sample analysis to higher detection sensitivity and dynamic range, while the simultaneous direct measurements of phase and intensity information pave the path towards high-resolution biological spectro-microscopy.
keywords:
Near-infrared spectroscopy, Field-resolved spectroscopy, ultrashort pulses, time-domain spectroscopy1 Introduction
Laser-based, label-free quantitative determination of sample composition has proven to be a potent tool across a wide spectrum from fundamental research to real-life applications [1, 2, 3, 4, 5, 6, 7, 8, 9, 10, 11]. For accurate and delicate spectroscopic measurements, it has been crucial to isolate the sample from environmental interferences. For instance, water comprises approximately 60 % of the human body, envelops 70 % of the Earth’s surface, and permeates our surroundings through the atmosphere. Water has a broad absorption spectrum spanning from the visible to mid-infrared (MIR) and is a persistent component on our detectors. Due to its strong absorption cross-section at MIR, sensitive spectroscopy of samples at their resonance frequencies is challenging, as water dominates other, more subtle, absorbance features arising from other molecules. Moreover, the excessive absorbed energy by water at MIR is left in the sample as thermal energy, limiting non-invasive analysis. On the other hand, NIR spectroscopy provides a fingerprint of sample constituents similar to MIR spectroscopy. It distinguishes itself by offering higher spatial resolution and enhanced penetration depth, afforded by the lower absorption cross-section of water in the NIR region [12, 13, 14]. This feature makes NIR spectroscopy particularly suitable for the non-invasive and label-free examination of soft matter and large-volume aqueous samples [15, 16].
Overtone and combination vibrations of molecules, which are primarily detected in NIR spectroscopy extend beyond 0.12 petahertz (PHz). Spectrometers have been used for frequency domain detection in this range. However, their detection sensitivity is constrained by the excitation light, which manifests as a background within the same spectral range [17, 18, 19]. Since the resonance frequencies of overtone and combination bands surpass the sensitivity of silicon-based detectors, employing a second detector, generally more prone to noise in this range, is necessary to capture the system’s entire response. Fourier transform spectroscopy is an alternative method allowing for precise spectroscopic detection. Recent advancements in NIR dual-comb spectroscopy have paved the way for precision Fourier transform spectroscopy, albeit primarily in the gas phase [20, 21, 22, 23, 24]. Nonetheless, the technique remains constrained by detectors’ spectral response and the existence of a background signal analogous to frequency domain detection [25, 13].
In contrast, field-resolved detection allows for the direct measurement of light-matter interactions with attosecond precision in a sub-cycle regime, capturing both amplitude and phase information [26, 27]. For decades attosecond streaking was the sole method to probe the electric field of light with a bandwidth approaching the PHz [28, 29]. A significant drawback was its confinement to vacuum operations. Over the past decade, various techniques have been developed that enable the near-PHz field-resolved detection of light in ambient air [30, 31, 32, 33, 34, 35, 36, 37, 38, 39, 40, 41, 42, 43, 44, 45, 46]. Among these techniques electro-optic sampling (EOS) stands out for its unparalleled detection sensitivity [47, 48, 27]. In EOS a short probe pulse is employed to resolve the cycles of the electric field of light by up-converting its spectral bandwidth to higher frequencies, making it possible to apply silicon detectors for broadband NIR detection [49]. Moreover, the combination of bright, ultra-short pulses [50, 51, 52, 53] and heterodyne detection allows for higher detection signal-to-noise ratio and higher detection sensitivity, leaving the shot noise of the probe pulse the primary source of noise [54].
In this work, we report on the direct detection of the electric field of light at near-PHz frequencies with unparalleled sensitivity and dynamic range. This has been enabled by developing a unique laser source delivering broadband pulses with carrier-to-envelope phase (CEP) stability, which were intrinsically synchronized to near-single-cycle pulses at megahertz (MHz) repetition rates. The unique frontend enabled direct electric-field detection of CEP-stable, few-cycle pulses with unprecedented detection sensitivity and dynamic range via EOS with attosecond temporal resolution.
Employing the bright ultrashort pulses, we report on the field-sensitive detection of molecular response at the NIR region for the first time. Few-femtosecond, phase-coherent pulses were utilized for both broadband molecular excitation and the near-PHz electric-field detection of their response. Here, the confinement of the excitation pulses allows for temporal gating of the molecular response, while accessing the electric field enables the precise detection of the response of the target molecules from those of the environment. We evaluated our approach by conducting field-resolved detection of water vibration modes in both gas and liquid phases in the NIR region. Additionally, we detected the subtle combination bands of ethanol in the liquid phase. These results show to the best of our knowledge the first field-detection of the NIR molecular response in ambient air, paving the path for the emergence of innovative, field-sensitive, label-free spectroscopy and microscopy techniques.
2 Results
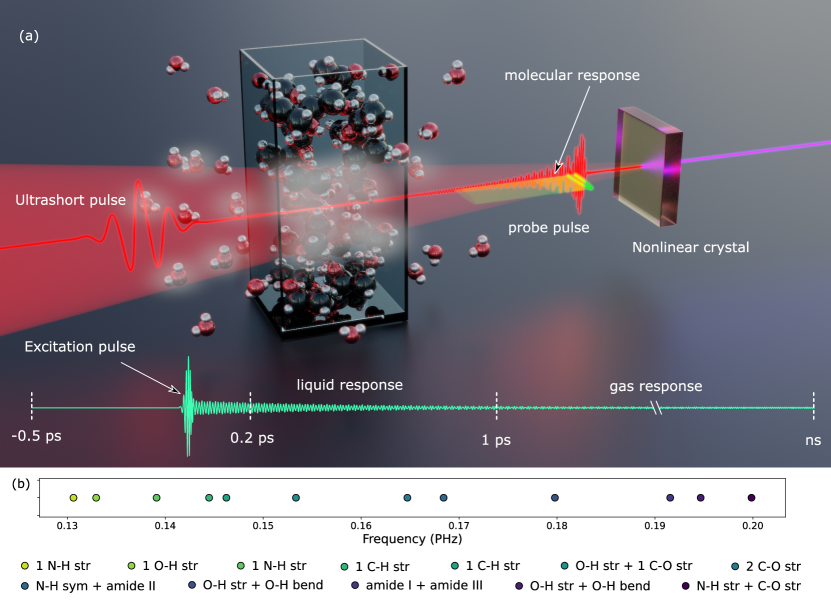
Fig. 1 illustrates the measurement concept. Few-cycle, CEP-stable, NIR pulses, are utilized to extract sensitive spectroscopic information from liquid samples under atmospheric conditions. The electric field of the molecular response, in the wake of the excitation pulse, is resolved via EOS. Due to the high detection sensitivity, we can resolve not only the response of the molecular vibrations of the sample at their overtone and combination resonances but also the response of atmospheric molecules along the beam path. The temporal confinement of the excitation pulses ensures that the molecular responses from both the sample and ambient air are temporally separated from the excitation pulse. Moreover, the response of the liquid sample is temporally distinguished from the ambient air’s fingerprint due to the faster dephasing in the liquid phase. Realizing such a concept requires the generation of intrinsically synchronized bright few-cycle pulses with at least one-octave separation and sub-cycle temporal synchronization.
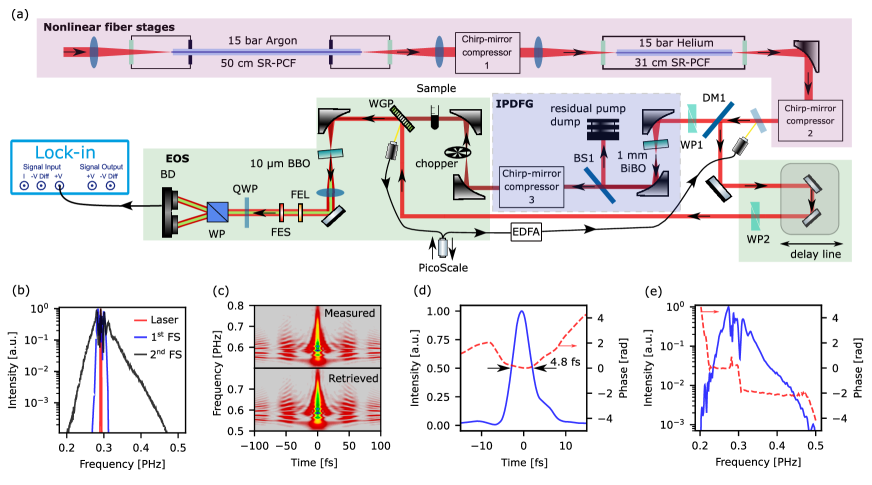
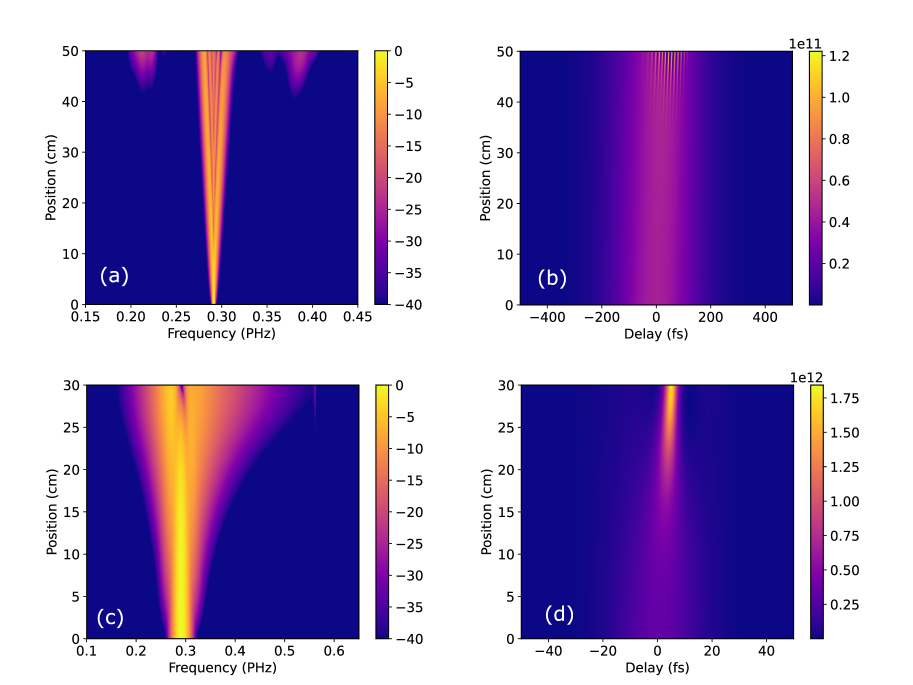
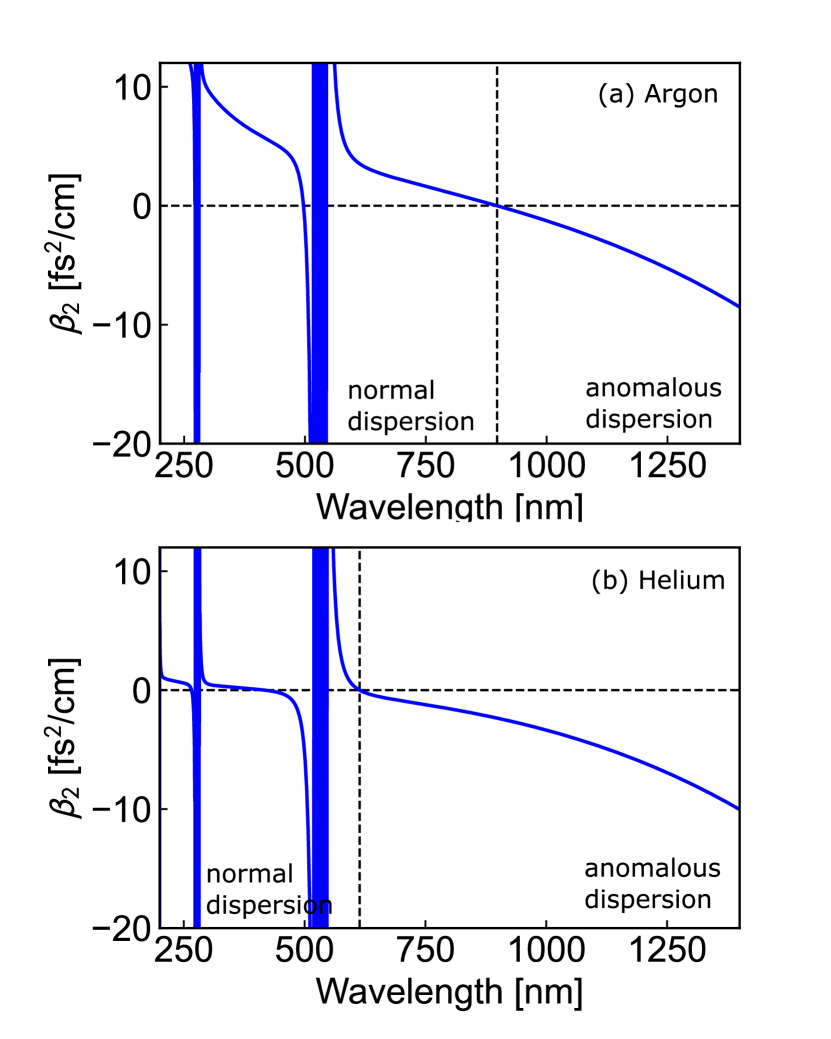
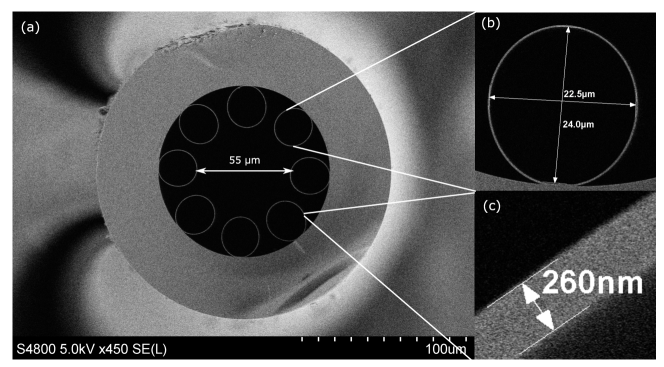
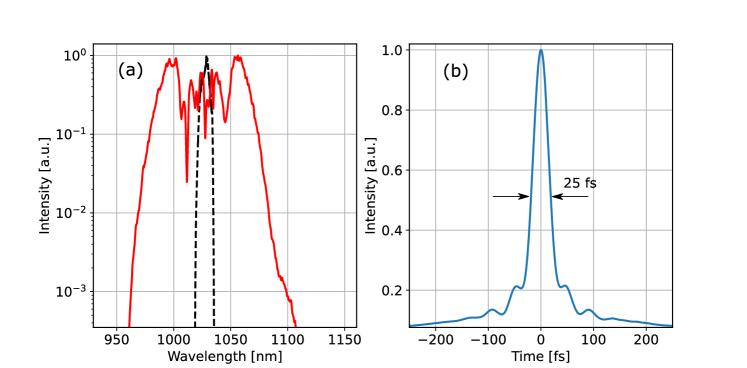
The pink-shaded region in Fig. 2(a) shows the optical setup for near single-cycle pulse generation at MHz repetition rates. Single-ring hollow-core photonic crystal fibers (SR-PCF) are used due to their relatively low-loss, broadband guidance, and tunable dispersion [55, 56], allowing the generation of ultrashort, bright pulses containing tens of microjoules of energy [53, 57]. In the first stage, 20 J, 1 MHz laser pulses were compressed from 255 fs to 25 fs at full width at half maximum (FWHM), by self-phase-modulation based spectral broadening in Argon-filled SR-PCF (see supplementary information (SI) Fig. 5 and Fig. 6), followed by group-delay dispersion compensation by a chirped mirror (CM) compressor. Subsequently, in the second stage, the 25 fs pulses were compressed to a near single-cycle duration via soliton-effect self-compression in a similar fiber (Fig. 2(b)). In both stages, the gas species used as a medium were selected to minimize photoionization and subsequent long-lived effects occurring at MHz repetition rates [58]. The accumulated dispersion on the near single-cycle pulses due to propagation in media after the fiber was compensated in a CM compressor to 4.8 fs at FWHM, limited by the bandwidth of the CM compressor (Fig. 2(c) and Fig. 2(d)). This corresponds to 3.5 GW of peak power with 69 % of the energy in the main pulse. The retrieved spectrum shown in Fig. 2(e) spans over 300 THz bandwidth supporting 3 fs pulses at FWHM.
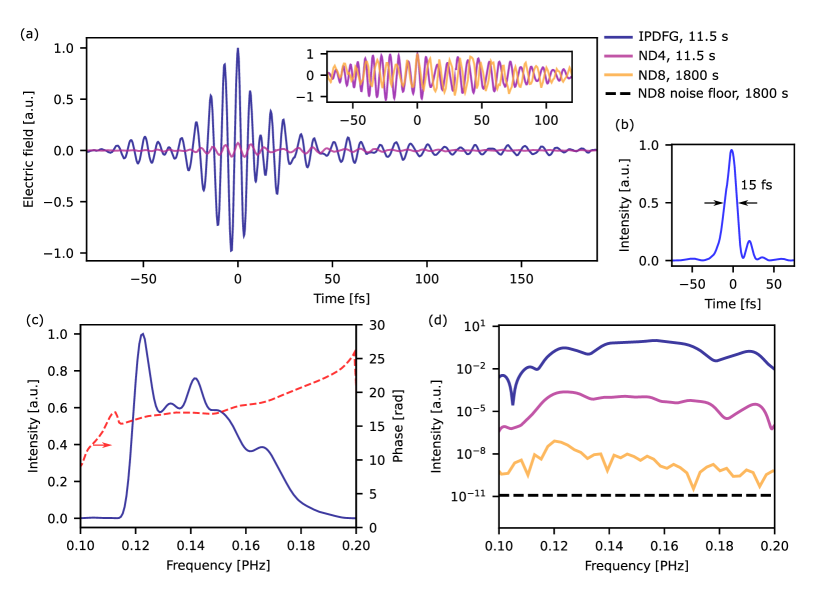
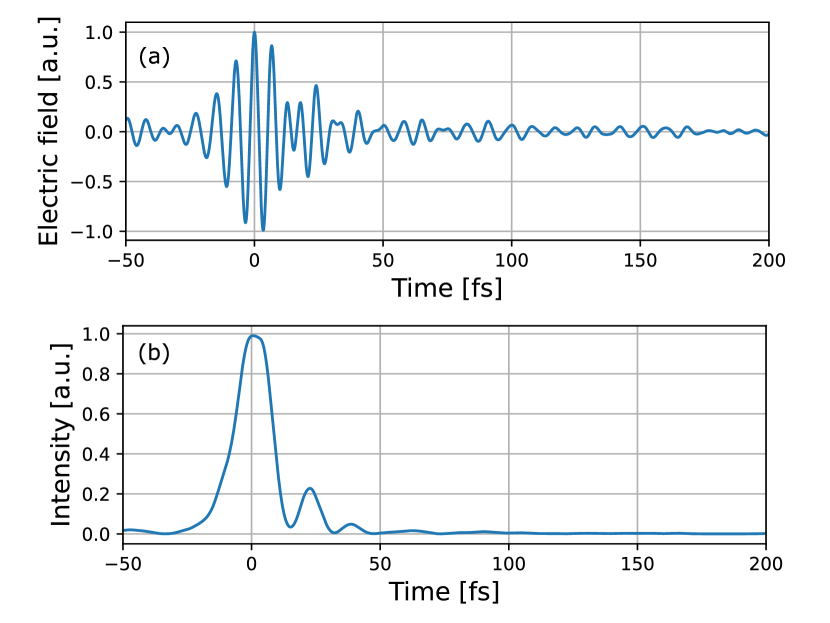
Intrapulse difference frequency generation (IPDFG) was employed to generate broadband NIR pulses with a passive CEP-stability (blue region in Fig. 2(a)) [59]. A 500 m-thick bismuth borate (BiBO) crystal was pumped by 4.8 fs pulses at 1 m to generate a broadband spectrum spanning from 0.1 PHz to 0.23 PHz and 160 mW of average power. A custom-made dichroic beam splitter with the cut-off at 0.2 PHz was used to separate the residual pump from the CEP-stable pulses. After dispersion management with a custom-made CM compressor, the NIR pulses along with the fraction of 4.8 fs pulses were sent to a 20 m beta barium borate (BBO) crystal for electric-field sampling. The green-shaded region in Fig. 2(a) highlights the schematic of the NIR EOS. The up-converted signal is spectrally filtered with a pass band filter from 0.425 PHz to 0.5 PHz to enhance the detection sensitivity by eliminating the spectral components that do not carry specific field information. The measured electric field of the broadband CEP-stable pulses and its temporal intensity profile with a 15 fs pulse duration at FWHM are shown in Fig. 3(a) and Fig. 3(b), respectively. The corresponding spectral intensity and phase obtained through the Fourier transform shown in Fig. 3(c) reveals residual higher-order dispersion, which can be compensated by optimizing the design of the CM compressor. While the high-frequency cut-off of the spectrum is limited by the beam splitter roll-off, the crystal absorption constrains the low-frequency cut-off to 0.1 PHz. To verify the detection sensitivity and dynamic range of the detector, the energy of the IPDFG pulses before EOS crystal was reduced from 80 nJ to sub-femto joule energies by using a series of neutral density filters. Fig. 3(a) inset shows two field-resolved measurements at 8 pJ (magenta) and 0.7 fJ (in yellow), respectively. The spectral intensity counterpart at the three different pulse energies is shown in Fig. 3(d) corresponding to a 110 dB dynamic range. To establish the ability of the system to detect the response of minute quantities of molecules, we resolved the electric field of the atmospheric water vapor molecules, liquid water, and ethanol in ambient air after excitation by femtosecond NIR pulses. The temporally gated molecular response and their frequency counterparts are shown in Fig. 4.
3 Discussion
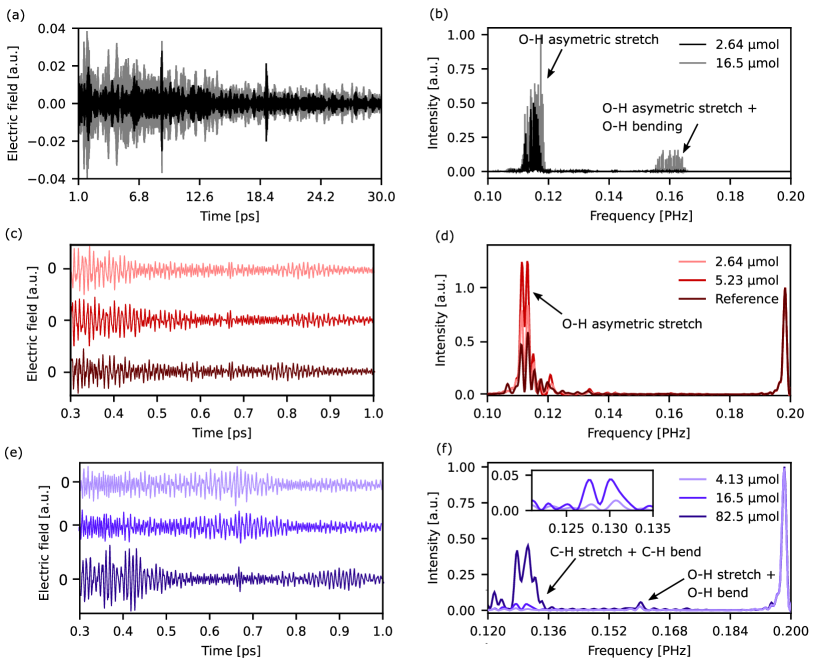
Water has two prominent absorption peaks within the spectral coverage of the excitation pulses: i) an asymmetric stretch centered at 0.115 PHz (3836 cm-1) and ii) a combination resonance of bending and asymmetrical stretch centered at 0.16 PHz (5337 cm-1) [60]. Fig. 4(a) shows the electric field of atmospheric water vapor molecules at two different laboratory relative humidity (RH). The measurements at 50 % RH and 8 % RH, correspond to 16.5 mol and 2.64 mol of atmospheric water vapour molecules interacting with the broadband 15 fs excitation pulses, respectively (see SI). The minimum laboratory achievable RH of 8 % was reached by purging the beam path with dry air and nitrogen. Fig. 4(b) shows the corresponding absorption frequencies for both concentrations. The spectra are achieved by Fourier-transformation of the temporally gated molecular response at 1 ps after the excitation pulse for a temporal window of 30 ps and agree with the HITRAN database [61] (see SI Fig.7). At the 2.64 mol level, the absorption peak at 0.16 PHz is barely resolved due to the low absorption cross-section of the water’s combination band (6510-21cm2/molecule) compared to its counterpart at the fundamental resonance (60010-21cm2/molecule) [61].
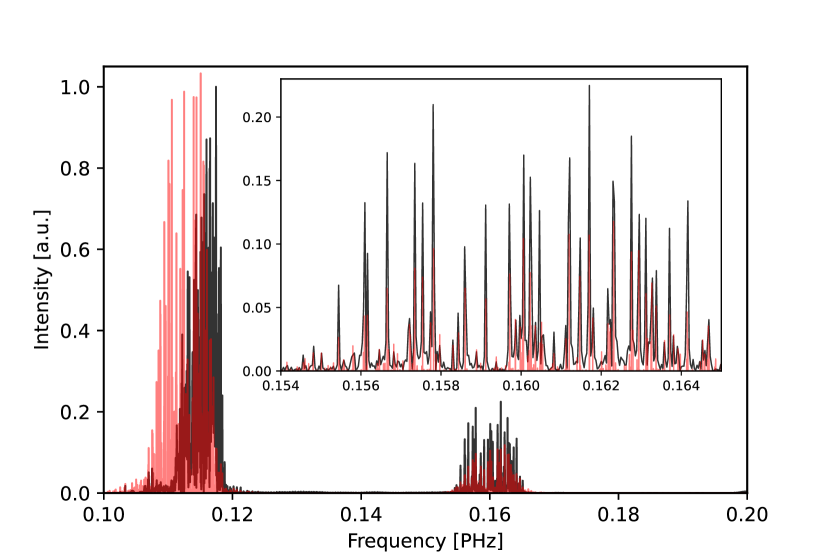
Fig. 4(c) shows the measured molecular response of 5.23 mol and 2.64 mol diluted water in the liquid phase, which were prepared by mixing 20 L and 10 L of deionized water in 1 mL acetic acid. We examined the molecular response in the liquid phase in the temporal window of 0.3 ps to 1 ps, as dephasing occurs faster (Fig. 4(d)) [62, 63]. The absorption amplitude of both concentrations was normalized to 0.2 PHz peak, which is present at this time scale due to the cut-off of the dichroic beam splitter used in our setup. Water’s asymmetric stretch resonance at 0.115 PHz (3836 ) in Fig. 4(d) is distinct for 5.23 mol (red curve) and 2.64 mol (magenta curve). The pure acetic acid response in the presence of water vapor molecules at RH of 8 % is shown in Fig. 4(d) (black curve). To evaluate the detection sensitivity of our setup in environmental conditions, ethanol was measured due to its distinct resonance frequency in comparison to water and its low absorption cross-section. Fig. 4(e) and Fig. 4(f) show the resonance of pure liquid ethanol at different concentrations and 8 % RH, in time and frequency domain, respectively. The weak absorption at 0.13 PHz (4336 ) is due to the combination band resonance arising from C-H stretch and C-H bend mode, which was resolved very clearly in our measurement at the minimum detectable amount of 4.13 mol [64].
We define a figure of merit (FOM) to allow detection sensitivity comparison of absorption bands between different species and various absorption cross-sections. The FOM is defined as:
| (1) |
Where n is the amount of substance in mol and is the absorption cross-section of the absorption band in cm2/molecule. Given the absorption cross-section values of water (60010-21 cm2/molecule) and ethanol (3.210-21 cm2/molecule) [61, 65], the calculated FOM value for water at 2.64 mol is m2 mol/molecule, while FOM for ethanol’s combination band at 4.13 mol is m2 mol/molecule with merely 25 m path length.
In conclusion, we report on field-sensitive, near-PHz detection of molecular fingerprints in the liquid phase for the first time. To this end bright, intrinsically synchronized CEP-stable, 15 fs pulses at 2 m, and 4.8 fs pulses at 1 m were generated for impulsive excitation and probing of the molecular response via EOS. Using the MHz ultrashort laser pulses, we demonstrated the ambient air field-resolved detection of femtosecond pulses with sub-femtojoule energy, and detection dynamic range in the electric field, enhancing the near-PHz field-detection sensitivity by three orders of magnitude compared to other field-resolved techniques [47]. The source’s MHz repetition rate augments both the signal-to-noise ratio and detection sensitivity, while the signal upconversion in our scheme alleviates the bandwidth constraint inherent in silicon-based detectors. In a proof of concept, we reported on the sensitive detection of the vibration modes of atmospheric and aqueous water molecules at 2.64 mol, and ethanol combination band at 4.13 mol. To the best of our understanding, these measurements mark the first field-resolved detection of both fundamental and combination bands in the liquid phase.
Femtosecond pump-probe spectroscopy has provided evidence that rapid dynamics occurring within a time scale of fewer than 100 fs of liquid water have a significant impact on chemical reactions taking place in the aqueous phase [66]. This underscores the vital importance of ultrafast processes in comprehending aqueous phase chemistry for example on grasping how water molecules dissipate energy [67]. The electric field measurements presented in Fig. 4 thus establish a foundation for studying aqueous solutions with enhanced sensitivity and dynamic range compared to femtosecond intensity pump-probe techniques [68, 69], rooted in the higher amplitude of the molecular response relative to the excitation pulses in field-resolved detection (see SI Fig. 8) [70, 71]. Furthermore, the high repetition rate of near-single-cycle pulses not only lays the groundwork for single-shot monitoring of chemical reactions in liquids [72] but also presents intriguing possibilities for exploring nonlinear interactions due to the unique combination of peak and average power in the near-single-cycle domain.
Stimulating the molecular composition of a sample with phase-coherent femtosecond excitation pulses leads to temporal gating between the molecular response from the excitation pulses. Moreover, accessing the sub-cycle electric field of light allows for decomposing the short-lived liquid molecular response from the long-lived ambient gas responses (see SI Fig. 9). Femtosecond fieldoscopy expands the scope of aqueous sample analysis and paves the path toward novel methods for multi-dimensional spectroscopy and high-resolution biological spectro-microscopy.
4 Materials and Methods
4.1 Near single-cycle pulse generation
A commercially available Yb:KGW amplifier (CARBIDE Light Conversion) delivering 255 fs pulses at 1030 nm with 20 W of average power, and at 1 MHz repetition rate, is used as the source laser. In the first nonlinear fiber stage, we used a 100 mm focal length (Thorlabs LA1509-B-ML) lens to couple 20 J circularly polarized pulses into a 50 cm long SR-PCF with a core diameter of 55 m (see SI Fig. 10) filled with 15 bar of Argon. The spectrally broadened laser pulses were compressed to 25 fs (FWHM) using a CM compressor (UltraFast Innovations GmBH PC1611) with 12 bounces (see SI Fig. 11). The total group delay dispersion compensated by the CM compressor was -1800 fs2. Subsequently, the 25 fs compressed pulses were coupled (via Thorlabs LA1509-BML) to a 31 cm long SR-PCF (parameter same as before), filled with 15 bar of Helium. After the second stage, a 2-inch off-axis silver parabola (Edmund 36-598) with an effective focal length of 177.8 mm was used to collimate the beam. The two gas cells were mounted on a 3-axis stage (MDE122) from Elliot Scientific. The two-stage fiber system achieves a total throughput of 85 % before the collimating parabola. Afterward, the soliton-compressed pulses were sent to a CM compressor (UFI PC105) consisting of four double-angle CM (total group delay dispersion of -160 fs2) and a pair of wedges (Altechna M0067705) to compensate for the dispersion caused by the two mm-thick MgF2 output window of the second gas cell and to pre-compensate for the accumulated dispersion on the pulse before reaching the IPDFG crystal. After the compressor, we placed a 1 mm AR-coated window (UFI AR7203) that reflects 5 % of the beam, to separate the probe pulses for EOS. We employed a home-built second-harmonic generation frequency-resolved optical gating (SHG-FROG) for temporal characterization. To ensure accurate measurements, the device utilized all-reflective dispersion-free optics in a non-collinear geometry with 10 m-thick BBO crystal (Castech) cut for type I phase matching.
4.2 CEP-stable, NIR pulse generation
For the IPDFG, we focused 12 J of the compressed pulses from the fiber stages to 40 m by using a 1-inch off-axis parabola. A type II BiBO crystal with a phase matching angle of 12° (Castech) was placed a few millimeters behind the focus to avoid white light generation in the crystal. A half-wave plate was introduced into the beam path before the second fiber stage to rotate 1 % of the input ‘p’ polarisation state to ‘s’ polarisation state. The generated CEP-stable pulse was collimated to a beam size of 3.2 mm at 1/e2 employing a 4-inch focal length parabola (Thorlabs MPD254508-90-P01). A custom-built (UFI BS2214-RC2) broadband dichroic beam splitter separated the pump and the NIR beam. The measured power after the beam splitter was 160 mW. A custom-built double-angle CM compressor (UFI IR7202) (see SI Fig. 12) with four bounces was used for temporal compression to 15 fs.
4.3 Field-resolved detection
In EOS, probe and excitation pulses propagate collinearly in a nonlinear crystal, generating spectral components at sum and difference frequencies. The up-converted field-sensitive signal arises from the interference between partially overlapping spectra of the probe pulse and the sum or difference frequency pulse. Through an ellipsometer, direct access is obtained to the electric field of the sampled pulse [37]. By utilizing a lock-in amplifier and balanced detection, the technical noise surplus of the gate pulse was mitigated, thereby making the shot noise of the probe pulse the primary limitation on detection sensitivity. In the EOS, the IPDFG pulses were used as an excitation pulse, whereas a 5 % reflection from the second fiber stage’s output was used as a probe pulse. A wire grid polarizer combined the probe and the excitation pulses with orthogonal polarization, collinearly in the EOS crystal. An off-axis parabolic mirror of 3-inch focal length was used to focus the beams in a 20-m-thick, type II BBO crystal to generate the sum frequency signal. The sum frequency signal interferes with the high-frequency portion of the probe pulse, which acts as a local oscillator for a heterodyne detection. Appropriate filters (Thorlabs FEL 600 and FES 700) were placed after the EOS crystal. The resulting polarization rotation was measured by an ellipsometer, which included a Wollaston prism, a quarter waveplate, and balanced photodiodes. The quarter-wave plate is adjusted to ensure that both photodiodes receive the same intensity in the presence of the probe pulses. A mechanical chopper modulated the excitation pulses at 5.8 kHz to enable heterodyne lock-in detection. The delay line was based on the linear motorized stage (Physik Instrument V-528.1AA) with a scanning range of 20 mm, corresponding to a scanning delay of 132 ps. An interferometric delay tracking system [73] was employed to precisely track the delay line and any timing jitter artifacts (see SI).
In EOS, the measured interference of the sampling field with sum frequency field components is convoluted with the detector response. Consequently, it is subject to a complex response function comprising both amplitude and phase components. The response function can be calculated using the methods described in [30]. Based on the wavevector mismatch calculation (see SI Fig. 13), it can be seen that the post-processing of the measured field can be neglected for our spectral range as the nonlinear response remains constant throughout the EOS detection range.
4.4 Sample preparation
A Pike Technologies liquid cell (162-1200) with two 3 mm-thick barium fluoride windows and a spacer was used to hold the liquid samples. To examine the liquid water, 10 L and 20 L of deionized water were mixed with 1 mL acetic acid buffer solution (chemlab - CL00.0119). The samples were placed between two windows using a 0.5 mm Teflon O-ring, corresponding to an irradiation volume of 4.81 L. Three cells with different concentrations were mounted side to side on a translation stage to reduce the systematic error. For ethanol measurements, pure ethanol (VWR chemicals - 85033.360) was filled into three liquid cells with Teflon O-ring spacers of different thicknesses (0.5 mm, 0.1 mm, and 0.025 mm). The spacers corresponded to irradiation volumes of 4.81 L, 0.962 L, and 0.241 L, respectively.
Acknowledgements
We thank PSJ Russell, MH Frosz, and their team for the production of the fibers used in this experiment. We want to express our deep gratitude to Daniel Schade, Wolfgang Schweinberger, Gunnar Arisholm, Nicholas Karpowicz, and Mallika I Suresh for their invaluable guidance and support.
Declarations
-
•
This work was supported by research funding from the Max Planck Society.
-
•
Conflict of interest/Competing interests: The authors do not declare any competing interests.
-
•
Authors’ contribution: H.F. envisioned and designed the experiment. A.S., A.H., F.T., M.K. implemented fiber stages for short pulse generation. A.S, A.H. M.B implemented the data acquisition system. A.S. performed the fieldoscopy measurements. A.S. and H.F performed the data analysis and wrote the manuscript. All authors proofread the manuscript.
Supplementary Information
Data acquisition
The experimental configuration incorporates custom-developed software tailored to comprehensively control various components involved in the measurement process, namely the delay stage, PicoScale, and lock-in amplifier. The delay stage employed is a Physik Instrument V-528.1AA, specifically chosen for its suitability within the experimental framework. The PicoScale, an integral setup component, is a commercially available interferometer manufactured by SmarAct. It operates on the principles of sinusoidal phase modulation for precise interferometric displacement measurements. Notably, the PicoScale measures temporal delays and detects any mechanical jitter introduced within the beam path. Integrating the interferometer into the experimental arrangement involves amplifying the PicoScale laser (1550 nm, CW) through an erbium-doped fiber amplifier and directing it parallel to the optical setup. This enables accurate tracking of the optical path difference between the pulses with attosecond precision. To facilitate lock-in measurements, an optical chopper modulates the NIR beam at a frequency of 5.882 kHz. For the presented measurements, the stage velocity is 0.4 mm/s.
Concentration Calculations
The number of molecules is calculated by the ideal gas law:
| (2) |
where, P = pressure, V = volume, n = Number of moles, R = ideal gas constant (8.314 J/mol K) and T = temperature in Kelvin. 3.2 m of beam propagation in the air with a beam diameter of 3.5 mm corresponds to a volume of 3.08 10-5 m3 (0.0308 L). At 22° C (295.15 K), the saturation vapor pressure of water () is 2.64 kPa. To calculate the partial pressure of water vapor , we use:
| (3) |
For RHs of 50 % and 8 %, the corresponding values for are 1.32 kPa and 0.211 KPa respectively. Using the equation 2, we have mol and mol.
For liquid water samples, we dissolved 10 and 20 L of deionized water in 1 mL of acetic acid buffer, corresponding to a Molarity of 0.555 M and 1.088 M, respectively (taking into account the density of water as 1 g/mL and the molar mass of water as 18.02 g/mol). For a beam diameter of 3.5 mm and an O-ring spacer of 0.5 mm, irradiated volume is calculated to be 4.81 L. To determine the number of moles in the irradiation volume, the irradiation volume is multiplied by the molarity of the corresponding solution. For 10 and 20 dissolved water, we obtain 2.64 mol and 5.23 mol, respectively.
For calculating the number of moles of ethanol at three different volumes of 4.81 , 0.55 , and 0.137 : firstly the corresponding mass was calculated by multiplying the volume and density. Afterward, the obtained values were divided by ethanol’s molar mass. Obtaining 0.79 g/ml as the density of ethanol, and 46.068 g/mol for its molar mass, the number of moles was calculated to be 82.5 mol, 16.5 mol, and 4.13 mol, respectively. Molar mass and density information for all compounds were retrieved from PubChem.[74].
Nonlinear propagation in both fibers
Field-resolved detection
Effectiveness of temporal gating in isolating discrete responses
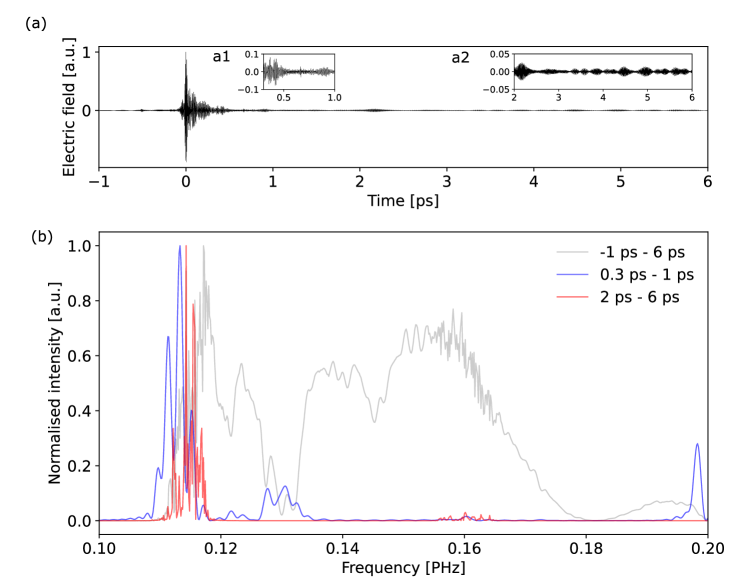
The dephasing duration of molecular response is subject to the molecular phase and varies from hundreds of femtoseconds in the liquid state to a few nanoseconds in the gas phase. Therefore, effective time filtering enables relative isolation of phase responses. Fig. 9 (a) shows the full trace of the measured electric field for ethanol, while a1 and a2 in the inset show two magnified regions of the trace at the trailing edge of the femtosecond excitation pulse corresponding to the short-lived liquid response, and long-lived gas response, respectively. The Fourier transform of different temporally gated areas of panel (a) is shown in panel (b). The black spectrum shows the Fourier Transform of the entire sampled field, while the blue spectrum shows the absorption peaks of ethanol corresponding to panel a1, and the red spectrum shows the absorption of atmospheric water vapor corresponding to Figure a2. The absorption band for the O-H stretch in ethanol and water overlaps.
References
- \bibcommenthead
- [1] Han, L. et al. Understanding the water structures by near-infrared and raman spectroscopy. Journal of Raman Spectroscopy 53, 1686–1693 (2022).
- [2] Blanco, M. & Villarroya, I. Nir spectroscopy: a rapid-response analytical tool. TrAC Trends in Analytical Chemistry 21, 240–250 (2002).
- [3] Espinoza, L. H., Lucas, D. & Littlejohn, D. Characterization of hazardous aqueous samples by near-ir spectroscopy. Applied spectroscopy 53, 97–102 (1999).
- [4] Marx, V. It’s free imaging—label-free, that is. Nature methods 16, 1209–1212 (2019).
- [5] Gowen, A. et al. On the feasibility of near infrared spectroscopy to detect contaminants in water using single salt solutions as model systems. Talanta 131, 609–618 (2015).
- [6] Fiddler, M. N. et al. Laser spectroscopy for atmospheric and environmental sensing. Sensors 9, 10447–10512 (2009).
- [7] Martin, P. A. Near-infrared diode laser spectroscopy in chemical process and environmental air monitoring. Chemical Society Reviews 31, 201–210 (2002).
- [8] Li-Chan, E., Chalmers, J. M. & Griffiths, P. R. Applications of Vibrational Spectroscopy in Food Science, 2 Volume Set (John Wiley & Sons, 2010).
- [9] Leighton, R. E., Alperstein, A. M. & Frontiera, R. R. Label-free super-resolution imaging techniques. Annual Review of Analytical Chemistry 15, 37–55 (2022).
- [10] Krafft, C. et al. Label-free molecular imaging of biological cells and tissues by linear and nonlinear raman spectroscopic approaches. Angewandte Chemie International Edition 56, 4392–4430 (2017).
- [11] Haas, J. & Mizaikoff, B. Advances in mid-infrared spectroscopy for chemical analysis. Annual Review of Analytical Chemistry 9, 45–68 (2016).
- [12] Burns, D. A. & Ciurczak, E. W. Handbook of near-infrared analysis (CRC press, 2007).
- [13] Beć, K. B. & Huck, C. W. Breakthrough potential in near-infrared spectroscopy: Spectra simulation. a review of recent developments. Frontiers in chemistry 7, 48 (2019).
- [14] Türker-Kaya, S. & Huck, C. W. A review of mid-infrared and near-infrared imaging: principles, concepts and applications in plant tissue analysis. Molecules 22, 168 (2017).
- [15] Kuda-Malwathumullage, C. P. & Small, G. W. Determination of temperatures of aqueous-based samples directly from near infrared spectra. Journal of Near Infrared Spectroscopy 25, 289–300 (2017).
- [16] Beć, K. B., Grabska, J. & Huck, C. W. Near-infrared spectroscopy in bio-applications. Molecules 25, 2948 (2020).
- [17] McClure, W. F. 204 years of near infrared technology: 1800–2003. Journal of Near Infrared Spectroscopy 11, 487–518 (2003).
- [18] Pasquini, C. Near infrared spectroscopy: A mature analytical technique with new perspectives–a review. Analytica chimica acta 1026, 8–36 (2018).
- [19] Whetsel, K. B. Near-infrared spectrophotometry. Applied Spectroscopy Reviews 2, 1–67 (1968).
- [20] Zolot, A. M. et al. Broad-band frequency references in the near-infrared: Accurate dual comb spectroscopy of methane and acetylene. Journal of Quantitative Spectroscopy and Radiative Transfer 118, 26–39 (2013).
- [21] Zhu, F. et al. Real-time dual frequency comb spectroscopy in the near infrared. Applied Physics Letters 102 (2013).
- [22] Iwakuni, K. et al. Ortho-para-dependent pressure effects observed in the near infrared band of acetylene by dual-comb spectroscopy. Physical review letters 117, 143902 (2016).
- [23] Coddington, I., Newbury, N. & Swann, W. Dual-comb spectroscopy. Optica 3, 414–426 (2016).
- [24] Barreiro, R., Sanabria-Macías, F., Posada, J., Martín-Mateos, P. & de Dios, C. Experimental demonstration of a new near-infrared spectroscopy technique based on optical dual-comb: Dc-nirs. Scientific Reports 13, 10924 (2023).
- [25] Andrews, N. L. et al. Quantification of different water species in acetone using a nir-triple-wavelength fiber laser. Optics Express 22, 19337–19347 (2014).
- [26] Sommer, A. et al. Attosecond nonlinear polarization and light–matter energy transfer in solids. Nature 534, 86–90 (2016).
- [27] Riek, C. et al. Direct sampling of electric-field vacuum fluctuations. Science 350, 420–423 (2015).
- [28] Itatani, J. et al. Attosecond streak camera. Physical review letters 88, 173903 (2002).
- [29] Goulielmakis, E. et al. Direct measurement of light waves. Science 305, 1267–1269 (2004).
- [30] Keiber, S. et al. Electro-optic sampling of near-infrared waveforms. Nature Photonics 10, 159–162 (2016).
- [31] Cho, W. et al. Temporal characterization of femtosecond laser pulses using tunneling ionization in the uv, visible, and mid-ir ranges. Scientific Reports 9, 16067 (2019).
- [32] Park, S. B. et al. Direct sampling of a light wave in air. Optica 5, 402–408 (2018).
- [33] Saito, N., Ishii, N., Kanai, T. & Itatani, J. All-optical characterization of the two-dimensional waveform and the gouy phase of an infrared pulse based on plasma fluorescence of gas. Optics Express 26, 24591–24601 (2018).
- [34] Alismail, A. et al. Multi-octave, cep-stable source for high-energy field synthesis. Science advances 6, eaax3408 (2020).
- [35] Korobenko, A. et al. Femtosecond streaking in ambient air. Optica 7, 1372–1376 (2020).
- [36] Sederberg, S. et al. Attosecond optoelectronic field measurement in solids. Nature communications 11, 430 (2020).
- [37] Sulzer, P. et al. Determination of the electric field and its hilbert transform in femtosecond electro-optic sampling. Physical Review A 101, 033821 (2020).
- [38] Zimin, D. et al. Petahertz-scale nonlinear photoconductive sampling in air. Optica 8, 586–590 (2021).
- [39] Liu, Y. et al. All-optical sampling of few-cycle infrared pulses using tunneling in a solid. Photonics Research 9, 929–936 (2021).
- [40] Hui, D. et al. Attosecond electron motion control in dielectric. Nature Photonics 16, 33–37 (2022).
- [41] Zimin, D. A., Yakovlev, V. S. & Karpowicz, N. Ultra-broadband all-optical sampling of optical waveforms. Science Advances 8, eade1029 (2022).
- [42] Ridente, E. et al. Electro-optic characterization of synthesized infrared-visible light fields. Nature communications 13, 1111 (2022).
- [43] Altwaijry, N. et al. Broadband photoconductive sampling in gallium phosphide. Advanced Optical Materials 11, 2202994 (2023).
- [44] Luo, Y., Martin-Jimenez, A., Neubrech, F., Liu, N. & Garg, M. Synthesis and direct sampling of single-cycle light transients by electron tunneling in a nanodevice. ACS Photonics 10, 2866–2873 (2023).
- [45] Kempf, H., Sulzer, P., Liehl, A., Leitenstorfer, A. & Tenne, R. Few-femtosecond phase-sensitive detection of infrared electric fields with a third-order nonlinearity. Communications Physics 6, 145 (2023).
- [46] Yeung, M. et al. Lightwave electronic harmonic frequency mixing. arXiv preprint arXiv:2307.15145 (2023).
- [47] Herbst, A. et al. Recent advances in petahertz electric field sampling. Journal of Physics B: Atomic, Molecular and Optical Physics (2022).
- [48] Mamaikin, M., Ridente, E., Altwaijry, N., Weidman, M. & Karpowicz, N. Contrast enhancement in near-infrared electro-optic imaging. Optics Express 30, 18179–18188 (2022).
- [49] Barh, A., Rodrigo, P. J., Meng, L., Pedersen, C. & Tidemand-Lichtenberg, P. Parametric upconversion imaging and its applications. Advances in Optics and Photonics 11, 952–1019 (2019).
- [50] Okamoto, T. et al. Operation at 1 mhz of 1.7-cycle multiple plate compression at 35-w average output power. Optics Letters 48, 2579–2582 (2023).
- [51] Goncharov, S., Fritsch, K. & Pronin, O. Few-cycle pulse compression and white light generation in cascaded multipass cells. Optics Letters 48, 147–150 (2023).
- [52] Baltuška, A., Wei, Z., Pshenichnikov, M. S. & Wiersma, D. A. Optical pulse compression to 5 fs at a 1-mhz repetition rate. Optics letters 22, 102–104 (1997).
- [53] Köttig, F., Schade, D., Koehler, J., Russell, P. S. J. & Tani, F. Efficient single-cycle pulse compression of an ytterbium fiber laser at 10 mhz repetition rate. Optics Express 28, 9099–9110 (2020).
- [54] Porer, M., Ménard, J.-M. & Huber, R. Shot noise reduced terahertz detection via spectrally postfiltered electro-optic sampling. Optics letters 39, 2435–2438 (2014).
- [55] Travers, J. C., Chang, W., Nold, J., Joly, N. Y. & Russell, P. S. J. Ultrafast nonlinear optics in gas-filled hollow-core photonic crystal fibers. JOSA B 28, A11–A26 (2011).
- [56] Russell, P. S. J., Hölzer, P., Chang, W., Abdolvand, A. & Travers, J. Hollow-core photonic crystal fibres for gas-based nonlinear optics. Nature Photonics 8, 278–286 (2014).
- [57] Schade, D. et al. Scaling rules for high quality soliton self-compression in hollow-core fibers. Optics Express 29, 19147–19158 (2021).
- [58] Koehler, J., Köttig, F., Schade, D., Russell, P. S. J. & Tani, F. Post-recombination effects in confined gases photoionized at megahertz repetition rates. Optics Express 29, 4842–4857 (2021).
- [59] Fattahi, H., Schwarz, A., Keiber, S. & Karpowicz, N. Efficient, octave-spanning difference-frequency generation using few-cycle pulses in simple collinear geometry. Optics letters 38, 4216–4219 (2013).
- [60] Levine, I. N. Molecular spectroscopy (Wiley, 1975).
- [61] Gordon, I. et al. The hitran2020 molecular spectroscopic database. Journal of quantitative spectroscopy and radiative transfer 277, 107949 (2022).
- [62] Falk, M. The frequency of the hoh bending fundamental in solids and liquids. Spectrochimica Acta Part A: Molecular Spectroscopy 40, 43–48 (1984).
- [63] Bruenig, F. N., Geburtig, O., Canal, A. v., Kappler, J. & Netz, R. R. Time-dependent friction effects on vibrational infrared frequencies and line shapes of liquid water. The Journal of Physical Chemistry B 126, 1579–1589 (2022).
- [64] Davies, A. & Rutland, S. G. Identification of an oh, ch combination band in the near infrared spectrum of ethanol. Spectrochimica Acta Part A: Molecular Spectroscopy 44, 1143–1145 (1988).
- [65] Sharpe, S. W. et al. Gas-phase databases for quantitative infrared spectroscopy. Applied spectroscopy 58, 1452–1461 (2004).
- [66] Jimenez, R., Fleming, G. R., Kumar, P. & Maroncelli, M. Femtosecond solvation dynamics of water. Nature 369, 471–473 (1994).
- [67] Perakis, F. et al. Vibrational spectroscopy and dynamics of water. Chemical reviews 116, 7590–7607 (2016).
- [68] Maiuri, M., Garavelli, M. & Cerullo, G. Ultrafast spectroscopy: State of the art and open challenges. Journal of the American Chemical Society 142, 3–15 (2014).
- [69] Crowell, R. A., Holtom, G. R. & Xie, X. S. Infrared free induction decay of liquid water molecules. The Journal of Physical Chemistry 99, 1840–1842 (1995).
- [70] Pupeza, I. et al. Field-resolved infrared spectroscopy of biological systems. Nature 577, 52–59 (2020).
- [71] Kowligy, A. S. et al. Infrared electric field sampled frequency comb spectroscopy. Science Advances 5, eaaw8794 (2019).
- [72] Couture, N. et al. Single-pulse terahertz spectroscopy monitoring sub-millisecond time dynamics at a rate of 50 khz. Nature Communications 14, 2595 (2023).
- [73] Schweinberger, W. et al. Interferometric delay tracking for low-noise mach-zehnder-type scanning measurements. Optics Express 27, 4789–4798 (2019).
- [74] Kim, S. et al. Pubchem 2023 update. Nucleic acids research 51, D1373–D1380 (2023).
- [75] Tani, F., Travers, J. C. & Russell, P. S. J. Multimode ultrafast nonlinear optics in optical waveguides: numerical modeling and experiments in kagomé photonic-crystal fiber. JOSA B 31, 311–320 (2014).
- [76] Zeisberger, M. & Schmidt, M. A. Analytic model for the complex effective index of the leaky modes of tube-type anti-resonant hollow core fibers. Scientific reports 7, 11761 (2017).
- [77] Arisholm, G. General numerical methods for simulating second-order nonlinear interactions in birefringent media. JOSA B 14, 2543–2549 (1997).