Vittorio Pippivittorio.pippi@unimore.it
\addauthorFabio Quattrinifabio.quattrini@unimore.it
\addauthorSilvia Cascianellisilvia.cascianelli@unimore.it
\addauthorRita Cucchiararita.cucchiara@unimore.it
\addinstitution
University of Modena and Reggio Emilia
Modena, IT
\scorename: A Novel Evaluation Score for Styled HTG
Supplementary Material for
\scorename: A Novel Evaluation Score for
Styled Handwritten Text Generation
1 Additional Results on the Sensitivity to Handwriting
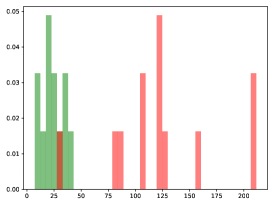
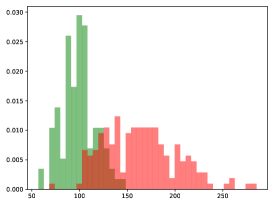
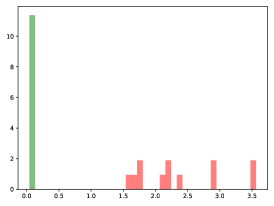
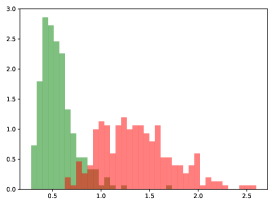
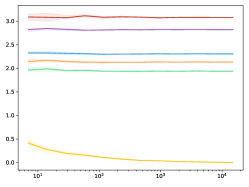
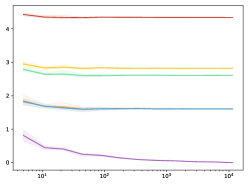
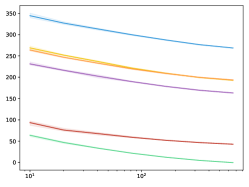
In this section, we report the results on the sensitivity of the \scorename and the FID to the handwriting style obtained on the Norhand and BanglaWriting multi-author datasets. We consider half of the samples for each featured writer as references and the other half as if they were the output of a perfect Styled HTG model. Then, we compare the distributions of the \scorename and the FID values computed on text images of multiple matching and non-matching authors pairs. The obtained distributions are reported in Figure 1.
| NorHand | Bangla Writing | |
|
FID |
 |
 |
|
\scorename
|
 |
 |
2 Further Comparison Between HTG Approaches
In Table 1, we report some qualitative examples of images generated by two HTG approaches being scored with both FID and HWD. These show that HWD better separates cases in which HTG models perform one better than the other, compared to the FID, which has similar values both for good cases and failure cases.
| Reference | VATr | HWT | |||
| HWD | FID | HWD | FID | ||
|
|
|
|
|||
| 0.84 | 128.4 | 1.09 | 128.7 | ||
|
|
|
|
|||
| 0.70 | 111.7 | 0.93 | 111.9 | ||
|
|
|
|
|||
| 0.60 | 86.6 | 0.92 | 86.7 | ||
3 Alternative Metric Distances for HWD
In Table 2 we report the results obtained on the IAM dataset when using Mahalanobis and the Hamming distances in the final step of the HDW computation. It emerges that the Euclidean distance works best for HWD, leading to the smaller Overlap and EER.
| Distance | Overlap | EER |
| Mahalanobis | 7.4 | 3.6 |
| Hamming | 4.3 | 2.1 |
| Euclidean | 0.7 | 0.3 |
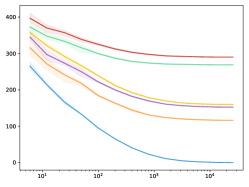
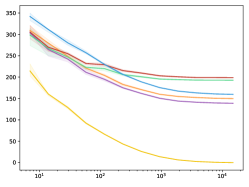
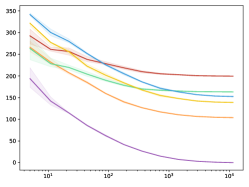
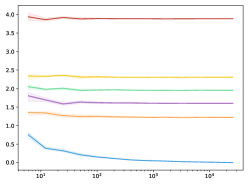
4 Additional Results on the Sensitivity to the Number of Samples
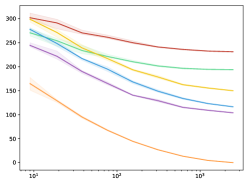
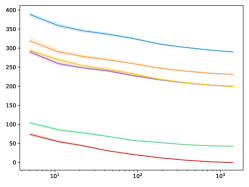
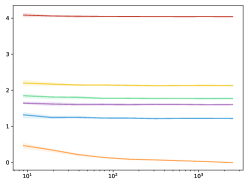
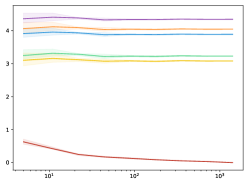
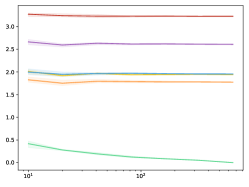
In this section, we report further results on the numerical stability of the proposed \scorename, compared to the FID and two baseline scores, namely the FID w/ Euclidean (obtained by computing the Euclidean distance on the Inception-v3 features) and HWD w/ Fréchet (obtained by computing the Fréchet distance on the VGG16). In particular, we use the images from the considered single-author datasets (ICFHR14, Saint Gall, Leopardi, Rodrigo, Washington, and LAM). The results are expressed as mean and range between the 25th and 75th percentiles of the values obtained over multiple runs by varying the number of samples. These are reported in Figure 2. For the plots in each row, we consider the whole indicated dataset as the set of reference images and compute the score when comparing it with a variable number of samples from the other datasets and from the dataset itself for reference.
| LAM | Rodrigo | ICFHR14 | |
|
FID |
 |
 |
 |
|
HWD |
 |
 |
 |
| Leopardi | Saint Gall | Washington | |
|
FID |
 |
 |
 |
|
HWD |
 |
 |
 |
| LAM | Rodrigo | ICFHR14 | Leopardi | Saint Gall | Washington |
5 Computation Time Comparison
We consider the computation time, consisting of image representation and distance computation, of FID and HDW on the same hardware and data. Computing the FID score on 25823/25823 real/fake images from the LAM dataset takes 426.12s + 9.03s (image representation + distance computation), while the computation time of HWD is 135.50s + 0.01s.