The contact binary system TYC 7275-1968-1 as seen by optical, UV and X-ray observations
Abstract
We present an analysis of publicly available X-ray and optical observations of TYC 7275-1968-1, a contact binary, red nova progenitor candidate. The long optical time series of ASAS-3, SuperWASP, CRTS, Gaia, ASAS-SN, and TESS enabled us to improve its orbital period to 0.3828071 0.0000026 d. We show the presence of an X-ray and UV source associated with TYC 7275-1968-1 from Neil Gehrels Swift Observatory, that was previously assumed to be the counterpart of CD -36 8436 (V1044 Cen), a symbiotic star located 22 arcsec from the red nova candidate. The X-ray data indicate the presence of a region with a temperature of = 0.8 keV and a luminosity of 1.4 1031 erg s -1 in the range 0.3 – 10 keV. The detection of X-rays and modulated UV emission suggests that both components of the binary are chromospherically active.
keywords:
(stars:) binaries: eclipsing , stars: mass loss , stars: individual (TYC 7275-1968-1)[label1]organization=CONICET-Universidad de Buenos Aires, Instituto de Astronomía y Física del Espacio (IAFE), addressline=Av. Inte. Güiraldes 2620, city=Buenos Aires, postcode=C1428ZAA, country=Argentina \affiliation[label2]organization=Universidad Nacional de San Juan, Facultad de Ciencias Exactas, Físicas y Naturales, addressline=Av. Ignacio de la Roza 590 (O), Complejo Universitario ”Islas Malvinas”, city=Rivadavia, postcode=J5402DCS, state=San Juan, country=Argentina
[label3]organization=Instituto Nacional de Pesquisas Espaciais (INPE/MCTI), addressline=Av. dos Astronautas, 1758, city=São José dos Campos, state=São Paulo, country=Brazil
[label4]organization=CONICET-Universidad Nacional de Hurlingham, addressline=Av. Gdor. Vergara 2222, city=Villa Tesei, state=Buenos Aires, country=Argentina
[label5]organization=IP&D, Universidade do Vale do Paraíba, addressline=Av. Shishima Hifumi, 2911, Urbanova, 12244-000, city=São José dos Campos, state=São Paulo, country=Brazil
1 Introduction
Red novae and luminous red novae are considered the result of mergers of contact binary systems, which can eject the common envelope (e.g., Pastorello et al., 2019). The resulting optical transients show luminosities between those of classical novae and supernovae, and they have atypical red colors. Kochanek et al. (2014) predicted an occurrence rate for a merger of about to yr-1 for bright red novae in our Galaxy, such as V838 Mon and V1309 Sco. Indeed, nova V838 Mon (MV 7 mag) is proposed to be the result of a stellar merger, but its progenitor still remains unidentified. So far, V1309 Sco (MV 10 mag) is the only red nova unambiguously originated from the merging of a low mass-ratio contact binary system that was known before the red nova event (Mason et al., 2010).
Wadhwa et al. (2022b) proposed to identify potential red-nova progenitors based on the temperature of the components, mass ratio (), and amplitude of the light curve determined by some geometrical parameters such as the degree of contact and inclination. The low-mass-contact-binary systems (0.6 M M1.4 M⊙) candidates to red-nova progenitors have a narrow period range from 0.27 d to 0.4 d with a peak near 0.35 d (see Figure 3 of Wadhwa et al. 2022b). These systems tend to have a dynamically unstable orbit. However, it is possible that periods above 0.5 d can also present orbital instabilities if the mass ratio is extremely low (, see Figure 63 of Kobulnicky et al. 2022).
TYC 7275-1968-1 (from now on TYC 7275), also catalogued as CRTS J131559.4-370018, was first identified as an eclipsing binary by the Catalina Real-Time Transient Survey (CRTS) with an orbital period of 0.382807 d and a mean magnitude of 11.37 mag with a dispersion of few tenths of mag in V band (Drake et al., 2017). It is a low-mass binary and a candidate to red-nova progenitor with an inclination of 69.8 1.5∘, 0.075, and deep contact (up to 95%), indicating that the temperatures of the components are similar (Wadhwa et al., 2022a). X-ray emission was detected by ROSAT at less than 20 arcsec from TYC 7275, with an exposure time of 351 s and a count rate of 3.18 10-2 counts s-1 (Voges et al., 2000). The measured flux was 3.36 10-13 erg cm-2 s-1 and the luminosity was estimated to be 4.27 1030 ergs s-1 at a quoted distance of 326.7 60 pc (Wadhwa et al., 2022a).
In this work we report the analysis of ASAS-3, SuperWASP, CRTS, Gaia, ASAS-SN, TESS and Swift data of TYC 7275. In Section 2.1, we present the optical data, while Section 2.2 presents the Swift data. Section 3.1 and Section 3.2 show the results of optical time series and X-ray spectral analysis, respectively. The discussion and conclusion are summarized in Section 4.
2 Observations
2.1 Optical data
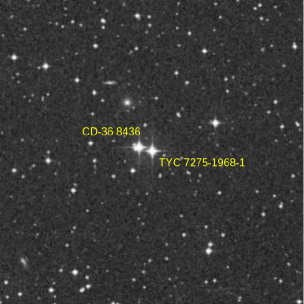
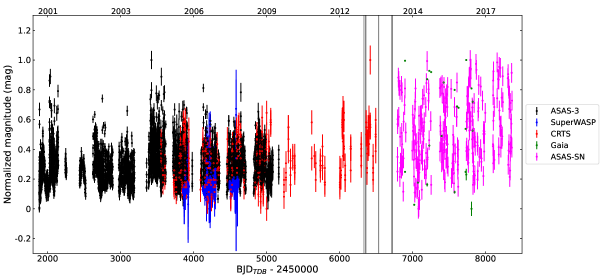
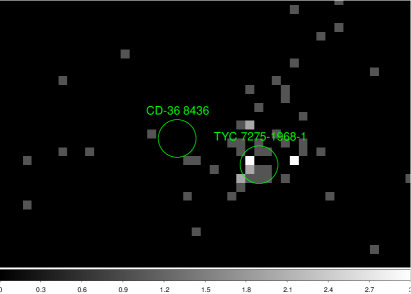
The Digitized Sky Survey (DSS, Lasker et al., 1990) optical image of the field of TYC 7275 is shown in Figure 1. TYC 7275 and the symbiotic star CD -36 8436 have similar magnitudes in the V band, around 11 mag. Asides the CRTS photometric monitoring, TYC 7275 was also observed by the ASAS-3 and ASAS-SN surveys in V band (Pojmański, 2001; Shappee et al., 2014), where it is cataloged as ASASSN-V J131559.62-370018.8, and by the SuperWASP survey in a broad visible band, where it is registered as 1SWASP J131559.55-370017.7, and by Gaia in the G passband, which covers a wavelength range from the near ultraviolet (330 nm) to the near infrared (1050 nm), where it is identified as Gaia DR3 6165817018204434816. The long-term light curves are presented in the upper panel of Figure 2. We converted the time HJDUTC from ASAS-3, ASAS-SN, SuperWASP, and CRTS surveys and BJDTCB from Gaia into BJDTDB using routines in Astropy and Eastman’s time utilities111See Eastman’s website in https://astroutils.astronomy.osu.edu/time/ (Eastman et al., 2010; Astropy Collaboration et al., 2013). The time standard given by TESS is already BJDTDB. We also normalized the magnitude or flux in order to enable a direct comparison. The normalization converted the observed values of each dataset to the interval between 0 and 1. The average magnitudes and colors are given in Table 1 for all available surveys including Tycho-2 and 2MASS.
| Surveys | Band | Magnitudes | (Bp-Rp)Gaia | (B-V)Tycho-2 | (J-H)2MASS | (H-K)2MASS | (J-K)2MASS | Reference |
|---|---|---|---|---|---|---|---|---|
| (nm) | (mag) | (mag) | (mag) | (mag) | (mag) | |||
| ASAS-3 | 551 | 10.73 | Pojmański (2001) | |||||
| SuperWASP | 400 - 700 | 10.66 | Pollacco et al. (2006) | |||||
| CRTS | 540 | 11.37 | Drake et al. (2009) | |||||
| Gaia | 330 - 1050 | 11.41 | 0.86 | Gaia Collaboration (2020) | ||||
| ASAS-SN | 551 | 11.46 | Shappee et al. (2014) | |||||
| Tycho-2 | 425 | 12.18 | 0.69 | Høg et al. (2000) | ||||
| Tycho-2 | 525 | 11.49 | Høg et al. (2000) | |||||
| 2MASS | 1250 | 10.28 | 0.29 | Cutri et al. (2003) | ||||
| 2MASS | 1650 | 9.99 | 0.08 | Cutri et al. (2003) | ||||
| 2MASS | 2170 | 9.91 | 0. 37 | Cutri et al. (2003) |
TESS observed TYC 7275 in Sector 37 during 25.32 days, between 2021 April 2 and 2021 April 28. Recently, the source has also been observed in Sector 64 during 2023 April 6 to May 3, totalizing 26.29 days of data. Both SAP (Simple Aperture Photometry) and PDCSAP (Pre-search Data Conditioning SAP) light curves from Sector 37 are available from the Quick-Look Pipeline (QLP), with a 10 min cadence. We used the PDCSAP flux for Sector 37, and extracted the Sector 64 light curve from 2 min cadence Full Frame Images (FFIs) using the Lightkurve Python package (Lightkurve Collaboration et al., 2018). The TESS detectors have a plate scale of 21 arcsec per pixel (Ricker et al., 2015), so each pixel is large enough to contain multiple stars. All TESS light curves (SAP, PDCSAP, and ours) were produced with an aperture mask that blends the fluxes from TYC 7275 (with 11.46 Gaia magnitude), from the symbiotic star CD-36 8436 (Gmag = 9.81) and also from several other fainter sources (with Gmag). The normalized TESS light curves of TYC 7275 are shown in the lower panel of Figure 2, in which the long-term trend of the fluxes is removed. Our analysis of TESS data is based in these light curves.
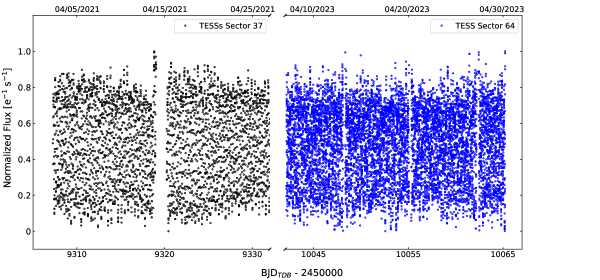
We applied the open-source Python package TESSLocalize (Higgins & Bell, 2022) to the TESS Target Pixel File (TPF) data of TYC 7275. TESSLocalize can locate a variable source in a crowded field to better than one fifth of a pixel, using prior knowledge of the source’s periodicity. We used the period of 0.382807 d already known from Drake et al. (2017), and also an harmonic of that period (0.191403 d) that is present in the TESS data (see Sect. 3.1). The code calculates the relative probability that the source is correlated with the positions of stars from the Gaia archive using the pixel response function (PRF222See https://heasarc.gsfc.nasa.gov/docs/tess/observing-technical.html#point-spread-function). For this set of data, the code confirmed the position of the variable source at the exact Gaia coordinates of TYC 7275 (see Figure 3) with a relative likelihood of 91.8%.
The light curves of TYC 7275 provided by the CRTS and by TESS are shown in Figure 2 using daily average magnitudes. We notice that in the TESS band, the magnitude increases about 0.05 mag during the 26 days of observation and this behavior also occurs when comparing it with CRTS data. This long-term variation can not be associated with the orbital motion. The TESS detector passband covers a wide red wavelength range, between 600 and 1000 nm, centered on the Cousins I band. While, the CRTS observations were obtained during 8 years in V band, ranging from 11.2 to 11.6 magnitudes. The ID source in CRTS is 3037080042793.
2.2 Neil Gehrels Swift data
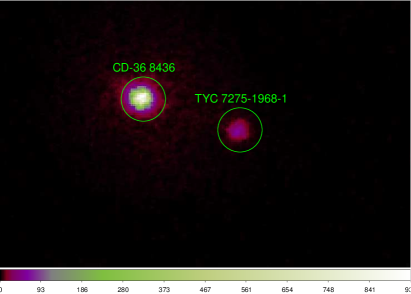
TYC 7275 is in the FoV of the Swift X-ray Telescope (XRT) observations listed in Table 2. The Swift catalog333see https://www.swift.ac.uk/swift_live/index.php presents an X-ray source associated with CD -36 8436 ( = 13h 16m 01.37s, = -37∘ 00 10.77), a symbiotic star located 22 arcsec from the coordinates of TYC 7275 ( = 13h 15m 59.55s, = -37∘ 00 17.73). Our analysis of the Swift data shows that the X-ray emission is associated with TYC 7275 and not with CD -36 8436 (Figure 4a). No X-ray emission from the symbiotic system is detected.
| Date | ObsId | XRT exp. time | UVOT exp. time | Cycles |
|---|---|---|---|---|
| (ks) | (ks) | |||
| 2013 Feb 09 | 00091459002 | 5.9 | 0.7 | 2.0 |
| 2013 Mar 03 | 00091459004 | 0.1 | 0.1 | 0.1 |
| 2013 Mar 09 | 00091459005 | 2.5 | 0.2 | 0.3 |
| 2013 Aug 30 | 00091748001 | 1.2 | 0.6 | 0.4 |
| 2013 Aug 31 | 00091748002 | 0.2 | 0.6 | 3.2 |
| 2014 Feb 25 | 00091748005 | 0.1 | 0.1 | 0.1 |
| 2014 Feb 28 | 00091748006 | 0.6 | 0.6 | 0.1 |
| 2014 Mar 11 | 00091748007 | 0.1 | 0.2 | 0.1 |
(a) Swift/XRT
(b) Swift/UVOT
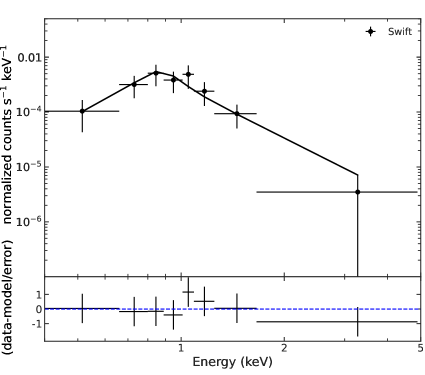
We obtained the X-ray spectrum of TYC 7275 using the online Swift/XRT tool444See build Swift-XRT products in https://www.swift.ac.uk/user_objects/ provided by the UK Swift Science Data Center at the University of Leicester (Evans et al., 2009). The spectrum is calculated combining all the available observations (see Table 2). Swift detected the source with an average count rate of 0.0029 0.0005 counts s-1.
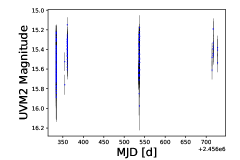
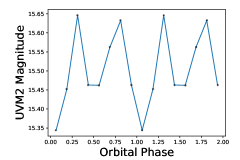
Simultaneously with the X-ray Telescope, Swift observed the field of TYC 7275 with the UVOT telescope in the event mode with the UVM2 filter (2246 Å, Figure 4b). From the event files provided by the pipeline, we first filtered for bad events using the uvotscreeen script and then extracted the source events from a circular region of 5 arcsec radius, while background events were extracted from an off-source circular region with 20 arcsec radius. The light curves, with 60 s bins, were extracted using the uvotevtlc script.
3 Results
3.1 Timing analysis
In order to search for the orbital period in the optical light curves, we used the Lomb-Scargle (LS) periodogram (Lomb, 1976; Scargle, 1982) from the software PERANSO (Paunzen & Vanmunster, 2016). We also applied other methods such as the Generalized Lomb-Scargle (GLS), the Discrete Fourier Transform (DFT), the Date Compensated Discrete Fourier Transform (DCDFT), and the Fourier Analysis of Light Curves (FALC). The periods obtained using the different methods are consistent with each other. As the flux modulation has a sinusoidal shape, we opted to present the results from the LS method. Table 3 shows the period and its errors obtained using the data from individual and combined datasets. In general, we found the period of 0.1914035 d. The mean epoch of each survey in units of BJDTDB is also given in this table.
| Surveys | Initial Time | Cyclesa | Period | Period error |
|---|---|---|---|---|
| (BJDTDB) | (d) | (d) | ||
| ASAS-3 | 2452665.855859 | 5882 | 0.1914033 | 0.0000022 |
| SuperWASP | 2453860.217572 | 1964 | 0.1914049 | 0.0000053 |
| CRTS | 2453607.876401 | 4647 | 0.1914035 | 0.0000013 |
| Gaia | 2456897.46333001 | 2420 | 0.1914035 | 0.0000053 |
| ASAS-SN | 2455955.148353 | 11045 | 0.1914035 | 0.0000013 |
| TESS Sector 37 | 2459307.25853093 | 66 | 0.1914101 | 0.0000501 |
| TESS Sector 64 | 2460042.12165516 | 60 | 0.1913940 | 0.0000633 |
| All TESS | 2459307.25853093 | 1980 | 0.1914035 | 0.0000026 |
| All data | 0.1914035 | 0.0000013 |
- the number of cycles enclosed in the time interval of the observations of each survey.
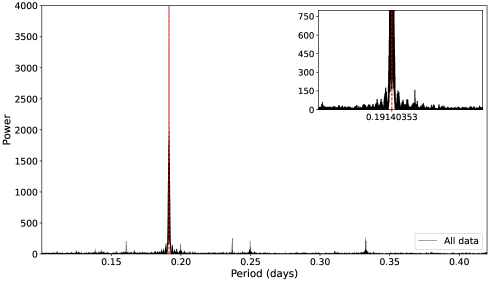
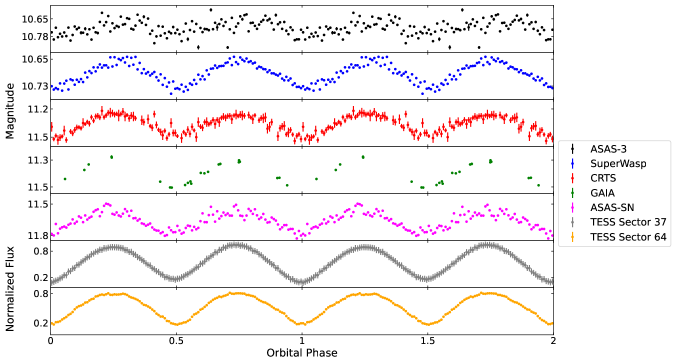
Using all data combined, we found a strong signal on the power spectrum at 0.1914035 0.0000013 d (see Figure 5). This period is the first harmonic of the orbital period of 0.3828071 0.0000026 d. The light curves of all data sets folded in this period and binned at 120 bins/cycle are shown in Figure 6, where we used the ephemeris:
| (1) |
where the phase zero was visually defined inspecting the phase-folded of TESS-Sector 37.
In the Swift/UVOT UVM2 filter, TYC 7275 is much fainter than the symbiotic star CD -36 8436 (see Figure 4b), and because of the scarcity of UV signal we did not search for periodicities in the UV data. Figure 7 shows the UVM2 light curve and folded light curve in the orbital period, where both primary and secondary eclipses are detected.
3.2 XRT spectral analysis
In spite of this low counts, we performed a simple spectral fit using a model consisting of an optically thin thermal plasma (APEC) modified by an absorber (tbabs). The spectrum is presented in Figure 8. We obtained the absorbing column density of N(H) = 0.17 1022 cm-2 and kT = 0.8 keV. The metal abundance was 0.23 (Wilms et al., 2000). Taking into account the above model, we obtained an unabsorbed X-ray flux of 1.2 10-13 erg s -1 cm-2, which converts to a luminosity of 1.4 1031 erg s -1 at a distance of 317 pc as given by Gaia (EDR3) (Bailer-Jones et al., 2021).
4 Discussion and conclusions
In this work, we present an analysis of X-ray and optical data from Swift, ASAS-3, SuperWASP, CRTS, Gaia, ASAS-SN, and TESS of a recently classified red nova progenitor, the contact binary system TYC 7275. The current study shows that the X-ray emission detected by Swift, as well as the optical variability measured by TESS, belongs to this object and not to the symbiotic star CD -36 8436 as previously registered, which is located 22 arcsec from TYC 7275.
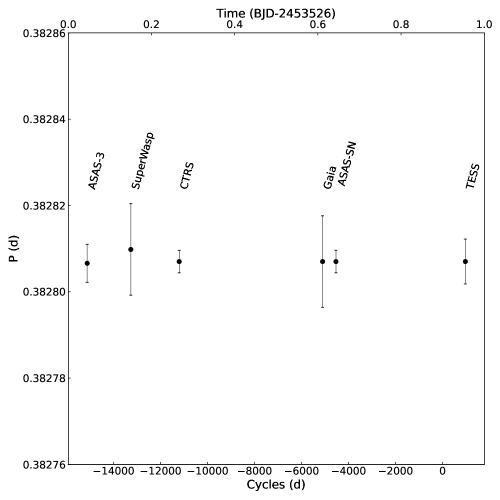
The optical photometry data were used to improve the orbital period of estimate to 0.3828071(26) d. This orbital period and the low mass ratio indicate that the system can be orbitally unstable and prone to a merger event (Wadhwa et al., 2022a, b). However, we did not detected a significant period variation during the 22 years of optical observations, as shown in Figure 9 and Table 3.
The temperature of the hot component can be estimated using Gaia intrinsic color and interstellar extinction (Bakış & Eker, 2022). Adopting a Gaia color of 0.865942 mag and an extinction, A(V), of 0.1 mag, we obtained a temperature of 5600 K, which is similar to the models with unspotted and spotted solutions proposed by Wadhwa et al. (2022a).
The X-ray spectrum from Swift can be adequately modeled with an absorbed optically thin thermal plasma with a temperature of = 0.8. This X-ray emission probably originates in a corona around the contact binary. The X-ray luminosity measured by Swift is 1.4 1031 erg s-1 and is higher than that reported by Stȩpień et al. (2001) and Wadhwa et al. (2022a) of 1.71030 ergs s-1 from ROSAT observations. This change in luminosity suggests that the components of the binary might be magnetically active (Applegate, 1992).
5 Acknowledgments
IJL, GJML, and NEN acknowledge support from grant ANPCYT-PICT 0901/2017. GJML and NEN are members of the CIC-CONICET (Argentina). ACM thanks the Brazilian Conselho Nacional de Desenvolvimento Científico e Tecnológico – CNPq (Proc: 382618/2021-1). ASO acknowledges São Paulo Research Foundation (FAPESP) for financial support under grant #2017/20309-7. CVR thanks CNPq (Proc: 310930/2021-9). NP thanks the Coordenação de Aperfeiçoamento de Pessoal de Nível Superior – Brazil (CAPES) for the financial support under grant 88887.823264/2023-00. This research made use of Lightkurve, a Python package for Kepler and TESS data analysis (Lightkurve Collaboration, 2018). We acknowledge ASAS-3, SuperWASP, CRTS, Gaia, ASAS-SN and Astropy Collaboration. The authors are also grateful to the TESS High Level Science Products (HLSP) produced by the Quick-Look Pipeline (QLP) at the TESS Science Office at MIT, which are publicly available from the Mikulski Archive for Space Telescopes (MAST). Funding for the TESS mission is provided by NASA’s Science Mission directorate.
References
- Applegate (1992) Applegate, J. H. 1992, in Astronomical Society of the Pacific Conference Series, Vol. 26, Cool Stars, Stellar Systems, and the Sun, ed. M. S. Giampapa & J. A. Bookbinder, 343
- Astropy Collaboration et al. (2013) Astropy Collaboration, Robitaille, T. P., Tollerud, E. J., et al. 2013, Astronomy & Astrophysics, 558, A33, doi: 10.1051/0004-6361/201322068
- Bailer-Jones et al. (2021) Bailer-Jones, C. A. L., Rybizki, J., Fouesneau, M., Demleitner, M., & Andrae, R. 2021, The Astrophysical Journal, 161, 147, doi: 10.3847/1538-3881/abd806
- Bakış & Eker (2022) Bakış, V., & Eker, Z. 2022, Acta Astronomica, 72, 195, doi: 10.32023/0001-5237/72.3.4
- Cutri et al. (2003) Cutri, R. M., Skrutskie, M. F., van Dyk, S., et al. 2003, VizieR Online Data Catalog, II/246
- Drake et al. (2009) Drake, A. J., Djorgovski, S. G., Mahabal, A., et al. 2009, The Astronomical Journal, 696, 870, doi: 10.1088/0004-637X/696/1/870
- Drake et al. (2017) Drake, A. J., Djorgovski, S. G., Catelan, M., et al. 2017, Monthly Notices of the Royal Astronomical Society, 469, 3688, doi: 10.1093/mnras/stx1085
- Eastman et al. (2010) Eastman, J., Siverd, R., & Gaudi, B. S. 2010, Publications of the Astronomical Society of the Pacific, 122, 935, doi: 10.1086/655938
- Evans et al. (2009) Evans, P. A., Beardmore, A. P., Page, K. L., et al. 2009, Monthly Notices of the Royal Astronomical Society, 397, 1177, doi: 10.1111/j.1365-2966.2009.14913.x
- Gaia Collaboration (2020) Gaia Collaboration. 2020, VizieR Online Data Catalog, I/350
- Higgins & Bell (2022) Higgins, M. E., & Bell, K. J. 2022, TESS-Localize: Localize variable star signatures in TESS Photometry, Astrophysics Source Code Library, record ascl:2204.005. http://ascl.net/2204.005
- Høg et al. (2000) Høg, E., Fabricius, C., Makarov, V. V., et al. 2000, Astronomy & Astrophysics, 355, L27
- Kobulnicky et al. (2022) Kobulnicky, H. A., Molnar, L. A., Cook, E. M., & Henderson, L. E. 2022, The Astrophysical Journal Supplement Series, 262, 12, doi: 10.3847/1538-4365/ac75bd
- Kochanek et al. (2014) Kochanek, C. S., Adams, S. M., & Belczynski, K. 2014, Monthly Notices of the Royal Astronomical Society, 443, 1319, doi: 10.1093/mnras/stu1226
- Lasker et al. (1990) Lasker, B. M., Sturch, C. R., McLean, B. J., et al. 1990, The Astrophysical Journal, 99, 2019, doi: 10.1086/115483
- Lightkurve Collaboration et al. (2018) Lightkurve Collaboration, Cardoso, J. V. d. M., Hedges, C., et al. 2018, Lightkurve: Kepler and TESS time series analysis in Python, Astrophysics Source Code Library. http://ascl.net/1812.013
- Lomb (1976) Lomb, N. R. 1976, Astrophysics and Space Science, 39, 447, doi: 10.1007/BF00648343
- Mason et al. (2010) Mason, E., Diaz, M., Williams, R. E., Preston, G., & Bensby, T. 2010, Astronomy & Astrophysics, 516, A108, doi: 10.1051/0004-6361/200913610
- Pastorello et al. (2019) Pastorello, A., Mason, E., Taubenberger, S., et al. 2019, Astronomy & Astrophysics, 630, A75, doi: 10.1051/0004-6361/201935999
- Paunzen & Vanmunster (2016) Paunzen, E., & Vanmunster, T. 2016, Astronomische Nachrichten, 337, 239, doi: 10.1002/asna.201512254
- Pojmański (2001) Pojmański, G. 2001, in Astronomical Society of the Pacific Conference Series, Vol. 246, IAU Colloq. 183: Small Telescope Astronomy on Global Scales, ed. B. Paczynski, W.-P. Chen, & C. Lemme, 53
- Pollacco et al. (2006) Pollacco, D. L., Skillen, I., Collier Cameron, A., et al. 2006, Publications of the Astronomical Society of the Pacific, 118, 1407, doi: 10.1086/508556
- Ricker et al. (2015) Ricker, G. R., Winn, J. N., Vanderspek, R., et al. 2015, Journal of Astronomical Telescopes, Instruments, and Systems, 1, 014003, doi: 10.1117/1.JATIS.1.1.014003
- Scargle (1982) Scargle, J. D. 1982, The Astronomical Journal, 263, 835, doi: 10.1086/160554
- Shappee et al. (2014) Shappee, B. J., Prieto, J. L., Grupe, D., et al. 2014, The Astronomical Journal, 788, 48, doi: 10.1088/0004-637X/788/1/48
- Stȩpień et al. (2001) Stȩpień, K., Schmitt, J. H. M. M., & Voges, W. 2001, Astronomy & Astrophysics, 370, 157, doi: 10.1051/0004-6361:20010197
- Voges et al. (2000) Voges, W., Aschenbach, B., Boller, T., et al. 2000, IAU Circulars, 7432, 3
- Wadhwa et al. (2022a) Wadhwa, S. S., De Horta, A., Filipović, M. D., et al. 2022a, Research in Astronomy and Astrophysics, 22, 105009, doi: 10.1088/1674-4527/ac8b59
- Wadhwa et al. (2022b) Wadhwa, S. S., De Horta, A. Y., Filipović, M. D., et al. 2022b, Journal of Astrophysics and Astronomy, 43, 94, doi: 10.1007/s12036-022-09888-7
- Wilms et al. (2000) Wilms, J., Allen, A., & McCray, R. 2000, The Astronomical Journal, 542, 914, doi: 10.1086/317016