Observation of the sliding phason mode of the incommensurate magnetic texture in Fe/Ir(111)
Abstract
The nanoscopic magnetic texture forming in a monolayer of iron on the (111) surface of iridium, Fe/Ir(111), is spatially modulated and uniaxially incommensurate with respect to the crystallographic periodicities. As a consequence, a low-energy magnetic excitation is expected that corresponds to the sliding of the texture along the incommensurate direction, i.e., a phason mode, which we explicitly confirm with atomistic spin simulations. Using scanning tunneling microscopy (STM), we succeed to observe this phason mode experimentally. It can be excited by the STM tip, which leads to a random telegraph noise in the tunneling current that we attribute to the presence of two minima in the phason potential due to the presence of disorder in our sample. This provides the prospect of a floating phase in cleaner samples and, potentially, a commensurate-incommensurate transition as a function of external control parameters.
I Introduction
Incommensurate structures arise when two distinct periodic subsystems coexist but interact only weakly. In this case, their periodicities are, generically, not simply related; the ratio of their wavelength is an irrational number [1]. Typical examples are periodic layers of atoms adsorbed on a crystalline substrate [2], spin- and charge density waves in solids [3] or intergrowth compounds [4]. As a characteristic feature, incommensurate structures possess a gapless phason mode representing the sliding of the two periodic subsystems with respect to each other [5]. This phason mode profoundly affects the system’s properties: it stabilizes incommensurate structures giving rise to floating phases [6], it governs, in particular, the optical response of charge-density waves [7], it causes strong-coupling superconductivity in bismuth at high pressures [8], and its properties are intimately connected, as shown recently, to the twist-angle variance in twisted bilayer graphene [9]. However, if the interaction between the two subsystems increases, a commensurate-incommensurate (C-IC) transition takes place, where the periodicities become commensurate with the ratio of the respective wavelengths being a rational number. As a consequence, the phason mode acquires a gap [10].
Spatially modulated magnetic textures are a prime example for incommensurate phases as discussed early by Dzyaloshinskii [11]. At the focus of this work is the two-dimensional magnetic texture materializing in Fe/Ir(111), i.e., in a monolayer of iron on the (111) surface of iridium, that was discovered and characterized in the seminal works of von Bergmann et al. [12] and Heinze et al. [13]. Iron forms a two-dimensional hexagonal lattice on Ir(111) with lattice constant Å whereas the magnetic texture is an approximate square lattice with lattice constant nm. It was shown in Ref. [13] that the strong Dzyaloshinskii-Moriya interaction at the Fe/Ir(111) interface and the four-spin interaction play a central role in stabilizing the magnetic modulation with a relatively small periodicity of only . The magnetic texture is thus nanoscopic [13] and far from the continuum limit as the rotation of spins from lattice site to lattice site is on the order of .
A system composed of two-dimensional hexagonal and square lattices, representing the arrangement of iron and the magnetic texture of Fe/Ir(111), respectively, is especially interesting because the two distinct symmetries preclude a complete commensurability. A previous example known to us is the adsorption of Argon on the (100) surface of MgO [2, 14]. Whereas the MgO substrate has square lattice symmetry the lateral interaction between adsorbed Ar favours an incommensurate hexagonal arrangement at high Ar densities. If the Ar density is reduced, two subsequent uniaxial C-IC transitions take place, where a commensurability is first attained along one axis and afterwards along the other axis, thereby changing the lattice symmetry from hexagonal to orthorhombic.
Similarly, it seems that the symmetry of the magnetic texture in Fe/Ir(111) also deviates from that of a square lattice to enhance commensurability. Its periodicity is, except at zero magnetic field, well resolved by spin-polarized scanning tunneling microscopy (STM) [12] indicating that the texture is not floating on the timescale of the STM experiment. It was pointed out in Ref. [12] that a fully commensurate magnetic texture closely resembles the observations by STM implying a distortion from a square to a centered rectangular lattice with , see Fig. 1a. However, a careful analysis of second-order magnetic Bragg peaks obtained via scans of the tunnelling anisotropic magnetoresistance (TAMR) suggested a small deviation from this commensurability [13]. This poses the question whether the magnetic texture is fully or only partially incommensurate or whether different phases with distinct commensurabilities exist which are separated by uniaxial C-IC transitions, that can be controlled by temperature, magnetic field, or another parameter.
In order to shed light on these questions, we investigate in the present work the properties of the sliding phason mode expected for an incommensurate magnetic texture in Fe/Ir(111). Carefully analyzing STM images of the magnetic texture, we identify a uniaxial incommensurability and the crystallographic orientation along which the phason mode is expected to be sliding the texture. This is explicitly verified by atomistic spin simulations on a large unit cell that corresponds to a commensurate approximation of the magnetic order. These theoretical expectations are confirmed experimentally with our STM setup. The phason mode can be excited with the STM tip leading to random telegraph noise in the tunneling current, that we ascribe to the presence of two metastable minima in the phason potential due to the presence of disorder in our sample.
II Results
II.1 Uniaxial incommensurability of the magnetic texture in Fe/Ir(111)
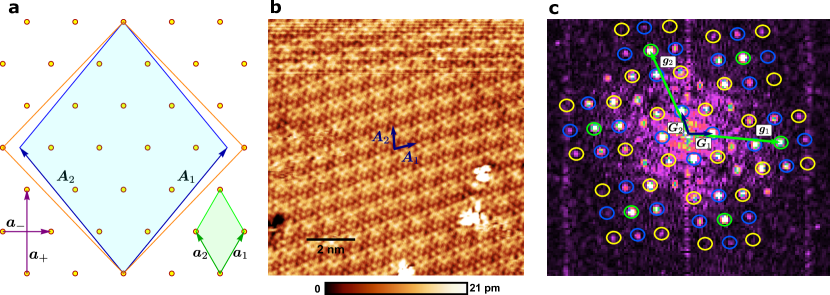
Figure 1b presents an atomically resolved STM topography of a single monolayer of Fe on Ir(111) recorded with a spin-polarized tip. The well-known magnetic texture of non-collinear spins [13] can clearly be seen in the topography as an approximate square lattice. The corresponding Fourier-transformed image shown in Fig. 1c gives information on the magnetic unit cell with respect to the atomic crystal structure. The green circles represent atomic lattice spots that are well approximated by a hexagonal lattice. Its primitive reciprocal lattice vectors are shown by the green arrows and . The blue and yellow circles mark magnetic spots due to the tunneling magnetoresistace (TMR) and tunneling anisotropic magnetoresistance (TAMR), respectively [15]. The blue circles correspond to lowest order magnetic Bragg peaks with primitive vectors and , whereas the yellow circles are higher-order peaks located at and around each atomic Bragg peak. The angle enclosed by the primitive vectors differs from , indicating that the magnetic periodicity is clearly distinct from a square lattice. There exists however a commensurability between the magnetic and the atomic periodicities given by the relation .
The corresponding lattices in real space are shown in Fig. 1a with and being primitive vectors of the atomic and magnetic lattice, respectively, with the standard relations and where . We find Å and . The combinations are the primitive vectors of the equivalent centered rectangular lattice of the Fe monolayer. The vectors define two important orthogonal directions that we denote in the following as hard and soft, respectively. The 3-fold commensurability is obtained along the hard direction . Along the soft direction , the magnetic texture appears to be incommensurate with the atomic crystal. These findings are completely consistent with the previous report of Heinze et al. [13]. The orange lines in Fig. 1a indicate the commensurate approximation of the magnetic unit cell that possesses a 5-fold commensurability along . Note that this commensurate unit cell is also distinct from a square, because its smaller vertex angle is approximately and thus smaller than .
II.2 Theoretical prediction of a magnetic phason mode
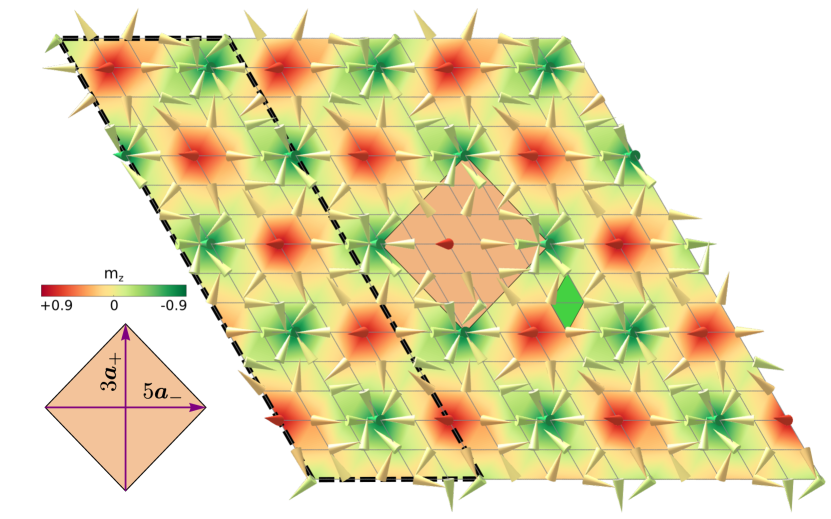
The uniaxial incommensurability identified above implies the existence of a gapless phason mode describing the sliding of the magnetic order along the soft direction, which follows for infinitely large, clean systems from very general arguments [1]. Nevertheless, in order to investigate theoretically the emergence of the phason mode, we performed atomistic spin simulations of the extended Heisenberg model put forward by Heinze et al. [13], that reproduces important features of the observed magnetic texture in Fe/Ir(111). It consists of Heisenberg, Dzyaloshinskii-Moriya, biquadratic, and four-spin exchange interactions as well as uniaxial anisotropy, see Methods for details. As an atomic simulation of an incommensurate magnetic texture is not feasible in a finite model, we limited ourselves to its commensurate approximation, see orange lines in Fig. 1a. For that purpose, a supercell containing magnetic moments positioned on the sites of the hexagonal atomic lattice was chosen; periodic boundary conditions were imposed that necessarily lead to the commensurate approximate texture. The resulting ground state is shown in Fig. 2 and reproduces the magnetic texture of Ref. [13].
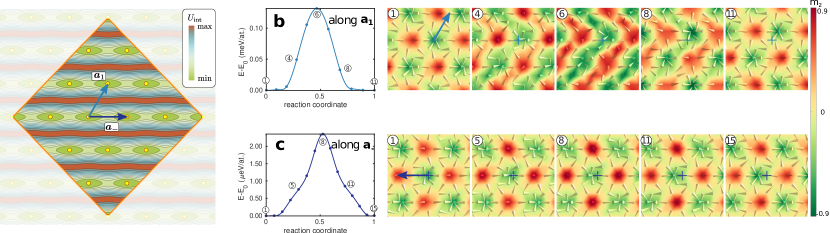
Generically, it is expected that the energetic cost for a shift of the magnetic texture increases with its commensurability, i.e., the potential barrier along the hard direction should be larger than along the soft direction, see Fig. 3a. In order to confirm this expectation and to determine the effective potential for the phason mode, we performed geodesic nudged elastic band calculations, see Methods for details. In particular, we considered a continuous shift of the texture along the two primitive vectors and of the atomic lattice. We also checked that a shift along yields the same results as the shift along . During these calculations, the minimum energy path between the initial and final states is determined. The evolution of the energy is shown in Fig. 3b and c, together with examples of intermediate configurations of the magnetic texture. The explicit calculations show that the potential barrier for a shift along is indeed two orders of magnitude larger than along the soft direction. Moreover, the magnetic configuration is strongly deformed along the path. This implies that a shift along the hard direction does not involve only the phason excitation, but rather a superposition of additional modes, whose characteristics have been discussed in detail in Ref. [16]. In contrast, the intermediate configurations for the path are basically undeformed during the shift and appear to be well captured by a single phason mode.
The simulations confirm that the sliding of the commensurate magnetic texture along the soft direction is well described by a phason that however possesses a small gap due to the five-fold commensurability. The magnetic texture realized in Fe/Ir(111) lacks this five-fold commensurability and is basically incommensurable along the soft direction, see Fig. 1, so that in the experimental system the phason is expected to be gapless at least in the absence of disorder.
II.3 Experimental detection of the phason in Fe/Ir(111)
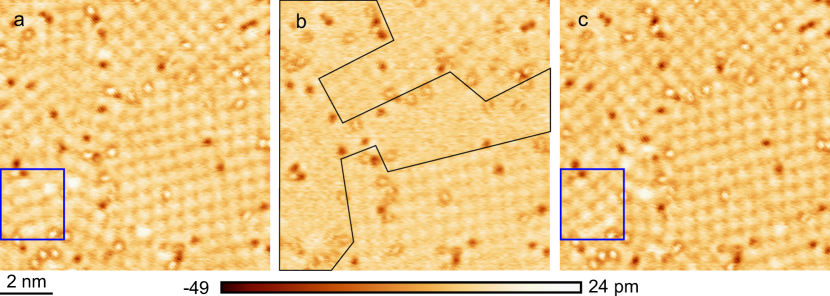
Fig. 4a presents the magnetic texture on a larger scale recorded with STM topography using a non-magnetic tip at a bias voltage of = 10 mV. Here, the image contrast results only from the TAMR effect, which leads to a larger electronic density of states, i.e., higher position for in-plane than for out-of-plane magnetized Fe [15]. Several different rotational domains can be identified, as well as local defects that give stronger contrasts.
When measuring at a higher bias voltage of 100 mV, see Fig. 4b, the spin texture becomes blurry or vanishes in some regions of the sample that are marked by black lines. This indicates that the magnetic texture in these regions is influenced by the action of the STM tip, i.e., it is either destroyed, melted or it is floating on the time scale of the STM experiment. Changing the voltage back to 10 mV subsequently reestablishes the static magnetic texture, see Fig. 4c, albeit not in the exact same order as previously. Some rearrangements of the domains can be observed, e.g., by comparing the texture in the area marked by the blue boxes in panel a and c. The magnetic textures can thus be manipulated by the STM tip, as has been already demonstrated previously by von Bergmann et al. using short voltage pulses [17, 15]. We found however that most of the magnetic domains remained static in our sample even when scanned at elevated voltages. This suggests that the manipulation threshold depends on the local disorder configuration.
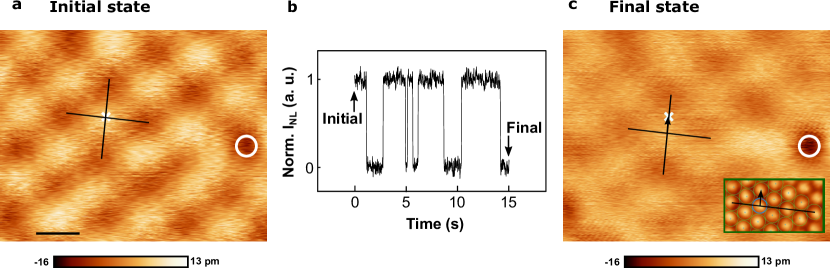
A potential origin for the blurred images at larger bias voltage is the excitation of the phason mode of the magnetic texture induced by the STM tip. In order to test this hypothesis, we studied the dynamical behavior of the texture within this area in more detail. Fig. 5a shows an STM scan of the investigated area where the white circle indicates a structural defect of the Fe film that is assumed to be immobile and serves as a benchmark. After placing the tip at the position of the white cross, the system was locally excited by increasing the bias voltage to 80 mV and, in addition, applying a microwave ac voltage with amplitude = 27.2 mV at 2 GHz between the tip and the sample. For the calibration of the ac voltage and the rectification of the dc current see Methods. Fig. 5b shows the time trace of that exhibits a random telegraph noise (RTN) with a two-level switching characteristics. In the initial state, is high and switches several times from high to low and back within the 15 seconds of the measurement. At the end of the interval, is in the low-current state. Afterwards, an STM image of the final state was recorded and is presented in Fig. 5c. Comparing the relative positions of TAMR contrast and the white cross, we observe that the magnetic texture between its initial and final state is shifted by approximately 0.25 nm, which is close to the atomic nearest-neighbour distance, = 2.715 Å, of fcc Fe on Ir(111) [13]. Moreover, inspection of the atomically resolved STM image in the inset of Fig. 5c reveals that the lateral shift is along the incommensurate, soft crystallographic direction, see Fig. 1.
The lateral shift is thus explained with the excitation of the sliding phason mode of the texture. It appears that this mode switches during the time trace of Fig. 5b between two (meta-)stable states leading to a random telegraph noise. Note that the switching occurs on the time scale of seconds, and it is thus extremely slow compared to the applied GHz frequency. It is likely that the (meta-)stable states are generated by the presence of disorder, the various finite domains, as well as the concomitant domain walls present in the sample, which are clearly visible in Fig. 4.
II.4 Dependence of the switching rate
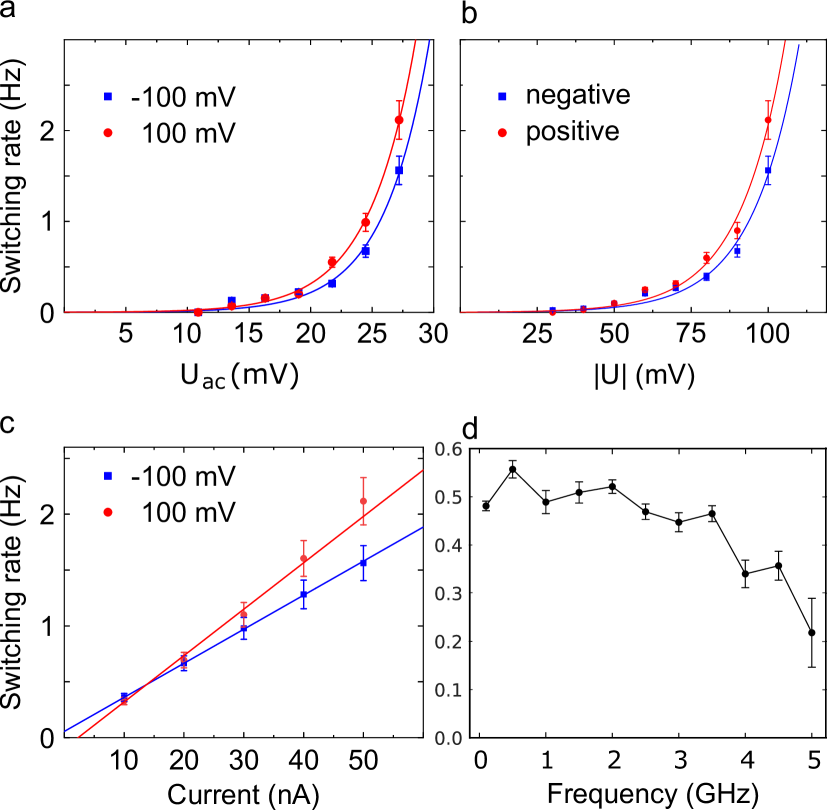
In order to address the mechanism of phason excitation, we measured the RTN varying the ac amplitude, dc voltage, current and micro-wave frequency (see Fig. 6). Note that prior to all frequency dependency measurement, the STM tip was positioned on the non-magnetic Ir(111) surface and the STM micro-wave transfer function was calibrated using the method described elsewhere [18]. The micro-wave loss in the transmission line was then compensated at the output of the micro-wave generator such that the ac voltage at the tunneling junction is constant for every frequency. Clearly, the switching rate increases faster than linearly with both the ac amplitude and dc bias. Note that no ac voltage is necessary for switching, if the dc bias is high enough. The rate, however, scales linearly with tunneling current, indicating essentially a single-electron process. Interestingly, there is an asymmetry in the rates depending on the direction of the tunneling current. Always, a 30% higher rate is observed for negative bias voltages, i.e. for tunneling of electrons from the tip into the sample. A simple heating mechanism leading to activated transitions would show a super-linear behaviour with the electric power, i.e. it would steeply rise with both the sample bias and the tunneling current, which is not observed. Instead, the data suggests that the maximal voltage, i.e. the dc and ac components combined, needs to reach a threshold for the transitions, speaking for an inelastic tunneling mechanism, which also agrees with the linear current relation. As the tunneling current is spin-polarized due to the local magnetic order under the tip, there is a natural reason for an asymmetry of the rates, depending on the sign of the bias (and current) coming from excitations of magnetic structures via transfer of spin angular momentum between the tip and the sample. In the forward tunneling direction, minority electrons are required to inelastically excite the spin structure via magnon creation, while in the backward direction, majority electrons are needed such that the asymmetry reflects the spin-polarization of the tunneling current [19]. The observed asymmetry is in agreement with a switching mechanism via magnetic excitations with a minority spin polarization of Fe. The frequency dependence is, however, rather weak, with a tendency of reduced switching rates above a micro-wave frequency of 3 GHz. One may speculate that when the duration of the voltage maximum exceeding the inelastic energy threshold for switching becomes shorter than the switching time, switching becomes less probable. In this case, the data suggests switching times of the order of 0.3 ns.
III Discussion
In this work, we presented evidence for a low-energy magnetic excitation, i.e., a sliding phason mode of the uniaxially incommensurate magnetic texture of Fe/Ir(111). The activation of this mode was interpreted to be at the origin of blurred STM images of the magnetic texture shown in Fig. 4b. Further investigation on a specific magnetic domain revealed that the phason is pinned into two minima of an effective potential due to the presence of disorder in our sample. The STM tip was able to induce a switching between the two minima, leading to a random telegraph noise in the tunneling current with switching rates on the order of Hz.
This evidence for a sliding phason mode raises interesting questions to be investigated in future research. In ideal samples with macroscopic domains without pinning by defects or boundaries, the phason could potentially lead to a floating phase where the magnetic texture is sliding along the incommensurate direction with no or a very low barrier, leading to liquid-like spatial correlations. Moreover, as a function of external parameters like temperature or magnetic field, it might be possible to induce a commensurate-incommensurate transition where either the magnetic texture becomes fully incommensurate or fully commensurate with the atomic crystal lattice. Finally, the presence of a sliding phason mode should give rise to anisotropic responses to an applied spin current that will strongly depend on its orientation with respect to the uniaxial incommensurability.
IV Methods
IV.1 Scanning tunneling microscopy (STM)
Measurements were conducted with a home-built low-temperature (4.2 K) ultra-high vacuum ( mbar) STM paired with a Nanonis controller. The Ir(111) single-crystal was prepared by cycles of annealing (1200 K) in an oxygen environment ( mbar) and high temperature flashing (1700 K). The Fe film was deposited onto the clean Ir(111) surface using an electron-beam evaporator at slightly elevated temperature. STM tips were electrochemically etched from W wires and cleaned in-situ by flashing (2500 K). Spin-polarized tips were prepared by depositing Fe on the W tips followed by soft annealing. The ac modulation was generated by a Rohde & Schwarz SMB100A signal generator, mixed to the dc bias voltage by a Mini-circuits bias tee (ZX85-12G-S+) and sent to the STM tip. The ac voltage was modulated in amplitude (100%) at a frequency below the cutoff frequency of the STM current amplifier (typically at 3 kHz). The supplementary current () induced by the ac modulation was detected with a lock-in amplifier by modulating the ac amplitude. It is the sum of 2 contributions: , where corresponds to a rectification effect of the non-linear characteristic when introducing micro-waves to the tunneling junction [18, 20, 21]. The second term, , corresponds to the spin rectification effect [22, 23, 24].
IV.2 Atomistic spin simulations
Heisenberg Hamiltonian
We simulate a supercell comprised of normalized magnetic moments on a hexagonal crystal lattice, with periodic boundary conditions. Simulations are carried out with Matjes [25] and Spirit [26] atomistic frameworks, and the results are cross-checked between the implementations. We use the extended Heisenberg model Hamiltonian for Fe/Ir(111) from Ref. 13 with parameters extracted from first-principles density functional theory (DFT) calculations,
| (1) |
where and are respectively the Heisenberg exchange and Dzyaloshinskii-Moryia interaction coupling constants, and is the perpendicular magnetic anisotropy constant. contains higher-order interactions (HOI) of the form,
| (2) |
in which , and denote the biquadratic, and four-spin interaction coupling constants.
GNEB simulations
Minimum energy paths for the translation of the magnetic texture along the different axes discussed in the main text are computed via the geodesic nudged elastic band (GNEB) scheme [27]. The method minimizes the energy of magnetic configurations belonging to an effective elastic band within the multidimensional energy landscape by taking into account the curvature of configuration space. The energy minimization is carried out following negative gradient lines. The saddle point configuration at the top of the barrier is precisely relaxed with a climbing image scheme.
We find energy barriers meV/at. for translation along , and eV/at. for translation along , i.e., the soft direction.
IV.3 Effective phason potential for a commensurate magnetic texture
We elaborate on the construction of the effective phason potential expected for a commensurate magnetic texture that is sketched in Fig. 3a. As discussed in the context of Fig. 1, the reciprocal lattice vectors of the magnetic lattice and the crystal lattice satisfy the relation . Only for the commensurate approximation we have the additional relation , and thus solving for
| (3) |
In general, it is expected that the size of the Fourier components of the phason potential decreases with decreasing commensurability. Restricting ourselves to the Fourier components with the most commensurate wavevectors, we approximated
| (4) |
where and in the sketch of Fig. 3a. The phason potential obtained in the simulations, see in particular Fig. 3c, deviates from a single cosine which, in principle, can be accounted for by including higher-order Fourier components.
V Acknowledgements
B.D. and L.D. thank Sebastian Meyer, Joo-Von Kim for useful discussions, and Markus Hoffmann and Gideon Müller for their help with Spirit. H.H. acknowledge funding by the Alexander-von-Humboldt Foundation. W.W. acknowledges funding by Deutsche Forschungsgemeinschaft (DFG) with grant Wu 394/15-1 and through CRC TRR 288 - 422213477 “ElastoQMat,” project B06. L.D. acknowledges funding by the University of Liège under Special Funds for Research, IPD-STEMA Programme. M.G. acknlowedges funding by the DFG through CRC TRR 288 - 422213477 (project A11) and through SPP 2137 (project 403030645).
References
- Chaikin and Lubensky [1995] P. M. Chaikin and T. C. Lubensky, Principles of condensed matter physics (Cambridge University Press, Cambridge, 1995).
- Lyuksyutov et al. [1992] I. Lyuksyutov, A. G. Naumovets, and V. Pokrovsky, Two-Dimensional Crystals (Academic press, Inc., San Diego, USA, 1992).
- Grüner [1994] G. Grüner, Density waves in solids (CRC Press, Florida, USA, 1994).
- Van Smaalen [1995] S. Van Smaalen, Incommensurate crystal structures, Crystallography Reviews 4, 79 (1995).
- Overhauser [1971] A. W. Overhauser, Observability of charge-density waves by neutron diffraction, Phys. Rev. B 3, 3173 (1971).
- Bak and von Boehm [1980] P. Bak and J. von Boehm, Ising model with solitons, phasons, and ”the devil’s staircase”, Phys. Rev. B 21, 5297 (1980).
- Grüner [1988] G. Grüner, The dynamics of charge-density waves, Rev. Mod. Phys. 60, 1129 (1988).
- Brown et al. [2018] P. Brown, K. Semeniuk, D. Wang, B. Monserrat, C. J. Pickard, and F. M. Grosche, Strong coupling superconductivity in a quasiperiodic host-guest structure, Science Advances 4, eaao4793 (2018).
- Ochoa and Fernandes [2022] H. Ochoa and R. M. Fernandes, Degradation of phonons in disordered moiré superlattices, Phys. Rev. Lett. 128, 065901 (2022).
- Bruce and Cowley [1978] A. D. Bruce and R. A. Cowley, The theory of structurally incommensurate systems. III. The fluctuation spectrum of incommensurate phases, Journal of Physics C: Solid State Physics 11, 3609 (1978).
- Dzyaloshinsky [1965] I. Dzyaloshinsky, Theory of helicoidal structures in antiferromagnets. iii., Soviet Phys. JETP 20, 665 (1965).
- von Bergmann et al. [2006] K. von Bergmann, S. Heinze, M. Bode, E. Y. Vedmedenko, G. Bihlmayer, S. Blügel, and R. Wiesendanger, Observation of a complex nanoscale magnetic structure in a hexagonal fe monolayer, Phys. Rev. Lett. 96, 167203 (2006).
- Heinze et al. [2011] S. Heinze, K. Von Bergmann, M. Menzel, J. Brede, A. Kubetzka, R. Wiesendanger, G. Bihlmayer, and S. Blügel, Spontaneous atomic-scale magnetic skyrmion lattice in two dimensions, Nature Physics 7, 713 (2011).
- Meichel et al. [1986] T. Meichel, J. Suzanne, and J.-M. Gay, C. R. Acad. Sci. Paris 303 (Ser. II), 989 (1986).
- Von Bergmann et al. [2012] K. Von Bergmann, M. Menzel, D. Serrate, Y. Yoshida, S. Schröder, P. Ferriani, A. Kubetzka, R. Wiesendanger, and S. Heinze, Tunneling anisotropic magnetoresistance on the atomic scale, Physical Review B 86, 134422 (2012).
- Desplat and Dupé [2023] L. Desplat and B. Dupé, Eigenmodes of magnetic skyrmion lattices, Phys. Rev. B 107, 144415 (2023).
- Von Bergmann et al. [2014] K. Von Bergmann, A. Kubetzka, O. Pietzsch, and R. Wiesendanger, Interface-induced chiral domain walls, spin spirals and skyrmions revealed by spin-polarized scanning tunneling microscopy, Journal of Physics Condensed Matter 26, 394002 (2014).
- Hervé et al. [2015] M. Hervé, M. Peter, and W. Wulfhekel, High frequency transmission to a junction of a scanning tunneling microscope, Applied Physics Letters 107, 093101 (2015).
- Balashov et al. [2008] T. Balashov, A. F. Takács, M. Däne, A. Ernst, P. Bruno, and W. Wulfhekel, Inelastic electron-magnon interaction and spin transfer torque, Physical Review B 78, 174404 (2008).
- Nunes Jr. and Freeman [1993] G. Nunes Jr. and M. R. Freeman, Picosecond Resolution in Scanning Tunneling Microscopy, Science 262, 1029 (1993).
- Moult et al. [2011] I. Moult, M. Herve, and Y. Pennec, Ultrafast spectroscopy with a scanning tunneling microscope, Applied Physics Letters 98, 233103 (2011).
- Tulapurkar et al. [2005] A. A. Tulapurkar, Y. Suzuki, A. Fukushima, H. Kubota, H. Maehara, K. Tsunekawa, D. D. Djayaprawira, N. Watanabe, and S. Yuasa, Spin-torque diode effect in magnetic tunnel junctions, Nature 438, 339 (2005).
- Hervé et al. [2019] M. Hervé, M. Peter, T. Balashov, and W. Wulfhekel, Towards Laterally Resolved Ferromagnetic Resonance with Spin-Polarized Scanning Tunneling Microscopy, Nanomaterials 9, 827 (2019).
- Baumann et al. [2015] S. Baumann, W. Paul, T. Choi, C. P. Lutz, A. Ardavan, and A. J. Heinrich, Electron paramagnetic resonance of individual atoms on a surface, Science 350, 417 (2015).
- mat [2023] https://github.com/bertdupe/matjes (2023).
- Müller et al. [2019] G. P. Müller, M. Hoffmann, C. Dißelkamp, D. Schürhoff, S. Mavros, M. Sallermann, N. S. Kiselev, H. Jónsson, and S. Blügel, Spirit: Multifunctional framework for atomistic spin simulations, Phys. Rev. B 99, 224414 (2019).
- Bessarab et al. [2015] P. F. Bessarab, V. M. Uzdin, and H. Jónsson, Method for finding mechanism and activation energy of magnetic transitions, applied to skyrmion and antivortex annihilation, Computer Physics Communications 196, 335 (2015).