[1,2]\fnmSungho \surSuh \equalcontThese authors contributed equally to this work.
These authors contributed equally to this work.
1]\orgdivDepartment of Computer Science, \orgnameRPTU Kaiserslautern-Landau, \orgaddress\cityKaiserslautern, \postcode67663, \countryGermany
2]\orgdivEmbedded Intelligence, \orgnameGerman Research Center for Artificial Intelligence (DFKI), \orgaddress\cityKaiserslautern, \postcode67663, \countryGermany
3]\orgdivCentre de Recherche en Automatique de Nancy (CRAN), \orgnameUniversity of Lorraine, \orgaddress\cityNancy, \postcode54506, \countryFrance
Remaining Useful Life Prediction of Lithium-ion Batteries using Spatio-temporal Multimodal Attention Networks
Abstract
Lithium-ion batteries are widely used in various applications, including electric vehicles and renewable energy storage. The prediction of the remaining useful life (RUL) of batteries is crucial for ensuring reliable and efficient operation, as well as reducing maintenance costs. However, determining the life cycle of batteries in real-world scenarios is challenging, and existing methods have limitations in predicting the number of cycles iteratively. In addition, existing works often oversimplify the datasets, neglecting important features of the batteries such as temperature, internal resistance, and material type. To address these limitations, this paper proposes a two-stage remaining useful life prediction scheme for Lithium-ion batteries using a spatio-temporal multimodal attention network (ST-MAN). The proposed model is designed to iteratively predict the number of cycles required for the battery to reach the end of its useful life, based on available data. The proposed ST-MAN is to capture the complex spatio-temporal dependencies in the battery data, including the features that are often neglected in existing works. Experimental results demonstrate that the proposed ST-MAN model outperforms existing CNN and LSTM-based methods, achieving state-of-the-art performance in predicting the remaining useful life of Li-ion batteries. The proposed method has the potential to improve the reliability and efficiency of battery operations and is applicable in various industries, including automotive and renewable energy.
keywords:
Remaining useful life prediction, Multimodal learning, Transformer, Battery health management1 Introduction
Lithium-ion batteries have become indispensable power sources across diverse applications, spanning from electric vehicles and renewable energy storage to consumer electronics and industrial systems [4]. As their significance continues to grow, accurate prediction of the Remaining Useful Life (RUL) of these batteries assumes paramount importance. RUL prediction not only optimizes resource utilization but also enhances operational reliability and minimizes maintenance expenses, safeguarding the efficiency and longevity of battery-driven systems. In today’s industrial landscape, reliable and efficient Lithium-ion battery operation underpins a spectrum of outcomes, from extended electric vehicle ranges to optimized renewable energy systems. Nonetheless, predicting RUL reliably is a formidable challenge due to the intricate interplay of factors governing battery degradation.
Past attempts to predict RUL have yielded diverse methodologies encompassing model-based and data-driven approaches. Model-based methods use mathematical equations to build mechanism models to capture internal electrochemical reactions and prognosticate RUL. These models mainly consider internal attenuation mechanism factors, including loss of lithium and loss of active material in the electrodes [1, 28]. Empirical models, such as exponential models and polynomial models, have been utilized to predict the degradation trend of Lithium-ion battery capacities [36]. In addition, adaptive filter techniques, including the Kalman filter, have been adopted to update the model parameters [38]. However, these approaches often exhibit significant RUL prediction errors when confronted with real-world complexities and uncertainties, despite the advantages of interpretability and the lack of a training procedure associated with data-driven methods.
Conversely, data-driven methods have garnered substantial attention for their adaptability and ability to learn from data without necessitating exhaustive knowledge of underlying physics. Data-driven methods predict the RUL by training the degradation data of the Lithium-ion batteries with statistical and machine learning algorithms. Various machine learning algorithms, including support vector regression (SVR) [41], naive Bayes (NB) [21], Gaussian process regression (GPR) [37], convolutional neural networks (CNN) [42, 17], and long short-term memory (LSTM) networks [12, 15, 29], have been utilized to predict the RUL of Lithium-ion batteries. However, data-driven methods require a substantial volume of historical degradation data for model training and exhibit limitations, notably in capturing intricate correlations between various degradation influencers. The majority of prevailing techniques predominantly focus on discharge capacity as a health indicator, failing to account for pivotal factors substantially shaping battery performance and degradation. In particular, existing data-driven methods require discharge capacity data from more than 25% of total charge-discharge cycles, potentially overlooking sudden degradations in battery performance.
Furthermore, conventional methods for RUL prediction grapple with limitations that curtail their efficacy in real-world scenarios [23, 19]. For example, the conventional deep learning-based models have tried to input some percentage of the initial discharge capacity to get the discharge values for later timestamps/cycles. In addition, the above-mentioned data-driven methods assume that training and test data are collected by the same sensors under the same operating conditions or are from the same distribution. These methods often stumble in iteratively forecasting the number of cycles to battery end-of-life (EOL), relying on static models that struggle to adapt to dynamic operational fluctuations. Furthermore, existing methodologies frequently oversimplify datasets, disregarding pivotal factors such as temperature, internal resistance, and material type [2, 17]. This disregard for essential parameters compromises the ability of models to accurately portray the complexity of battery degradation mechanisms. In summary, the limitations of existing RUL prediction methods are twofold. Firstly, many methodologies struggle to adaptively forecast RUL across multiple cycles, constraining their utility in dynamic real-world contexts. Secondly, these approaches often disregard pivotal parameters such as temperature, internal resistance, and material type, culminating in imprecise and overly simplistic predictions.
Moreover, accurately determining a battery’s health state (HS) is essential for precise RUL prediction. Unfortunately, conventional hybrid methods often neglect to identify the first prediction cycle (FPC), which marks the beginning of the unhealthy stage [26, 27]. Failure to determine the FPC can lead to suboptimal RUL predictions, as the HS of the battery may exhibit little differences in the run-to-failure training dataset.
To overcome these limitations, in this paper, we propose a novel two-stage RUL prediction scheme for Lithium-ion batteries employing a spatio-temporal multimodal attention network (ST-MAN) architecture. The first stage of the proposed scheme is to mark the transition to the unhealthy state, effectively dividing the degradation data into distinct health stages. In the second stage, we predict the degradation pattern that occurs after the FPC by estimating the RUL as a percentage. By considering a broader range of features, including discharge capacity, charge capacity, temperature, internal resistance, and charge time, we improve prediction accuracy and robustness. To improve the performance of the RUL prediction and generality of the model, we propose the ST-MAN which can adeptly capture intricate spatio-temporal connections inherent in multimodal battery degradation data. Our novel ST-MAN architecture for the RUL prediction combines CNN, LSTM, and spatio-temporal attention units to effectively capture intricate degradation patterns. Through a series of experiments on two public Lithium-ion battery datasets including the MIT dataset [24] and HUST dataset [16], we demonstrate the effectiveness of the proposed two-stage scheme and the network architecture.
The main contributions of this paper can be summarized as follows.
-
•
we propose a two-stage prediction scheme for the RUL of Lithium-ion batteries, where the first stage predicts the FPC, and the second stage predicts the degradation pattern after the FPC.
-
•
we annotate the degradation pattern automatically by determining the FPC to train the proposed model.
-
•
we introduce an innovative ST-MAN architecture, combining CNN, spatio-temporal attention, and LSTM units, to capture intricate degradation patterns effectively.
-
•
we validate our proposed method through rigorous experimentation, showcasing its superiority over existing CNN and LSTM-based methods on widely recognized battery degradation datasets.
The remainder of this paper is structured as follows. Section 2 introduces the related work. Section 3 provides the details of the proposed two-stage RUL prediction scheme and ST-MAN architecture. Section 4 presents the descriptions of the datasets used in our experiments and provides quantitative and qualitative experimental results on the two datasets. Finally, Section 5 concludes the paper.
2 Related Work
The landscape of data-driven models for RUL prediction in Lithium-ion batteries has witnessed significant development. Deep learning techniques have demonstrated their efficacy in enhancing RUL estimation accuracy, thereby augmenting predictive energy management capabilities [31]. Recurrent Neural Networks (RNNs) and Long Short-Term Memory (LSTM) algorithms have emerged as prominent strategies [35, 7, 34]. Dynamic LSTM variants, such as the work by [25], have explored online RUL prediction employing indirect voltage measures for health index creation, deviating from traditional capacity-based approaches. Ensemble methods coupled with LSTM, as proposed by [14], have accounted for uncertainties using Bayesian model averaging. [22] integrated Particle Swarm Optimization (PSO) with LSTM, enabling efficient parameter estimation.
LSTM derivatives like Gated Recurrent Units (GRUs) have also garnered attention. Existing works such as [5] addressed State of Charge (SOC) estimation under varying temperatures, while [8] introduced convolutional GRUs, and [3] employed attention mechanisms within GRUs for battery prognostics. Complementary approaches include the application of Convolutional Neural Networks (CNNs), often combined with other techniques for enhanced performance. [42] incorporated causal and dilated convolutions to capture local contextual information. Hybrid architectures like CNNs combined with Bi-LSTM, as showcased by [32], have effectively integrated feature extraction and temporal modeling. Fusion strategies such as RNN-CNN combinations, as presented by [40], have demonstrated merit in feature extraction and time dependency management.
Extreme Learning Machine (ELM) has garnered attention due to its rapid learning speed and generalization performance, proving stable in RUL estimation [31, 18, 39]. Variations like Kernel ELM (KELM) [6], Multiple Kernel ELM (MKELM) [13], and the incorporation of MKELM with the Sparrow Search Algorithm (ISSA-MKELM) [39] have emerged to adapt to complex data relationships. Hybrid models have also surfaced; for instance, [30] adopted a Bi-LSTM scheme with an attention mechanism for State of Health (SOH) estimation. Meanwhile, [29] innovatively combined Adaptive Dropout LSTM (ADLSTM) and Monte Carlo simulation for RUL prediction, achieving accuracy comparable to methods utilizing more data.
Incorporating domain knowledge, [17] integrated CNN and Gaussian Process Regression (GPR) for multi-stage RUL prediction. Similarly, [33] harnessed time series data and regression models for multi-cycle RUL prediction. Building upon our prior work [20], which introduced a two-stage LSTM-based RUL prediction framework, this paper presents a novel RUL prediction method with the proposed ST-MAN architecture. By capturing intricate spatio-temporal dependencies, this method aims to address limitations in existing approaches and advance the accuracy and robustness of RUL prediction for Lithium-ion batteries.
3 Proposed Method
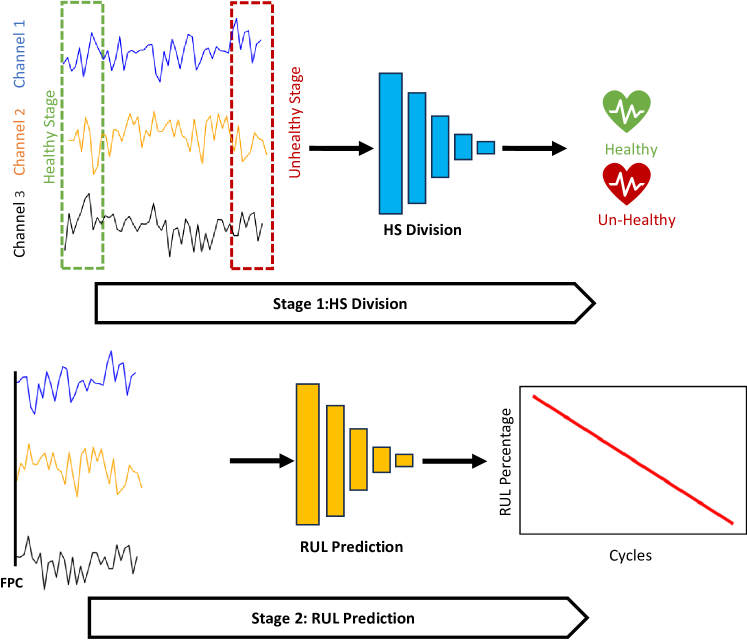
In this section, we introduce our novel RUL prediction framework, as depicted in Fig. 1, designed to tackle the challenge of diverse degradation patterns exhibited by different battery cells. Distinguished by a two-stage approach, our framework deviates from conventional methods. It commences by categorizing each cycle’s data into either a healthy or unhealthy state, a classification step that significantly improves RUL prediction performance. The proposed framework comprises two stages: an HS division stage and a RUL prediction stage. In the HS division stage, our aim is to discriminate between the healthy and unhealthy states of the battery cell degradation patterns. This differentiation is instrumental in pinpointing the FPC, which signifies the onset of the unhealthy phase—a critical determinant for accurate RUL predictions. Once the FPC is established, we define the remaining data post-FPC as degradation data. Leveraging a comprehensive set of features encompassing discharge capacity, charge capacity, charging time, temperature, and internal resistance, we forecast the RUL as a percentage from the FPC to the end-of-life (EOL). To effectively capture intricate degradation patterns, we propose the ST-MAN, which integrates CNN, LSTM, and spatio-temporal attention units.
3.1 First Prediction Cycle Decision
In this subsection, we address the intricate challenge of predicting time-series data with limited availability and inherently non-linear degradation patterns. Time-series data in the context of Lithium-ion battery health is notably influenced by a multitude of factors, including usage patterns, load variations, and dynamic operating conditions. These complexities hinder the precise measurement of the internal reactions occurring within the battery. To mitigate the data limitations, we employ a sliding window approach, characterized by a window size of 50 and a step size of 1, including the different number of channels depending on the dataset.
The first stage of our proposed framework is dedicated to identifying the FPC. This pivotal point signifies the transition from a healthy state to an unhealthy state within the battery cell degradation data. However, annotating the data to distinguish between healthy and unhealthy segments for training the HS division network poses a significant challenge. To overcome this limitation, we adopt a unique approach wherein we designate the initial 10% of the cycles as the healthy state and the final 10% as the unhealthy state in the training dataset, as illustrated in Fig. 1. This strategy not only reduces the need for manual labeling but also improves the accuracy of HS division, particularly in cases where ground truth HS labels are unavailable in most open-access Lithium-ion battery datasets.
Consider as the input data, representing all features of the -th battery cell. We apply a sliding window of size to accommodate the available features, with consisting of the battery cycle data within that window. The corresponding HS labels are defined as follows:
| (1) |
where denotes the HS label of , EOLi represents the total number of cycles in the -th battery cell data, and is the percentage of the total degradation process which is set to 10% in this work. Consequently, Consequently, 20% of the training data is labeled and used for training the HS division network model in the FPC decision stage.
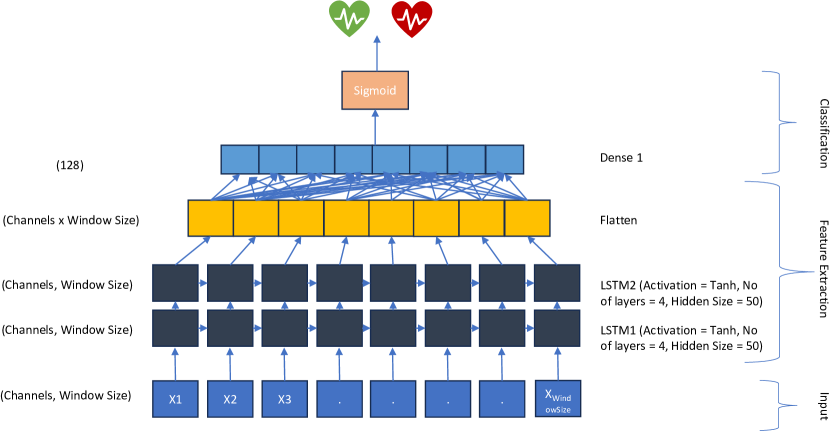
The HS division model employs a 1D LSTM architecture, as illustrated in Fig. 2. This network model incorporates two LSTM modules, each comprising four layers. Following the LSTM layers, one fully connected (FC) layer with sigmoid activation functions is utilized to classify the HS. For training the HS division model, we use the binary cross entropy (BCE) loss function, quantifying the discrepancy between predictions and corresponding HS labels:
|
|
(2) |
where and denote the HS division prediction and the corresponding HS label of the -th battery cell data, respectively.
Once trained, the HS division model can classify both the remaining training and test data into healthy and unhealthy states without the need for a predefined threshold value. By learning the feature distinctions between the labeled healthy and unhealthy data during training, the model can recognize degradation patterns across the entire dataset. The FPC determination is important, signifying the initial stages of Lithium-ion battery deterioration. However, pinpointing the FPC is a challenging task due to the typically weaker degradation features during this phase compared to those in the labeled unhealthy state.
To pinpoint the appropriate FPC, we employ a simple continuous trigger mechanism. Under this mechanism, the battery cell is deemed to be in an unhealthy state when the HS division model consecutively predicts it as unhealthy for a set number of times. This trigger mechanism helps mitigate unnecessary oscillations and uncertainties in FPC determination, and it is a widely adopted strategy in HS division approaches [11, 26]. In our paper, we determine the FPC when the HS division model classifies the input data as unhealthy for five consecutive times. This mechanism helps reduce ambiguity and provides a more reliable indication of the FPC.
To further enhance the robustness of FPC determination, we incorporate additional measures within the continuous trigger mechanism. In particular, we introduce a temporal element to the trigger mechanism to ensure that the FPC is not identified too early in the battery’s life cycle. This added temporal constraint guards against prematurely labeling the battery as unhealthy, which could result in inaccurate RUL predictions.
Under this extended mechanism, the battery is considered to have reached its FPC only if the HS division model classifies it as unhealthy for five consecutive times and this classification occurs beyond a defined threshold cycle, which we refer to as the minimum cycle threshold (MCT). The MCT is a dynamic value calculated as a percentage of the total cycle count. By setting an MCT, we ensure that the FPC identification occurs after a certain proportion of the battery’s expected lifetime has elapsed, adding a temporal context to the determination process.
The introduction of this temporal constraint is crucial for several reasons. First, it aligns with the practical reality that the FPC often occurs after a certain number of cycles, rather than immediately. Second, it prevents premature FPC identification, which can be especially beneficial in cases where initial battery cycles exhibit varying degrees of degradation before stabilizing. Finally, this temporal constraint enhances the adaptability of our framework to different battery types and operating conditions, as it accounts for variations in degradation behavior.
3.2 Remaining Useful Life Prediction
In the RUL prediction stage, our objective is to estimate the RUL percentage after the FPC. To achieve this, we propose a novel architecture ST-MAN, designed to effectively capture intricate degradation patterns while maintaining computational efficiency. This architecture strikes a balance between performance and efficiency, making it a lightweight yet powerful deep learning model for RUL prediction.
To effectively train our RUL prediction model, our approach utilizes time-series data by applying sliding windows from the FPC to the EOL as inputs, while the RUL percentage serves as the ground truth for training. Since the precise RUL information is generally unavailable in real-world scenarios, we calculate the RUL percentage label after the FPC as follows.
| (3) |
where represents the RUL label of after the FPC, and EOLi and FPCi denote the EOL and FPC of -th battery cell, respectively. This formulation allows us to express the RUL as a percentage, providing a more practical and interpretable measure of battery health.
Our approach fundamentally differs from conventional methods that solely rely on discharge capacity as a health indicator and predict discharge capacity values as RUL estimates. We have found that discharge capacity values often exhibit sudden drops, making accurate RUL predictions challenging. Therefore, we define RUL as a percentage linearly, considering the period from the FPC to the EOL. This percentage-based RUL definition allows us to predict the remaining life cycles from the testing cycle because it has a linear relationship between the period from the FPC to the cycle point and the remaining life cycles from the cycle point to the EOL.
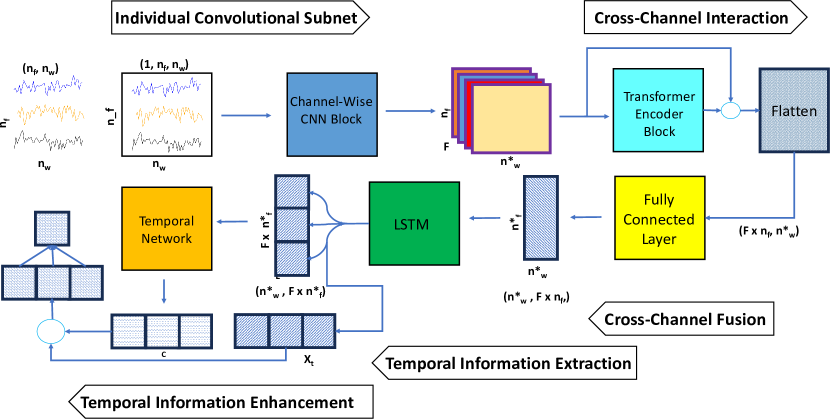
The proposed ST-MAN architecture is depicted in 3. This architecture is specifically tailored to the unique characteristics of our battery degradation data, which is inherently multimodal and temporally dependent. We start by applying convolutional operations to the input data , which represents battery degradation data with different features using a sliding window of length . Importantly, we treat each channel individually during this process to emphasize local context and account for the distinct contributions of each channel. To understand the relationships between different channels and determine the relative importance of each channel, we employ a transformer encoder block. This block enables the model to learn interactions between channels and their significance in the overall degradation process. The relative importance calculated by the transformer is then added back into the previous input data.
After learning channel interactions, we proceed to fuse the channel information using an FC layer. Unlike the self-attention mechanism, the FC layer allows different features within the same sensor channel to have varying weights, enhancing the feature fusion and capturing the unique contributions of each. To model temporal dependencies across the sequence of data, we utilize LSTM units. These units enable the network to understand the global temporal relationships between different time steps within the input window. Considering that not all time steps contribute equally to RUL prediction, it is vital to assess the importance of features at each time step in the sequence. To achieve this, we generate a global contextual representation through a weighted average sum of hidden states at each time step. These weights are determined by a temporal self-attention layer. Since the feature at the last time step represents the entire sequence, the resulting global representation is reintegrated into the previous feature. We introduce a trainable multiplier parameter for the global representation, affording the model flexibility in deciding whether to utilize or disregard the generated global representation. Finally, an FC layer is applied to the represented feature to obtain the final RUL output.
To train the RUL prediction model effectively, we define the RUL prediction loss, which measures the difference between the predicting RUL and the corresponding RUL labels as a percentage.
| (4) |
| (5) |
| (6) |
| (7) |
where and represent the corresponding RUL label and RUL prediction of the -th battery cell data, respectively. denotes the mean absolute error (MAE) between the predicting RUL and the corresponding RUL labels, is root mean square error (RMSE), is mean absolute percentage error (MAPE), and the final RUL prediction loss is the sum of the MAE, RMSE, and MAPE. This comprehensive loss function ensures that the model learns to make precise predictions while considering both the magnitude and relative importance of prediction errors. By incorporating these architectural elements and the corresponding loss functions, our proposed ST-MAN architecture is equipped to effectively capture and learn from the complex degradation patterns exhibited by Lithium-ion batteries, leading to accurate and robust RUL predictions.
4 Experimental Results
4.1 Datasets
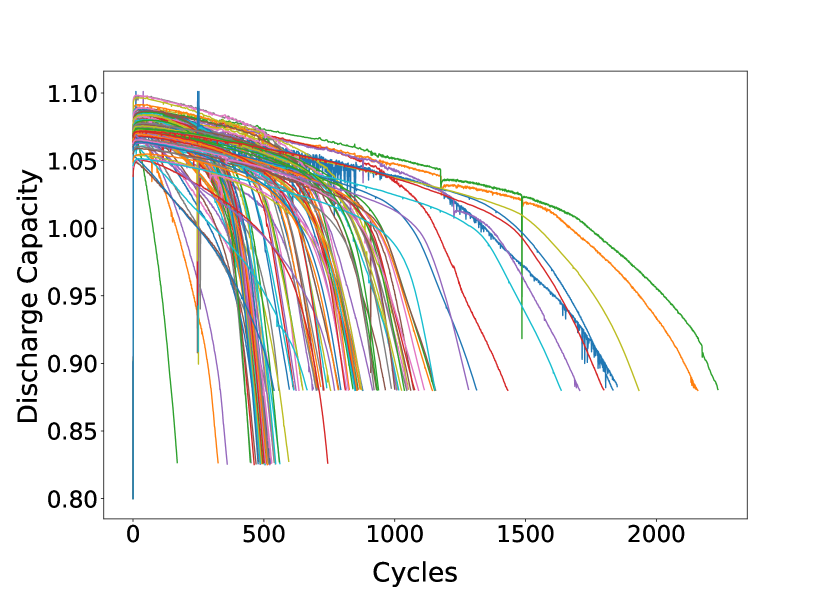
To evaluate the proposed framework on the real battery cell degradation data, we used two different datasets: the MIT dataset [24] and the HUST dataset [16]. While the MIT dataset is widely recognized in the field, the HUST dataset represents one of the latest additions, offering valuable battery discharge data. The MIT dataset is the product of a collaborative effort between the Toyota Research Institute, Stanford, and MIT [24]. This dataset comprises 124 commercial lithium-ion battery cells, specifically the A123 Systems model APR18650M1A, boasting a nominal capacity of 1.1 Ah. These batteries were subjected to rigorous cycling under fast-charging conditions. The experimentation involved cycling the batteries within horizontal cylindrical fixtures using a 48-channel Arbin LBT potentiostat, all within a controlled forced convection temperature chamber maintained at . The key specifications of the cells in this dataset include a nominal capacity of 1.1 Ah and a nominal voltage of 3.3 V. Charging was executed following either a one-step or two-step fast-charging policy, denoted as ’C1(Q1)-C2’. Here, C1 and C2 represent the initial and subsequent constant-current steps, while Q1 signifies the state-of-charge (SOC, %) at which the current transitions between the two steps. Following this, charging at 1C CC-CV ensued, concluding at 80% SOC, which is EOL. The upper and lower cutoff potentials adhere to the manufacturer’s specifications at 3.6 V and 2.0 V, respectively. The dataset spans a wide range of cycle lives, varying from 150 to 2,300 cycles, with an average of approximately 810 cycles and a standard deviation of 340. Each cycle corresponds to a complete battery discharge and recharge. This rich dataset comprises crucial parameters, including cycle number, internal resistance, temperature statistics (minimum, average, maximum), and charge and discharge capacities. In Fig. 4, we present a visualization of the discharge capacities of the 124 cells, demonstrating the significant variability in cycle numbers among the lithium-ion batteries.
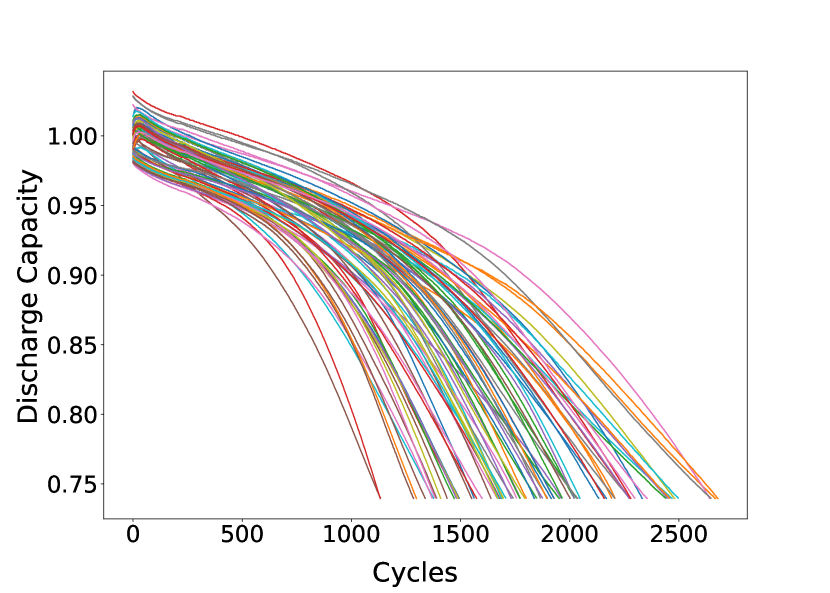
The HUST dataset [16] is provided by the Huazhong University of Science and Technology and involves 77 commercial batteries with over 140,000 charge-discharge cycles. The adopted batteries are all LFP/graphite A123 APR18650M1A with 1.1 Ah nominal capacity and 3.3 V nominal voltage. Each battery is tested with a different multi-stage discharge protocol but following the identical fast-charging protocol in two thermostatic chambers at . The number of cycles ranges from 1,100 to 2,700 cycles, with an average of 1,898 and a standard deviation of 387, each representing information about discharge capacity, charge capacity, and charge voltage. The authors [16] claim that this is the largest dataset for diverse protocols. Moreover, we used the feature generation mechanism used in [16] to generate two additional features, where the difference of the charge voltage and charge capacity curve between each cycle and the \nth10 cycle is taken into account, making a total of features for each cycle. The high performance of differences in charge capacity features and voltage capacity features are inspired by [24] and [9], respectively. As illustrated in Fig. 5, the discharge capacity for all 77 cells in the HUST dataset exhibits diverse patterns. Notably, the distinct properties of both datasets make them valuable resources for conducting experiments and analyzing results, thereby contributing to the development of robust solutions for RUL prediction tasks.
4.2 Implementation Details and Evaluation Metrics
The experiments were implemented using Python scripts within the PyTorch framework. We opted for the Adam optimizer with a learning rate set to 0.0001, at 0.9, and at 0.99 to train our proposed models. A batch size of 8 and 100 training epochs were employed, along with early stopping, utilizing a patience of 20 epochs to prevent overfitting.
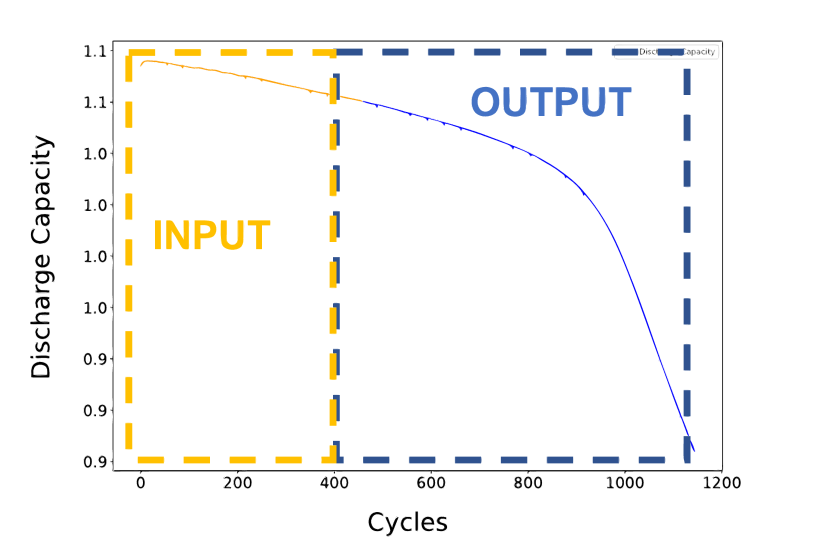
To address the advantage of the proposed framework, we compared it to conventional models, specifically the Temporal Convolutional Network (TCN) [42] and ADLSTM [29]. Conventional methods typically rely solely on discharge capacity as input and presume prior knowledge of the EOL. Fig. 6 illustrates the RUL prediction scheme followed by conventional methods [12, 42, 29], wherein a specific percentage of total cycles is given the input, and the remaining percentage is predicted as the output. Following the conventional methods [12, 42, 29], in our experimental setting for the conventional approaches, we used 40% of the data from each battery cell data as the input and the remaining 60% as the ground truth in the training dataset and as the output in the test dataset. To handle variations in the number of cycles across datasets, we employed padding to align input and output sizes. For example, on the MIT dataset, the input and output sizes were set at 894 and 1342, respectively, while for the HUST dataset, we utilized 1072 and 1608, respectively.
Furthermore, we compare the proposed ST-MAN with the TCN and ADLSTM, all using our two-stage RUL prediction scheme and the same number of input features. These experiments highlight the effectiveness of the ST-MAN architecture for RUL prediction.
In the first stage of our proposed framework, the objective is to predict the HS of the battery cell at various cycle points and identify the FPC. In our experiments, we labeled the first 10% of the total cycle data for each cell as the healthy state and the last 10% as the unhealthy state, leaving the remaining 80% for FPC prediction. To mitigate overfitting, we performed 5-fold cross-validation. For instance, on the MIT dataset, we used 99-100 battery cell data for the training dataset and 24-25 battery cell data for the test dataset, iteratively changing the training and test dataset split to encompass all cells as the test dataset.
In addition, we use 7 and 5 input features from the MIT and HUST datasets, respectively. The input features of the MIT dataset include discharge capacity, internal resistance, charge capacity, average temperature, minimum and maximum temperature, and charge time. The HUST dataset input features comprise charge voltage, discharge capacity, charge capacity, the difference of the charge voltage between each cycle and the 10th cycle (), and the difference of the charge capacity between each cycle and the 10th cycle ().
To evaluate and compare the proposed framework with conventional methods, we employed three evaluation metrics: MAE, MSE, and MAPE, defined as follows.
| (8) |
| (9) |
| (10) |
where represents the predicted RUL percentage and represents the ground truth. These evaluation metrics allow us to quantitatively assess the accuracy and performance of our models in predicting remaining useful life.
4.3 Results and Discussion
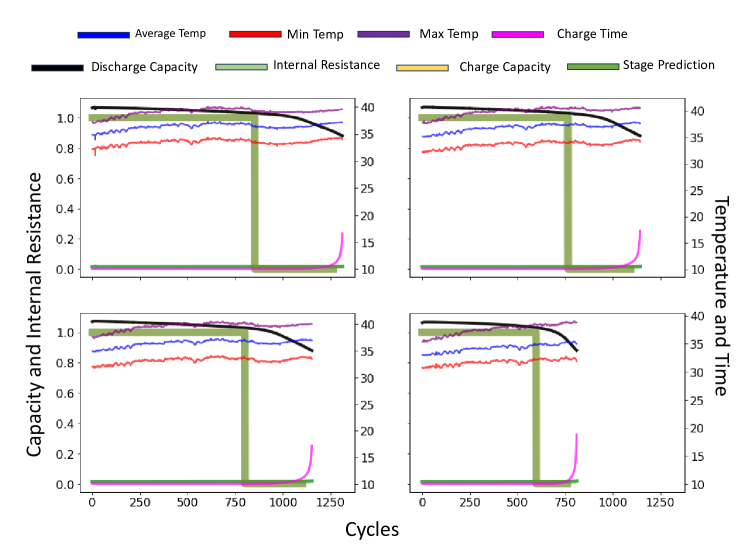
Fig. 7 shows the examples of the HS division results by the first stage of the proposed scheme on the MIT dataset. These examples show that the HS division classified the healthy state and unhealthy state clearly. Notably, the FPCs were determined at specific points where the degradation of discharge and charge capacity values began. To provide further insight into the FPC determination process, we include the percentage of discharge capacity at the FPC point for both datasets in Table 1. This percentage represents the proportion of remaining discharge capacity when the FPC occurs. For the MIT dataset, on an average, the FPCs were identified at approximately 94% of the total discharge capacity, while for the HUST dataset, they occurred at roughly 90% of the total discharge capacity. This consistent trend across both datasets demonstrates the robustness and stability of our proposed first-stage approach in pinpointing the FPCs accurately. These findings reinforce the reliability of our method in identifying the critical transition points within battery degradation cycles, which is paramount for precise remaining useful life prediction.
| Dataset | Train | Test |
|---|---|---|
| MIT [24] | 94.70 | 94.34 |
| HUST [16] | 90.771 | 86.69 |
| \botrule |
| Methods | MIT [24] | HUST [16] | ||||
|---|---|---|---|---|---|---|
| MAE | MSE | MAPE | MAE | MSE | MAPE | |
| TCN [42] | 0.0451 0.0091 | 0.0065 0.0046 | 0.1308 0.0360 | 0.0226 0.0081 | 0.0014 0.0015 | 0.0776 0.0237 |
| ADLSTM [29] | 0.0461 0.0146 | 0.0072 0.0067 | 0.1149 0.0477 | 0.0237 0.0030 | 0.0006 0.0002 | 0.0834 0.0148 |
| ST-MAN (Ours) | 0.0275 0.0046 | 0.0014 0.0005 | 0.0494 0.0100 | 0.0168 0.0091 | 0.0005 0.0006 | 0.0384 0.0193 |
| Two-stage TCN | 0.1034 0.0110 | 0.0160 0.0027 | 0.1462 0.0172 | 0.0939 0.0389 | 0.0139 0.0093 | 0.1670 0.0821 |
| Two-stage LSTM | 0.0293 0.0043 | 0.0015 0.0004 | 0.0544 0.0077 | 0.0181 0.0023 | 0.0006 0.0001 | 0.0438 0.0048 |
In Fig. 9, we present a visual comparison of the RUL prediction results achieved by our proposed two-stage framework and conventional schemes [42, 29]. It is worth to note that there is a fundamental difference in how RUL percentage prediction commences between the proposed method and conventional approaches, as depicted in Fig. 9. Specifically, our proposed method initiates RUL percentage prediction after the FPC point, which signifies the starting point of battery degradation. Conversely, conventional methods base their predictions on data covering the first 40% of the overall cycle, making the initial prediction points distinctly dissimilar.
This disparity in prediction starting points has profound implications for the accuracy of RUL predictions. In the case of conventional methods, which necessitate prior knowledge of the EOL, the predicted RUL exhibits noticeable gaps when compared to the ground truth. Moreover, conventional models struggle to accurately anticipate sudden drops in RUL, often leading to discontinuous predictions. In contrast, our proposed method excels in producing smooth and stable RUL predictions. By commencing RUL estimation after the FPC point, our approach circumvents the need for prior knowledge of the EOL, resulting in more reliable and continuous predictions. This is particularly beneficial in real-world scenarios where exact EOL information may not be readily available.
For a comprehensive evaluation of the RUL prediction models, we provide a detailed comparison in Table 2, utilizing three prominent evaluation metrics. Notably, our proposed method consistently outperforms the two conventional methods across all these metrics. This superior performance underscores the effectiveness of our approach in accurately predicting RUL, all while obviating the need for prior knowledge of the EOL. These results highlight the potential of our two-stage framework in enhancing the precision of RUL prediction in various real-world applications.
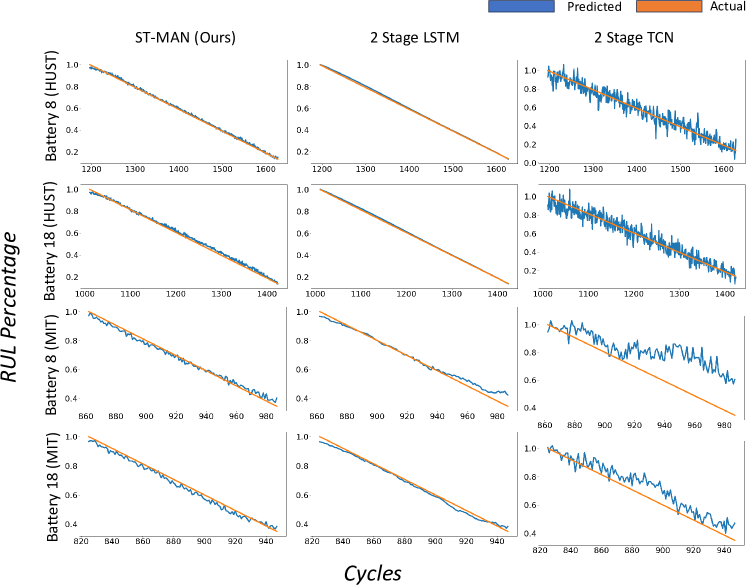
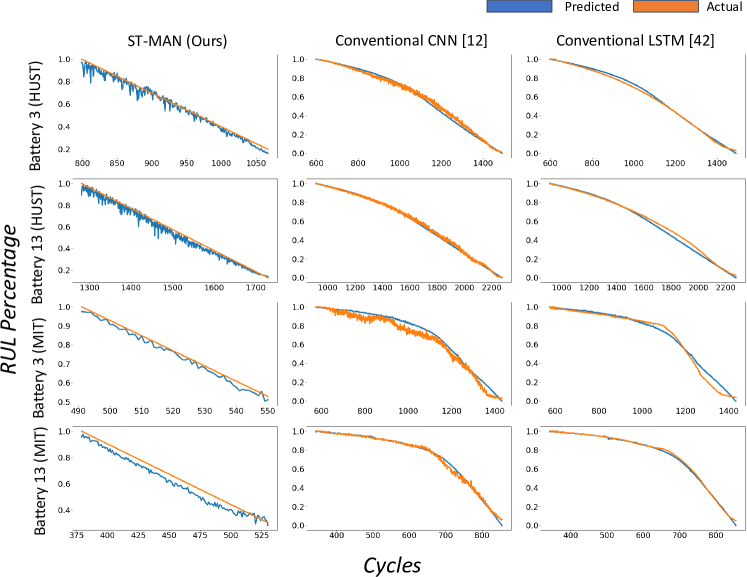
Furthermore, we compare the proposed ST-MAN with the TCN and LSTM, all employing our two-stage RUL prediction scheme and the same number of input features. Fig. 8 demonstrates examples of the RUL prediction results on the MIT and HUST datasets by the proposed ST-MAN, two-stage TCN, and two-stage LSTM. Compared to the results obtained by conventional schemes in Fig. 9, the proposed scheme improved the performance of the RUL prediction by the TCN and LSTM models. In Table 2, the proposed ST-MAN also outperformed the two-stage TCN and two-stage LSTM. These experiments demonstrate the effectiveness of the ST-MAN architecture for RUL prediction and its potential to outperform conventional and alternative deep learning models in this critical task.
| Model | FLOPs | Parameters |
|---|---|---|
| TCN [42] | 527,424 | 46,049 |
| ADLSTM [29] | 1,003,648 | 190,721 |
| ST-MAN (Ours) | 1,200,869 | 27,861 |
| \botrule |
In Table 3, we present a comprehensive overview of the computational complexities and performance metrics associated with the proposed method compared to the TCN and LSTM models when employing the two-stage RUL prediction scheme on the MIT dataset. Our assessment of computational costs encompasses both the number of network parameters and floating-point operations (FLOPs), a metric widely used to represent the execution time and overall computational complexity of neural network models [10].
Remarkably, as illustrated in Table 3, our proposed network architecture shows the smallest number of parameters. However, it is noteworthy that the FLOPs associated with the proposed ST-MAN model are relatively larger compared to the TCN and LSTM models. This signifies that our ST-MAN model exhibits a higher computational demand during execution. Nevertheless, the smaller number of weight parameters, despite the increased FLOPs, underscores the model’s efficiency and demonstrates that it can achieve robust predictive performance with a leaner set of learnable parameters. This balance between FLOPs and parameters demonstrates the capability of the model to deliver favorable results while maintaining computational efficiency.
5 Conclusion
In this study, we proposed a novel two-stage framework for RUL prediction of Lithium-ion batteries, addressing the critical challenge of RUL estimation in real-world scenarios where precise EOL information is often unavailable. Our proposed framework, which combines health state classification and RUL prediction, offers several key contributions and advantages. First, we introduced the concept of the FPC, which serves as a pivotal point to initiate RUL prediction. By identifying the FPC through health state classification, we effectively circumvent the need for prior knowledge of the EOL. This feature is particularly valuable in practical applications, where obtaining exact EOL information can be challenging or impossible. To achieve accurate health state classification and RUL prediction, we designed the ST-MAN, a novel architecture tailored to the unique characteristics of battery degradation data. ST-MAN contains CNNs, Transformer encoder, and LSTM units to capture intricate degradation patterns while maintaining computational efficiency. The use of multi-attention mechanisms and temporal self-attention enables ST-MAN to learn both local and global dependencies in the data, resulting in robust RUL predictions. Our experimental results demonstrate the effectiveness of the proposed framework and ST-MAN architecture. We compared our approach with conventional methods and alternative deep learning models, consistently achieving superior RUL prediction accuracy across multiple evaluation metrics. Notably, our method produces smooth and stable RUL predictions, addressing the challenges of discontinuity and inaccuracy associated with conventional methods.
Future work may involve further refinement of the framework, exploration of additional datasets, and deployment in real-world battery management systems, ultimately advancing the field of battery health management and extending the lifespan of energy storage technologies.
Acknowledgements
This work was supported by Carl-Zeiss Stiftung under the Sustainable Embedded AI project (P2021-02-009) and by the European Union under the HumanE AI Network (H2020-ICT-2019-3 #952026).
References
- \bibcommenthead
- Birkl et al [2017] Birkl CR, Roberts MR, McTurk E, et al (2017) Degradation diagnostics for lithium ion cells. Journal of Power Sources 341:373–386
- Chen et al [2023] Chen M, Ma G, Liu W, et al (2023) An overview of data-driven battery health estimation technology for battery management system. Neurocomputing
- Cui et al [2020] Cui S, Shin J, Woo H, et al (2020) State-of-health estimation of lithium-ion batteries with attention-based deep learning. In: Software Engineering Perspectives in Intelligent Systems: Proceedings of 4th Computational Methods in Systems and Software 2020, Vol. 2 4, Springer, pp 322–331
- Dos Reis et al [2021] Dos Reis G, Strange C, Yadav M, et al (2021) Lithium-ion battery data and where to find it. Energy and AI 5:100081
- Hannan et al [2020] Hannan M, How DN, Mansor M, et al (2020) State-of-charge estimation of li-ion battery at variable ambient temperature with gated recurrent unit network. In: 2020 IEEE Industry Applications Society Annual Meeting, IEEE, pp 1–8
- Heidari et al [2019] Heidari AA, Abbaspour RA, Chen H (2019) Efficient boosted grey wolf optimizers for global search and kernel extreme learning machine training. Applied Soft Computing 81:105521
- Hong et al [2019] Hong J, Wang Z, Chen W, et al (2019) Synchronous multi-parameter prediction of battery systems on electric vehicles using long short-term memory networks. Applied Energy 254:113648
- Huang et al [2019] Huang Z, Yang F, Xu F, et al (2019) Convolutional gated recurrent unit–recurrent neural network for state-of-charge estimation of lithium-ion batteries. Ieee Access 7:93139–93149
- Jiang et al [2021] Jiang B, Gent WE, Mohr F, et al (2021) Bayesian learning for rapid prediction of lithium-ion battery-cycling protocols. Joule 5(12):3187–3203
- Jouppi et al [2017] Jouppi NP, Young C, Patil N, et al (2017) In-datacenter performance analysis of a tensor processing unit. In: Proceedings of the 44th annual international symposium on computer architecture, pp 1–12
- Lei et al [2018] Lei Y, Li N, Guo L, et al (2018) Machinery health prognostics: A systematic review from data acquisition to rul prediction. Mechanical systems and signal processing 104:799–834
- Li et al [2019] Li X, Zhang L, Wang Z, et al (2019) Remaining useful life prediction for lithium-ion batteries based on a hybrid model combining the long short-term memory and elman neural networks. Journal of Energy Storage 21:510–518
- Liu [2022] Liu R (2022) Remaining useful life prediction of lithium-ion batteries using multiple kernel extreme learning machine. Recent Advances in Computer Science and Communications (Formerly: Recent Patents on Computer Science) 15(5):715–721
- Liu et al [2019] Liu Y, Zhao G, Peng X (2019) Deep learning prognostics for lithium-ion battery based on ensembled long short-term memory networks. IEEE Access 7:155130–155142
- Ma et al [2019] Ma G, Zhang Y, Cheng C, et al (2019) Remaining useful life prediction of lithium-ion batteries based on false nearest neighbors and a hybrid neural network. Applied Energy 253:113626
- Ma et al [2022] Ma G, Xu S, Jiang B, et al (2022) Real-time personalized health status prediction of lithium-ion batteries using deep transfer learning. Energy & Environmental Science 15(10):4083–4094
- Ma et al [2023] Ma G, Wang Z, Liu W, et al (2023) A two-stage integrated method for early prediction of remaining useful life of lithium-ion batteries. Knowledge-Based Systems 259:110012
- Ma et al [2020] Ma Y, Wu L, Guan Y, et al (2020) The capacity estimation and cycle life prediction of lithium-ion batteries using a new broad extreme learning machine approach. Journal of Power Sources 476:228581
- Miao et al [2013] Miao Q, Xie L, Cui H, et al (2013) Remaining useful life prediction of lithium-ion battery with unscented particle filter technique. Microelectronics Reliability 53(6):805–810
- Mittal et al [2023] Mittal D, Bello H, Zhou B, et al (2023) Two-stage early prediction framework of remaining useful life for lithium-ion batteries. arXiv preprint arXiv:230803664
- Ng et al [2014] Ng SS, Xing Y, Tsui KL (2014) A naive bayes model for robust remaining useful life prediction of lithium-ion battery. Applied Energy 118:114–123
- Ren et al [2021] Ren X, Liu S, Yu X, et al (2021) A method for state-of-charge estimation of lithium-ion batteries based on pso-lstm. Energy 234:121236
- Salkind et al [1999] Salkind AJ, Fennie C, Singh P, et al (1999) Determination of state-of-charge and state-of-health of batteries by fuzzy logic methodology. Journal of Power sources 80(1-2):293–300
- Severson et al [2019] Severson KA, Attia PM, Jin N, et al (2019) Data-driven prediction of battery cycle life before capacity degradation. Nature Energy 4(5):383–391
- Song et al [2018] Song Y, Li L, Peng Y, et al (2018) Lithium-ion battery remaining useful life prediction based on gru-rnn. In: 2018 12th international conference on reliability, maintainability, and safety (icrms), IEEE, pp 317–322
- Suh et al [2020] Suh S, Jang J, Won S, et al (2020) Supervised health stage prediction using convolutional neural networks for bearing wear. Sensors 20(20):5846
- Suh et al [2022] Suh S, Lukowicz P, Lee YO (2022) Generalized multiscale feature extraction for remaining useful life prediction of bearings with generative adversarial networks. Knowledge-Based Systems 237:107866
- Tian et al [2021] Tian J, Xu R, Wang Y, et al (2021) Capacity attenuation mechanism modeling and health assessment of lithium-ion batteries. Energy 221:119682
- Tong et al [2021] Tong Z, Miao J, Tong S, et al (2021) Early prediction of remaining useful life for lithium-ion batteries based on a hybrid machine learning method. Journal of Cleaner Production 317:128265
- Wang et al [2022] Wang FK, Amogne ZE, Chou JH, et al (2022) Online remaining useful life prediction of lithium-ion batteries using bidirectional long short-term memory with attention mechanism. Energy 254:124344
- Wang et al [2021] Wang S, Jin S, Bai D, et al (2021) A critical review of improved deep learning methods for the remaining useful life prediction of lithium-ion batteries. Energy Reports 7:5562–5574
- Yang et al [2020] Yang H, Wang P, An Y, et al (2020) Remaining useful life prediction based on denoising technique and deep neural network for lithium-ion capacitors. ETransportation 5:100078
- Yao et al [2022] Yao J, Powell K, Gao T (2022) A two-stage deep learning framework for early-stage lifetime prediction for lithium-ion batteries with consideration of features from multiple cycles. Frontiers in Energy Research 10:1059126
- Zhang et al [2017] Zhang Y, Xiong R, He H, et al (2017) A lstm-rnn method for the lithuim-ion battery remaining useful life prediction. In: 2017 Prognostics and System Health Management Conference (PHM-Harbin), IEEE, pp 1–4
- Zhang et al [2018] Zhang Y, Xiong R, He H, et al (2018) Long short-term memory recurrent neural network for remaining useful life prediction of lithium-ion batteries. IEEE Transactions on Vehicular Technology 67(7):5695–5705
- Zhang et al [2019] Zhang Y, Xiong R, He H, et al (2019) Validation and verification of a hybrid method for remaining useful life prediction of lithium-ion batteries. Journal of Cleaner Production 212:240–249
- Zhang et al [2020] Zhang Y, Tang Q, Zhang Y, et al (2020) Identifying degradation patterns of lithium ion batteries from impedance spectroscopy using machine learning. Nature communications 11(1):1706
- Zhang et al [2022] Zhang Y, Tu L, Xue Z, et al (2022) Weight optimized unscented kalman filter for degradation trend prediction of lithium-ion battery with error compensation strategy. Energy 251:123890
- Zhang et al [2023] Zhang Y, Ma H, Wang S, et al (2023) Indirect prediction of remaining useful life for lithium-ion batteries based on improved multiple kernel extreme learning machine. Journal of Energy Storage 64:107181
- Zhao et al [2020] Zhao F, Li Y, Wang X, et al (2020) Lithium-ion batteries state of charge prediction of electric vehicles using rnns-cnns neural networks. Ieee Access 8:98168–98180
- Zhao et al [2018] Zhao Q, Qin X, Zhao H, et al (2018) A novel prediction method based on the support vector regression for the remaining useful life of lithium-ion batteries. Microelectronics Reliability 85:99–108
- Zhou et al [2020] Zhou D, Li Z, Zhu J, et al (2020) State of health monitoring and remaining useful life prediction of lithium-ion batteries based on temporal convolutional network. IEEE Access 8:53307–53320