0 \vgtccategoryResearch \authorfooter James Scott-Brown and Benjamin Bach are with the University of Edinburgh. E-mail: james@jamesscottbrown.com and bbach@ed.ac.uk
NetPanorama: A Declarative Grammar for Network Construction, Transformation, and Visualization
Abstract
This paper introduces NetPanorama, a domain-specific language and declarative grammar for interactive network visualizations. Exploring complex networks with multivariate, geographical, or temporal information often require bespoke visualization designs, such as adjacency matrices, arc-diagrams, small multiples, timelines, or geographic map visualizations. However, creating these requires implementing data loading, data transformations, visualization, and interactivity, which is time-consuming and slows down the iterative exploration of this huge design space. With NetPanorama, a developer specifies a network visualization design as a pipeline of parameterizable steps. Our specification and reference implementation aims to facilitate visualization development and reuse; allow for easy design exploration and iteration; and make data transformation and visual mapping decisions transparent. Documentation, source code, examples, and an interactive online editor can be found online: https://netpanorama.netlify.app/.
keywords:
visualization, networks, grammar![[Uncaptioned image]](/html/2310.18902/assets/figures/showcase.png)
Representative visualization designs created with NetPanorama. More examples are found on our website: https://netpanorama.netlify.app
Introduction
Supporting network analysis through visualization poses two common challenges. The first challenge is to find visual designs that can effectively reveal complex patterns in topology, geography, metrics, time, or multivariate aspects of networks. The second challenge is to create visualization designs that effectively support individual network analysis tasks such as cluster analysis, path-following, or understanding temporal change [48, 2]. In addressing these challenges, researchers and designers have created many visualization techniques ranging well beyond the widely-known node-link diagrams and adjacency matrices to techniques such as HivePlots [47], PivotGraphs [100], maps, scatterplots [18], JigSaw [85], timearcs [25], semantic substrates [80], and countless more [14, 77, 56, 62, 96, 95]. Many of these techniques have been proven effective in human-subject studies (see, e.g., [106]) and offer a wide base to chose design solutions from.
In practice, these visualization techniques are often used in contexts such as interactive analytics applications, visualization design tools, dashboards, websites, analytical reports, or storytelling pieces. To build visualization for such bespoke use cases and software systems, developers often have to implement multiple visualization techniques, integrate them into existing software architectures, adapt them to the respective data, and potentially perform further iteration to fit different audiences and tasks. This is not only a time-consuming process, but also requires a firm knowledge of the respective visualization techniques, their implementation details, and general network analysis and processing routines such as formats and metrics. The necessity of re-implementation hinders agile user-centered development, and makes it difficult to use prototyping to explore a wide variety of designs and produce task-specific visualizations that account for an user’s training [97].
With NetPanorama, we introduce a domain specific language (DSL) in the form of a declarative grammar [57] to specify stand-alone network visualizations through a set of steps (constructs) and their parameters. These steps span the entire workflow involved in creating interactive visualizations, including data loading and data pre-processing, defining networks, calculating metrics and clusters, specifying layouts, defining visual mappings, and creating basic interactions (Section 3). Constructs also provide capabilities for data transformations, filtering, and scales. Inspired by other visualization grammars [75, 57], NetPanorama specifications are written as JSON and interpreted by our reference implementation. Our reference implementation is implemented in TypeScript, and builds upon state-of-the-art toolkits for network visualization.
The challenge in creating NetPanorama was to review, define, and formalize common visualization design options and primitives for network visualization in a structural way. Compared to grammars for visualizing tabular data [75], a grammar for network visualization must support additional concepts related to network topology, metrics, and layouts, and allow working with geographic, temporal, and multivariate data. Our choice of functional primitives in NetPanorama was informed by systematically reviewing the network visualization surveys cited above and analyzing layouts, visual mappings, and data transformations. Our approach is similar to graph level operations [86] but offers more expressiveness and declarative programming. To demonstrate the expressiveness of NetPanorama (for some examples see NetPanorama: A Declarative Grammar for Network Construction, Transformation, and Visualization), we provide an online-editor, documentation, tutorials, and numerous examples online: https://netpanorama.netlify.app/.
1 Related Work
We begin by reviewing approaches and tools to network visualization and wrangling, visualization grammars, and grammars specific to network visualization, and describe how NetPanorama fills the gap left by these approaches.
Graphical network visualization tools require no programming knowledge as they provide graphical interfaces for designing and visualizing networks. However, examples such as Gephi [11], Cytoscape [79], SoNIA [17], NodeXL [83, 84], Visone [13], NetworkWorkbench [63], SYF [66], Paejk [30], UCINET [74], and NetMiner [28] exclusively focus on node-link diagrams, primarily with force-directed layouts. General purpose visualization tools, whether template based (Rawgraphs, DataWrapper) or mark-based (DataIllustrator [53], Charticulator [70], Data-Driven Guides [45]), offer no direct functionality for networks.
General purpose visualization programming libraries such as ProtoVis [22], D3 [23], or Processing [69], are also not specific to networks but provide an abstraction layer for data visualizations. Again, libraries for network visualization almost exclusively support node-link diagrams (albeit with diverse styling options): NetworkX [39] and PyVis [67], Graph-tool [65], Plotly, and Netwulf [4] in the Python ecosystem, and ggnetwork [90], ggraph [64], Igraph [27], NetworkD3, NDTV-D3, and visNetwork [29] in the R ecosystem. Some of these display the generated visualization in a web-browser, with embedded controls to adjust the appearance. Dedicated web-based libraries for network visualizations include G6 [98], Cytoscape.js [35], and Sigma.js [78].
Hybrid approaches combine a GUI and a programming language. For example, the graph exploration system GUESS [1, 5] embeds an interactive Python interpreter within a GUI; users can adjust what is displayed by either entering commands in the interpreter pane or directly interacting with the displayed visualization.
A common limitation of all these existing authoring tools is a lack of flexibility and expressiveness for visualizing network data: they can tweak the appearance of a node-link diagram, but do not produce other types of visualizations, nor do they help with analysis and network creation.
Network wrangling and data manipulation are crucial to many real-world applications, including the definition of network schemas for table data (determining which parts of the data are to be interpreted as nodes and what are the semantics of links). For example, there are many different data formats for graphs [73], each of which must be loaded in their own way. When data come as one or more tables, a network must be defined by defining node and link semantics from the tables, and potentially cleaning and transforming these networks through filtering, aggregation, or projection. Respective graphical tools include Ploceus [52], Orion [40], and Origraph [19]. However, none of these tools provides a textual domain-specific language for network creation and manipulation, making the reuse and generation of routines hard. Orion can save constructed workflows as XML but this is not well suited to editing or rapid prototyping. NetPanorama shares some of these operations, but is distinguished by being a grammar for network visualization that includes network wrangling capabilities, rather than a network wrangling tool with visualization capabilities.
Visualization Grammars provide a higher-level way for designers to define visualizations, hiding implementation complexity and reducing coding effort. Beginning with Wilkinson’s seminal Grammar of Graphics [103], declarative visualization grammars got popularized by ggplot2 [101]. Vega later provided a browser-based declarative implementation of a visualization grammar with its interactive and higher-level versions, Reactive Vega [76] and Vega-Lite [75], respectively. More grammars target specific domains and visualization types, such as general visualizations (ECharts [50]), tree visualizations (GoTree [51]), space-filling layouts (HiVE [12, 82]), maps (Florence [68]), animations (Canis [36], Gemini [46]), large datasets (Kyrix [89], Kyrix-S [88]), tables of counts, proportions, and probabilities (Product Plots [102]), genomics data (Gosling [54]), and interactive data comics [99]. Similar to these grammars, our main contribution is the identification of logic and functional primitives alongside ways to combine these primitives. However, none of these grammars explicitly focuses on network data and they lack concepts crucial to network visualization such as graph layouts, matrix orderings, network metrics, functions for graph transformations such as clustering and projection, or the ability to construct networks from tabular data.
Grammars for network visualization include ggnetwork [90] and ggraph [64]. Whilst these grammars are extensions to ggplot2 and provide a declarative interface to users, the resulting visualizations are implemented by writing R scripts that rely on a series of function calls (combined using an overloaded + operator) and are therefore implementations of embedded Domain Specific Languages. This embedded nature makes them inherently unsuitable for use as a common representation for visualizations to be used across tools in the way that Vega specifications can be generated using the Python library Altair [94], the R library vegawidget [55], or systems such as Draco [59] or Ivy [58].
SetCoLa [42] allows the expression of constraints on node-link layouts, which are then calculated by WebCola [32, 31]. SetCoLa allows grouping nodes into sets based on their attributes, and to apply constraints that horizontally or vertically align nodes in a set, position these nodes to the left/right/above/below another set, impose an horizontal or vertical order no node positions, arrange nodes in a circle, try to pull the nodes in a set together into a tight cluster, or exclude non-members of a set from entering the convex hull surrounding the nodes in a set. These constraints allow a range of layouts, but SetCoLa does not support modifying the structure of a network nor specifying aspects of its visual appearance other than the positioning of nodes (in node-link like layouts). NetPanorama integrates SetCoLa, allowing the use of a set of SetCoLa constraints to determine a layout.
NetPanorama can best be compared to GLO-STIX [86] which defines graph visualization as an ordered set of graph-level operations (GLO) for Specifying Techniques and Interactive eXploration (STIX) such as ‘Size Nodes by Count’ or ‘Aggregate Nodes by attribute0 and attribute1’. NetPanorama extends and complements the GLOs in GLO-STIX (notably graph projection, graph analysis, node and link styling, and layouts) and provides them in a declarative, rather a procedural way which can require specific operations to happen before others. This allows NetPanorama to express a wider range of designs and techniques. A direct comparison with examples from both languages is found on our website.111http://netpanorama.netlify.app/docs/example-sequences/les-mis/intro
2 NetPanorama
This section explains NetPanorama’s main concepts through the example of creating an ordered adjacency matrix (Figure 1). All-caps terms in this and the following sections refer to detailed description of steps in Section 3.
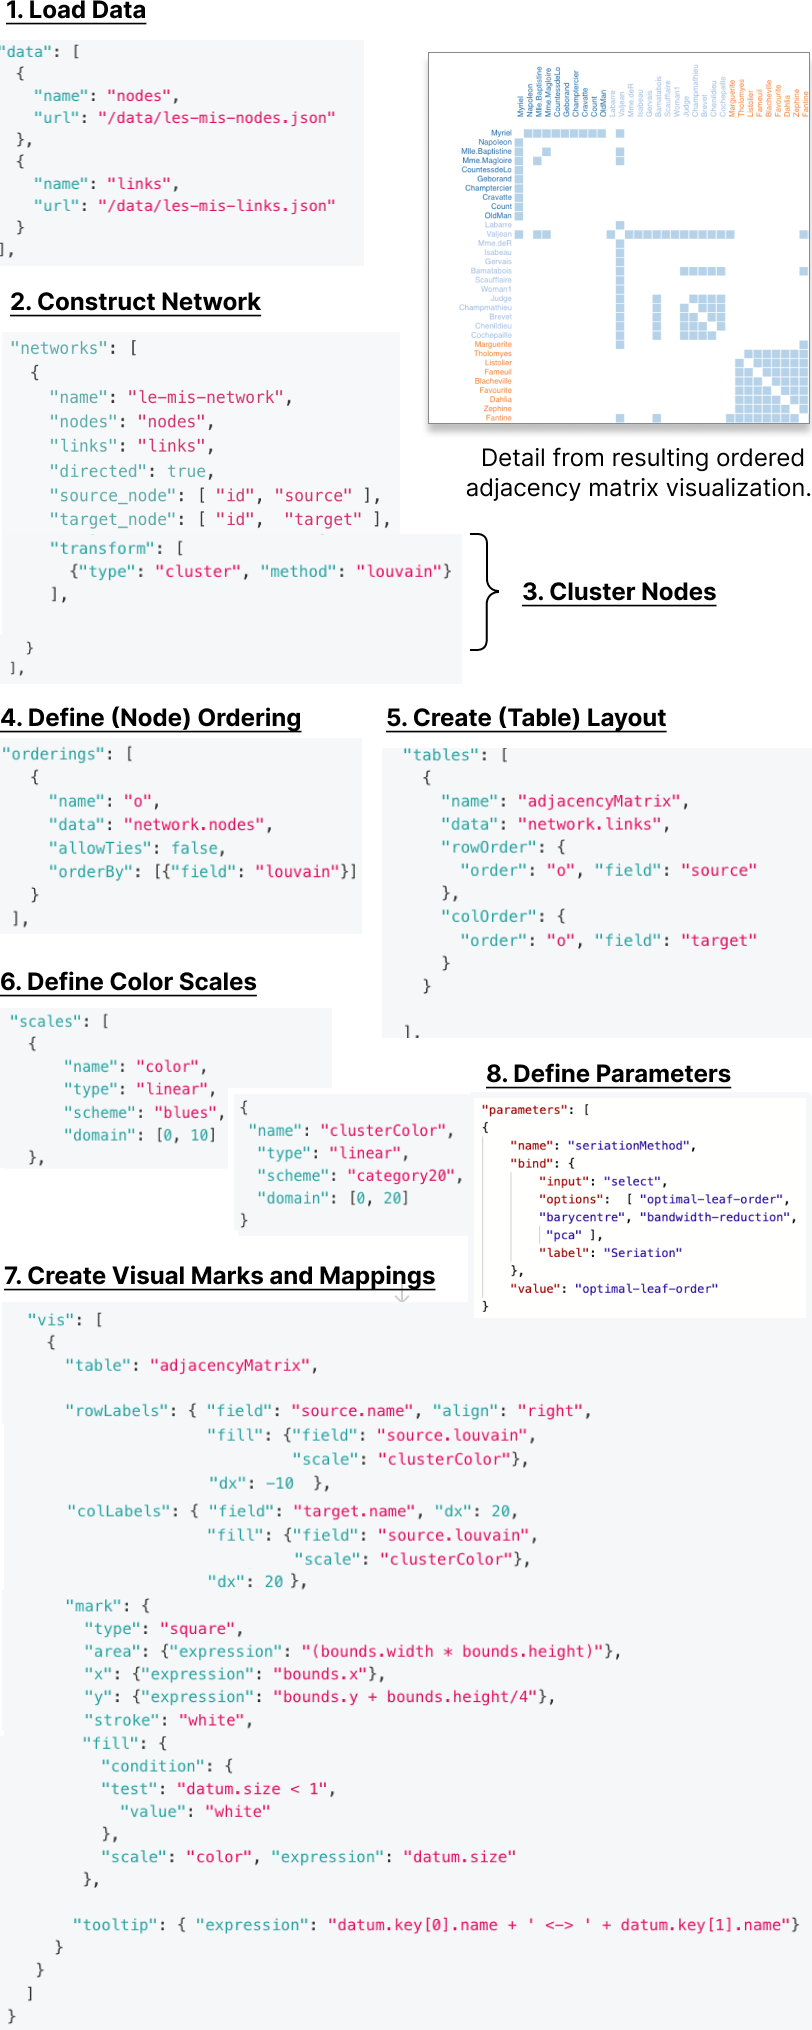
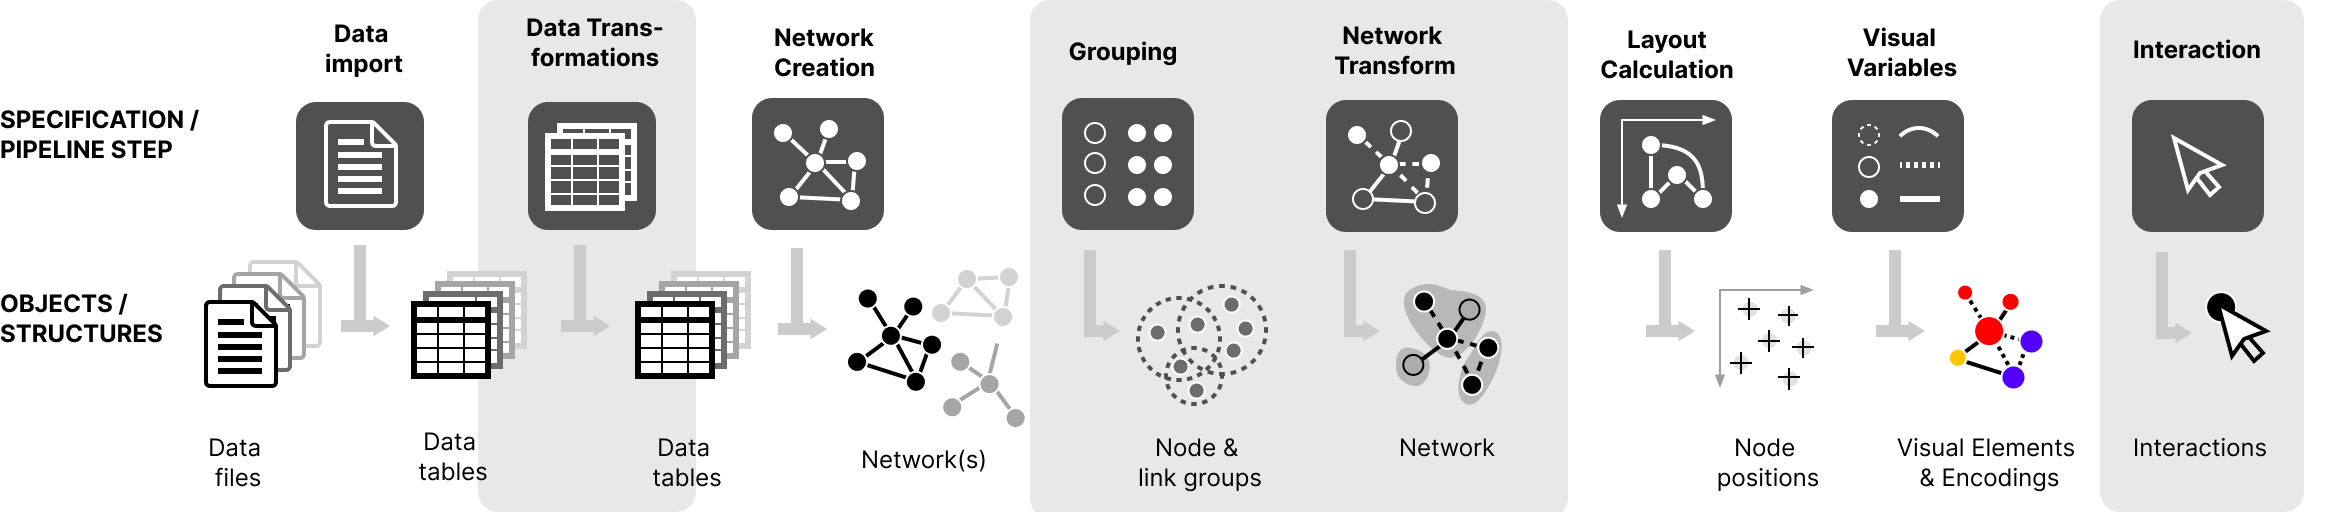
Similar to GLO-STIX, NetPanorama describes network visualization as a pipeline of steps (Figure 2, Table 1). Each step, called a construct in NetPanorama has a set of parameters and options. Most steps in our pipeline are optional. Unlike GLO-STIX, the order in which steps are specified in NetPanorama does not matter; their order is implicit because the results of specific steps (such as creating networks or calculating layouts) are referred to by name in other steps. The example in Figure 1 visualizes the Les Miserables character co-occurrence dataset with link weights. The example provides two ordering methods: one based on clustering, and one based on matrix node seriation [16], which a user can switch between using a select box.
-
1.
Loading data—The data construct loads two separate JSON files: one with a list of nodes and one with a list of links. The lists are stored in memory, with the names nodes and links. NetPanorama supports many data formats and can import data from multiple files (Data Loading).
-
2.
Construct a network—The network construct then creates a network from the tabular input data. This construct defines the network schema, i.e., which part of the data are nodes, which are links, and which are their attributes. In this simple example, the only schema definitions we need are the list of nodes (nodes: nodes), the list of links (links: links), a global flag whether links should be interpreted as directed (directed: true), and a statement that the respective start and end node IDs for a link are found in the source and target attributes in objects from the link list. The network construction step is essential to NetPanorama as it separates input data and their formatting from the semantics of a network with nodes, links [3], and node and link attributes. The resulting network is again named for later reference.
-
3.
Transform a network—In our example, the network construct specifies a clustering on the network nodes (using Louvain clustering [21]). In NetPanorama, such operations are called Network Transformations and can include operations for projection, filtering, or aggregation. Assignment to a cluster is stored as an additional attribute on each node; multiple clustering methods could be applied, with the results of each recorded in a different attribute.
-
4.
Calculate node orderings—The ordering construct specifies a seriation method to be applied to nodes, in order to optimize the patterns shown inside the matrix [16]. Alternatively (Orderings), an ordering can be a simple numerical or alphanumerical sort based on data attributes or derived network metrics.
-
5.
Calculate layouts—In the matrix example, the tables construct creates a table layout for the network’s link data. In this example, each link is assigned to a row and column by using the values in the fields whose names are specified in each field as an index into the previously computed ordering o. As an alternative to a table, a layout can be created by applying a force-directed layout algorithm, or using node/link attributes to compute a geographic layout (Layouts).
-
6.
Color Scales—The scales construct in the example creates one color scale to indicate a cell’s link weight (name: color) and another to color node labels by their cluster (name: clusterColor). NetPanorama’s scales work similarly to Vega-Lite’s scales (Scales).
-
7.
Apply visual encodings—The vis construct defines visual marks for nodes (rowLabels, colLabels) and links (mark, type) alongside their respective visual mappings (fill, dx, scale, type, value, etc.). Visual elements for nodes and links and their respective styling can be extremely rich and further augmented through nesting (Visual Encoding). When using a table layout, NetPanorama automatically creates a visual mark for each cell. To prevent marks that don’t represent any actual link in the network from being shown, NetPanorama can attach conditions to visual styling. Upon mouseover on a matrix cell, a tooltip with the respective link’s nodes is specified to shown.
-
8.
Add Interaction—To switch between the two node orderings (the Louvain clustering and an optimized node seriation) the parameters construct creates a parameter and binds it to a select box; the value of the parameter determines which ordering is used. When the values of a parameter changes, the visualization is re-rendered.
3 NetPanorama Specifications
![[Uncaptioned image]](/html/2310.18902/assets/figures/data.png)
Data Loading: NetPanorama loads tabular data with the data construct. It can load as many files as necessary, and networks can be constructed from multiple data sources in the Network Construction step. Besides tables in CSV and JSON format, our implementation supports a set of network formats such as Pajek or GraphML that explicitly denote nodes and links; these are loaded directly in the Network Construction construct. If tables are loaded, a network schema needs to be explicitly defined in the network construction step. Data can be loaded from a URL (whose response is in JSON or CSV format), defined inline in the specification as JSON objects, or loaded from the browser’s LocalStorage. NetPanorama stores imported data as arrays of objects representing a data table.
![[Uncaptioned image]](/html/2310.18902/assets/figures/datatrans.png)
Data Transformations allow manipulating these data tables to clean and prepare them for network construction. This is extremely important where the semantics of rows and columns in a table must be to construct meaningful networks [3]. This extends the range of data formats that NetPanorama can work with, enabling its use with “raw” data that has not already been prepared for network analysis and visualization.
Data transformations in NetPanorama are specified by a transform construct within the data construct and apply directly to the data tables created upon successful import. Data transformations can add columns or fields to the data tables by calculating new values from existing data fields such as normalizing or summing up values. Other data transformations can reduce data size by binning values (e.g., to prepare numerical values for color scales, etc) or removing rows by filtering (e.g., removing incomplete data). Calculations and filters are supported by expressions similar to expressions in Vega-Lite; e.g., "x": {"expression": "bounds.x + bounds.width/2"}. data can also aggregate rows that have identical values for specified fields. Pivot is another table operation to create columns based on value pairs. In the context of networks, pivoting can turn data associated with links to data associated with nodes. The inverse transformation to pivot is fold. Selecting a random sample of rows allows visualizations to be prototyped using a smaller subset of the data, informing a proper implementation for the entire network.
Transformation can also ensure consistent identifiers for nodes across different tables; especially if tables come from different databases or sources. For example, identifiers may have a prefix such as doi: or isbn: in one location but not another. Finally, NetPanorama supports geocoding: it can automatically assign geographic coordinates from place names, facilitating the visualization of geographic networks. Coordinates are obtained from the GeoCode API,222https://geocode.maps.co which is based on OpenStreetMap and Nominatim.333https://nominatim.org Returned coordinates are saved in the browser’s LocalStorage, so that identical queries are not made repeatedly.
| Step | Construct | Options/parameters |
|---|---|---|
| Data import | data | values, url, localStorage, format |
| Data Transformations | transform (affecting data) | addIndex, lookup, geocode, calculate, bin, sample, aggregation, flatten, fold, pivot, |
| Network Construction | networks | nodes, links, directed, source_node, target_node, source_node_id, target_node_id, source_node_type, target_node_type, parts, data, id_field yield_nodes, yield_links |
| Network Transformation | transform (affecting networks) | aggregateEdges, aggregateNodes, project, removeIsolated, filterNodes, filterEdges, connect, reverseEdges, setDirectness, swapNodesAndEdges, promote, calculate, connectivityBasedAttribute, metric, cluster |
| Groupings | groupings | data, common |
| Node Orderings | orderings | orderBy, allowTies, direction, method, weightField, distance |
| Table layouts | tables | data*, rowOrder*, colOrder*, group, rowLabels, colLabels, dragToReorder, symmetric |
| Layouts | layouts | name*, data*, order, pattern, shape, x, y, angle, radius, distance, numSegments positioning (not listing parameters specific to individual procedural layout implementations, such as d3.layout). |
| Scales | scales | |
| Visualization | vis | entries*, mark*, layout, drawAxes, border, tooltip, ifInSelection, if, fill, stroke, strokeWidth, colorGradient, strokeDash, opacity, start, end, type, shape, glyphShape, separation, … |
![[Uncaptioned image]](/html/2310.18902/assets/figures/networks.png)
Network construction creates (in-memory) data structures for a network, its nodes, links, and their respective attributes. This data structure can then be used to calculate metrics, layouts, and clusters as well as to execute graph-specific queries such as finding common neighbors and paths between nodes. Network construction is easy and in cases where nodes and links are already clearly defined in the input data file format (e.g., for Pajek or GraphML files). However, when a network is constructed from data tables, the rows and columns can be mapped to nodes, links, and attributes in different ways, and which mapping is of most interest to an analyst can change over during the course of network exploration [3]. The mapping can be described as a network schema, assigning network semantics to tables, rows, and columns (Figure 1-2). In NetPanorama, network construction is specified inside the network construct. This step allows to i) use only a subpart of the data in a given network, ii) create multiple networks from the same data, and iii) create networks with great flexibility by combining multiple files. Our implementation models networks as arrays of node objects and an arrays of link objects. A link object stores references to the source and target node objects. An adjacency list structure is internally used to make some network queries and operations more efficient computationally.
Simple networks can be defined by a single table where each row is interpreted as a link—called a link table. A link table requires at least two columns, each designating as values the names (or IDs) of the respective incident nodes. In directed networks, these columns are interpreted as source and target. Additional attributes for each link, such as link weights, types, or timestamps can be added as additional columns in the link table and used in the Visual Encoding. Node tables are data tables where each row is interpreted as a node, with columns designating node attributes with semantics such as node type. If only a link table is imported, our implementation creates a node table with an entry for each unique value in the columns designated to contain nodes. If node tables are used, the respective node value in the link tables are interpreted as secondary keys pointing to node names in the node table.
To construct a network, NetPanorama requires a specification of the mapping from the columns of each table (including the table name), to network semantics (the network schema). A simple example is shown in Figure 1-2 with tables linked by nodes and links and the network schema defined by attributes such as source_node and target_node.
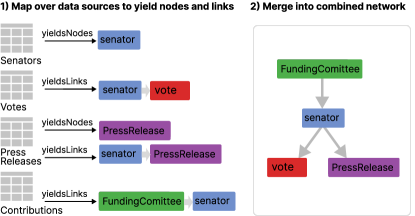
In more complex cases, nodes and links might need to be extracted from more than two data tables, e.g., in cases where tables are exported from a relational database. NetPanorama enables this through the yieldNodes and yieldLinks constructs within network. Figure 3 shows an example using four tables: a table of Senators (interpreted as nodes and their attributes), a table of votes per senator (interpreted as links), press releases (both nodes and links), and contributions (again links). The yieldNodes construct is used to create nodes from a table by specifying the id column. For each unique ID, NetPanorama creates a node, and records the values of the fields named in data as its attributes. yieldsLinks specifies links from a given table by declaring the the field for both source and target node—Name1 and Name2 in our example. The type of the source and target nodes can also be specified. If no yieldNodes is specified, nodes are implicitly created whenever a yieldsLinks block refers to a node ID. The supplementary materials include detailed examples of how this can be applied in complex cases.
![[Uncaptioned image]](/html/2310.18902/assets/figures/nettrans.png)
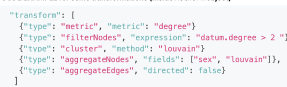
Network Transformations act on the in-memory network structures and transform networks into other networks, similar to Data transformations transforming data tables. Common transformations include node or link removal (topological transformations) or adding attributes to nodes and links (attribute transformations, Figure 4). For example, new node attributes can be calculated using each node’s existing properties, the properties of a node’s neighbors (e.g., to update all actor nodes with the average box-office revenue of the films that they appeared in), or based on the complete structure of the network (e.g., to calculate the value of metrics such as centrality for each node). The supported node metrics are degree (and, for directed networks, the in-degree and out-degree), betweenness, closeness, and eccentricity. Together, these metrics cover a range of applications, but the total number of potential centrality measures is large [20]. Topological transformations include filtering nodes and links based on metrics, attributes, or their connectivity. Nodes can also be aggregated into a meta node, e.g., based on attribute groupings or cluster calculations. Edge projection replaces a path between two nodes via a third node with a single link directly joining them (i.e., becomes ). The operator operates on the entire network and takes two parameters, the type of nodes that should remain (remainingNodeType), and the type removed by the projection (removedNodeType). A dedicated linkDataReducer specifies how to aggregate the data from the links that are being merged.
Further network transformations are listed in Table 1, such as filtering conditions through expressions that take the network topology into account (datum.degree > 10; the datum object refers to the element for which the expression is being evaluated). A special case of degree filtering is removeIsolated, which removes any node with no links.
![[Uncaptioned image]](/html/2310.18902/assets/figures/grouping.png)
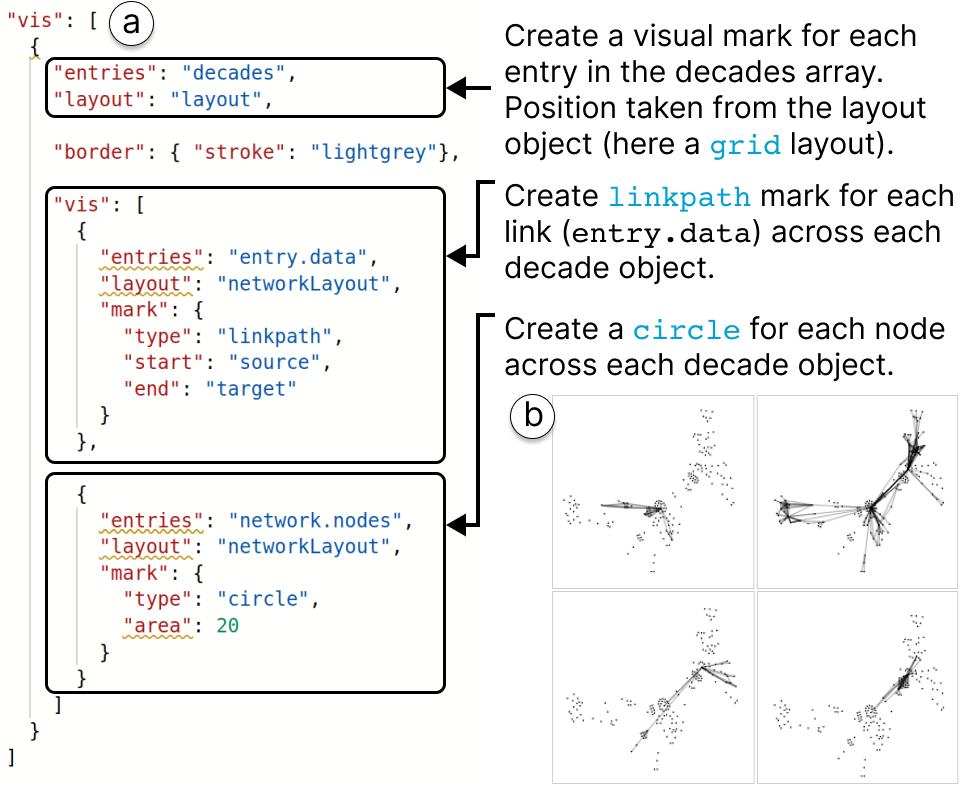
Groupings create sets of nodes and links, based on common attributes including clusters. For example, links with time stamps can be grouped by temporal units, such as weeks or decades. Later, a layout can be applied to position each group. Each group can then be rendered as a more complex glyph, such as to convey information about averages for elements in the group (Visual Encoding). Alternatively, groups can be created for links of the same type or time and later be rendered (vis) as one small multiples for each link type or time (Figure 8). Internally, our implementation stores groupings as arrays, containing all the original data elements. Within a given grouping, nodes and links can only belong to one group. However, different groupings can assign nodes and links to different groups.
![[Uncaptioned image]](/html/2310.18902/assets/figures/orderings.png)
Orderings—NetPanorama can compute orderings for nodes, groups, or other data elements. Orderings are defined in the orderings construct and can be determined by a) sorting a data field of an element (e.g, a given data attribute or a calculated attribute such as node degree resulting from a Transformation or, b) optimizing node orderings based on node connectivity (matrix seriation [16]) using algorithms implemented by reorder.js [33]. Seriation requires a method parameter (optimal-leaf-order, barycentre, bandwidth-reduction, or pca) and a distance parameter (euclidean, manhattan, minkowski, chebyshev, hamming, jaccard, braycurtis). While originating in the context of adjacency matrices, NetPanorama makes it possible to use the same seriation method (ordering) across all visualization designs that offer some sort of linear ordering for nodes: arc diagrams, adjacency lists, hive plots, jig-saw, etc. In our implementation, NetPanorama stores an ordering as a mapping from ids to an ordinal number. This allows the calculation and co-existence of several orderings on the same data set and, e.g., interactive switching between orderings (interaction).
![[Uncaptioned image]](/html/2310.18902/assets/figures/layout.png)
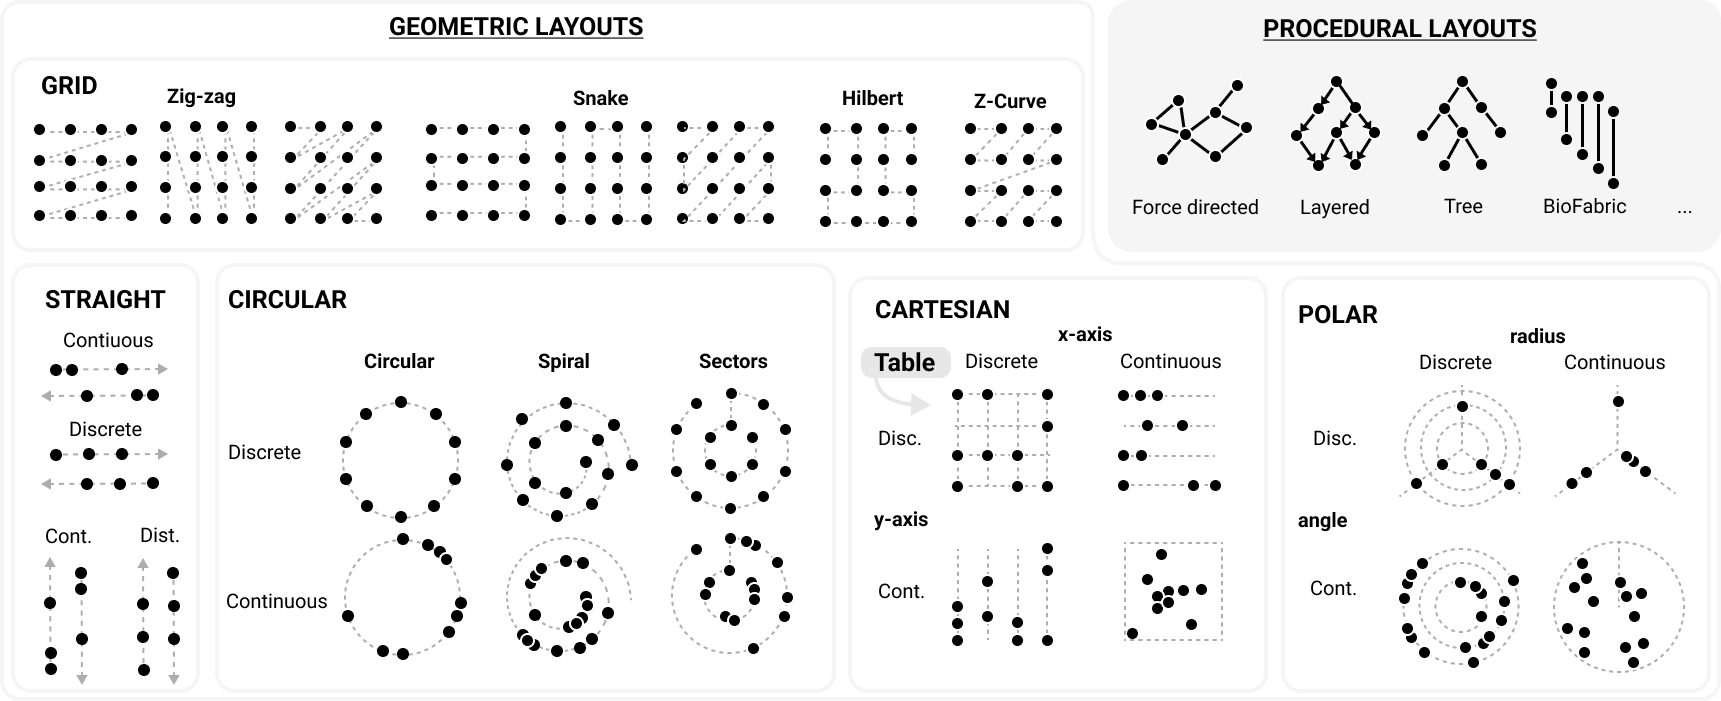
Layouts (often called embeddings) define the spatial positions of nodes in a network visualization. For a systematic approach like NetPanorama, the challenge is to organize the many diverse layouts beyond force-directed layouts (e.g., [87]) into a meaningful classification, alongside their options and parameters. At a high level, NetPanorama groups layouts in geometric layouts and procedural layouts (see Figure 5), table layouts and induced layouts.
Procedural layouts position nodes based on the network topology and use advanced, often iterative, calculations on the entire network structure. Common examples of procedural layouts include force-directed layouts, layered layouts for directed acyclic graphs, tree layouts, and the BioFabric layout [104]. NetPanorama refers to procedural layout implementation by its name, while providing a range of parameters for each specific layout type (not listed in Table 1 due to their abundance). Our implementation currently supports the following layout libraries and implementations: d3.layout, WebCoLa/SetCoLa, Tulip [5], and cytoscape.js. Most of these libraries run in the browser with the exception of Tulip, a C++ framework. A Python wrapper around this provides an HTTP API: networks are sent by a POST request to our server, and the node positions are returned.
Geometric layouts arrange nodes or groups according to geometric structures and rules, independent of the network topology. NetPanorama distinguishes between the following types of geometric layouts:
-
•
Straight: nodes or links are laid out on a single straight line. That line can be oriented in different directions (currently only perpendicular to the screen frame). A common use of is to draw an Arc Diagram.
-
•
Grid: nodes and links are laid out in a linear order along a curve filling a grid. NetPanorama provides a set of different strategies for creating different curves, including Hilbert and z-curves. Grid layouts can be used to create very concise representations for large networks. Links could be laid over these nodes or shown on demand. Note that a grid layout is different from a table layout.
-
•
Circular: nodes or links are laid out along a circular pattern. Either a single circle (single), a spiral, or sectors in which a continuous order jumps to the next level of nested circle when a circle is filled. Circular layouts are popular in neuroscience and can prevent visual clutter. Circular, grid, and linear layouts can both be used with a range of orderings, including seriation methods that optimize that ordering to remove link overlap.
-
•
Cartesian: nodes are laid out in a 2-dimensional orthogonal space like in a scatterplot, according to their attributes. For example a layout using two discrete attributes is used to render a PivotGraph [100]. A version with two continuous attributes is used to render scatterplots as in GraphDice [18] or, likewise, geographic positions on a map.
-
•
Polar: similar to Cartesian layouts, nodes or links are laid out according to two dimensions, but rather than being perpendicular, one coordinate determines angle and the other radial distance from the central point. Polar layouts use an angle parameter (for attribute 1) and a radius parameter (for attribute 2). An example use for a polar layout with a continuous radius but a discrete angle is rendering Hive plots [47].
Most of these geometric layouts determine node positions using attributes such as node degree or domain-specific attributes such as time or geographic location. Continuous attributes will lead to a continuous distribution of nodes along the geometry while discrete attributes and node orders (e.g., from a serialization) result in discrete versions of the layout. To avoid node overlaps, NetPanorama provides for layout transforms that apply overlap removal techniques such as 1D offsets, jitter, or beeswarm packings.
The third type of layout in NetPanorama are table layouts. Table layouts position elements along rows and columns, based on the value of two specified fields (or expressions); this also implicitly defines a grouping, with elements grouped together if they have the same value for both fields. A typical use of a table layout is to create an adjacency matrix, in which edges are positioned into rows and columns based on their source and target nodes, with links grouped together if they have the same source and target. Similar to geometric layouts, the order of rows and columns can be defined based on attribute orders (order) or matrix seriations [16] based on network topology.
The fourth and last type of layouts in NetPanorama are induced layouts, which are complementary to any of the other three layout types. When using a layout to position nodes or links in a network, it can be useful to derive a second layout in order to position additional features. For example, we could use a force-directed layout to position nodes in a node-link diagram, and use a specific linkPath to determine the shape of the curve representing each link. We could use a second (induced) layout to calculate the position half-way along each link, and then use this to position glyphs representing the properties of each edge. NetPanorama stores a layout as a mapping from the ids of elements of a data array to a bounding-box object with an x-y position, width, and height.
![[Uncaptioned image]](/html/2310.18902/assets/figures/scale.png)
Scales—Similarly to previous grammars such as Vega and Vega-Lite, NetPanorama allows the definition of scales that map values to visual attributes such as color, position or size. To facilitate nested visualizations, we allow scales to be defined in terms of the size of the parent: a scale used to draw a glyph inside an adjacency matrix can be defined in terms of the size of the cell within which it will be drawn.
![[Uncaptioned image]](/html/2310.18902/assets/figures/visual.png)
Visual Encoding—The vis object in NetPanorama defines mappings between data elements (nodes, links, groups) to visual marks and their visual attributes. The mapping declares which data elements (e.g., "entries": "mynetwork.nodes") are mapped to which marks (Figure 1-7)). NetPanorama supports the same types of marks as Vega-Lite, including lines, bars, areas underneath lines, text, and symbols (including squares and circles) but add to this generic set a dedicated linkPath mark to render curved links.
Marks for nodes, links, and groups, are positioned by referring to a layout or table. For link marks that use lines or linkpaths, start and end coordinates of these marks are automatically inferred from the referenced layout or table. Any visual property, such as size, or fill-color, can be specified as: a) a constant value, b) the value of a data attribute, c) the value of an expression or formula, referencing the data element as datum, d) the value of a parameter. Parameters in NetPanorama can be bound to user-interface elements such as a slider or select box so that a user can interactively change their values at runtime (Interaction). Optionally, any of these can be transformed by a Scale.
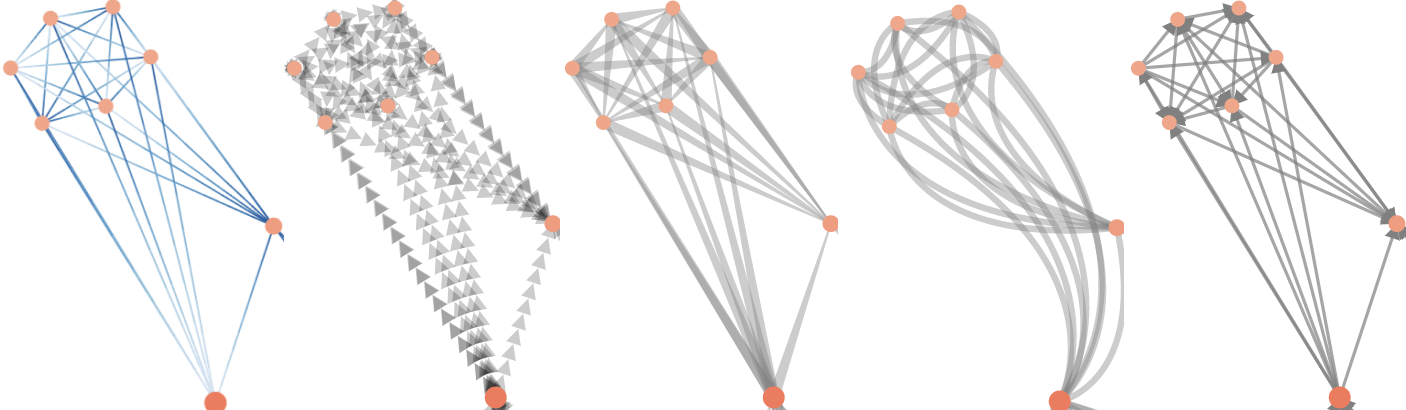
Variations to the linkpath mark (Figure 6) can be straight line, a sequence of horizontal and vertical lines (an ‘orthogonal’ layout), a semi-circular arc, an asymmetric curve, a symmetric curve (line), a wedge, a sigmoidal curve, or ‘squiggles’ (as in ABySS-Explorer [61]). Directionality can be indicated by the addition of line-end markers (such as a filled arrow-head), by gradients in color or width (e.g., a wedge shape) [43], by asymmetric curvature [34], by half-lines [15] that start at one node but do not extend the full distance to the other node, or by an asymmetric envelope applied to the sinusoidal patterns as in the ABySS-Explorer [61]. Rather than drawing a line or curve, an alternative is to draw a series of glyphs (glyphs) along the path that a curve would take (Figure 6(b)) by specifying a glyphShape alongside a separation (Figure 6).
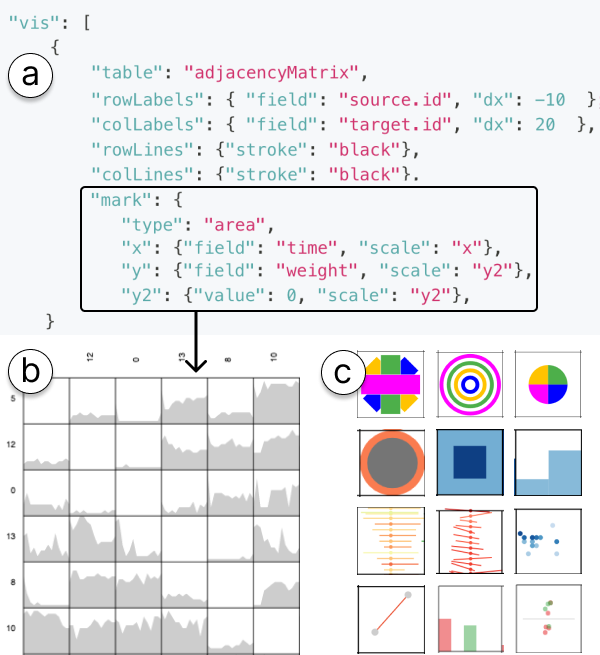
Besides the just mentioned basic marks, NetPanorama provides ways to create more complex visual marks: a) area shapes can create arbitrary shapes by creating polygons, such as line-graphs (Figure 7(a,b)); b) create multiple marks for a group, node, or links and cleverly placing them (Figure 7(c)) to create impressions of bar charts, overlaid shapes or complex stroke-figures as introduced by Brandes and Nick [24]; c) use Nesting to nest multiple vis constructs and create complex visual forms, such as small multiples (Figure 8). Within the inner vis block, it is then possible to determine the available space as bounds to scale content appropriately. Nesting can also be used to create the glyph encoding for adjacency matrices.
![[Uncaptioned image]](/html/2310.18902/assets/figures/interaction.png)
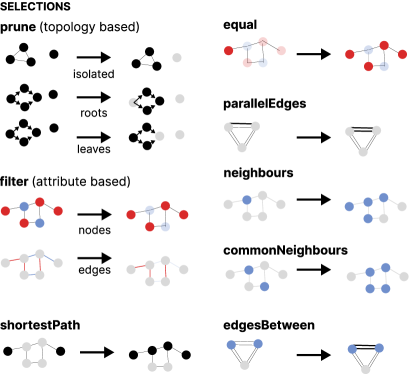
Interaction—NetPanorama supports a set of common interactions to explore networks, such as tool-tips, re-positioning nodes by dragging, mouse-over behavior, panning or zooming. Interactions are specified at different parts in the vis block and mark objects, as shown in our documentation. A global option determines whether panning and zooming are enabled or disabled within a specification, while tooltips, dragging, and mouse-over behaviors are specific to individual visual marks. Parameter values can be bound to a number of elements in a NetPanorama specification and controlled by UI input elements, such as sliders or select boxes. Interacting with these UI elements updates the values of the bound parameters in the visualization; the parameters can be used in constructs such as link transparency, node color, layouts, or orderings. Parameters can also be used in expressions, for example to allow interactive filtering. A selection interaction updates a set of nodes and links defined in a selection. For example, clicking a node or selecting nodes and links with a lasso interaction can add, remove, or toggle membership of the corresponding nodes or edges in a selection. Then, visual appearances for these nodes and links can be updated, such as by changing their color. Selections can also be defined computationally through transformations (Figure 9). For example, a specification may define an interaction that sets one selection to contain the node that was most recently clicked on, and a second selection could be defined to contain the contents of the first selection plus any surrounding nodes; these neighboring nodes could then be drawn in a different color.
4 Implementation
NetPanorama is implemented as a TypeScript library, which accepts a specification in JSONC format (JSON with Comments), loads the required data, and renders the resulting visualization to an SVG or HTML Canvas element. We also implemented an interactive editor, which lets a user enter a specification and view the resulting visualization side-by-side. Accepting JSONC not only allows the inclusion of explanatory comments, but also allows uses to comment-out sections of a specification as they experiment with alternatives. NetPanorama also uses several libraries that are part of the Vega project, for fetching and parsing data from a CSV/JSON file (vega-loader), generating a D3 [23] scale function from a JSON specification (vega-encode), parsing and evaluating expressions in a safe subset of JavaScript (vega-expression), and actually rendering a set of visual marks within an SVG or Canvas element (vega-scenegraph). However, our NetPanorama implementation is a separate system that re-uses some components of the Vega system, rather than being an extension of Vega. Notably, the current system of reactivity in NetPanorama is less sophisticated than that in Reactive Vega: interactions result in full (rather than incremental) re-evaluation of affected entities, though unaffected entities are not re-evaluated. This choice is motivated by a desire for implementation simplicity and initial development speed, and the fact that incremental changes to networks may have ‘global’ effects (e.g., adding or removing an edge may cause changes to the centrality metrics for many nodes, and significantly change shortest paths) Our implementation is available as an npm package netpanorama.
5 Discussion
NetPanorama is a grammar for wrangling and visualizing network data intended to for rapid prototyping and design iteration of a wide range of network visualizations. By designing NetPanorama with a wide set of visualizations in mind (see NetPanorama: A Declarative Grammar for Network Construction, Transformation, and Visualization and our examples online), obtained from the extensive literature on network visualization techniques, NetPanorama is both different from existing network visualization toolkits as well as aiming to be a useful design resources for the years to come. It’s range of layouts and visual mappings can create a wide range of bespoke, and possibly novel designs. The inclusion of network wrangling options from import, to construction, and analysis also make NetPanorama a choice in applications that do not primarily focus on the visualization, yet allows for rapid extension in the future.
Lessons learned: NetPanorama is currently used by different developers not involved in its creation to design and build interactive storytelling pieces with networks444e.g., https://actor-network-russia.onrender.com and to implement visualizations in the upcoming version of our interactive multiple-coordinated views platform for network visualization The Vistorian [7]. Programming with NetPanorama has sped up our process in designing network visualizations and has shifted the focus of our discussions away from implementation issues towards to particular design requirements and complementary views for each application: What’s a good ratio of node to edge size in a visualization? Which orderings make most sense for a given data set and audience? Which visualizaions are complementary? and How do we balance the distribution of information across multiple visualization? In hindsight, we have found ourselves following a “more-is-more approach” for each of our co-design projects: build lots of simple visualizations first, triage by usefulness, then aggregate and complement. This process has made our design processes extremely agile and has helped open the eyes of our collaborators to the richness of visualization designs as well as the richness of information in their data and the different ways these information can be important to them. NetPanorama gives us a language to talk to our collaborators and hands over the ‘DNA’ of each visualization, yet easily editable.
While NetPanorama is far from capturing the entire richness of all existing an future network visualizations—and we believe no formalization might ever be able to do so [57]—we hope that NetPanorama becomes a basis for further extensions and explorations and lead to the development of an ecosystem of surrounding tools for analysis, design exploration, collaboration, and evaluation. Instead of hard-coding high-level and abstract visualization techniques, the different constructs within NetPanorama help blur the boundaries between the rather abstract concepts of visualization techniques. By separating concepts for ordering, network construction, layouts, and visual marks, we help translate concepts from one technique to the other and provide a conceptual toolbox. In our current work, we are using this toolbox to explore visualization designs for networks while at the same time critically questioning the limitations of each of these designs to data types (network size, density, additional attributes, temporal aspects, ..) and tasks. Alongside the primitives described in NetPanorama, this discussion can help inform design spaces and design patterns as well as potentially formalize rules to chose or adapt designs for a given data set on the fly.
Extensions to NetPanorama could include networks in 3-dimensional space (e.g., [24, 8]), which would enable an extended set of interaction techniques, such as unfolding a matrix cube [8] or applying a 3D distortion [26]. This could use WebGL to render in the browser, or the DXR grammar [81] to render in virtual or mixed reality. Advanced interaction techniques for aggregation and exploration (e.g., [71, 6]) can provide further exciting opportunities for NetPanorama and would help popularize powerful interactions for network visualization. Interaction techniques could change the network and its visualization at different levels of the pipeline: changing the network structure through graph transformations (e.g., interactively aggregating nodes), changing layouts and visual mappings (e.g., semantic zoom, or portals [38]) or changing the specific rendering (e.g., lenses, semantic zoom, explorations for dense areas [71], link-sliding [60], or interactive link bundling). Care is needed to integrate such interactions in a conceptually unified way, rather than as an ad hoc grab-bag of isolated functionality. Animations in NetPanorama are currently limited to the sequential presentation of static representations, and NetPanorama does not support animated transitions between different visual encodings or layouts [41], or animations to indicate edge directions or flows [72, 44].
Some limitations in the expressiveness of NetPanorama are due to its semantics specifying certain things individually, rather than jointly. For example, NetPanorama provides options to control edge shape but currently processes edges individually rather than jointly adjusting them for edge bundling [49]. Similarly, a topological network layout is computed for a single network: for a dynamic network, NetPanorama can show the nodes and edges present at a particular time using animation or small multiples, but it must either separately compute several layouts or compute a single layout including all nodes and edges—it cannot produce a series of layouts that are stabilised to reduce node movement. Adjacency matrix seriation could also be performed jointly for several matrices (either corresponding to different networks, or different edge types for the same network) [91]. Additional and more specialized layouts or orderings can be implemented as JavaScript functions and used from within NetPanorama using the ‘escape-hatch’ mechanism (section 3): metro-lines, confluence graphs [9], TimeCurves [10, 93] or the custom re-ordering technique in Massive Sequence Views [92]. Eventually, future extension can include the full functionality of packages such as networkX [39] or igraph [27].
Improvements to the Library and Editor: While creating our library, performance and scalability to large graphs was not a priority. Work could be done to increase the performance and scalability of the system, such as by rendering using WebGL, switching to a more granular incremental reactive computational model like that used by reactive Vega [76], and offloading data storage and processing from the browser to a server (as done by VegaPlus [105]). Switching to a reactive model could also allow NetPanorama to visualize streaming datasets; currently, it requires all data to be available as soon as the specification is evaluated. We can also imagine suggestions and checkers that make sure that required parameters are inserted with default values.
Additional Tools: NetPanorama lays the foundations for an ecosystem of tools, including more concise languages and templates, and graphical interfaces that augment the textual specifications [37]. A recommender system could propose visual representations for a particular dataset and task. Visualization specifications and designs could be shared easily online, adapted for specific applications on demand. We point the reader and developer to our documentation and gallery.
Acknowledgements
We would like to thank for feedback: Jean-Daniel Fekete, Alexis Pister, Xinhuan Shu, and Jinrui Wang. J.Scott-Brown and B. Bach acknowledge funding from EPSRC (Project EP/V010662/1).
References
- [1] E. Adar. GUESS: a language and interface for graph exploration. In Proc. CHI, pp. 791–800, 2006. doi: 10/b2g378
- [2] J.-w. Ahn, C. Plaisant, and B. Shneiderman. A task taxonomy for network evolution analysis. IEEE TVCG, 20(3):365–376, 2013.
- [3] M. AlKadi, V. Serrano, J. Scott-Brown, C. Plaisant, J.-D. Fekete, U. Hinrichs, and B. Bach. Understanding barriers to network exploration with visualization: A report from the trenches. IEEE TVCG, 2022.
- [4] U. Aslak and B. Maier. Netwulf: Interactive visualization of networks in Python. Journal of Open Source Software, 4(42):1425, oct 2019. doi: 10/gr2d8x
- [5] D. Auber, D. Archambault, R. Bourqui, M. Delest, J. Dubois, A. Lambert, P. Mary, M. Mathiaut, G. Melançon, B. Pinaud, B. Renoust, and J. Vallet. TULIP 5. In Encyclopedia of Social Network Analysis and Mining, pp. 1–28. Springer, Aug. 2017. doi: 10/j39t
- [6] B. Bach, N. Henry-Riche, T. Dwyer, T. Madhyastha, J.-D. Fekete, and T. Grabowski. Small multipiles: Piling time to explore temporal patterns in dynamic networks. CGF, 34(3):31–40, 2015. doi: 10/f7kqm2
- [7] B. Bach, N. Henry Riche, R. Fernandez, E. Giannisakis, B. Lee, and J.-D. Fekete. NetworkCube: Bringing Dynamic Network Visualizations to Domain Scientists. Posters of InfoVis, Oct. 2015. Poster.
- [8] B. Bach, E. Pietriga, and J.-D. Fekete. Visualizing dynamic networks with matrix cubes. In Proc. CHI, pp. 877–886, 2014. doi: 10/gfz65s
- [9] B. Bach, N. H. Riche, C. Hurter, K. Marriott, and T. Dwyer. Towards unambiguous edge bundling: Investigating confluent drawings for network visualization. IEEE TVCG, 23(1):541–550, 2016. doi: 10/f92gdt
- [10] B. Bach, C. Shi, N. Heulot, T. Madhyastha, T. Grabowski, and P. Dragicevic. Time curves: Folding time to visualize patterns of temporal evolution in data. IEEE TVCG, 22(1):559–568, 2015. doi: 10/gg2c52
- [11] M. Bastian, S. Heymann, and M. Jacomy. Gephi: An open source software for exploring and manipulating networks. In International AAAI Conference on Weblogs and Social Media, 2009.
- [12] T. Baudel and B. Broeksema. Capturing the design space of sequential space-filling layouts. IEEE TVCG, 18(12):2593–2602, Dec. 2012. doi: 10/f4ftn5
- [13] M. Baur. visone - Software for the Analysis and Visualization of Social Networks. PhD thesis, Karlsruhe Institute of Technology, 2008.
- [14] F. Beck, M. Burch, S. Diehl, and D. Weiskopf. The State of the Art in Visualizing Dynamic Graphs. In EuroVis - STARs. The Eurographics Association, 2014. doi: 10/ghndv2
- [15] R. Becker, S. Eick, and A. Wilks. Visualizing network data. IEEE TVCG, 1(1):16–28, mar 1995. doi: 10/cpfk3h
- [16] M. Behrisch, B. Bach, N. Henry Riche, T. Schreck, and J.-D. Fekete. Matrix reordering methods for table and network visualization. CGF, 35(3):693–716, 2016. doi: 10/f8v5ng
- [17] S. Bender-deMoll and D. A. McFarland. The art and science of dynamic network visualization. J. Soc. Struct., 7, 2006.
- [18] A. Bezerianos, F. Chevalier, P. Dragicevic, N. Elmqvist, and J.-D. Fekete. Graphdice: A system for exploring multivariate social networks. CGF, 29(3):863–872, 2010. doi: 10/d7t8ts
- [19] A. Bigelow, C. Nobre, M. Meyer, and A. Lex. Origraph: Interactive network wrangling. In Proc. VAST. IEEE, Oct. 2019. doi: 10/gpsvww
- [20] F. Bloch, M. O. Jackson, and P. Tebaldi. Centrality measures in networks, 2021. doi: 10/gr2d88
- [21] V. D. Blondel, J.-L. Guillaume, R. Lambiotte, and E. Lefebvre. Fast unfolding of communities in large networks. Journal of statistical mechanics: theory and experiment, 2008(10):P10008, 2008.
- [22] M. Bostock and J. Heer. Protovis: A graphical toolkit for visualization. IEEE TVCG, 15(6):1121–1128, nov 2009. doi: 10/b6wxzm
- [23] M. Bostock, V. Ogievetsky, and J. Heer. D3 data-driven documents. IEEE TVCG, 17(12):2301–2309, Dec. 2011. doi: 10/b7bhhf
- [24] U. Brandes, T. Dwyer, and F. Schreiber. Visualizing related metabolic pathways in two and a half dimensions. In International Symposium on Graph Drawing, pp. 111–122. Springer, 2003. doi: 10/d954mw
- [25] M. Burch and S. Diehl. TimeRadarTrees: Visualizing dynamic compound digraphs. CGF, 27(3):823–830, may 2008. doi: 10/fnkbv6
- [26] M. S. T. Carpendale, D. J. Cowperthwaite, and F. D. Fracchia. Extending distortion viewing from 2d to 3d. IEEE Computer Graphics and Applications, 17(4):42–51, 1997. doi: 10/fgqrgh
- [27] G. Csardi and T. Nepusz. The igraph software package for complex network research. InterJournal Complex Systems, 1695(5):1–9, 2006.
- [28] Cyram Inc. NetMiner - social network analysis software., 2000.
- [29] DataStorm. visNetwork, an r package for interactive network visualization, 2020. [Accessed 13-Dec-2022].
- [30] W. De Nooy, A. Mrvar, and V. Batagelj. Exploratory social network analysis with Pajek. Cambridge University Press, Cambridge, 2018.
- [31] T. Dwyer. cola.js: Constraint-Based Layout in the Browser. http://marvl.infotech.monash.edu/webcola/, 2013. [Online; accessed 10-Mar-2019].
- [32] T. Dwyer, Y. Koren, and K. Marriott. IPSep-CoLa: An incremental procedure for separation constraint layout of graphs. IEEE TVCG, 12(5):821–828, 2006. doi: 10/fpq3c3
- [33] J.-D. Fekete. Reorder.js: A JavaScript Library to Reorder Tables and Networks. IEEE VIS 2015, Oct. 2015. Poster.
- [34] J.-D. Fekete, D. Wang, N. Dang, and C. Plaisant. Overlaying Graph Links on Treemaps. In Information Visualization. IEEE, Seattle, United States, Oct. 2003.
- [35] M. Franz, C. T. Lopes, G. Huck, Y. Dong, O. Sumer, and G. D. Bader. Cytoscape.js: a graph theory library for visualisation and analysis. Bioinformatics, p. btv557, Sept. 2015. doi: 10/ggnndg
- [36] T. Ge, Y. Zhao, B. Lee, D. Ren, B. Chen, and Y. Wang. Canis: A high-level language for data-driven chart animations. CGF, 39(3):607–617, June 2020. doi: 10/gmr2kt
- [37] L. Grammel, C. Bennett, M. Tory, and M.-A. Storey. A Survey of Visualization Construction User Interfaces. In M. Hlawitschka and T. Weinkauf, eds., EuroVis - Short Papers. The Eurographics Association, 2013. doi: 10/gm53zw
- [38] S. Hadlak, H.-J. Schulz, and H. Schumann. In situ exploration of large dynamic networks. IEEE TVCG, 17(12):2334–2343, 2011. doi: 10/bq73f4
- [39] A. A. Hagberg, D. A. Schult, and P. J. Swart. Exploring network structure, dynamics, and function using NetworkX. In Proc. 7th Python in Science Conference, pp. 11 – 15. Pasadena, CA USA, 2008.
- [40] J. Heer and A. Perer. Orion: A system for modeling, transformation and visualization of multidimensional heterogeneous networks. Information Visualization, 13(2):111–133, dec 2012. doi: 10/f5wggh
- [41] J. Heer and G. Robertson. Animated transitions in statistical data graphics. IEEE TVCG, 13(6):1240–1247, 2007. doi: 10/dvqddt
- [42] J. Hoffswell, A. Borning, and J. Heer. SetCoLa: High-level constraints for graph layout. CGF, 37(3):537–548, jun 2018. doi: 10/gdxbxs
- [43] D. Holten. Hierarchical edge bundles: Visualization of adjacency relations in hierarchical data. IEEE TVCG, 12(5):741–748, sep 2006. doi: 10/cvd875
- [44] D. Holten, P. Isenberg, J. J. van Wijk, and J.-D. Fekete. An extended evaluation of the readability of tapered, animated, and textured directed-edge representations in node-link graphs. In 2011 IEEE Pacific Visualization Symposium. IEEE, mar 2011. doi: 10/cn3tm2
- [45] N. W. Kim, E. Schweickart, Z. Liu, M. Dontcheva, W. Li, J. Popovic, and H. Pfister. Data-driven guides: Supporting expressive design for information graphics. IEEE TVCG, 23(1):491–500, 2016.
- [46] Y. Kim and J. Heer. Gemini: A grammar and recommender system for animated transitions in statistical graphics. IEEE TVCG, 27(2):485–494, Feb. 2021. doi: 10/gh536p
- [47] M. Krzywinski, I. Birol, S. J. Jones, and M. A. Marra. Hive plots—rational approach to visualizing networks. Briefings in bioinformatics, 13(5):627–644, 2012.
- [48] B. Lee, C. Plaisant, C. S. Parr, J.-D. Fekete, and N. Henry. Task taxonomy for graph visualization. In Proceedings of the 2006 AVI workshop on BEyond time and errors: novel evaluation methods for information visualization, pp. 1–5, 2006.
- [49] A. Lhuillier, C. Hurter, and A. Telea. State of the art in edge and trail bundling techniques. CGF, 36(3):619–645, June 2017. doi: 10/gbntrf
- [50] D. Li, H. Mei, Y. Shen, S. Su, W. Zhang, J. Wang, M. Zu, and W. Chen. Echarts: a declarative framework for rapid construction of web-based visualization. Visual Informatics, 2(2):136–146, 2018. doi: 10/gf2w8m
- [51] G. Li, M. Tian, Q. Xu, M. J. McGuffin, and X. Yuan. GoTree: A grammar of tree visualizations. In Proc. CHI. ACM, Apr. 2020. doi: 10/gh52r5
- [52] Z. Liu, S. B. Navathe, and J. T. Stasko. Ploceus: Modeling, visualizing, and analyzing tabular data as networks. Information Visualization, 13(1):59–89, jun 2013. doi: 10/f5t2qt
- [53] Z. Liu, J. Thompson, A. Wilson, M. Dontcheva, J. Delorey, S. Grigg, B. Kerr, and J. Stasko. Data illustrator. In Proc. CHI. ACM, apr 2018. doi: 10/gh52tg
- [54] S. LYi, Q. Wang, F. Lekschas, and N. Gehlenborg. Gosling: A grammar-based toolkit for scalable and interactive genomics data visualization. IEEE TVCG, 28(1):140–150, Jan. 2022. doi: 10/gr2d8n
- [55] I. Lyttle and Vega/Vega-Lite Developers. vegawidget: ‘Htmlwidget’ for ‘Vega’ and ‘Vega-Lite’, 2022. R package version 0.4.2.
- [56] F. McGee, M. Ghoniem, G. Melançon, B. Otjacques, and B. Pinaud. The state of the art in multilayer network visualization. CGF, 38(6):125–149, Mar. 2019. doi: 10/ggnqjq
- [57] A. McNutt. No grammar to rule them all: A survey of JSON-style DSLs for visualization. IEEE Transactions on Computer Graphics and Visualization (TVCG), 2023.
- [58] A. M. McNutt and R. Chugh. Integrated visualization editing via parameterized declarative templates. In Proc. CHI. ACM, May 2021. doi: 10/gksk4d
- [59] D. Moritz, C. Wang, G. L. Nelson, H. Lin, A. M. Smith, B. Howe, and J. Heer. Formalizing visualization design knowledge as constraints: Actionable and extensible models in Draco. IEEE TVCG, 25(1):438–448, jan 2019. doi: 10/cs68
- [60] T. Moscovich, F. Chevalier, N. Henry, E. Pietriga, and J.-D. Fekete. Topology-aware navigation in large networks. In Proc. CHI, CHI ’09, p. 2319–2328. Association for Computing Machinery, New York, NY, USA, 2009. doi: 10/fq6fxz
- [61] C. Nielsen, S. Jackman, I. Birol, and S. Jones. ABySS-explorer: Visualizing genome sequence assemblies. IEEE TVCG, 15(6):881–888, nov 2009. doi: 10/c9tjp7
- [62] C. Nobre, M. Meyer, M. Streit, and A. Lex. The state of the art in visualizing multivariate networks. CGF, 38(3):807–832, June 2019. doi: 10/ghpp2g
- [63] NWB Team. Indiana University, Northeastern University, and University of Michigan. Network Workbench tool., 2006.
- [64] T. L. Pedersen. An Implementation of Grammar of Graphics for Graphs and Networks — ggraph.data-imaginist.com. https://ggraph.data-imaginist.com, 2017. [Accessed 04-Mar-2022].
- [65] T. P. Peixoto. The graph-tool python library. figshare, 2014. doi: 10/gr2d8w
- [66] A. Perer and B. Shneiderman. Systematic yet flexible discovery. In Proc. AVI. ACM Press, 2008. doi: 10/cpvcjz
- [67] G. Perrone, J. Unpingco, and H. minn Lu. Network visualizations with Pyvis and VisJS, 2020.
- [68] A. Poorthuis, L. V. der Zee, G. Guo, J. H. Keong, and B. Dy. Florence: a web-based grammar of graphics for making maps and learning cartography. Cartographic Perspectives, Dec. 2020. doi: 10/gh7rtx
- [69] C. Reas and B. Fry. Processing: programming for the media arts. AI & SOCIETY, 20(4):526–538, may 2006. doi: 10/cbdw6m
- [70] D. Ren, B. Lee, and M. Brehmer. Charticulator: Interactive construction of bespoke chart layouts. IEEE TVCG, 25(1):789–799, 2019. doi: 10/gh52rx
- [71] N. H. Riche, T. Dwyer, B. Lee, and S. Carpendale. Exploring the design space of interactive link curvature in network diagrams. In Proc. AVI. ACM Press, 2012. doi: 10/gr2d87
- [72] H. Romat, C. Appert, B. Bach, N. Henry-Riche, and E. Pietriga. Animated edge textures in node-link diagrams. In Proc. CHI. ACM, apr 2018. doi: 10/gr2d82
- [73] M. Roughan and J. Tuke. Unravelling graph-exchange file formats, 2015.
- [74] S. P. Borgatti and M.G. Everett and L.C. Freeman (Analytic Technologies). UCINET for windows: Software for social network analysis., 2002.
- [75] A. Satyanarayan, D. Moritz, K. Wongsuphasawat, and J. Heer. Vega-lite: A grammar of interactive graphics. IEEE TVCG, 2017. doi: 10/f92f32
- [76] A. Satyanarayan, R. Russell, J. Hoffswell, and J. Heer. Reactive Vega: A streaming dataflow architecture for declarative interactive visualization. IEEE TVCG, 2016. doi: 10/gdqd7v
- [77] S. Schöttler, Y. Yang, H. Pfister, and B. Bach. Visualizing and interacting with geospatial networks: A survey and design space. CGF, 40(6):5–33, apr 2021. doi: 10/gnd79m
- [78] Sciences-Po médialab and OuestWare. Sigma.js — sigmajs.org. https://www.sigmajs.org/, 2013. [Accessed 06-Sep-2022].
- [79] P. Shannon, A. Markiel, O. Ozier, N. S. Baliga, J. T. Wang, D. Ramage, N. Amin, B. Schwikowski, and T. Ideker. Cytoscape: A software environment for integrated models of biomolecular interaction networks. Genome Research, 13(11):2498–2504, nov 2003. doi: 10/b7kgpg
- [80] B. Shneiderman and A. Aris. Network visualization by semantic substrates. IEEE TVCG, 12(5):733–740, 2006. doi: 10/dcgs99
- [81] R. Sicat, J. Li, J. Choi, M. Cordeil, W.-K. Jeong, B. Bach, and H. Pfister. Dxr: A toolkit for building immersive data visualizations. IEEE TVCG, 25(1):715–725, 2019. doi: 10/ggfwp6
- [82] A. Slingsby, J. Dykes, and J. Wood. Configuring hierarchical layouts to address research questions. IEEE TVCG, 15(6):977–984, Nov. 2009. doi: 10/fvk6tx
- [83] M. Smith, A. Ceni, N. Milic-Frayling, B. Shneiderman, E. Mendes Rodrigues, J. Leskovec, and C. Dunne. NodeXL: a free and open network overview, discovery and exploration add-in for excel 2007/2010/2013/2016 from the social media research foundation, 2010.
- [84] M. A. Smith, B. Shneiderman, N. Milic-Frayling, E. M. Rodrigues, V. Barash, C. Dunne, T. Capone, A. Perer, and E. Gleave. Analyzing (social media) networks with NodeXL. In Proc. international conference on Communities and technologies - C&T '09. ACM Press, 2009. doi: 10/bbkvtj
- [85] J. Stasko, C. Görg, and Z. Liu. Jigsaw: supporting investigative analysis through interactive visualization. Information visualization, 7(2):118–132, 2008.
- [86] C. D. Stolper, M. Kahng, Z. Lin, F. Foerster, A. Goel, J. Stasko, and D. H. Chau. GLO-STIX: Graph-level operations for specifying techniques and interactive eXploration. IEEE TVCG, 20(12):2320–2328, Dec. 2014. doi: 10/f6qkhf
- [87] R. Tamassia, ed. Handbook of graph drawing and visualization. Discrete Mathematics and Its Applications. CRC Press, London, England, Oct. 2016.
- [88] W. Tao, X. Hou, A. Sah, L. Battle, R. Chang, and M. Stonebraker. Kyrix-S: Authoring scalable scatterplot visualizations of big data. IEEE TVCG, 27(2):401–411, Feb. 2021. doi: 10/ghgthr
- [89] W. Tao, X. Liu, Y. Wang, L. Battle, Ç. Demiralp, R. Chang, and M. Stonebraker. Kyrix: Interactive pan/zoom visualizations at scale. CGF, 38(3):529–540, jun 2019. doi: 10/ggw3f7
- [90] S. Tyner, F. Briatte, and H. Hofmann. Network visualization with ggplot2. The R Journal, 9(1):27, 2017. doi: 10/ggcncd
- [91] N. van Beusekom, W. Meulemans, and B. Speckmann. Simultaneous matrix orderings for graph collections. IEEE TVCG, 28(1):1–10, 2022. doi: 10/gm4tpf
- [92] S. van den Elzen, D. Holten, J. Blaas, and J. J. van Wijk. Dynamic network visualization withExtended massive sequence views. IEEE TVCG, 20(8):1087–1099, aug 2014. doi: 10/f6c2dh
- [93] S. van den Elzen, D. Holten, J. Blaas, and J. J. van Wijk. Reducing snapshots to points: A visual analytics approach to dynamic network exploration. IEEE TVCG, 22(1):1–10, 2015. doi: 10/gf8sbd
- [94] J. VanderPlas, B. E. Granger, J. Heer, D. Moritz, K. Wongsuphasawat, A. Satyanarayan, E. Lees, I. Timofeev, B. Welsh, and S. Sievert. Altair: Interactive statistical visualizations for python. Journal of Open Source Software, 3(32):1057, 2018. doi: 10/cxrt
- [95] C. Vehlow, F. Beck, and D. Weiskopf. The State of the Art in Visualizing Group Structures in Graphs. In EuroVis - STARs. The Eurographics Association, 2015. doi: 10/gr2d8k
- [96] T. von Landesberger, A. Kuijper, T. Schreck, J. Kohlhammer, J. van Wijk, J.-D. Fekete, and D. Fellner. Visual analysis of large graphs: State-of-the-art and future research challenges. CGF, 30(6):1719–1749, Apr. 2011. doi: 10/cc4dfz
- [97] J. Walny, C. Frisson, M. West, D. Kosminsky, S. Knudsen, S. Carpendale, and W. Willett. Data changes everything: Challenges and opportunities in data visualization design handoff. IEEE TVCG, 26(1):12–22, jan 2020. doi: 10/gh52rz
- [98] Y. Wang, Z. Bai, Z. Lin, X. Dong, Y. Feng, J. Pan, and W. Chen. G6: A web-based library for graph visualization. Visual Informatics, 5(4):49–55, Dec. 2021. doi: 10/gr2d8q
- [99] Z. Wang, H. Romat, F. Chevalier, N. H. Riche, D. Murray-Rust, and B. Bach. Interactive data comics. IEEE TVCG, 28(1):944–954, 2021. doi: 10/gq9sxm
- [100] M. Wattenberg. Visual exploration of multivariate graphs. In Proc. CHI, pp. 811–819, 2006. doi: 10/fknmzs
- [101] H. Wickham. A layered grammar of graphics. Journal of Computational and Graphical Statistics, 19(1):3–28, Jan. 2010. doi: 10/cttwkf
- [102] H. Wickham and H. Hofmann. Product plots. IEEE TVCG, 17(12):2223–2230, Dec. 2011. doi: 10/b2pc59
- [103] L. Wilkinson. The grammar of graphics. Springer, New York, 1999.
- [104] L. William JR. Combing the hairball with biofabric: a new approach for visualization of large networks. BMC Bioinformatics, 2012.
- [105] J. Yang, H. K. Joo, S. S. Yerramreddy, S. Li, D. Moritz, and L. Battle. Demonstration of VegaPlus: Optimizing declarative visualization languages. In Proc. International Conference on Management of Data. ACM, jun 2022. doi: 10/gr2d85
- [106] V. Yoghourdjian, D. Archambault, S. Diehl, T. Dwyer, K. Klein, H. C. Purchase, and H.-Y. Wu. Exploring the limits of complexity: A survey of empirical studies on graph visualisation. Visual Informatics, 2(4):264–282, 2018. doi: 10/ggjnn5