Gas density influences the transition from capillary collapse to surface seal in microfluidic jet impacts on deep pools
Abstract
Studies of liquid jet impacts onto a deep liquid pool are of great significance for a multitude of engineering and environmental applications. During jet impact, the free surface of the pool deforms and a cavity is generated. Simultaneously, the free surface of the cavity extends radially outward and forms a rim. Eventually the cavity collapses by means of gas inertia and surface tension. In this work we study numerically such cavity collapse, under different impact velocities and ambient gas density conditions. An axisymmetric numerical model, based on the volume of fluid method is constructed in Basilisk C. This model is validated by qualitative and quantitative comparison with theory and experiments, in a parameter range that has not been previously explored. Our results show two distinct regimes in the cavity collapse mechanism. By considering forces pulling along the interface, we derive scaling arguments for the time of closure and maximum radius of the cavity, based on the Weber number. For jets with uniform constant velocity from tip to tail and the cavity closure is capillary dominated and happens below the surface (deep seal). In contrast, for the cavity closure happens above the surface (surface seal) and is dominated by the gas entrainment and the pressure gradient that it causes. Our results provide information for understanding pollutant transport during droplet impacts on large bodies of water, and other engineering applications, like additive manufacturing, lithography and needle-free injections.
1 Introduction
The pioneering work of Worthington (1908) displaying and describing liquid impacts onto pools initiated a century-long interest into characterising such impact phenomena. Understanding the intricacies of these events is relevant for a broad spectrum of situations in nature; the noise of rain (Prosperetti et al., 1989) or the scent of earth after rain on a hot day (Joung & Buie, 2015), as well as in technology such as in inkjet printing (van der Bos et al., 2014) or spray atomisation (Panão & Moreira, 2005). Of particular interest has been the air entrainment, cavity formation and collapse (Lee et al., 1997; Truscott et al., 2014; Eshraghi et al., 2020; Eggers et al., 2007; Deka et al., 2018). In general, the cavity formation in pools begins when the jet impacts the free surface of the target and deflects its surface. This deflection occurs just before coalescence of the jet and the bath, as the local gas pressure builds up by the approaching liquid jet (Bouwhuis et al., 2015). Upon coalescence the inertia of the high-speed jet dominates the deflection and a hemispherical cavity is formed by the head of the jet (Speirs et al., 2018). Due to its radial expansion, the cavity has lamella shooting radially outwards, extending the walls of the cavity. The remainder of the jet impacts the base of the newly formed cavity and extends it primarily in the direction of travel, producing a slender cavity (Bouwhuis et al., 2015). In this process the kinetic energy of the jet is converted to potential surface energy and heat due to dissipation (Speirs et al., 2018).
There is, however, a stark disparity in the amount of work done on projectiles in the millimetre regime (Engel, 1966; Pumphrey & Elmore, 1990; Rein, 1993; Oguz et al., 1995; Yarin, 2006; Barolo et al., 2006; Aristoff & Bush, 2009; Zhang et al., 2012; Agbaglah & Deegan, 2014; Truscott et al., 2014; Fudge et al., 2021) compared to projectiles in the micrometer regime (Bouwhuis et al., 2016; Speirs et al., 2018; Quetzeri-Santiago et al., 2021; Quetzeri-Santiago & Rivas, 2023). For cavities generated by projectiles in the millimetre range the collapse can be mainly attributed to the hydrostatic pressure (Oguz et al., 1995). This implies that the Bond number () is greater than one (where and are the density and surface tension of the liquid, is a relevant length scale and g the acceleration due to gravity). The domain of interest for our work is in the micrometer regime, where collapse is driven by surface tension forces as . This regime is relevant in emerging technologies as 3D printing (Antkowiak et al., 2011), spray painting (Herczyński et al., 2011), extreme ultraviolet lithography (Klein et al., 2015), environmental aspects (Speirs et al., 2023) and needle free injection methods (Berrospe-Rodriguez et al., 2016; Oyarte Galvez et al., 2020; van der Ven et al., 2023).
In this work, we looked into the dynamics of a high-speed microfluidic jet penetrating a pool. These jets are comparable in size and momentum produced in needle free applications (Schoppink & Rivas, 2022). A validation process was done through both qualitative and quantitative comparisons with other numerical results, experiments and theoretical predictions. In addition we quantified the cavity profile and closure time of the cavity as a function of relevant fluid parameters. Our numerical strategy provides the opportunity to examine a broad parameter space unconstrained from experimental limitations.
2 Methodology
Experimental details
A transparent cubic bath made of acrylic with dimensions of cm, was filled with water. High-speed jets were generated from a thermocavitation process and directed to impact a water pool. The setup is similar to the ones used in refs. (Quetzeri-Santiago et al., 2021; Quetzeri-Santiago & Rivas, 2023). The thermocavitation process occurs inside a glass microfluidic chip filled a Direct Red 81 solution in water at 0.5 wt. . In thermocavitation, a expanding bubble is created at the base of the chip, due to the energy transfer to the liquid from a continuous wave laser. The expanding bubble pushes the liquid that is in front of it generating the jet (Oyarte Gálvez et al., 2020). The jet velocity and diameter in these experiments ranged from 10 m/s to 40 m/s, and 25-100 m respectively. The surface tension of water is N/m, its density kg/m3 and its viscosity cP. Thus, the Weber number , and the Reynolds numbers range between 35-1333 and 500-4000, respectively. The processes of bubble generation, jet ejection and impact on the liquid droplet were recorded with a Photron Fastcam SAX2 coupled with a 2x Navitar microscope objective. A typical experiment duration was ms and the camera resolution was set to pixels2 at a sample rate of k frames per second with an exposure time of s.
Numerical model
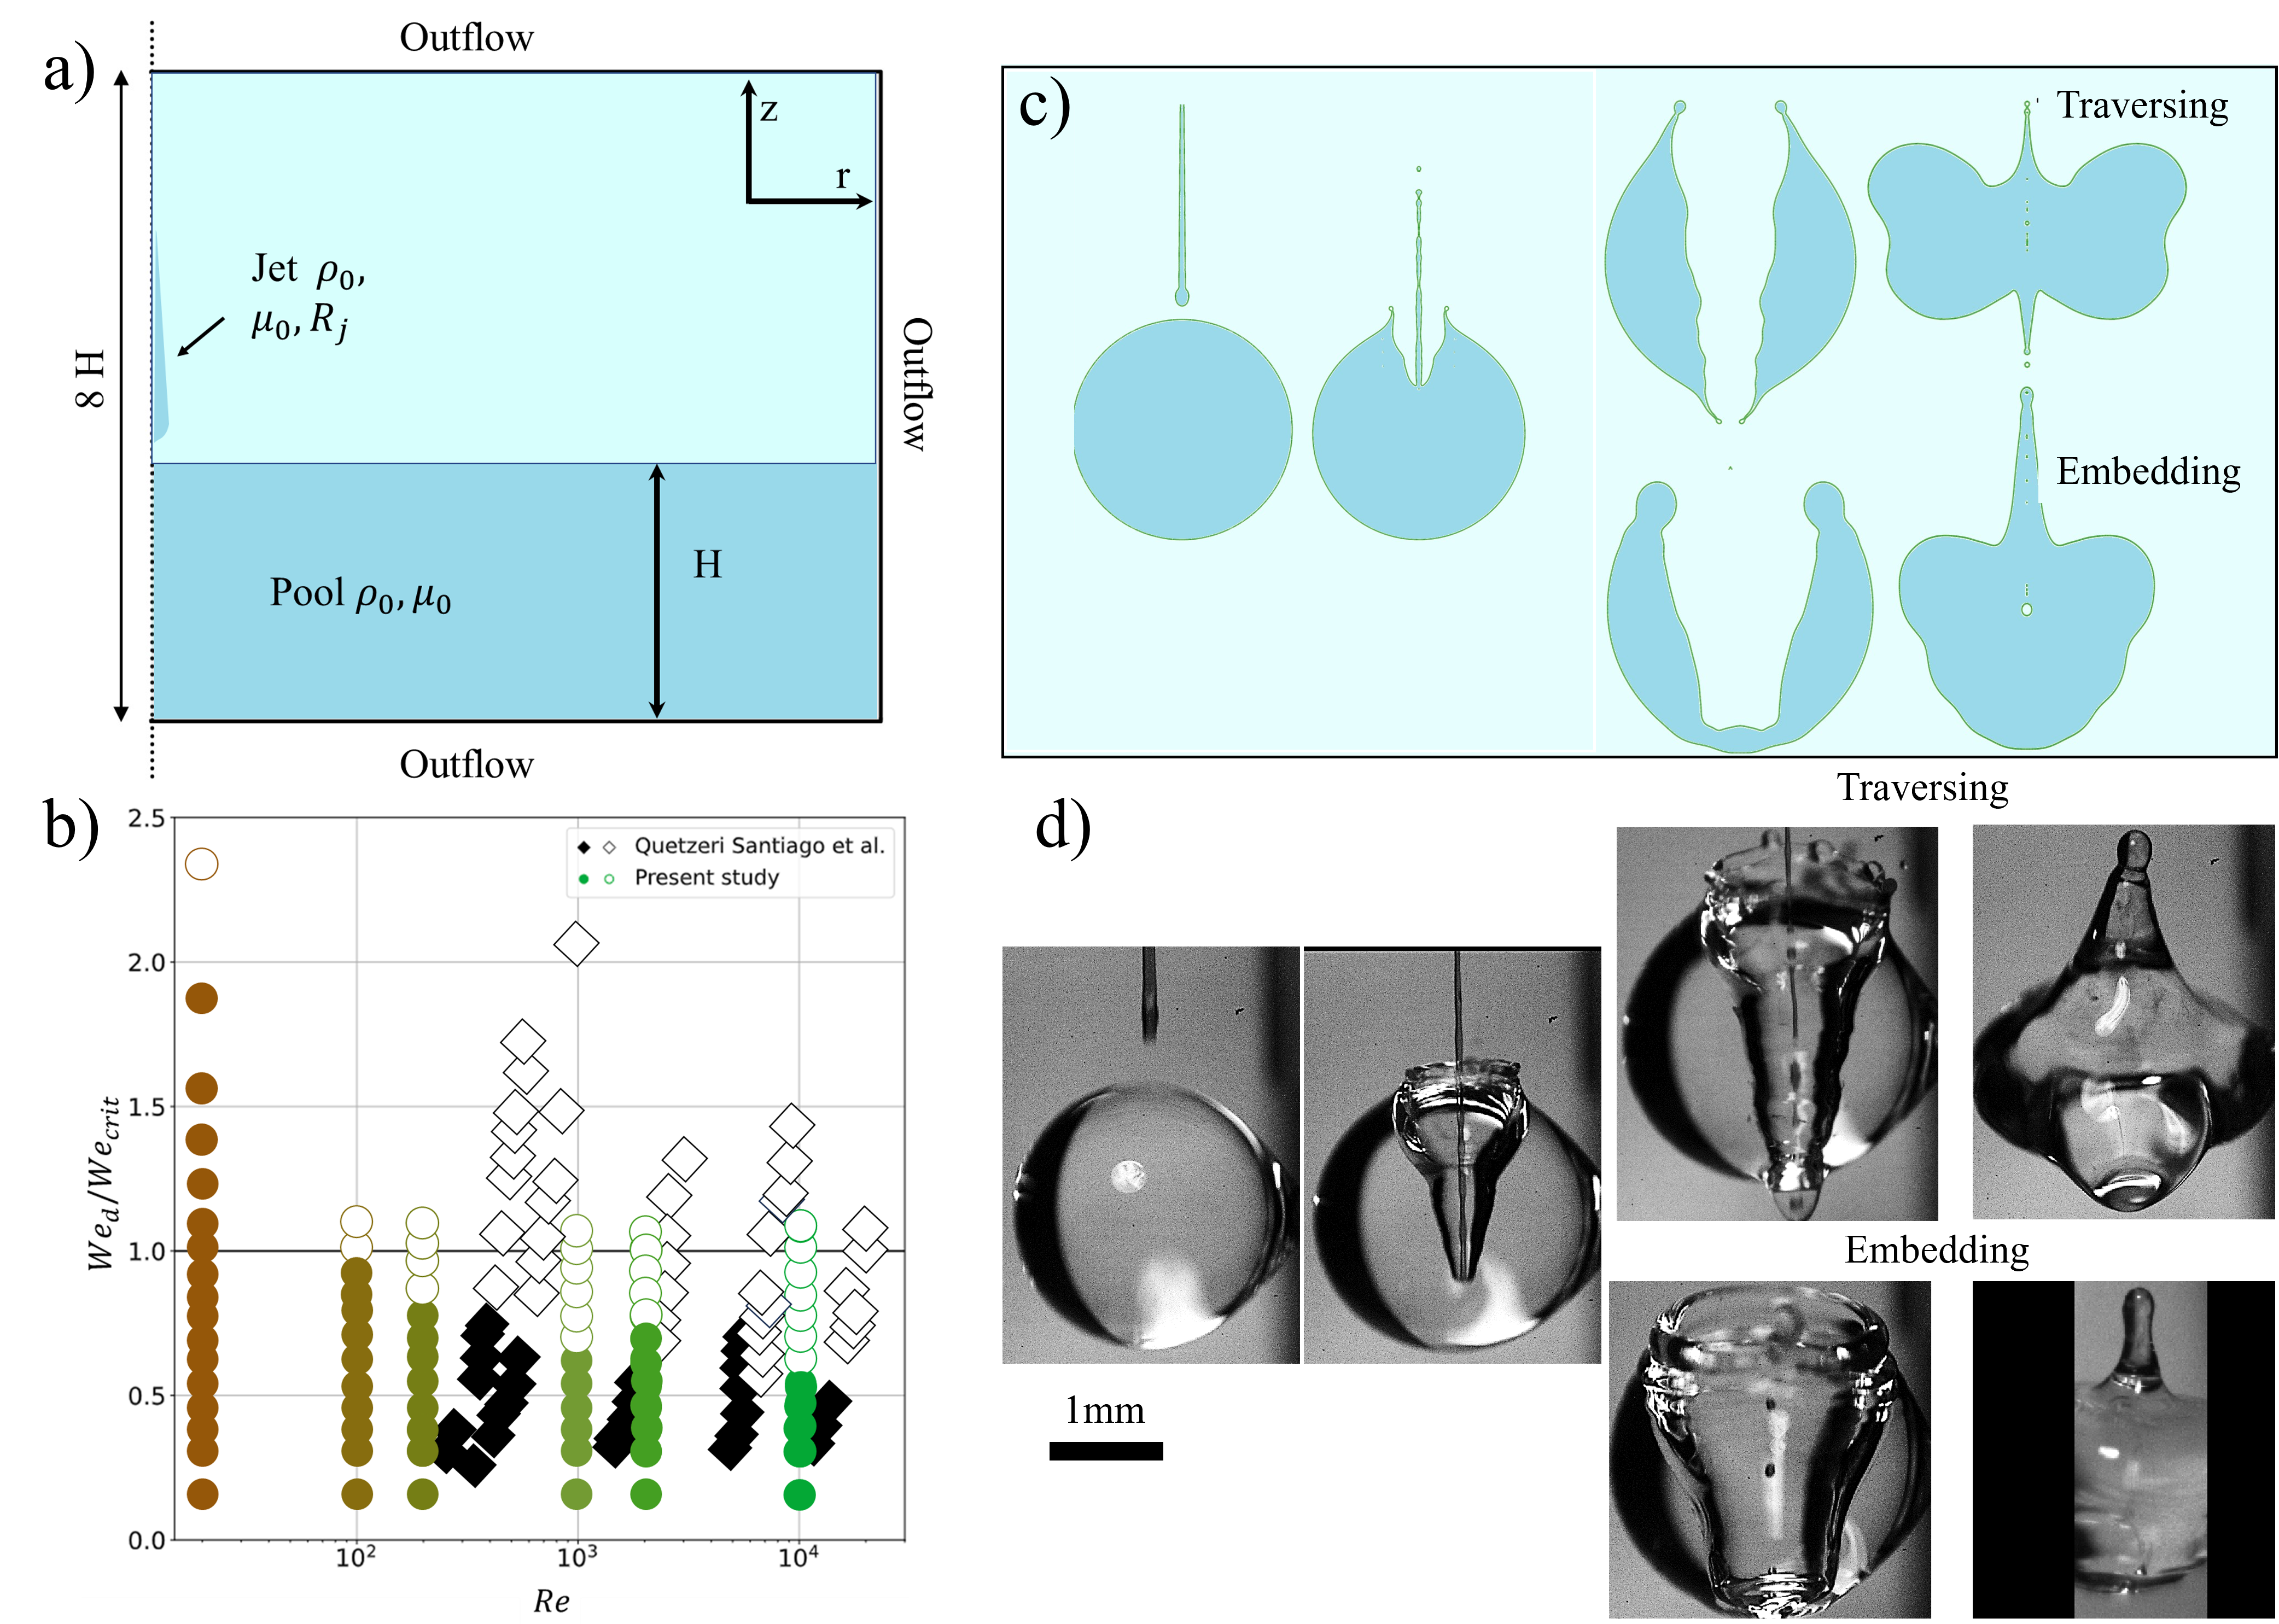
We consider a liquid jet impacting a pool of identical liquid with velocity . The jet is cylindrical with radius and length and is placed at a distance between the free surface level of the pool and the tip of the jet. The domain is axisymmetric and filled with ambient gas. The top, right and bottom boundaries have outflow conditions imposed with the pressure as , zero normal velocity gradients (top and bottom, ; right, ) and zero shear stresses (top and bottom, ; right, ). Since we are studying jet impact in the micro/millimetre regime, effects of gravity are neglected () as hydrostatic effects are small (Quetzeri-Santiago et al., 2021).
The governing equations are nondimensionalised with the initial radius of the jet and the impact velocity of the jet .
| (1) |
| (2) |
Which represent conservation of mass and momentum respectively. In here is the velocity vector, is the pressure, is the viscous stress tensor, is the Weber number and . The last term represents capillary effects, where is the interface curvature. Ensuring that this term is handled at the liquid interface, the characteristic function is used. Lastly, is the normal to the interface. The geometric Volume of Fluid (VoF) method is used to track the interfaces, with a VoF tracer such that,
| (3) |
Therefore, the one-fluid approximation is used in the momentum equation (2) by means of the following arithmetic equations:
| (4) |
The incompressible Navier-Stokes equations are solved using the finite volume partial differential equation solver Basilisk C Popinet (2009, 2018). With Basilisk, a variety of partial differential equation can be solved with parallelization capabilities on an adaptive mesh refinement (AMR) grid. An example of the mesh refinement used in this work can be seen in figure S1 in the supplementary materials. This solver employs The Bell-Colella-Glaz (BCG) scheme (Bell et al., 1989), which is a robust second order upwind scheme. In this scheme a projection method is used similar to Chorin (1967) where the pressure and velocity solutions for equations 1 and 2 are decoupled. In this work, we use an improvement on Chorin’s method, where we couple the projection and diffusion-convection steps by the BCG scheme. The projection method is also known as a fractional step method, where intermediate iterative steps are used to uncouple the pressure solution while maintaining a divergence-free velocity field.
Validation
Validation of the code was performed first qualitatively comparing simulations of a microfluidic jet impacting a liquid droplet. Figures 1 b) and c), illustrate the capabilities of the numerical technique to reproduce the traversing and embedding phenomena observed in the experiments. The numerical setup is similar to the one in figure 1, but instead of a deep pool we initialise a droplet with radius . Next, we tested the ability of the code to reproduce the traversing and embedding threshold obtained experimentally and reported in previous works (Quetzeri-Santiago et al., 2021). After the impact of a microfluidic jet onto a droplet a cavity is created and if the impact velocity is enough to overcome the surface tension of the droplet will traverse it completely. The critical Weber number for traversing the droplet was found by comparing the Young-Laplace and dynamic pressures in the cavity. To assess the validity of was experimentally compared with the Weber number based on the jet inertia and the droplet surface tension , i.e., , for a given Ohnesorge number . In our simulations, we maintain a constant while varying , an unattainable condition to the experiments due to the inherent properties of liquids. Figure 1 b) shows excellent agreement between the experiments and simulations. Furthermore, simulations show that at the threshold increases and deviates from the experimental threshold which is lower than the prediction . This indicates that viscous dissipation can influence the traversing process for more viscous liquids than the ones used on the experiments.
To quantify the numerical convergence, the energy distribution over time is calculated. The supplementary materials provides further details of the energy calculation. We show the energy allocation for different resolutions over the penetration time frame in a bar plot presented in Figure S2 in the supplementary materials. The energy is normalised by the total energy initially present at highest refinement (). From this bar plot we draw multiple conclusions. First we note that over time the total energy is not fully conserved, albeit that increasing the refinement does mitigate the losses. Therefore, we attribute this energy loss to be inherent to the numerical method. Regarding the distribution of energy the fractions are comparable, especially for the three highest refinements. This makes evident that the numerical process converges at resolution .
3 Experimental results
Similarly to the case of the impact of a microfluidic jet onto a droplet, air is entrained when the jet impacts a deep liquid pool, and a cavity is formed (figure 2). The cavity continues expanding in both the radial and the direction, until it collapses. Previous research shows that for during the cavity expansion the process is inertial and the cavity adopts a slender shape (Bouwhuis et al., 2016). Upon reaching the maximum cavity size, interfacial tension starts to influence the cavity dynamics, as kinetic energy is converted into surface energy of the newly formed cavity. The time it takes to reach this regime is approximated by relating the dynamic pressure and the Young-Laplace pressure of the cavity (Quetzeri-Santiago et al., 2021). However, depending on the Weber number the cavity can collapse from the surface (surface seal, figure 2 a) or generate collapse below the original position of the surface (deep seal, figure 2 b). The shape of the cavities and bubbles entrapped are similar to those of impacts on capillary bridges (Quetzeri-Santiago & Rivas, 2023). In these experiments we observe deep seal from , while surface seal is observed from (see figure 2). These findings align with the regime map described in van der Ven et al. (2023), categorising them within the “splashing substrate” region, specifically located at its leftmost boundary, considering a shear modulus G of water equal to 0.

In figure 3 a) we show simulation results of the cavity profile evolution of the impact of a cylindrical jet with uniform velocity onto a pool for . For all the Weber numbers at the cavity evolution is similar, as is inertia dominated. However, at a deviation from the profiles is observed. Similar to the experiments, for a rim forms and propels the pool surface upward from its equilibrium surface level. The rim is thinner and shoots higher up as the Weber number increases. In contrast for , surface tension prohibits a slender rim to develop and to advance above the equilibrium surface level. Now the rim of the cavity is flattened and develops into a spherical blob of liquid. Consequently, the seal mechanism differs in both cases, while for the cavity closure is above the pool equilibrium surface level, the opposite is true for . Here, although the qualitative phenomena is similar, the critical Weber number to transition from surface seal to capillary collapse is shifted by . Furthermore, an upward jet resulting from the cavity collapse, i.e., a Worthington jet observed in experiments for is not reproduced in the simulations.
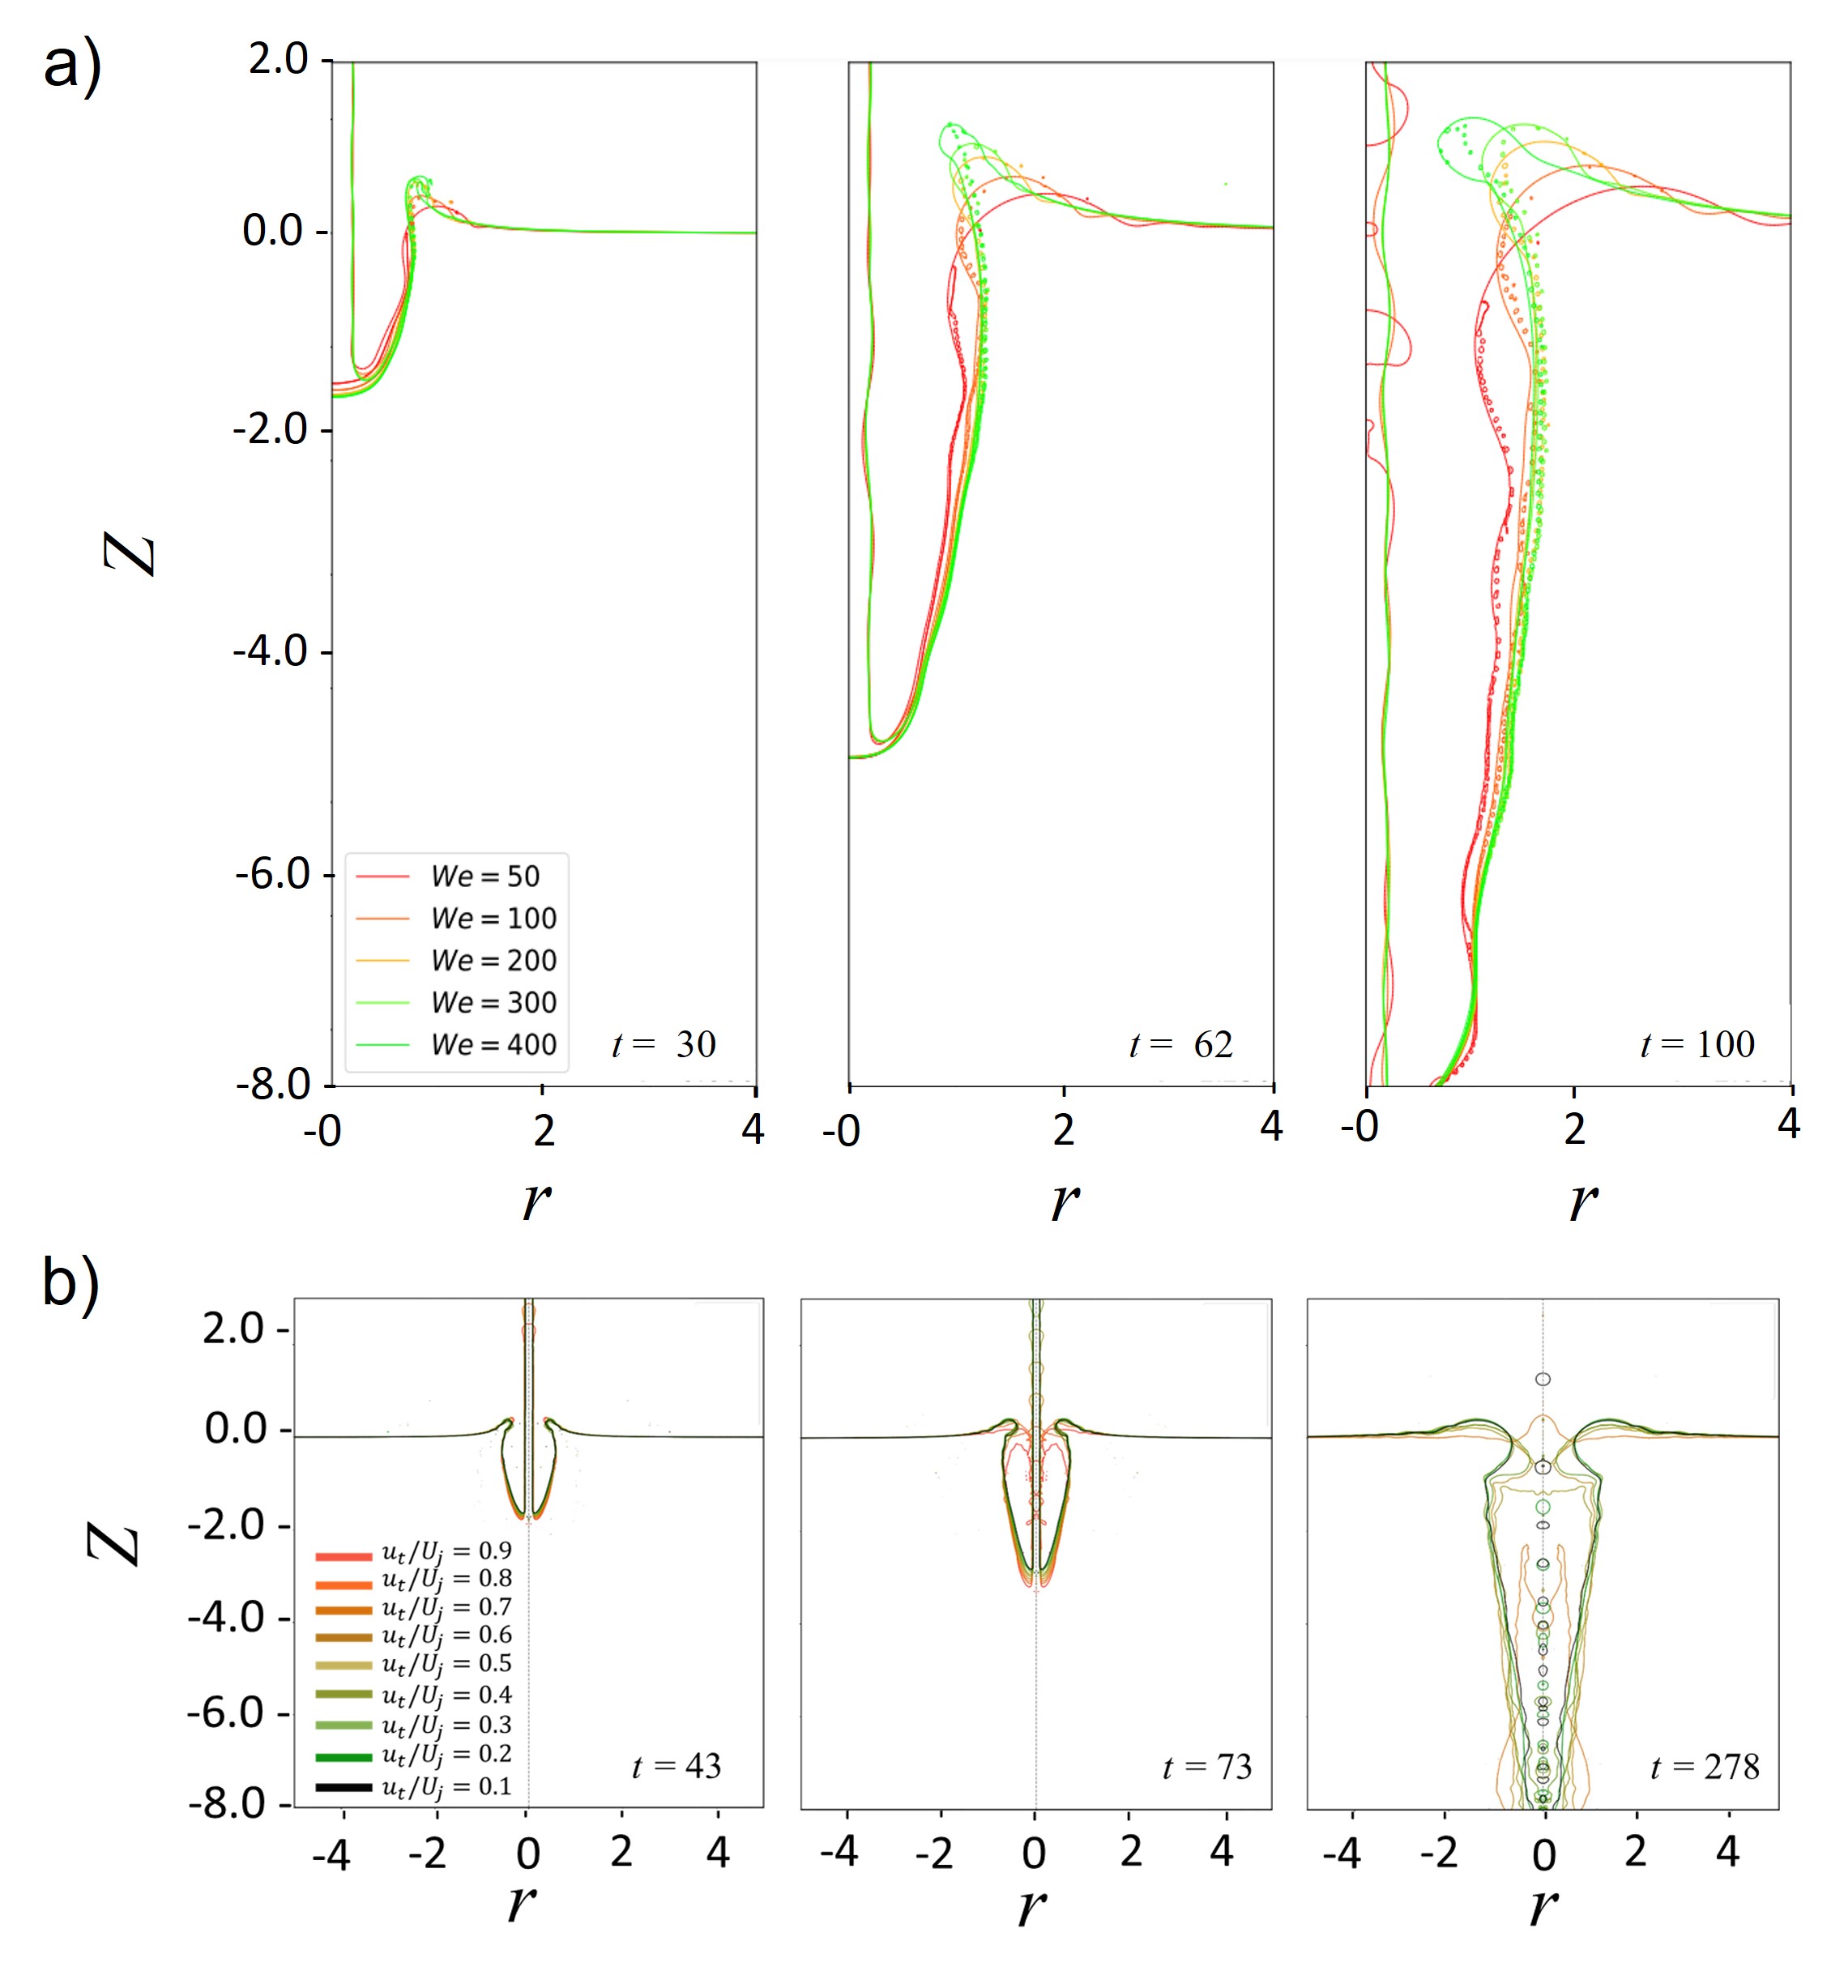
In the experiments, due to the decelerating nature of the bubble expansion, the impacting jet exhibited a difference between the jet tail velocity and the jet tip velocity . Conversely, in our simulations, the velocity remained uniform throughout the entire jet. To bridge this gap, we conducted simulations in which, for simplicity, we implemented a linearly decreasing velocity gradient from the jet’s tip to its tail. In this approach, we established the velocity at the tip of the jet as our reference point and systematically adjusted the tail’s velocity to 10, 20, and so on, up to 100 of the tip’s velocity.
The outcome of these simulations at a imposing the aforementioned velocity profiles, are depicted in Figure 3b). We note that a higher tip velocity correlated with an earlier cavity collapse, and the location of cavity collapse approached the surface as increased. Notably, when tail velocities ranged from 0.9 to 0.4 relative to the tip, the impact result manifested as a surface seal. In contrast, tail velocities in the range of 0.3 to 0.1 yielded a deep seal. Consequently, by incorporating a falling linear velocity gradient within our jet simulations, we not only achieved qualitative alignment with our experimental data but also quantitatively replicated the transition from deep to surface seal. However, for simplicity in the remaining of the discussion we keep the jets with uniform velocity distribution.
4 Cavity dynamics model and simulations
When the cavity is formed, part of the kinetic energy of the jet transforms in surface energy by the creation of new surface. Thus, the free surface of the cavity has more surface energy than a pool in equilibrium. It is therefore energetically favourable for the interface to restore its rest state. In this way surface tension forces () counteract the radial expansion of a cavity induced by inertia. Nevertheless, jet inertia can also cause a pressure gradient that creates a force that points to the impact centre. By using Bernoulli’s principle, along a streamline extending along the surface, one notes that the gas density and velocity contribute to a pressure difference,
| (5) | |||||
| (6) |
This gradient in pressure induces a force that pulls towards the centre where the pressure is lower. In the remainder of this work, we call this the Bernoulli suction force ().
To characterise the collapse time we model the trajectory of the rim of the cavity by considering the radial component of the surface tension force and Bernoulli suction force (see figure 4). We assume that the forces only act radially. This enables us to to find analytical expressions for the pinch-off time. However, in reality this is a simplification as it does not consider the rim to translate vertically.

The differential mass of the rim , where we assume the rim to be circular in cross section, is subjected to the two forces,
| (7) | |||||
| (8) |
To get an analytical solution for the radial coordinate of the rim, we look into the limits where one force is negligible, which we explore in the next sections.
4.1 Radial surface tension regime
To explain the pinch-off time for , we neglect the Bernoulli suction force and assume the only force driving the collapse is the surface tension acting in the horizontal coordinate. Therefore, this problem reduces to that of the collapse of a liquid ring. Since the Reynolds number , viscous dissipation can be neglected and we can use potential flow to describe the dynamics. Using mass conservation and that the pressure is governed by the Laplace law, we arrive to the following equation for the evolution of R (Texier et al., 2013),
| (9) |
Assuming that the thickness of the ring is constant, due to volume conservation is also constant (Texier et al., 2013). Therefore, we can linearise equation 9, considering that during most time of the closure, and we obtain,
| (10) |
By integrating 10 and using that at , and we get,
| (11) |
Therefore, the closure time is
| (12) |
4.2 Bernoulli suction regime
For , the contribution of surface tension to the collapse can be neglected, and is dominated by the Bernoulli suction force, therefore,
| (13) | |||||
| (14) | |||||
| (15) |
Where as Marston et al. (2016) argued, the sheet radius scales with the surface tension coefficient when applying Taylor-Culick law, which relates the radial speed of holes opening up in a sheet to its thickness and interfacial tension, .
Solving equation 15 we get the time for cavity pinch-off,
| (16) |
We note that at , the initial velocity of expansion is independent of , i.e., . Using this fact and Taylor-Culick law for the time of closure is,
| (17) |
4.3 Model comparison with simulations
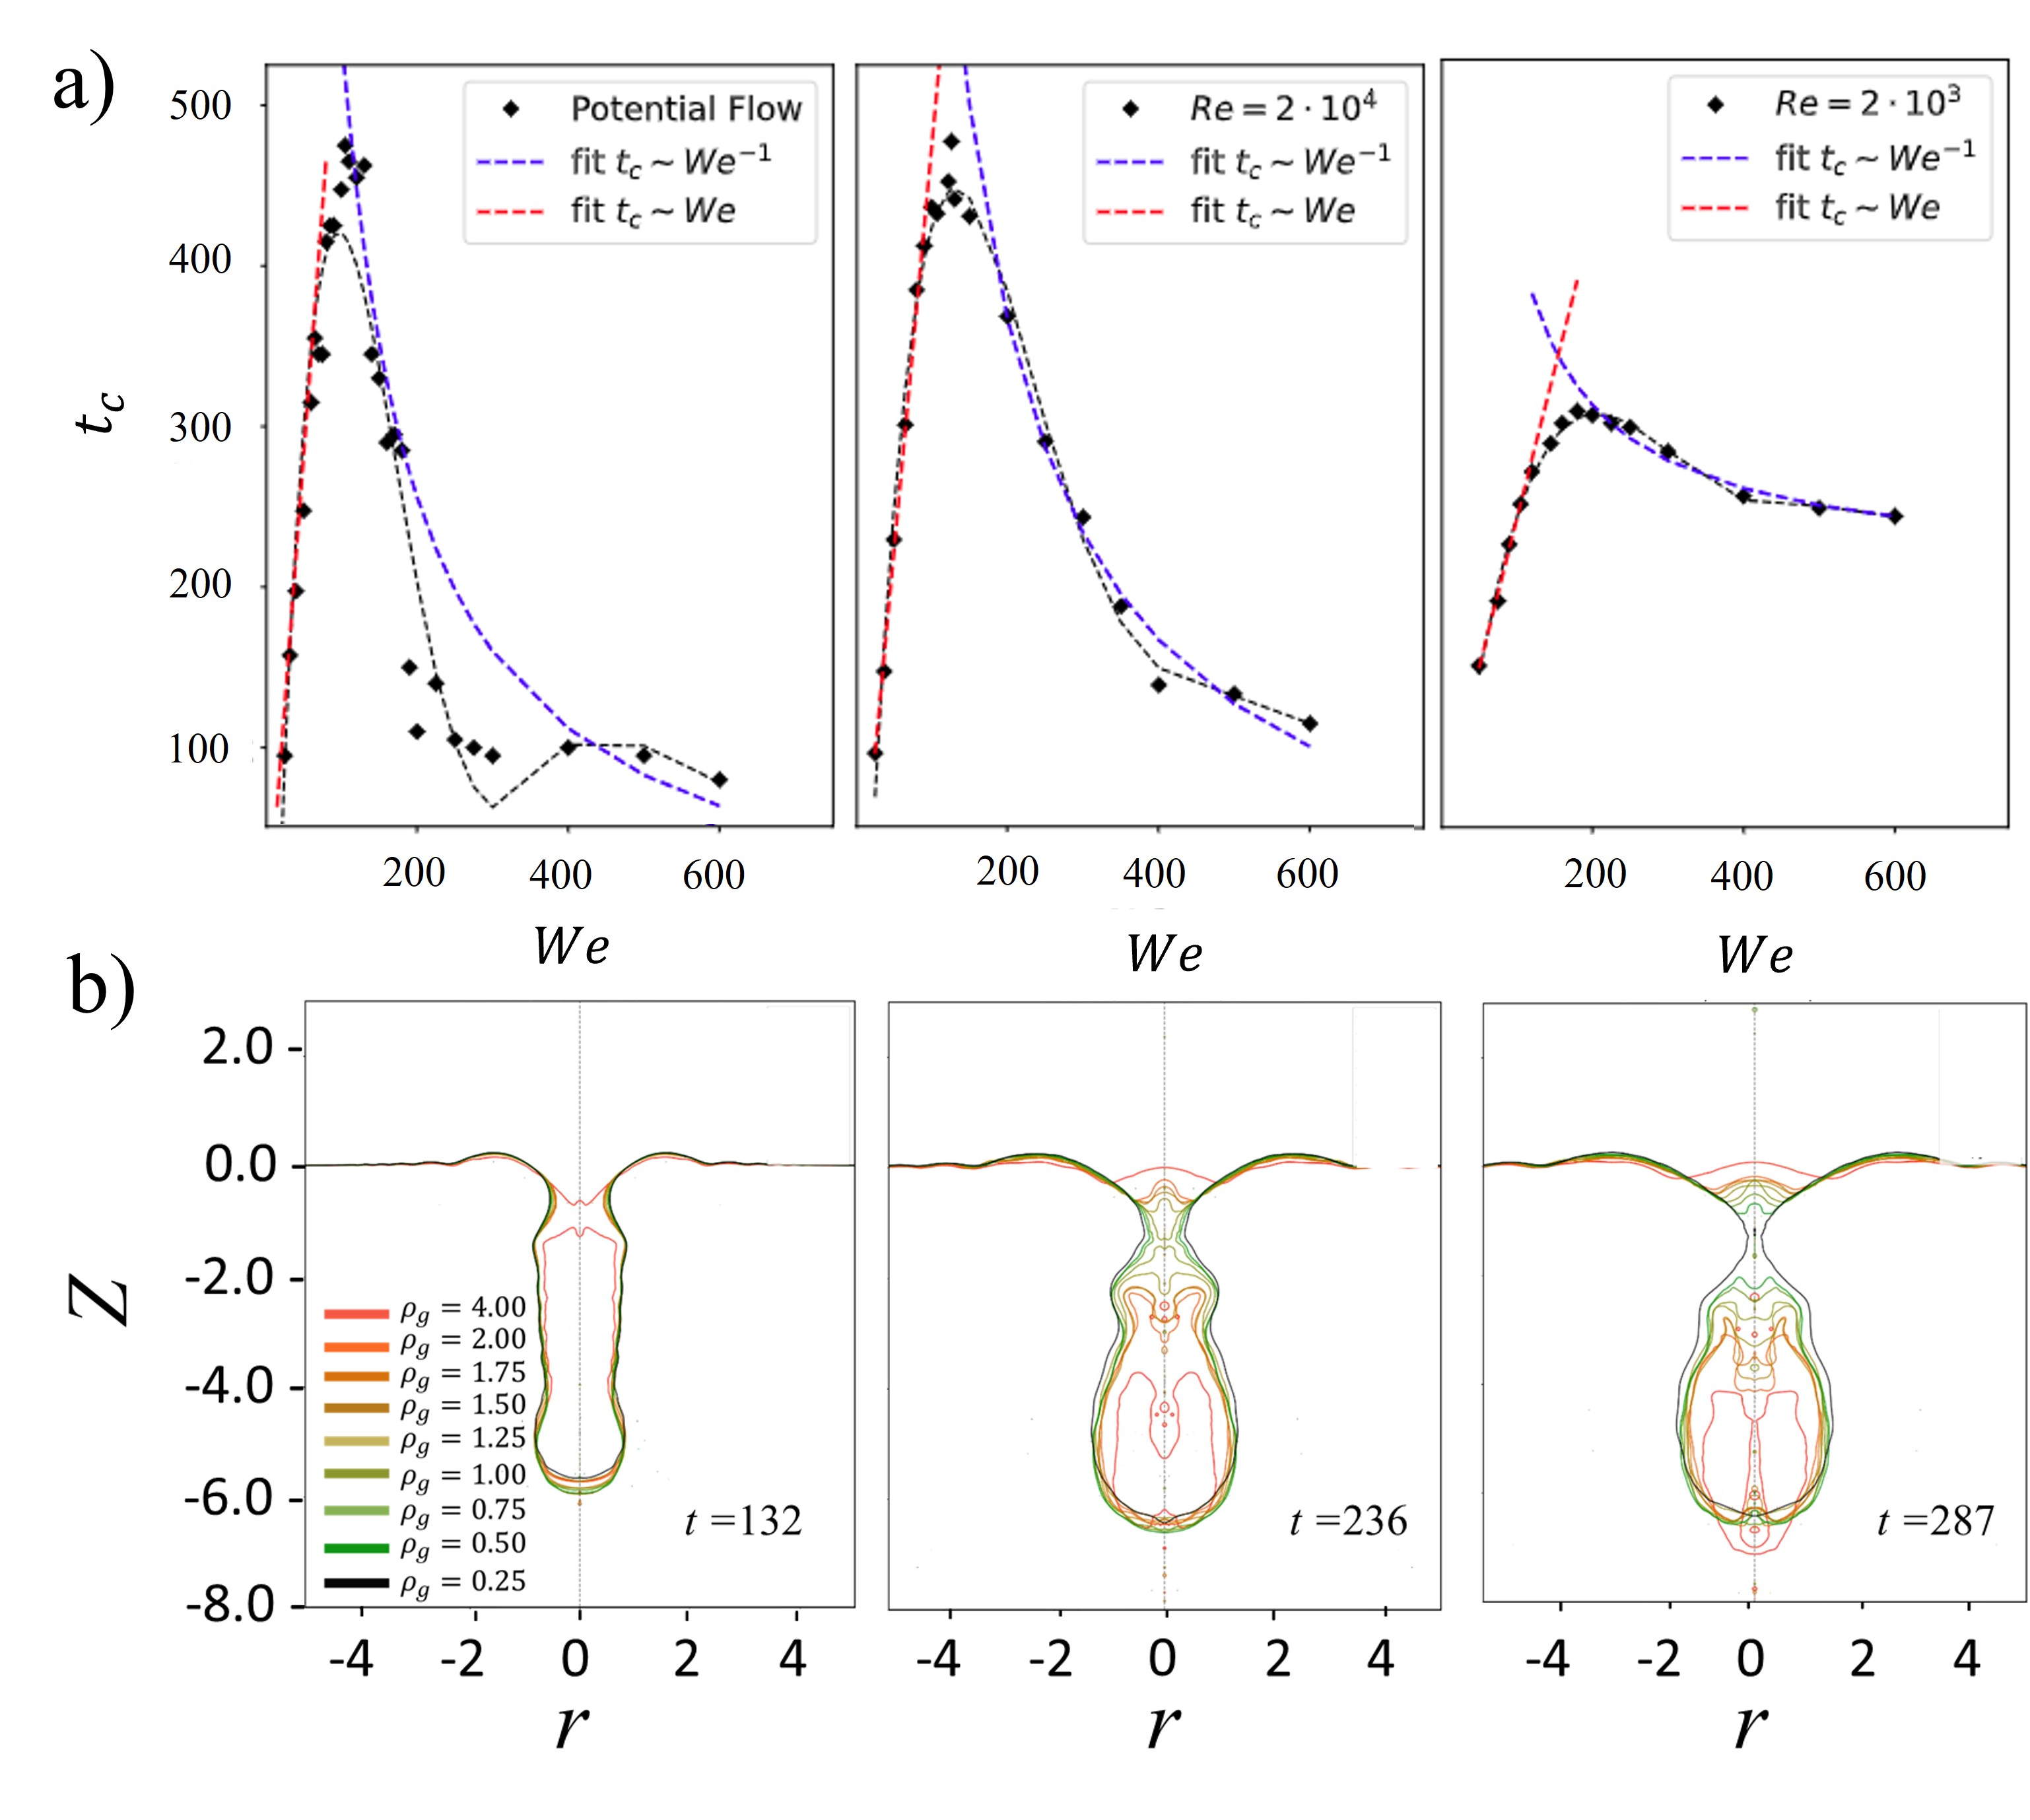
Figure 5 shows the collapse time in terms of the Weber number for four different Weber numbers. Here we observe that in all the cases the closure time reaches a maximum and then it decreases. This can be explained by a collapse regime transition from capillary dominated to the air suction dominated. Indeed, in figure 5 a) we show that the scalings obtained in equations 12 and 17, match very well with the simulations. Here we also notice that for a Reynolds number , the maximum time of closure is 40 than for the potential flow case. This can be attributed to a smaller radial extension due to viscous dissipation. In contrast, for , the time of collapse is 50 larger than for the potential flow. Since equations 17 and 12 do not depend on , we expect that the transition from a capillary collapse to the pressure driven collapse do not depend on the . Figure 5 shows that the transition occurs at for all the explored , confirming the closure time independence from .
4.4 Effect on ambient gas density
From our discussion in section 4.2, we would expect that the variation in pressure gradient would determine the time of collapse. Given that the pressure gradient is dominated by the ambient gas density, we expect that an increase in gas density decreases the time of cavity collapse. For , an increase in four times the gas density with respect to the ambient pressure , results in a cavity collapse at , as shown by figure 5b. In contrast, for gas densities at ambient pressure , and under ambient pressure , the cavity collapses at and respectively. These results are in line with research on water entry of a sphere, where it was found that the most important parameter gas parameter influencing the lamella ejection is the gas density. Although, in the latter, air density prevents the cavity collapse by resisting the contact line movement (Williams et al., 2022).
5 Conclusions
We investigated the dynamics of high-speed microfluidic jet impacts on a liquid pool, focusing on the formation and collapse of cavities in the micrometer regime. While previous research primarily explored millimetre-scale projectiles, we delved into the range of micrometer-sized projectiles, where surface tension forces dominate the dynamics and hydrostatic pressure can be neglected.
Our experimental setup involved generating high-speed jets from thermocavitation. The resulting jets impacted a water pool, enabling us to qualitatively and quantitatively examine the cavity formation and closure in a parameter range that has not been previously explored. The numerical simulations we employed provided us with the freedom to explore a wide range of parameter combinations, unconstrained by experimental limitations.
Comparing our experimental and numerical results, we observed two distinctive regimes of cavity closure: capillary and air suction-driven. In the capillary-dominated regime , surface tension played a predominant role, and we obtained analytical expressions that indicated a closure time scaling with We (equation 12). In the air suction regime , the initial velocity of expansion was the crucial factor, and the closure time scaled inversely with We (equation 17).
Our findings revealed that the transition from capillary-driven to air suction-driven closure occurred around for the range of Reynolds numbers considered. This transition point was independent of Reynolds number, indicating an inertial dominated phenomena, where viscous dissipation is negligible. Furthermore, our results shed light on the intricate interplay between gas density and cavity collapse dynamics. These insights into micrometer-scale cavity formation and closure offer valuable knowledge for applications like 3D printing and needle-free injections, and pollutant distribution transport.
Acknowledgements
This research was funded by the European Research Council (ERC) under the European Union Horizon 2020 Research and Innovation Programme (grant agreement no. 851630). M.A.Q-S. acknowledges support from DGAPA through Subprograma de Incorporación de Jóvenes Académicos de Carrera (SIJA). We thank Ulisses Gutiérrez-Hernández for the valuable discussions.
Declaration of interests
The authors report no conflict of interest.
References
- Agbaglah & Deegan (2014) Agbaglah, G & Deegan, RD 2014 Growth and instability of the liquid rim in the crown splash regime. Journal of fluid mechanics 752, 485–496.
- Antkowiak et al. (2011) Antkowiak, A., Audoly, B., Josserand, C., Neukirch, S. & Rivetti, M. 2011 Instant fabrication and selection of folded structures using drop impact. Proceeding of the National Academy of Sciences of the USA 108.
- Aristoff & Bush (2009) Aristoff, Jeffrey M & Bush, John WM 2009 Water entry of small hydrophobic spheres. Journal of Fluid Mechanics 619, 45–78.
- Barolo et al. (2006) Barolo, D., Josserand, C. & Bonn, D. 2006 Singular jets and bubbles in drop impact. Physical Review Letters 96, 124501.
- Bell et al. (1989) Bell, John B, Colella, Phillip & Glaz, Harland M 1989 A second-order projection method for the incompressible navier-stokes equations. Journal of Computational Physics 85 (2), 257–283.
- Berrospe-Rodriguez et al. (2016) Berrospe-Rodriguez, Carla, Visser, Claas Willem, Schlautmann, Stefan, Ramos-Garcia, Ruben & Fernandez Rivas, David 2016 Continuous-wave laser generated jets for needle free applications. Biomicrofluidics 10 (1), 014104.
- van der Bos et al. (2014) van der Bos, Arjan, van der Meulen, Mark-Jan, Driessen, Theo, van den Berg, Marc, Reinten, Hans, Wijshoff, Herman, Versluis, Michel & Lohse, Detlef 2014 Velocity profile inside piezoacoustic inkjet droplets in flight: Comparison between experiment and numerical simulation. Phys. Rev. Applied 1, 014004.
- Bouwhuis et al. (2015) Bouwhuis, W., Hendrix, M.H.W, v.d. Meer, D. & Snoeijer, J.H. 2015 Initial surface deformations during impact on a liquid pool. Journal of Fluid Mechanics 771, 503–519.
- Bouwhuis et al. (2016) Bouwhuis, W., Huang, X., Chan, C.U., Frommhold, Ph.E., Ohl, C.D., Lohse, D., Snoeijer, J.H. & Van Der Meer, D. 2016 Impact of a high-speed train of microdrops on a liquid pool. Journal of Fluid Mechanics 792, 850–868.
- Chorin (1967) Chorin, A.J. 1967 A numerical method for solving incompressible viscous flow problems. Journal of Computational Physics 2 (1), 12–26.
- Deka et al. (2018) Deka, Hiranya, Ray, Bahni, Biswas, Gautam & Dalal, Amaresh 2018 Dynamics of tongue shaped cavity generated during the impact of high-speed microdrops. Physics of Fluids 30 (4), 042103.
- Eggers et al. (2007) Eggers, J, Fontelos, MA, Leppinen, D & Snoeijer, JH 2007 Theory of the collapsing axisymmetric cavity. Physical Review Letters 98 (9), 094502.
- Engel (1966) Engel, O.G. 1966 Crater depth in fluid impacts. Journal of Applied Physics 37, 1798–1808.
- Eshraghi et al. (2020) Eshraghi, Javad, Jung, Sunghwan & Vlachos, Pavlos P. 2020 To seal or not to seal: The closure dynamics of a splash curtain. Phys. Rev. Fluids 5, 104001.
- Fudge et al. (2021) Fudge, Ben D, Cimpeanu, Radu & Castrejón-Pita, Alfonso A 2021 Dipping into a new pool: The interface dynamics of drops impacting onto a different liquid. Physical Review E 104 (6), 065102.
- Herczyński et al. (2011) Herczyński, Andrzej, Cernuschi, Claude & Mahadevan, L. 2011 Painting with drops, jets, and sheets. Physics Today 64 (6), 31–36.
- Joung & Buie (2015) Joung, Y.S. & Buie, C.R. 2015 Aerosol generation by raindrop impact on soil. Nature Communications 6.
- Klein et al. (2015) Klein, Alexander L., Bouwhuis, Wilco, Visser, Claas Willem, Lhuissier, Henri, Sun, Chao, Snoeijer, Jacco H., Villermaux, Emmanuel, Lohse, Detlef & Gelderblom, Hanneke 2015 Drop shaping by laser-pulse impact. Phys. Rev. Applied 3, 044018.
- Lee et al. (1997) Lee, M, Longoria, RG & Wilson, DE 1997 Cavity dynamics in high-speed water entry. Physics of Fluids 9 (3), 540–550.
- Marston et al. (2016) Marston, J. O., Truscott, T. T., Speirs, N. B., Mansoor, M. M. & Thoroddsen, S. T. 2016 Crown sealing and buckling instability during water entry of spheres. Journal of Fluid Mechanics 794, 506–529.
- Oguz et al. (1995) Oguz, Hasan N., Prosperetti, Andrea & Kolaini, Ali R. 1995 Air entrapment by a falling water mass. Journal of Fluid Mechanics 294, 181–207.
- Oyarte Galvez et al. (2020) Oyarte Galvez, Loreto Alejandra, Fraters, Arjan Bernard, Offerhaus, H.L., Versluis, Michel, Hunter, Ian & Fernandez Rivas, David 2020 Microfluidics control the ballistic energy of thermocavitation liquid jets for needle-free injections. Journal of Applied Physics 127 (10).
- Oyarte Gálvez et al. (2020) Oyarte Gálvez, Loreto, Fraters, Arjan, Offerhaus, Herman L, Versluis, Michel, Hunter, Ian W & Fernández Rivas, David 2020 Microfluidics control the ballistic energy of thermocavitation liquid jets for needle-free injections. Journal of Applied Physics 127 (10), 104901.
- Panão & Moreira (2005) Panão, Miguel & Moreira, A.L.N. 2005 Flow characteristics of spray impingement in pfi injection systems. Experiments in Fluids 39, 364–374.
- Popinet (2009) Popinet, S. 2009 An accurate adaptive solver for surface-tension-driven interfacial flows. Journal of Computational Physics 228, 5838–5866.
- Popinet (2018) Popinet, Stéphane 2018 Numerical models of surface tension. Annual Review of Fluid Mechanics 50 (1), 49–75.
- Prosperetti et al. (1989) Prosperetti, A, Crum, L.A. & Pumphrey, H.C. 1989 The underwaternoise of rain. Journal of Geophysical Research: Oceans 94, 3255–3259.
- Pumphrey & Elmore (1990) Pumphrey, H.C. & Elmore, P.A. 1990 The entrainment of bubbles by drop impacts. Journal of FLuid Mechanics 220, 539–567.
- Quetzeri-Santiago et al. (2021) Quetzeri-Santiago, Miguel A., Hunter, Ian W., van der Meer, Devaraj & Fernandez Rivas, David 2021 Impact of a microfluidic jet on a pendant droplet. Soft Matter 17.
- Quetzeri-Santiago & Rivas (2023) Quetzeri-Santiago, Miguel A & Rivas, David Fernandez 2023 Cavity dynamics after the injection of a microfluidic jet onto capillary bridges. Soft matter 19 (2), 245–257.
- Rein (1993) Rein, Martin 1993 Phenomena of liquid drop impact on solid and liquid surfaces. Fluid Dynamics Research 12, 61–93.
- Schoppink & Rivas (2022) Schoppink, Jelle & Rivas, David Fernández 2022 Jet injectors: Perspectives for small volume delivery with lasers. Advanced drug delivery reviews p. 114109.
- Speirs et al. (2023) Speirs, Nathan B, Belden, Jesse L & Hellum, Aren M 2023 The capture of airborne particulates by rain. Journal of Fluid Mechanics 958, A40.
- Speirs et al. (2018) Speirs, Nathan B., Pan, Zhao, Belden, Jesse & Truscott, Tadd T. 2018 The water entry of multi-droplet streams and jets. Journal of Fluid Mechanics 844, 1084–1111.
- Texier et al. (2013) Texier, Baptiste Darbois, Piroird, Keyvan, Quéré, David & Clanet, Christophe 2013 Inertial collapse of liquid rings. Journal of Fluid Mechanics 717.
- Truscott et al. (2014) Truscott, Tadd T, Epps, Brenden P & Belden, Jesse 2014 Water entry of projectiles. Annual Review of Fluid Mechanics 46, 355–378.
- van der Ven et al. (2023) van der Ven, Diana L, Morrone, Davide, Quetzeri-Santiago, Miguel A & Rivas, David Fernandez 2023 Microfluidic jet impact: Spreading, splashing, soft substrate deformation and injection. Journal of colloid and interface science 636, 549–558.
- Williams et al. (2022) Williams, Hollis, Sprittles, James, Padrino, Juan C & Denissenko, Petr 2022 Effect of ambient gas on cavity formation for sphere impacts on liquids. Physical Review Fluids 7 (9), 094003.
- Worthington (1908) Worthington, A.M. 1908 A study of splashes .
- Yarin (2006) Yarin, A.L. 2006 Drop impact dynamics: splashing, spreading, receding, bouncing. Annual Review of Fluid Mechanics 38, 159–192.
- Zhang et al. (2012) Zhang, LV, Toole, J, Fezzaa, K & Deegan, RD 2012 Evolution of the ejecta sheet from the impact of a drop with a deep pool. Journal of Fluid Mechanics 690, 5–15.