Observing the launch of an Eddington wind in the luminous Seyfert galaxy PG1211+143
Abstract
The luminous narrow line Seyfert galaxy PG1211+143 was the first non-BAL AGN to reveal a powerful ionized wind, based on early observations with ESA’s XMM-Newton X-ray Observatory. Subsequent observations, mainly with XMM-Newton and the Japanese Suzaku Observatory, found such winds to be a common feature of luminous AGN. Typical outflow velocities of v c and flow momenta mv are consistent with winds being launched by continuum driving from a disc when the local mass accretion rate is super-Eddington. Here we report the launch of a new, ultra-fast outflow component in PG1211+143 near the end of a 5-week XMM-Newton observing campaign, and discuss its origin in an ultra-fast inflow of similar velocity detected some 3 weeks earlier. We find that the inflow lasted for at least 3 days and delivered some 10 Earth mass of fresh material into the innermost region of the source. While this mass by itself is insufficient to cause a complete inner disc restructuring, we show that it is sufficient to disrupt the X-ray emitting corona of the disc. We conclude that it is this coronal re-arrangement of the inner tens gravitational radii in PG1211+143 that subsequently caused the launch of a new wind.
keywords:
galaxies: active – galaxies: Seyfert: quasars: general – galaxies: individual: PG1211+143 – X-ray: galaxies1 Introduction
X-ray spectra from an XMM-Newton observation of the narrow-line Seyfert galaxy PG1211+143 in 2001 provided the first detection in a non-BAL AGN of strongly blue-shifted absorption lines of highly ionized gas, corresponding to an outflow velocity of 0.150.01c (Pounds et al. 2003, Pounds and Page 2006). Further observations over several years with XMM-Newton, Chandra and Suzaku showed the high velocity outflow to be persistent but of variable opacity (eg Reeves et al. 2008). Evidence that the extended outflow in PG1211+143 was both massive and energetic - with potential importance for galaxy feedback - came from the detection of PCygni and other broad emission features obtained by combining the 2001, 2004 and 2007 XMM-Newton EPIC spectra (Pounds and Reeves 2007, 2009).
Examination of archival data from XMM-Newton and Suzaku has since shown similar ultra-fast, highly-ionized outflows (UFOs) to be relatively common in nearby, luminous AGN (Tombesi 2010, 2011; Gofford 2013). The frequency of these detections confirms a substantial covering factor and hence significant mass and kinetic energy in such winds. Indeed, their integrated mechanical energy may be substantially greater than required to disrupt the bulge gas in the host galaxy, suggesting some winds are intermittent, or that much of the energy in a persistent wind must be lost before reaching the star forming region, perhaps by colliding with pre-ejecta, as seen in an XMM-Newton observation of the low mass Seyfert NGC4051 (Pounds and Vaughan 2011, Pounds and King 2013).
In order to further explore the velocity structure and evolution of the fast wind in PG1211+143 an extended XMM-Newton observation was carried out during 7 spacecraft orbits over the period 2014 June 2 to 2014 July 9. Effective on-target exposures for individual orbits ranged from 50 to 100 ks, with a total duration of 650 ks. Full details of the XMM-Newton observing log are given in Lobban et al.(2016), reporting the results of a detailed timing analysis.
Swift (Gehrels et al. 2004) also observed PG 1211+143 with 43 snapshots, as part of a Target of Opportunity (ToO) programme linked to the XMM-Newton campaign. The Swift observations cover the period 2014 June 4 to 2014 August 4 and have typical durations of 1.5 ks. We have extracted x-ray light curves from the X-ray Telescope (XRT; Burrows et al. 2005) and UV light curves from the Ultra-Violet/Optical Telescope (UVOT; Roming et al. 2005), the latter using the U, UVW1 and UVW2 filters. Full details of the Swift observations are also presented in Lobban et al. (2016).
Figure 1 reproduces the orbital-mean x-ray fluxes from the XMM-Newton pn camera (Strueder et al.2001), together with the first 17 snapshots from the Swift XRT. Both data sets show a deep minimum flux near XMM-Newton orbit 2659 (day 16), when the ultra fast inflow was detected. The Swift light curve is particularly interesting, with its softer x-ray bandwidth responding to both column density and ionization changes in the line-of-sight flow, suggesting the inflow seen in day 16 actually began some 3 days earlier followed by a strong increase in x-ray emission, to a peak in orbit 2664 some 8 days later. The high x-ray flux is then maintained for at least 4 further days, to orbit 2666, but has fallen substantially by the final observation (orbit 2670).
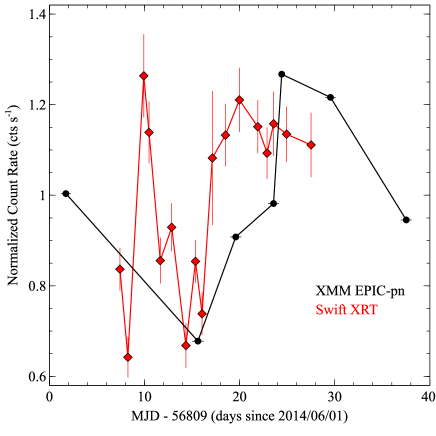
Figure 2 shows x-ray spectra from the XMM-Newton pn camera over the same interval, with orbits 2659(black), 2661(red), 2663(green) and 2664(blue), plotted as a ratio to that of orbit 2652. The broad spectral band highlights the strong soft x-ray absorption associated with the transient accretion event in orbit 2659, which then falls over several days, with the continuum flux continuing to increase to a new peak by orbit 2664.
Published analysis of the 2014 XMM-Newton observation of PG1211+143 has focussed on stacked X-ray spectra, where the high quality data have revealed a complex velocity structure, with primary (high column density) outflow components at v0.067c, v0.129c and v0.187c (Pounds et al.2016a, 2016b; hereafter P16a and P16B)). Given the limited spectral resolution of the pn camera, detection of all 3 outflow velocities in the co-aligned Reflection Grating Spectrometer (RGS: den Herder et al. 2001) was important, while indicating the presence of co-moving higher density matter in each flow component.
Notably, none of the outflow velocities in 2014 were consistent with the powerful outflow of v0.15c in the 2001 initial XMM-Newton observation, while repeated observations of several AGN reported in the afore-mentioned archival searches showed differing velocities weeks apart, implying that some high velocity AGN winds may be relatively short-lived. An initial examination of individual orbits during the 5-weeks XMM-Newton observation in 2014 found the clearest spectral variability in the soft x-ray band, sensitive to both column density and ionization state changes. A detailed inter-orbit analysis of the RGS soft x-ray spectra has subsequently confirmed variability on timescales of days, with the strongest outflow at v0.06c clearly resolved into distinct ionization (density) components (Reeves et al. 2018).
The present paper derives from an on-going orbit-by-orbit study of the harder X-ray spectra from the EPIC pn (Strueder et al. 2001) and mos (Turner et al. 2001) cameras. One remarkable outcome already reported (Pounds et al. 2018) was the detection of a transient ultra-fast inflow, with v0.3c, during the second XMM-Newton orbit in 2014. We now report the launch of a new high velocity outflow component, with v0.27c, a few weeks later, and note that the similar velocities suggest the two events are physically linked.
We assume a redshift of (Marziani et al. 1996), with a black hole mass of (Kaspi et al. 2000) indicating the historical mean luminosity of PG1211+143 is close to Eddington. Spectral modelling is based on the XSPEC package (Arnaud 1996) and includes absorption due to the line-of-sight Galactic column NH (Murphy et al. 1996). To allow comparison with previous analyses of the 2014 spectra we again use photoionized absorption and emission grids of pre-computed spectra based on the XSTAR code of Kallman et al. (1996).
2 Launch of a fourth high velocity outflow late in the 2014 campaign
As noted above, the unusually high statistical quality of the extended 2014 observation of PG1211+143 was important in resolving complex absorption structure in the Fe K spectrum, identified in P16a with absorption line series in FeXXV and XXVI corresponding to line-of-sight outflow velocities of v0.067c and v0.129c, and evidence for a third velocity v0.187c subsequently confirmed in the soft X-ray spectrum reported in (P16b. Table 1 lists the parameters of the 3 primary (high column) outflows from the mean 2014 pn spectral fit.
| comp | log | () | |||
|---|---|---|---|---|---|
| abs 1 | 3.50.1 | 2.60.2 | 0.0660.003 | 11 | 52/3 |
| abs 2 | 3.90.6 | 1.50.2 | 0.1290.006 | 6 | 18/3 |
| abs 3 | 3.40.2 | 0.50.1 | 0.1870.003 | 3 | 14/3 |
| abs 4 | 2.90.2 | 1.00.3 | 0.270.01 | 4 | 17/3 |
Examination of pn data for individual orbits show the 3 outflow velocities to remain as in Table 1, indicating all were in ’coasting’ phase.
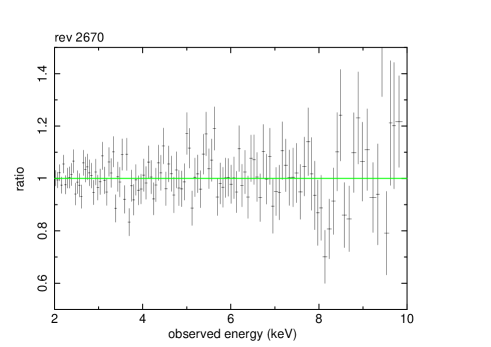
However, in the final observation (orbit 2670) several additional absorption lines appeared, notably at 8.1 kev and 8.6 keV and at 9-10 keV, indicating absorption specific to orbit 2670. To quantify the new absorption component, the spectral model from the stacked 2014 data (P16a) was applied to the pn data from orbit 2670, with only the normalisation (amplitude) of X-ray continuum and emission components free to change. Figure 3 (upper panel) shows the additional absorption in the ratio of orbit 2670 data to the mean 2014 spectrum.
Adding a 4th photoionized absorber to the spectral model confirms a new high column outflow at an observed blueshift of 0.1850.005, with column density NH 9.72.8cm-2 and ionisation parameter log 2.9. The corresponding outflow velocity in the AGN rest frame is v0.270.01c. Inclusion of the additional absorber (Figure 3, lower panel) recovers an excellent spectral fit to the orbit 2670 data, with of 17/3 and null probability of 4.

Comparison of the upper and lower panels of Figure 3 identifies the resonance lines of He-like FeXXV and H-like FeXXVI blue-shifted to 8.1 and 8.6 keV,respectively, and the corresponding transitions both visible at higher energies. The apparent broadening of the 8.1 keV line can be explained by significant inner-shell absorption components in the low energy wing of the Fe XXV resonance line, a feature often seen in similar AGN spectra.
Independent support for the new high velocity outflow is provided by a similar examination of the RGS data from orbit 2670, where a comparison with the mean 2014 spectrum (P16b) again reveals additional soft x-ray absorption specific to orbit 2670. Modelling with a photionized absorber, as in P16b, finds a soft x-ray absorber with column density NH and ionization parameter log 0.8, at an observed blueshift 0.1830.003.
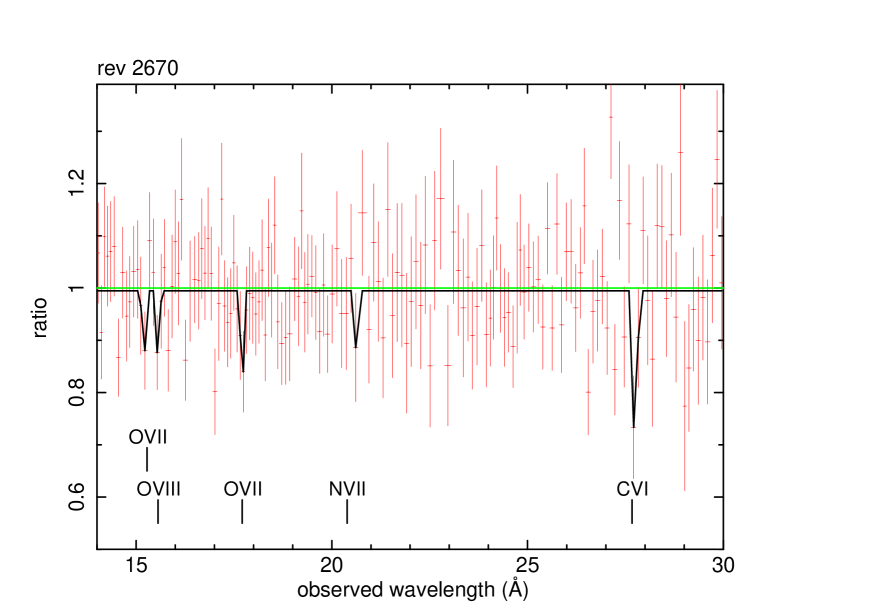
Figure 4 shows an array of soft x-ray absorption lines specific to orbit 2670, identified with resonance transitions in OVII, OVIII, NVII and CVI, with a common blueshift 0.1850.006, corresponding to an outflow velocity v0.2650.005c. The lower ionization parameter and column density (compared with the pn data) again indicate higher density matter embedded in the primary (high column) highly-ionized flow.
3 Discussion
Repeated XMM-Newton observations have demonstrated the highly variable nature of the wind opacity in PG1211+143. The initial discovery of a strong outflow at 0.15c in a 2001 XMM-Newton observation was followed by weaker detections in 2004 and 2007, and then the long 2014 campaign reporting a more complex velocity structure. Assuming the highly ionized winds are driven by momentum exchange with a super-Eddington radiation flux (King and Pounds 2003), an explanation now supported in the quantitative agreement of data and theory (King and Pounds 2015), the pattern of wind variability will also have direct bearing on the nature of variable accretion in AGN.
Nixon et al. (2012) have shown how an accreting ’cloud’ approaching the disc at an oblique angle to the black hole spin plane could cause the inner disk to warp and break off, with subsequent collisions between rings of matter precessing at different rates, leading to loss of angular momentum and direct infall, potentially creating local disc regions of super-critical mass accretion. The ultrafast infall detected during the 2014 XMM-Newton observations of PG1211+143 was discussed in that context in Pounds et al.(2018).
Observing the launch of a new primary (high column) ultrafast outflow component, some 20 days later, is a striking illustration of continuum-driving for a high velocity wind, as first described in the classic accretion disc paper of Shakura and Sunyaev (1973), but - interestingly - not mentioned in the original scientific case for XMM-Newton (Bleeker et al. 1982).
In that context, the near coincidence of a 0.3c infall velocity (with free-fall location at 20 Rg) detected in rev 2659, and the wind launch seen 2-3 weeks later (with a similar escape velocity, and likely radial location) strongly suggests a direct physical link. The increase in x-ray emission between those two events (Fig.2) might then reflect the release of energy as the added matter spreads out on the local viscous timescale, with an inward accreting flow eventually reaching a radius where the mass rate is super-Eddington, with excess matter being ejected as a new wind component.
To examine that idea quantitatively, we recall the transient inflow mass (in line-of-sight) reported in P18 was 3.3g, accumulated over 3000s, for a mean rate of g . However, that measure is only for matter in line of sight and sufficiently cool to be detected, and is likely to be a significant underestimate. Furthermore, Fig. 1 suggests the infall may have begun some 3 days earlier, increasing the observed mass dump by a substantial factor. In principle the integrated mass in the new UFO could have provided an alternative measure of the total mass dump, but unfortunately no observations of PG1211+143 have been made since the 2014 XMM-Newton campaign.
As noted above, Pounds et al.(2018) discussed mass deposition in the context of the specific Nixon et al. (2012) scenario for mass deposition due to colliding rings of a warped disc. An alternative scenario for gas deposition in AGN, supported by simulations of clumpy in-homogeneous inflows is chaotic or ballistic accretion, e.g., Hobbs et al. 2011, Faber & Dehnen (2018). In this picture gas inflowing into the central parsec of AGN has a wide distribution of angular momentum, in both orientation and magnitude. A small fraction of the gas will have angular momentum small enough to fall into the central region of AGN discs. Independently of how the gas is deposited on the disc, the mass deposition rate due to a radial inflow is
| (1) |
where is the solid angle of the flow ( would correspond to the full sky flow), and are the proton mass and particle density in the flow, and is the radial velocity. Now , where is the radial thickness of the flow, and we can eliminate through , which yields . We obtain
| (2) |
where . For comparison, the Eddington accretion rate for the source is
| (3) |
We see immediately that it is unlikely that the ultra-fast inflow could have significantly affected the bulk of the accretion flow, that is, its optically thick UV-emitting part.
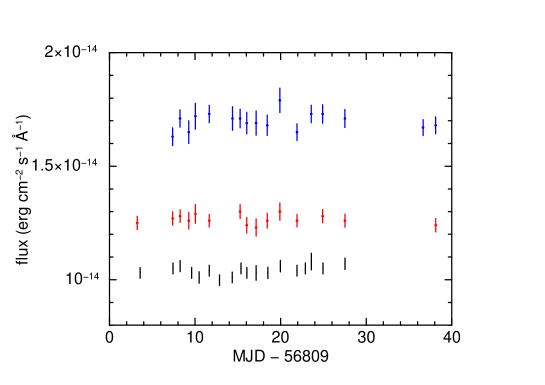
That prediction is supported by the UV fluxes from Swift over the same period (Fig.5), showing no substantial flux variability for several days before and after the ultra fast inflow on day 16. In contrast, the x-ray data from Swift and XMM-Newton over the same period clearly show (Fig.1) enhanced soft x-ray absorption between days 12 and 15, followed (Fig.2) by an increase to the broad band x-ray emission from day 17.
Furthermore, making plausible assumptions about disc parameters in PG1211+143 the viscous timescale (on which mass accretion rate through the disc may vary) is likely to be of order a few years at , too long for a causal disc-mediated connection between the infall event and the launch of the new wind reported here.
However, the inflow is certainly massive and powerful enough to have affected the corona of the accretion disc in PG1211+143. Disc coronae must be Compton optically thin to explain typical AGN spectra (e.g., Poutanen & Svensson 1996). The effect of absorption in a line-of-sight inflow on the Swift XRT data (Fig. 2) suggests a substantial flow lasted for at least 3days, adding a few g/cm2, per side of the disc, exceeding the expected amount of material in the corona. Furthermore, the specific energy injected by the inflow into the coronal region of the disc, is one-two orders of magnitude higher than that of the X-ray emitting coronal gas. We suggest the additional material and extra energy introduced by the infalling gas is likely to have caused a significant rearrangement in the corona, and the top layers of the disc where most of the disc emission forms, and therefore propose the launch of a new wind late in the 2014 campaign was a direct consequence of the earlier fast infall of new matter.
4 Conclusions
Our analysis indicates that the amount of material delivered into the innermost tens of by the inflow is likely to be small compared to that in the optically thick disc in that region, a conclusion supported by the lack of significant variability in the UV data from Swift (Fig.5), contrasting with the increasing coronal x-ray emission from XMM-Newton orbits 2659 to 2664 (Fig.2). However, the additional mass and energy injected into the accretion disc by the transient inflow are significant in comparison with the mass and energy budgets of the coronal region of the inner disc. We therefore conclude that the observed mass and energy injection early in the 2014 XMM-Newton campaign most likely is the direct cause of the new wind launched some three weeks later.
Acknowledgements
XMM-Newton is a space science mission developed and operated by the European Space Agency. We acknowledge in particular the excellent work of ESA staff in Madrid successfully planning and conducting the XMM-Newton observations. We also thank the Swift PI for approving, and NASA mission planners for scheduling, the additional observations used in this paper. XMM-Newton data were reduced by our former colleague Andrew Lobban and Swift data were provided by the UK Science Data Centre at the University of Leicester, supported by the UK Science and Technology Facilities Council, with our special thanks locally to Dr Kim Page.
References
- [1] Arnaud K.A. 1996, ASP Conf. Series, 101, 17
- [2] Bleeker J.A.,Brinkman A.C.,Culhane J.L.,Koch L.,Pounds K.A.,Schnopper H.W.,Spada G.,Taylor B.G.,Trumper J. 1982
- [3] Burrows D.N. et al. 2005, SSRv, 120, 165
- [4] den Herder J.W. et al. 2001, A&A, 365, L7
- [5] Faber C., Dehnen W., 2018, MNRAS, 478, 852
- [6] Gehrels N. et al. 2004, ApJ, 611, 1005
- [7] Gofford J., Reeves J.N., Tombesi T., Braito V., Turner T.J., Miller L., Cappi M. 2013, MNRAS, 430, 60
- [8] Hobbs A., Nayakshin S., Power C., King A.R. 2011, MNRAS, 413, 263
- [9] Kallman T., Liedahl D., Osterheld A., Goldstein W., Kahn S. 1996, ApJ, 465, 994
- [10] Kaspi S. Smith P.S., Netzer H., Maoz D., Jannuzi B.T., Giveon U. et al. 2000, ApJ, 533, 631
- [11] King A.R., Pounds K.A. 2003, MNRAS, 345, 657
- [12] King A.R., Pounds K.A. 2015, ARA&A, 53, 115
- [13] Lobban A.P., Vaughan S.A., Pounds K.A., Reeves J.N. 2016, MNRAS,457, 38L
- [14] Marziani et al. 1996, ApJS, 104, 37
- [15] Murphy E.M., Lockman F.J., Laor A., Elvis M. 1996, ApJS, 105, 369
- [16] Nixon C.J., King A.R., Price D, Frank J. 2012, Ap J, 757, 24
- [17] Pounds K.A., Reeves J.N., King A.R., Page K.L., O’Brien P.T., Turner M.J.L. 2003, MNRAS, 345, 705
- [18] Pounds K.A., Page K.L. 2006, MNRAS, 360, 1123
- [19] Pounds K.A., Reeves J.N. 2007, MNRAS, 374, 823
- [20] Pounds K.A., Reeves J.N. 2009, MNRAS, 397, 249
- [21] Pounds K.A. and Vaughan S.A 2011, MNRAS, 415, 2379
- [22] Pounds K.A. and King A.R. 2013, MNRAS, 433, 1369
- [23] Pounds K.A. Pounds K.A, Lobban A.P, Reeves J.N., Vaughan S.A. 2016a, MNRAS, 457, 2951 (P16a)
- [24] Pounds K.A. Pounds K.A, Lobban A.P, Reeves J.N.,Costa M., Vaughan S.A. 2016b, MNRAS, 459, 4389 (P16b)
- [25] Pounds K.A., Nixon C.J., Lobban A., King A.R., 2018, MNRAS, 53, 115
- [26] Poutanen J., Svensson R., 1996, ApJ, 470, 249
- [27] Reeves J.N., Done C., Pounds K.A., Tereshima Y., Hayashida K., Anabuki N., Uchino M., Turner M.J.L. 2008, MNRAS, 385, L108
- [28] Reeves J.N., Lobban A., Pounds K.A. 2018, ApJ, 854, 28
- [29] Roming P.W.A. et al. 2005, SSRv, 120, 95
- [30] Shakura N.I, Sunyaev R.A 1973, A&A, 24, 337
- [31] Strueder L. et al. 2001, A&A, 365, L18
- [32] Tombesi F., Cappi M., Reeves J.N., Palumbo G.C., Yaqoob T., Braito V., Dadina M. 2010, ApJ, 742, 44
- [33] Tombesi F., Cappi M., Reeves J.N., Palumbo G.C., Braito V., Dadina M. 2011, A&A, 521, A57
- [34] Turner M.J. et al. 2001, A&A, 365, L27