Near- to mid-IR spectral purity transfer with a tunable frequency comb: methanol frequency metrology over a record frequency span
Abstract
We report the development and operation of a frequency-comb-assisted high-resolution mid-infrared molecular spectrometer combining high spectral purity, SI-traceability, wide tunability and high sensitivity. An optical frequency comb is used to transfer the spectral purity of a SI-traceable 1.54 µm metrology-grade frequency reference to a 10.3 µm quantum cascade laser (QCL). The near-infrared reference is operated at the French time/frequency metrology institute, calibrated there to primary frequency standards, and transferred to Laboratoire de Physique des Lasers via the REFIMEVE fiber network. The QCL exhibits a sub- frequency stability from 0.1 to 10 s and its frequency is traceable to the SI with a total uncertainty better than after 1-s averaging time. We have developed the instrumentation allowing comb modes to be continuously tuned over 9 GHz resulting in a QCL of record spectral purity uninterruptedly tunable at the precision of the reference over an unprecedented span of 1.4 GHz. We have used our apparatus to conduct sub-Doppler spectroscopy of methanol in a multi-pass cell, demonstrating state-of-art frequency uncertainties down to the few kilohertz level. We have observed weak intensity resonances unreported so far, resolved subtle doublets never seen before and brought to light discrepancies with the HITRAN database. This demonstrates the potential of our apparatus for probing subtle internal molecular processes, building accurate spectroscopic models of polyatomic molecules of atmospheric or astrophysical interest, and carrying out precise spectroscopic tests of fundamental physics.
I Introduction
High precision molecular spectroscopy offers exciting perspectives ranging from fundamental physics Hinds (1997); Roussy et al. (2023); Fiechter et al. (2022); Pastor et al. (2015); Patra et al. (2020); Diouf et al. (2019); Barontini et al. (2022); Muller et al. (2021); Segal et al. (2018); Mudiayi et al. (2021) and metrology Benabid et al. (2005); Castrillo et al. (2019); Mejri et al. (2015) to astrochemistry Herbst and Van Dishoeck (2009), remote sensing and Earth sciences Galli et al. (2016); Harrison, Bernath, and Kirchengast (2011); Guinet et al. (2010). Experiments in these domains are often based on frequency measurements of molecular vibrations in the mid-infrared (mid-IR) molecular fingerprint region, therefore generating the need for mid-IR laser sources that are spectrally pure, accurate and widely-tunable.
Here we report on the development and operation of a quantum cascade laser (QCL) based spectrometer that provides a unique combination of sensitivity, frequency resolution and tunability of any mid-IR spectrometer to date. An Erbium-doped fiber mode-locked optical frequency comb is used to transfer the spectral purity of a metrology-grade ultrastable frequency reference traceable to the International System of Units (SI) from the near-IR to the mid-IR. In addition, we have developed the instrumentation allowing comb modes to be continuously tuned over 9 GHz. This results in a QCL of record spectral purity that can be continuously tuned at the precision of the frequency reference over an unprecedented frequency span of 1.4 GHz. These developments constitute enabling technologies for driving the next generation of ultra-high resolution molecular spectroscopy apparatus in the molecular fingerprint region. High spectral purity is key to reaching the resolutions required for resolving the subtlest structures, clusters of blended lines which constitute unique probes of fundamental processes in molecules. Together with SI-traceability and high sensitivity, it allows systematic effects to be unraveled in order to minimize line center uncertainties. Adding finally wide continuous tuning capabilities to the toolbox of present and future mid-IR photonics is essential for finding/resolving new unreported lines, in particular weak transitions, as demonstrated here, providing in-depth insight into the internal molecular dynamics.
Distributed feedback (DFB) quantum cascade lasers (QCLs) are available over wide ranges of the mid-IR (from 3 to 25 µm), can be tuned over several gigahertz and have continuous-wave (cw) power levels in the milliwatt to watt range near room-temperature. They however show substantial frequency noise Myers et al. (2002); Bartalini et al. (2010); Tombez et al. (2011); Bartalini et al. (2011); Tombez et al. (2012); Mills et al. (2012); Galli et al. (2013); Sow et al. (2014); Argence et al. (2015); Cappelli et al. (2015); Chomet et al. (2023). For the most precise measurements considered here, high-spectral purity and traceability to a frequency standard are both required. This can be achieved by phase-locking to: (i) the mid-IR secondary frequency standard Sow et al. (2014) (a CO2 laser stabilized to a saturated absorption line of OsO4 Acef (1997)), resulting in a 10 Hz line width, 1 Hz stability at 1 s and accuracy of a few tens of hertz; (ii) a near-IR metrology-grade frequency reference traceable to primary frequency standards, resulting in ultimate sub-Hz stabilities and accuracies, and linewidth narrowing down to the 0.1 Hz level Santagata et al. (2019); Argence et al. (2015) (see also related similar works, which however do not reach such high levels of spectral purity Insero et al. (2017); Sinhal, Johnson, and Willitsch (2022)). Efforts in combining metrology-grade spectral performance and wide continuous tunability are scarce. We have previously demonstrated respectively 10 GHz and 0.4 GHz continuous tunability for: (i) the 10-Hz narrow 10.6 µm QCL phase-locked to the mid-IR secondary frequency standard ( absolute frequency uncertainty) Sow et al. (2014) and (ii) the 0.1-Hz narrow 10.3 µm QCL ultimately calibrated to primary frequency standards ( absolute frequency uncertainty) Santagata et al. (2019). Another interesting apparatus is the CO2-laser/microwave-sideband spectrometer demonstrated in Sun et al. (2004) allowing 11.8 GHz wide windows around any CO2 laser emission line to be covered in a single sweep. This spectrometer shows similarities with our metrology-grade equipment Sow et al. (2014); Lemarchand et al. (2013), but uses free-running CO2 lasers and allows broadband scans at Doppler-limited resolutions only. Note that QCLs can also be phase-locked to a frequency comb controlled with a radiofrequency (RF) reference. This enables higher tuning ranges, but at the expense of a barely reduced frequency noise (resulting in 1 kHz line width at best) and a frequency uncertainty limited to around at best by the RF reference Bartalini et al. (2007); Gambetta et al. (2010); Mills et al. (2012); Borri et al. (2012); Gatti et al. (2013); Galli et al. (2013); Gambetta et al. (2015); Hansen et al. (2015); Gambetta et al. (2017); Lamperti et al. (2018). Mid-IR frequency combs, based Lepère et al. (2022); Agner et al. (2022); Komagata et al. (2023); Chomet et al. (2023) or not Yang et al. (2023); Laumer et al. (2023) on QCL technologies, are emerging as flexible sources of broadband coherent radiation. They can address a very wide spectral range, potentially via the dual-comb spectroscopy methods Picqué and Hänsch (2019), but metrology-grade resolutions and frequency uncertainties have yet to be demonstrated.
In the following, we describe our high-resolution molecular spectrometer. It exploits a frequency comb to transfer the spectral purity of a 1.54 µm remote SI-traceable optical frequency reference signal to a 10.3 µm QCL. The near-IR reference is operated at the French time/frequency metrology institute (LNE-SYRTE), calibrated there to primary frequency standards, and transferred to Laboratoire de Physique des Lasers (LPL) via a long-haul optical fiber link Argence et al. (2015). Compared to our previous workSantagata et al. (2019), the QCL’s tuneability has been extended by a factor of more than three. We use our SI-traceable QCL of record spectral purity to conduct sub-Doppler saturation spectroscopy of methanol in a multi-pass cell over an unprecedented continuous frequency span of 1.4 GHz. Methanol is found in a wide variety of astronomical sources Batrla et al. (1987) and is the second most abundant organic molecule in the Earth’s atmosphere Singh et al. (2001) . It is an excellent probe of the physical conditions, the chemistry and the history of these environments. Reliable laboratory spectroscopic data of methanol are thus much needed for interpreting astrophysical and planetary spectra, for air quality monitoring and atmospheric concentration retrieval. Although the simplest of the organic alcohols, it is a slightly asymmetric-top with a hindered internal rotor (torsion) leading to a triple-well internal tunnel dynamics and therefore to a rich rotation–torsion–vibration energy structure. Methanol is thus also an important molecule for fundamental spectroscopyLankhaar, Groenenboom, and van der Avoird (2016), metrological applications and frequency calibration Santagata et al. (2019); Sun et al. (2000), the realization of optically pumped far-IR gas lasers Jiu et al. (2010), or for probing the limits of the standard model, its internal tunnel dynamics making it one of the most sensitive molecules for a search of a varying proton-to-electron mass ratio Muller et al. (2021). Here, we measure the resonance frequencies of fourteen rovibrational transitions, including very weak lines, some observed for the first time. We demonstrate record frequency uncertainties two to four orders of magnitude improved over previous measurements, at the few kilohertz level for the most intense lines and bring to light inaccuracies and gaps in the HITRAN database. We resolve subtle weak intensity doublets never observed before induced by a combination of the asymmetry and the tunneling dynamics in methanol, demonstrating both the high detection-sensitivity and high resolution of our widely tunable spectrometer and its potential for unraveling subtle internal molecular processes.
II Experimental setup
FIG. 1 illustrates our widely tunable SI-traceable frequency-comb-stabilized-QCL-based high-resolution mid-IR spectrometer. It combines a widely tunable optical local oscillator (OLO) locked to a remote ultrastable frequency reference of LNE-SYRTE, a 10.3 µm cw DFB QCL stabilized to the OLO using an optical frequency comb (OFC) and sum-frequency generation, and a multi-pass absorption cell for carrying out saturation spectroscopy. The reader is referred to Ref. Santagata et al. (2019) for a detailed description of most of this setup.
II.1 Widely tunable, SI-traceable and ultrastable optical local oscillator
The widely tunable OLO assembly is shown in FIG. 1(b). The frequency reference located at LNE-SYRTE is produced by a 1.54 µm fiber laser locked to an ultrastable cavity which exhibits a relative frequency stability lower than 10-15 between 0.1 s and 10 s integration time Santagata et al. (2019); Argence et al. (2012). This reference is calibrated against a combination of a liquid-helium cooled cryogenic sapphire oscillator (CSO) and a hydrogen maser (H-maser), themselves monitored on the atomic fountains of LNE-SYRTE, and its absolute frequency is thus SI-traceable to the primary standards with an uncertainty at the few 10-14 level. This reference signal is transferred to LPL Cantin et al. (2021); Xu et al. (2019) through a 43-km long fiber link of the REFIMEVE infrastructure Cantin et al. (2021) without any degradation of its stability and absolute uncertainty thanks to an active compensation of the propagation-induced phase noise Newbury, Williams, and Swann (2007). A 200 MHz ultrastable RF reference derived from the CSO/H-maser combination ( stability at 1 s, a few 10-14 absolute frequency uncertainty Guena et al. (2012)) is also transferred to LPL through the same 43-km long fiber link using an amplitude modulated auxiliary 1.5 µm laser diode.
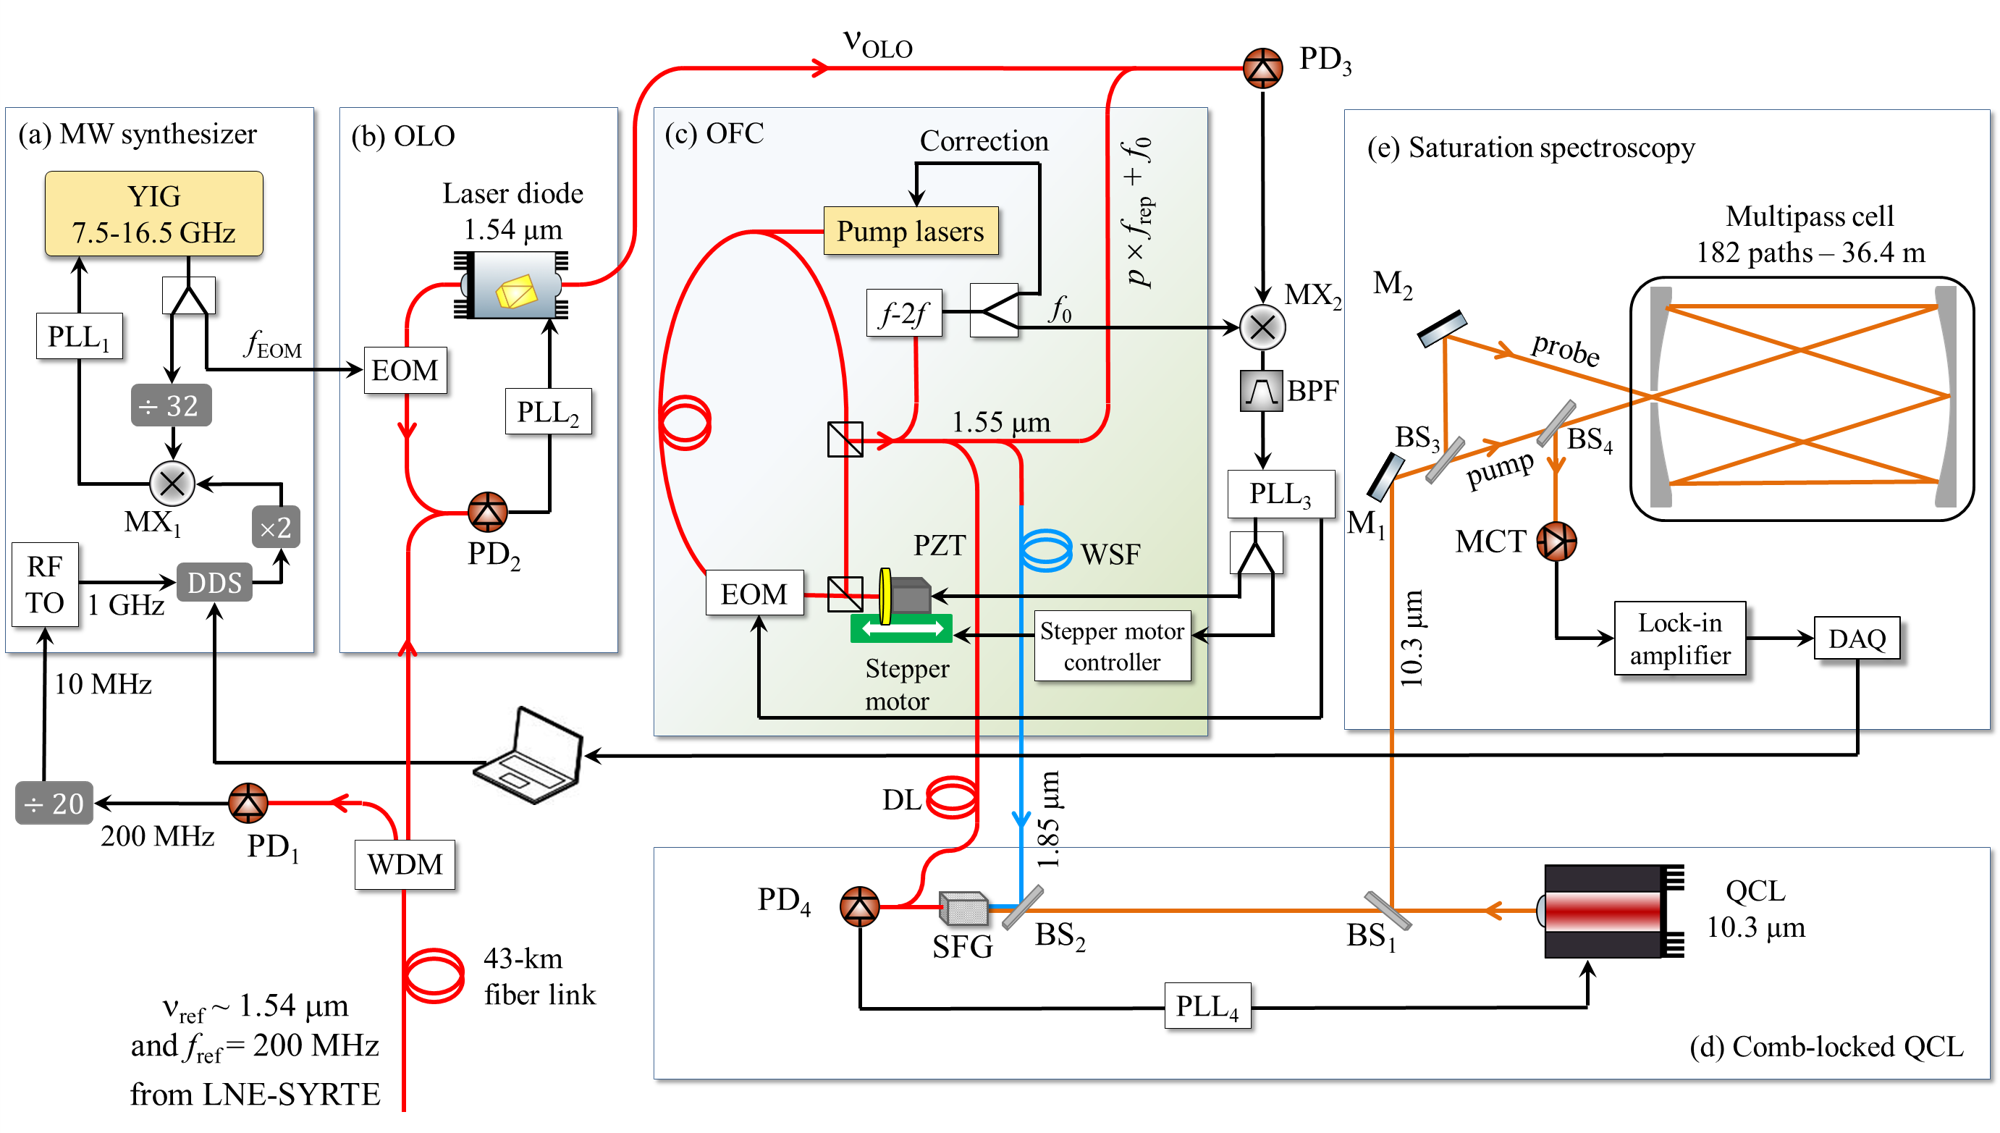
At LPL, a laser diode of frequency 1.54 µm is used as an OLO. Two sidebands are generated in the OLO signal by an electro-optic modulator (EOM in FIG. 1(b)). The EOM frequency is precisely controlled using a home-made phase-jump-free microwave synthesizer based on a current driven Yttrium Iron Garnet (YIG) oscillator with a continuous tuning range of 9 GHz (7.5-16.5 GHz) Santagata et al. (2019). FIG. 1(a) shows a simplified scheme of the synthesizer. A 1 GHz signal is generated by a RF tracking oscillator (TO) referenced to a 10 MHz signal (stability at 1 s and relative frequency uncertainty better than 10-12 and 10-13 respectively Tran (2019)) synthesized from the remote LNE-SYRTE 200 MHz reference . A 0-400 MHz direct digital synthesizer (DDS) uses the 1 GHz signal as a reference. After division by 32, the YIG frequency is mixed with the doubled DDS frequency. The resulting phase error signal is converted into correction signals (using phase-lock loop PLL1 in FIG. 1(a)) applied to the YIG oscillator’s current, the frequency of which is thus locked to the DDS with a frequency ratio of 64. This allows not only the spectral performance of the local 10 MHz reference to be transferred to the resulting microwave signal, but also the synthesizer frequency to be tuned over 9 GHz without any phase jumps by adjusting the DDS frequency. As illustrated in FIG. 1 and detailed below, the QCL is stabilized to the OLO via a series of three cascaded phase-lock loops. The wide tunability and, crucially, the phase-jump-free nature of the YIG-based synthesizer are key to allow broad but also continuous tunability of the stabilized QCL, and therefore demonstrate both broadband and ultra-high resolution spectroscopy.
The upper OLO sideband of frequency is phase-locked to the reference frequency using PLL2 (500 kHz locking bandwidth) in FIG. 1(b) with an offset frequency . Adjusting then allows the OLO carrier frequency to be tuned over 9 GHz at the precision of the frequency reference Santagata et al. (2019). In addition to copying the 10-15 stability (for 0.1 s to 10 s averaging times) of the LNE-SYRTE optical reference, the OLO carrier frequency can be used as a tunable SI-traceable local oscillator of frequency:
| (1) |
II.2 Widely tunable, SI-traceable and ultrastable frequency comb-assisted quantum cascade laser
A 250 MHz repetition rate Erbium-doped fiber optical frequency comb (Menlo Systems, F1500) is used to transfer the spectral performances of the remote frequency reference and the wide-tunability of the OLO to the QCL.
A beat-note signal at
| (2) |
is obtained after beating the OLO carrier frequency with the nearest comb tooth at frequency (with ) and subsequently removing the comb offset frequency (). This signal is used to lock . To this end, it is processed via PLL3 to generate three correction signals respectively applied to a stepper motor (very slow correction), a piezo-electric actuator (PZT, slow-correction) and an intra-cavity EOM (fast-correction), all used to act on the comb cavity optical length (see panel (c) in FIG. 1, the stepper motor and the PZT are both mounted on a cavity mirror). Phase-locking also involves transferring the tunability of the OLO carrier to every comb modes. Here, major improvements have been made to the previous setup Santagata et al. (2019). The dynamic range of the EOM control voltage has been doubled, resulting in a larger locking bandwidth of 700 kHz. The most significant upgrade lies in the use of the stepper motor in order to enhance the tuning range of the cavity length and thus of (limited in the previous setup by the course of the PZT actuator, corresponding to a 3 GHz span of a comb mode). To prevent the PZT from reaching the end of its course in our new setup, its voltage is maintained within a reduced range around its mid-point by acting on the stepper motor. When the PZT voltage falls outside the allowed range, a correction signal is sent to the stepper motor which performs a translation that brings the PZT back to its mid-point. This allows to lock and tune it over a span corresponding to a 9 GHz tunability of the comb modes. This span is 3 times broader than allowed by acting on the PZT only, and now limited by the EOM tuning range, given by the YIG span. Sweeping over such extended spans however also involves variations of of several tens of megahertz, thus pushing some beat notes (not only itself but also the beat signal between the OLO and the comb tooth) outside filters’ bandwidths. The comb offset frequency is thus loosely locked (sub-10 Hz bandwidth) by acting on the comb pump lasers’ currents.
We then lock the QCL (frequency ) to a high harmonic of (FIG. 1(d)). To this end, a fraction of the 1.54 µm frequency comb power is amplified in an Erbium-doped fiber amplifier (EDFA) and fed to a wavelength shifted fiber (WSF) to generate a new comb output centered at 1.85 µm with comb teeth frequencies (). The QCL and 1.85 µm comb beams are overlapped in a non-linear crystal (AgGaSe2) to perform sum frequency generation (SFG) which yields a shifted comb centered at 1.55 µm (SFG comb). The beat signal between the SFG and original combs at frequency:
| (3) |
with is used to lock the QCL frequency. It is obtained after overlapping the pulses in the time domain using a fiber delay line (DL in FIG. 1). It is processed by PLL4 to generate a correction signal applied to the QCL’s current. The QCL frequency is thus directly traceable to the remote frequency reference in the following way:
| (4) |
with . Integers and are unequivocally determined by measuring the comb repetition rate using a RF counter, the QCL and OLO frequencies using an optical spectrum analyzer (Bristol Instruments, model 771A-MIR, 0.2 ppm accuracy), and by exploiting Equations (2) and (3) Santagata et al. (2019).
As demonstrated in Ref. Santagata et al. (2019); Argence et al. (2015), the QCL frequency (i) exhibits a stability at the level of the remote reference signal, below 0.03 Hz ( in relative value) for averaging times from 0.1 to 10 s, and a linewidth of 0.1 Hz at 100 ms timescales; (ii) is SI-traceable and known within a total uncertainty better than after 1 s averaging time.
Scanning the OLO frequency thus allows us to continuously tune and in turn the QCL frequency at the precision of the remote reference. In a previous work Santagata et al. (2019), we have demonstrated a QCL continuous tunability over a span of 400 MHz, limited by the course of the PZT actuator. With the additional capability provided by the stepper motor control, scanning the OLO carrier frequency over its entire 9 GHz span (limited by the YIG tunability) enables the QCL, which is both ultrastable and SI-traceable, to be continuously tuned over a record range of 1.4 GHz (given by the 6.7 mid-IR to near-IR wavelength ratio). Note that if the time delay between the SFG and original combs is not cancelled, tuning comes with a deterioration of the pulses time overlap and in turn of beat-note signal ’s signal-to-noise ratio, preventing us from carrying out long scans. Time delay cancellation is achieved by adding fiber length in order to balance the optical paths.
II.3 Saturated absorption spectroscopy setup
As illustrated in FIG. 1(e), the stabilized QCL has been used to carry out saturated absorption spectroscopic measurements in a multi-pass absorption cell (Aerodyne Research, model AMAC-36, 182 paths). With a 20-cm long distance between two astigmatic mirrors, the cell provides an effective absorption length of 36.4 m and allows us to perform spectroscopic measurements of weak lines at low pressures.
The QCL beam is split in two using an 80/20 beam splitter (BS1). Around 8 mW is needed to phase-lock the laser to the comb while about 2 mW remains for the spectroscopy. Using BS2, the beam is further split into a pump and a probe beam, which are coupled into the multi-pass cell (incident powers of 1.3 mW and 0.7 mW, respectively) for conducting saturation spectroscopy. The mirrors’ reflectivity leads to a 20% transmission after 182 passes which in turn results in pump and probe powers that vary inversely by almost an order of magnitude through the cell. This also goes with a 50% total power variation depending on the pass number and to an intra-cell averaged power of 0.81 mW. After exiting the cell, the probe beam is detected by a liquid-nitrogen-cooled mercury-cadmium-telluride photodetector (MCT in FIG. 1(e)). Undesirable interference fringes as typically observed with multi-pass cells McManus, Kebabian, and Zahniser (1995) are averaged out by vibrating mirror M2 held in a piezo-actuated mount and shaking the multi-pass cell assembly with a fan.
Frequency modulation (FM) of the QCL is used to improve the signal-to-noise ratio. This is done by modulating the frequency of the DDS used as a reference for PLL4 (to lock the QCL to the comb) at a frequency of 20 kHz (well within PLL4’s 250 kHz bandwidth). The signal detected by the MCT photodetector is fed to a lock-in amplifier for demodulation.
III PRECISE SPECTROSCOPY OF METHANOL
Saturated absorption spectroscopy is carried out by tuning the QCL frequency in a series of discrete steps. To cancel out the frequency shifts induced by the limited detection bandwidth Rohart et al. (2014); Rohart (2017) we have carried out frequency scans in both directions with increasing and decreasing frequencies and only consider the averaged spectrum of pairs of up and down scans (see below). FIG. 2(a) shows a saturated absorption spectrum of methanol averaged over five such pairs spanning the full 1.4 GHz tuning range of our system (from 971.312 to 971.357 cm-1) after demodulation on the first harmonic. It has been recorded at a pressure of 1.5 Pa with a frequency step 15 kHz and a step duration and lock-in amplifier time constant both of 10 ms. The SI-traceability detailed in Section II.2 allows us to retrieve the absolute frequency scale using Equation (4). Although is measured and made available every second at LNE-SYRTE, its value varies by typically a few hertz over the duration of our scans. Therefore, for each pairs of scans, we fix in Equation (4) to its value measured halfway through the scans.
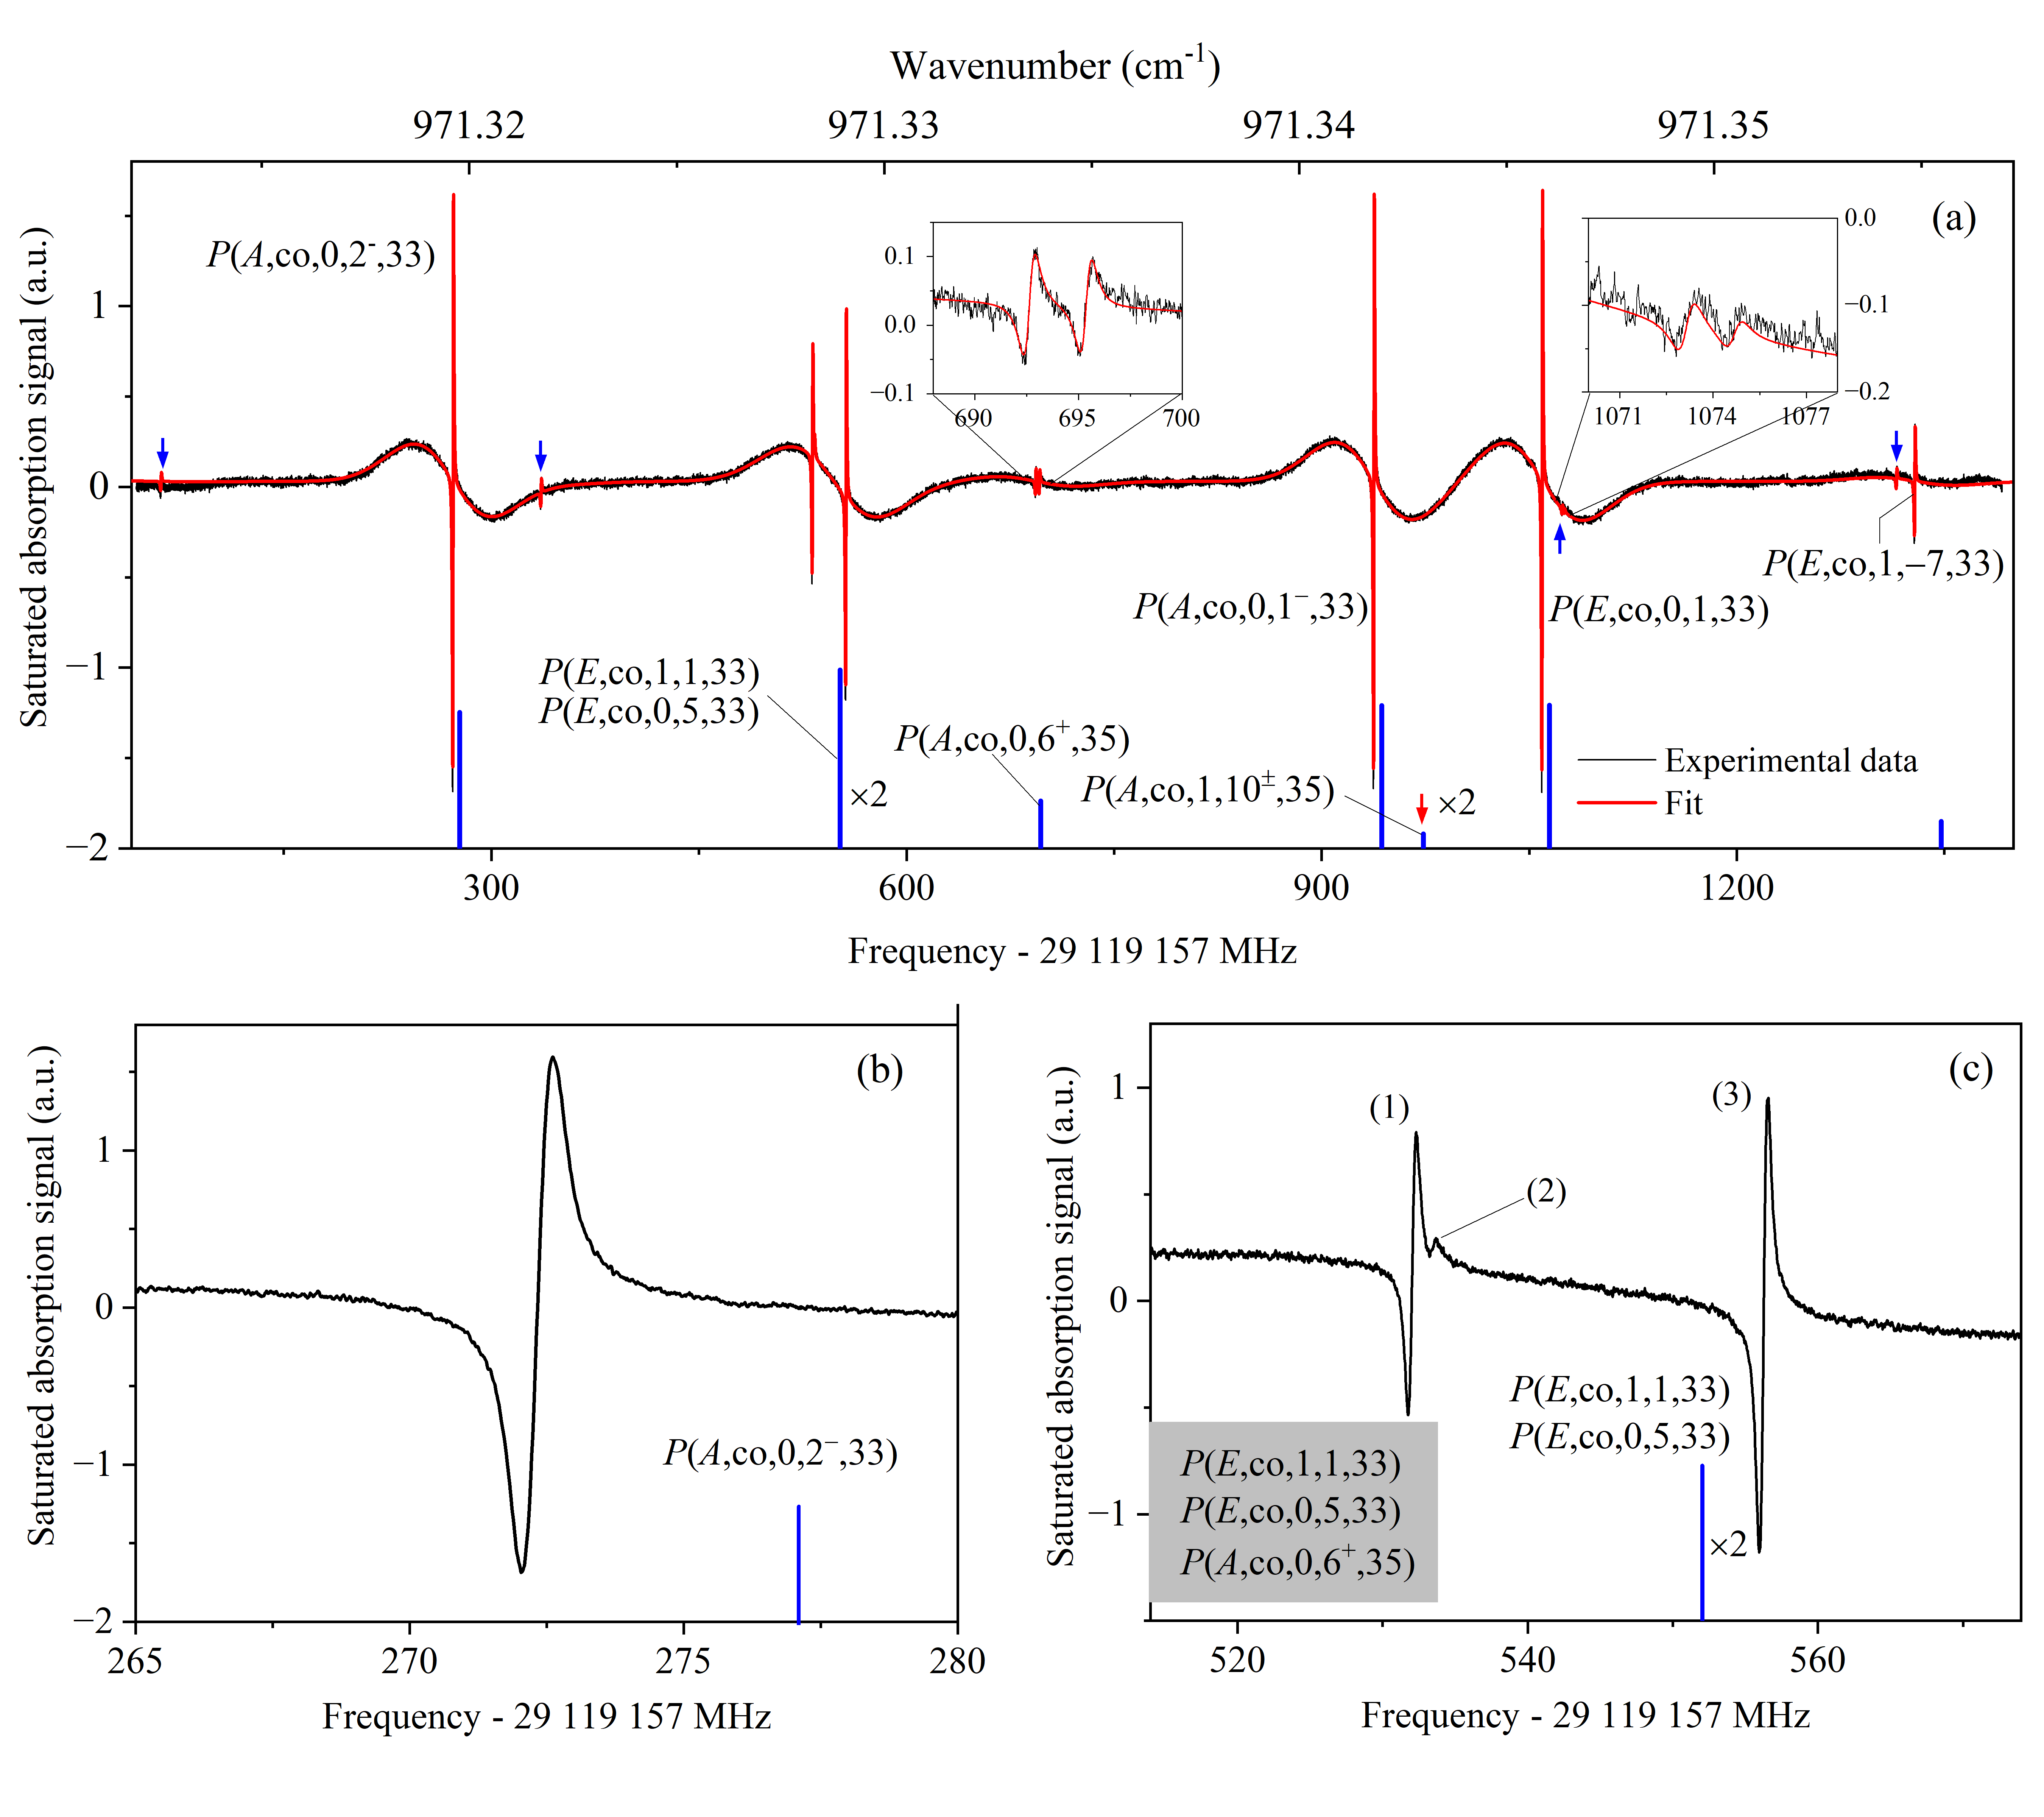
The spectrum exhibits fourteen rovibrational transitions of methanol which belong to the branch of the C-O stretch vibrational mode Xu et al. (2004). The red solid line is a fit to the data used as a guide-to-the-eye. Each line is fitted with the first derivative of the sum of a Lorentzian and a Gaussian profile to model the saturated absorption and Doppler (oscillations in the baseline) contribution, respectively. The transitions reported in the HITRAN database Gordon et al. (2022) falling in the spectral window covered are shown as blue sticks. As an example, FIG. 2(b) shows a zoom on the saturation feature of the methanol line around 971.319 cm-1 (in this work, we adopt the notations of Ref. Xu et al. (2004) for the spectroscopic assignment of methanol transitions, see also Appendix A). It exhibits a signal-to-noise ratio of 370 and a 760 kHz full-width-at-half maximum, which is a combination of pressure, power and transit time broadening, as well as FM-induced distortion.
To achieve a reasonable signal-to-noise ratio, the FM amplitude has been set at 250 kHz, resulting in a line shape slightly distorted compared to the typical Lorentzian profile. Furthermore, the residual amplitude modulation associated with FM and the power variation over a scan can both contribute to an asymmetry of the line shape. We fit our data to a model described in Appendix B that takes into account these distortions.
| This work | Assignment | HITRAN | Ref. Lees et al. (2007) | |||
| (, kHz) | Wavenumber (cm-1) | Intensity (cm-1/mol.cm-2) | Wavenumber (cm-1) | (kHz) | (kHz) | |
| 29 119 218 300.4 (114.6) | ||||||
| 29 119 429 316.2 (8.5) | 971.31977 | 971.31966 | ||||
| 29 119 492 935.1 (121.7) | ||||||
| 29 119 689 067.7 (8.8) | 971.32894 | 971.32880 | ||||
| 29 119 690 623.2 (343.1) | ||||||
| 29 119 713 238.5 (10.0) | 971.33377 | |||||
| 29 119 850 408.4 (117.4) | 971.34300 | |||||
| 29 119 853 004.6 (82.2) | 971.34300 | |||||
| 29 120 094 740.7 (6.1) | 971.34199 | 971.34176 | ||||
| 29 120 216 333.6 (7.3) | 971.34604 | 971.34592 | ||||
| 29 120 231 092.8 (259.2) | ||||||
| 29 120 232 719.0 (274.9) | ||||||
| 29 120 472 397.6 (84.7) | ||||||
| 29 120 485 592.6 (25.0) | 971.35548 | 971.35536 | ||||
Tentative assignments of the three measured and resolved lines without being able to decide which one is which.
Measured resolved doublets.
Tentative assignments.
To determine line-center frequencies of the fourteen resolved transitions, we first select a spectral range of 6 MHz around each. We perform the following “pair by pair” analysis already established in Santagata et al. (2019). We average each pair of up and down scans resulting in five averaged spectra for each of the fourteen transitions. To all data points of an averaged spectrum, we assign the same experimental error bar, calculated as the standard deviation of the residuals obtained after fitting a second-order polynomial to a small portion of the averaged spectrum far from resonance. To each of the five averaged spectra of a given transition is fitted the sum of the line profile described in Appendix B and of a second order polynomial to account for the baseline (see Appendix C). The absolute frequency and associated statistical uncertainty of each line are estimated by calculating the weighted mean and weighted standard error of the five fitted center frequencies, with the weights determined from the fits’ error bars. Unlike in our previous work Santagata et al. (2019), we have conducted measurements at a single pressure (1.5 Pa) and power (0.81 mW intra-cell averaged power) preventing us from deducing zero-power and collision-free transition frequencies. However, we estimate the resulting overall pressure- and power-shift to be of the order of 10 kHz. The reader is referred to Refs. Santagata et al. (2019); Tran (2019) and to the summary given in Appendix D for a detailed description of the line positions uncertainty budget which result in a systematic uncertainty of 5.4 kHz on the frequency of all the resonances studied here. TABLE 1 lists the line center frequencies of the fourteen transitions recorded at a pressure of 1.5 Pa and an intra-cell averaged power of 0.81 mW. 1- total uncertainties are quoted into parentheses. The absolute frequencies of three unambiguously assigned high intensity transitions have been determined with a sub-10-kHz total uncertainty, an improvement of 2000 over previous measurements based on the Fourier-transform IR (FTIR) spectroscopic technique Xu et al. (2004); Gordon et al. (2022). All other absolute frequencies are determined with a total uncertainty ranging from 10 kHz to 350 kHz, to be compared to the typical 15 MHz FTIR uncertainty Xu et al. (2004).
The data shown in FIG. 2 demonstrates both the high detection-sensitivity and high resolution of our spectrometer. An illustration of this double asset is the resolution of two weak doublets (see insets of FIG. 2(a)), which exhibit a splitting of and MHz, respectively. The use of a multipass cell allows relatively high- rovibrational lines to be probed at the low pressures required for ultra-high resolution measurements, including weak lines belonging to hot-bands (torsional excitation ). The intensities of the strongest transitions shown here are two to three orders of magnitude weaker than the most intense lines of this vibrational mode.
As shown in FIG. 2(a), our spectrum is a very rich source of information. First of all, we resolve fourteen lines where the HITRAN database lists only nine (of which two pairs reported as degenerate). Several transitions have to our knowledge never been reported elsewhere. Based on HITRAN, we are in fact able to unequivocally assign only four of the lines (see TABLE 1). Five weak transitions that could not be assigned are indicated with blue arrows and most probably belong to hot-bands with torsional excitation . As discussed in the following and summarized in TABLE 1, the five remaining measured resonances are tentatively assigned to the five other HITRAN transitions. As shown in FIG. 2(c), around 971.328 cm-1 we resolve one weak and two intense lines labelled (1), (2) and (3). We tentatively assign these to transitions , and , without being able to decide which one is which. Those three transitions are indeed listed in Ref. Lees et al. (2007) at the same degenerate frequency of 971.3288 cm-1. In HITRAN however and as shown in FIG. 2, only and are reported as degenerate at 971.32894 cm-1, while is 150 MHz blue-shifted at 971.33377 cm-1. It is however unlikely for this latter to correspond to one component of the doublet observed at 971.334 cm-1 (based on intensities, this doublet looks very much like a single structure, not like two fortuitously quasi-coincident lines). (red arrow in FIG. 2(a)) corresponds to a so-called closed-lying K-doublet that splits for -symmetry lines due to the combination of the slight asymmetry and internal tunnel dynamics of the methanol molecule Lees et al. (2007). It is reported as degenerate in the HITRAN database, but no matching resonance is observed around. Even at the high resolution demonstrated here, we do not expect to resolve such -doublets for (here ), but enhanced splittings are possible as a result of mixing of the considered transition upper states that belong to the C-O stretching vibrational mode with a closely lying state from another vibrational mode Lees et al. (2007). could then well be assigned to either of the two observed resolved doublets. Based on intensities, we tentatively assign it to the strongest doublet around 971.334 cm-1. All certain and tentative assignments are finally summarized in TABLE 1.
Our data is a source of information much richer than what is currently available in the literature. It has yet to be fully exploited to build a more accurate spectroscopic model of methanol. As seen, it brings to light some inaccuracies and gaps in the HITRAN database. In addition, our measured and unequivocally assigned resonance frequencies are red-shifted by 5 to 20 MHz with respect to previous FTIR measurements at the origin of the current HITRAN edition line list Gordon et al. (2022) (see FIG. 2 and TABLE 1). These shifts are about three orders of magnitude larger than our uncertainties and more than an order of magnitude larger than the HITRAN frequency accuracies reported to be between 30 kHz and 300 kHz. It is consistent with deviations between FTIR and saturation spectroscopy data previously observed in the C-O stretch of methanol in methanol and is attributed to FTIR spectrometers calibration imperfections Santagata et al. (2019); Sun et al. (2000, 2002, 2003). Our data also offers new information on weak hot-band transitions for which molecular databases remain largely incomplete. Exploiting this in refined models of methanol is essential for atmospheric quantification. Moreover, mixing between near-degenerate levels of two different modes is known to lead to collision-induced population transfer from one vibrational mode to another. Doublets exhibiting enhanced splittings such as those resolved in our work, a signature of this type of mixing, may thus help understand how molecules transfer among different modes and give insight on thermal equilibration in gases Lees et al. (2007).
Other saturation spectroscopy measurements of the C-O stretch of methanol exist. Almost 700 frequencies have been measured with an accuracy of 100 kHz using a CO2-laser spectrometer Sun et al. (2000, 2002, 2003, 2004); Sun, Lees, and Xu (2006), however mostly in the and branches, with a few low lines in the branch. To our knowledge, there are only two other methanol frequencies that have been measured with an uncertainty comparable to the present work: our previous measurement Santagata et al. (2019), and a weak unassigned line around 947.7 cm-1 Tochitsky and Butcher (1998).
IV Conclusions
We have developed a widely tunable SI-traceable frequency-comb-stabilized high-resolution spectrometer potentially covering the 8-12 µm spectral window. A mode-locked frequency comb and a metrological fiber link are used to transfer the spectral purity and SI-traceability of a 1.54 µm frequency reference located at LNE-SYRTE to a 10.3 µm QCL located at LPL. The QCL exhibits a sub- frequency stability from 0.1 to 10 s, a linewidth of 0.1 Hz at 100 ms and its frequency is SI-traceable with a total uncertainty better than after 1 s of averaging time. In addition, we have developed the instrumentation allowing comb modes to be continuously tuned over 9 GHz, resulting in a continuous tunability of 1.4 GHz for the QCL, a three-fold improvement compared to previous measurements at such levels of spectral purity. This tuning range can potentially be increased by transferring the full 9 GHz tunability of comb modes directly to the QCL, or by using a commercially available 40 GHz telecom EOM together with a home-made microwave synthesizer of wider tunability. We have carried out saturation spectroscopy of methanol in a multi-pass absorption cell. We report line-center frequencies of fourteen transitions of methanol in the branch of the C-O stretch vibrational mode, including very weak transitions belonging to hot-bands, and some observed for the first time. We demonstrate record global uncertainties ranging from few kilohertz to few hundred kilohertz – two to four orders of magnitude improved over previous measurements – depending on the line intensity. We expose manifest discrepancies with the HITRAN database and resolve subtle weak intensity doublets never observed before induced by a combination of the asymmetry and the tunneling dynamics in methanol. All these result demonstrate the potential of our apparatus for providing information on hot-bands essential to atmospheric quantification, for probing subtle internal molecular processes, for building more accurate spectroscopic models of polyatomic molecules of atmospheric or astrophysical interest. This work is also an important step forward for our on-going efforts towards using polyatomic molecules to perform spectroscopic tests of fundamental physics in the mid-IR, such as searching for a varying proton-to-electron mass ratio Barontini et al. (2022); Muller et al. (2021); Segal et al. (2018) or measuring the tiny parity-violating energy difference between enantiomers of a chiral molecule Fiechter et al. (2022); Segal et al. (2018).
Acknowledgements.
This project has received funding from the EMPIR programme co-financed by the Participating States and from the European Union’s Horizon 2020 research and innovation programme, through EMPIR project 15SIB05 “OFTEN”. This work was supported by the Region Île-de-France in the framework of DIM Nano-K and DIM SIRTEQ, the Agence Nationale de la Recherche project PVCM (Grant No. ANR-15-CE30-0005-01), the LabEx Cluster of Excellence FIRST-TF (ANR-10-LABX-48-01), the EquipEx Cluster of Excellence REFIMEVE+ (ANR-11-EQPX-0039), CNRS and Université Sorbonne Paris Nord. D.B.A. Tran was supported by the Ministry of Education and Training, Vietnam (Program 911).Data Availability
The data that support the findings of this study are available from the corresponding author upon reasonable request.
Appendix A Methanol spectroscopic notations
In this work, we adopt the notations of Ref. Xu et al. (2004) for the spectroscopic assignment of methanol transitions. The resonances studied here are all , and transitions between the ground vibrational state and the first excited state of the C-O stretch vibrational mode , with , , , and , the torsional symmetry ( or ), the torsional mode () quantum number, and rotational quantum numbers of the lower sate ( is the total orbital angular momentum quantum number, is the quantum number for the projection of the total orbital angular momentum onto the molecular symmetry axis). -doublets of symmetry have superscript on to distinguish the or component of the doublet. For symmetry levels, is a signed quantum number with positive (respectively negative) values corresponding to levels often denoted as (respectively ).
Appendix B Model used for line fitting
The QCL frequency is modulated at a frequency with a FM amplitude . The instantaneous QCL frequency can be written as with the optical carrier frequency. To achieve a reasonable signal-to-noise ratio, the FM amplitude has been set at kHz, comparable to the measured resonances half-width-at-half-maximum of kHz resulting in a line shape slightly distorted compared to the typical Lorentzian profile. Furthermore, the residual amplitude modulation associated with FM and the power variation over a scan can both contribute to an asymmetry of the line shape. The power frequency-dependency can result from (i) the QCL gain curve, (ii) the underlying Doppler envelop (potentially non-trivial in case of neighboring lines not resolved in the Doppler regime, see FIG. 2) or (iii) multi-pass-cell-induced residual interference fringes not fully averaged out (see text).
We thus fit our data to a model that takes into account both these intensity-modulation-induced asymmetries and the FM-induced distortions. It is based on a profile introduced by Schilt et al Schilt, Thevenaz, and Robert (2003) used to fit direct absorption spectra (itself derived from Arndt’s model Arndt (1965) which considers only pure FM) that we have straightforwardly adapted to study saturation spectra (by not considering the Beer-Lambert law contribution)Tran (2019). The signal detected on the MCT photodetector is a combination of a Gaussian baseline and a saturated absorption signal . The latter can be expressed in the following form:
| (5) | ||||
which corresponds to a frequency modulated Lorentzian profile multiplied by an amplitude that accounts for the intensity modulation at and the power variation over the scan. is the line intensity factor, is the center frequency of the transition, is the half-width-at-half-maximum line width of the underlying Lorentzian profile, and are the asymmetry factors related to the quasi-static intensity variations over a scan and to the FM-induced intensity modulation, respectively, and is the phase shift between intensity modulation and FM. Following the derivation in Ref. Schilt, Thevenaz, and Robert (2003), the expansion of the signal into a Fourier series gives:
| (6) |
with the normalized frequency. The amplitude of the in-phase and quadrature signal (with respect to the intensity modulation) after demodulation on the harmonic are respectively given bySchilt, Thevenaz, and Robert (2003)
| (7) | ||||
| (8) | ||||
in which , , for . corresponds to the signal obtained after demodulation on the harmonic when only considering pure FM (Arndt’s model, no intensity modulation) and is given by Arndt (1965)
| (9) |
where is the complex conjugate. The lock-in amplifier allows us not only to detect the in-phase and quadrature signals but also the signal at any detection phase , with respect to the phase of the intensity modulation
| (10) |
Our experimental procedure consists in choosing the phase that maximises the signal. At harmonic detection, a signal of maximum amplitude is reached for the detection phaseSchilt, Thevenaz, and Robert (2003)
| (11) |
where is an integer. By introducing Equation 11 into Equation 10, we obtain the signal of maximum amplitude that can be detected
| (12) | ||||
The experimental line shape obtained after demodulation on the first harmonic, as used in this work is finally found to be:
| (13) |
in which , , and are given by Equation 9.
Appendix C Line fitting details
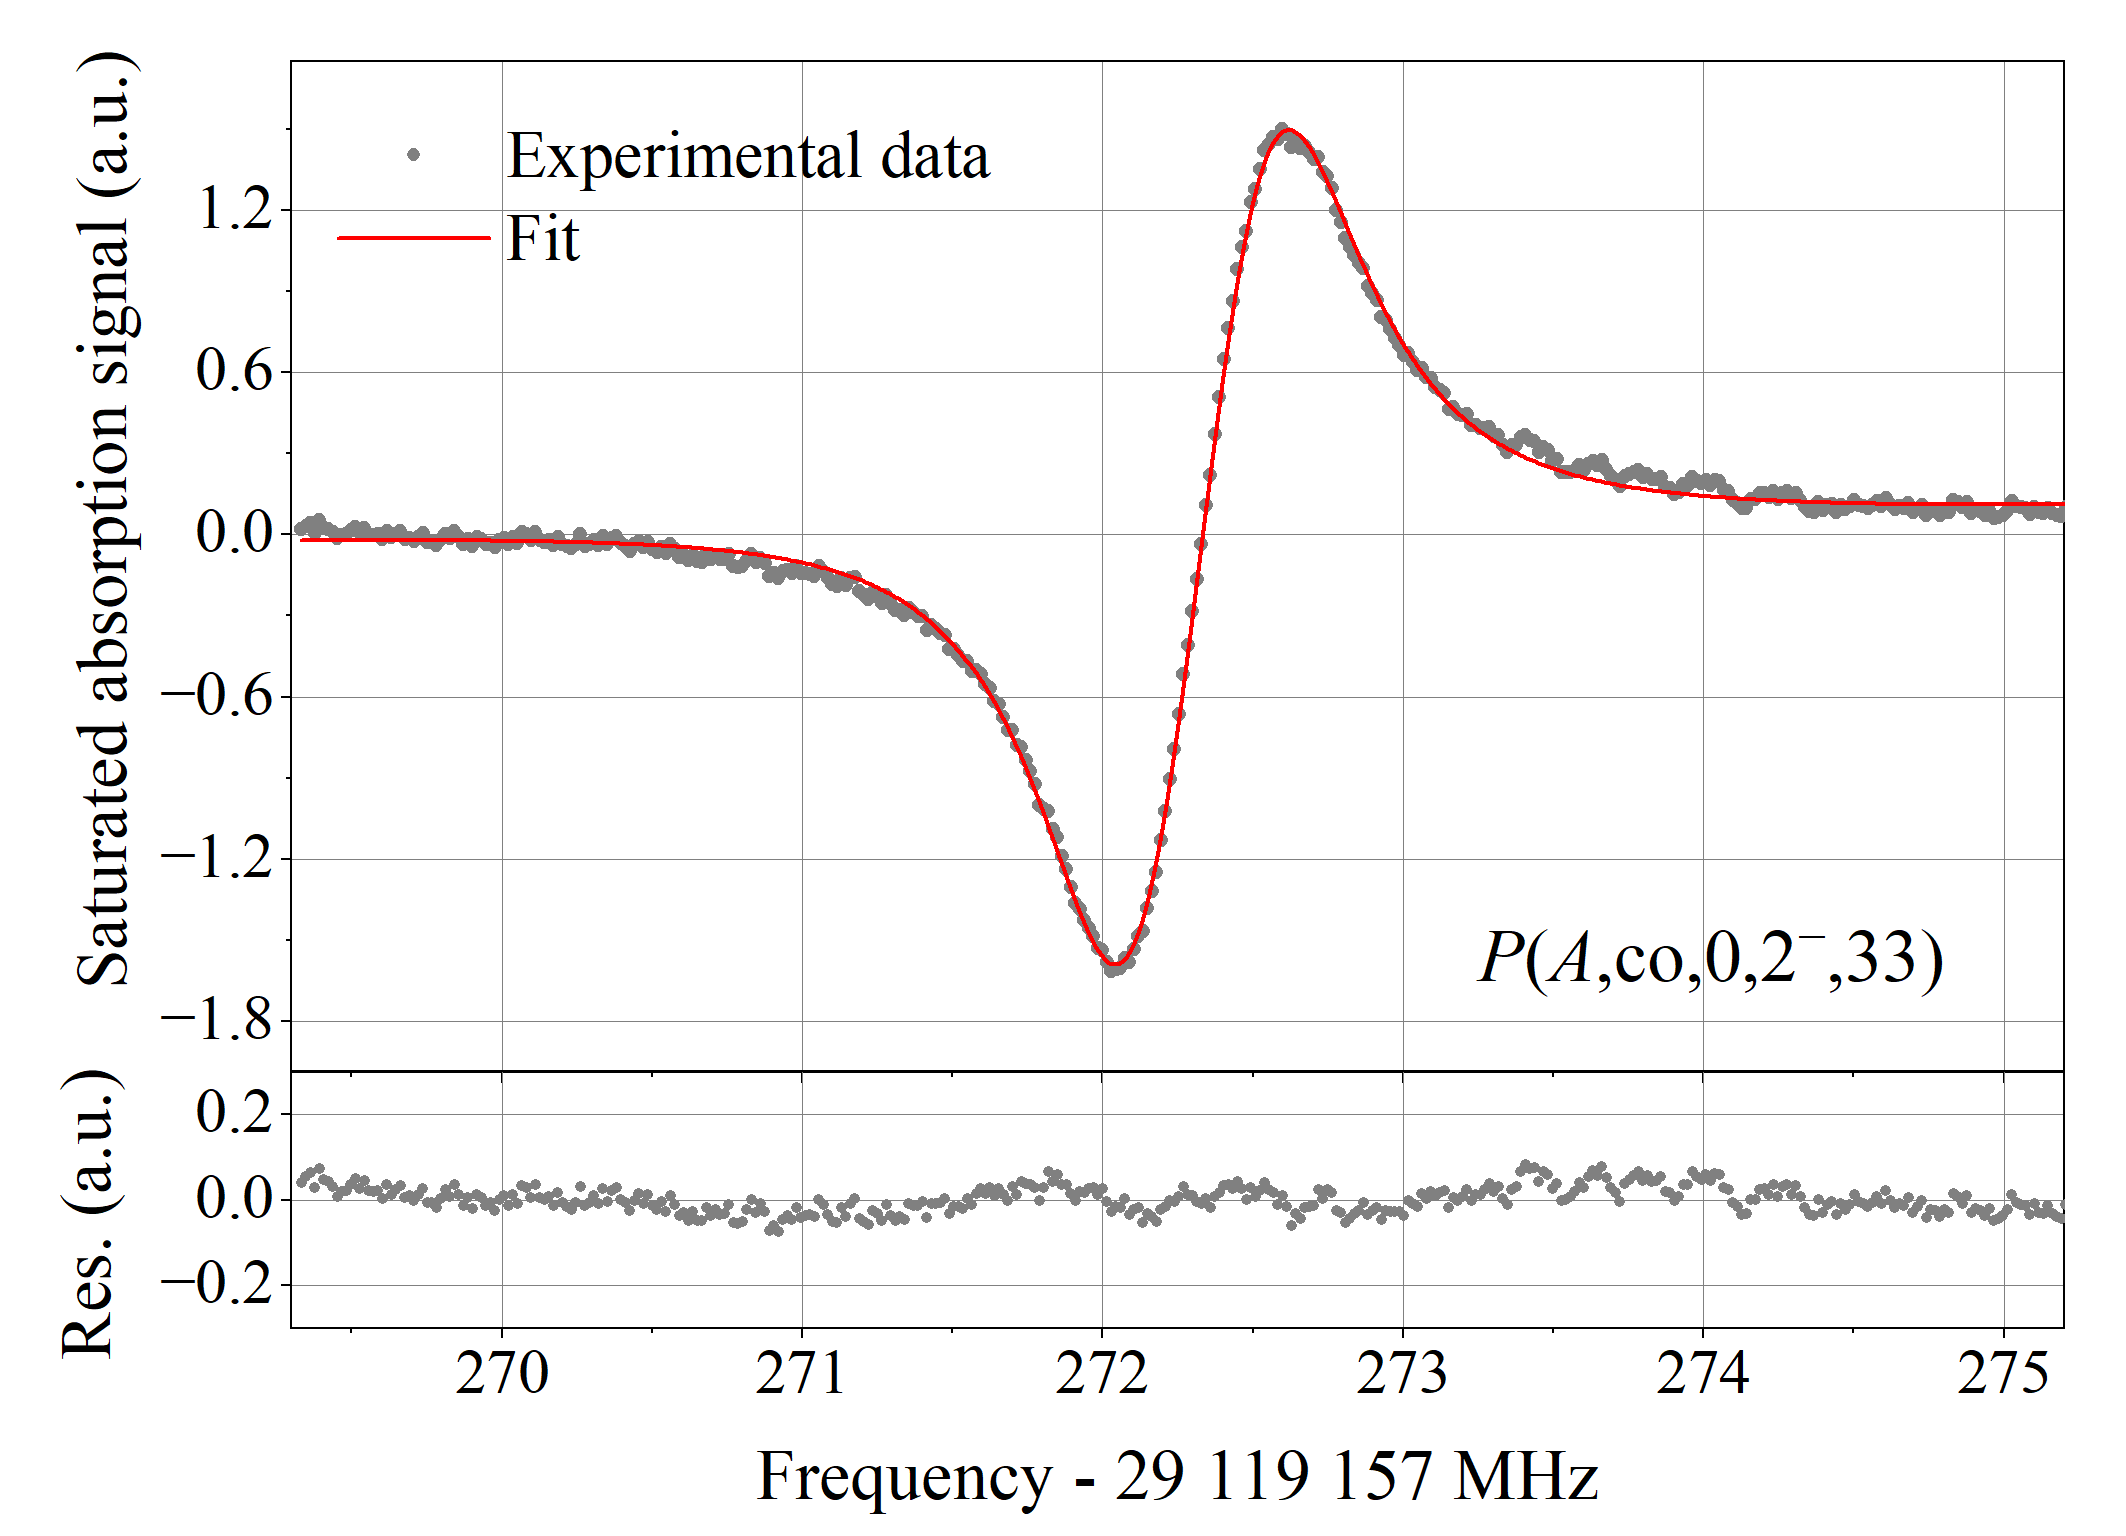
We fit each averaged pairs of up and down scans of a given transition to the sum of the line profile described in Appendix B and of a second order polynomial to account for the baseline (dominated by the underlying Gaussian contribution on the narrow frequency span used for fitting). All line shape parameters are left free in the fit except the FM amplitude fixed to 250 kHz. The doublets are fitted together using a single second order baseline and, apart from the intensity factors, line shape parameters set to be equal for the two components. For instance, Figure 3 shows the average of one pair of up and down scans of the ro-vibrational transition of methanol (grey points), the fit of the line shape model to the data (red solid curve) and the corresponding residuals.
Appendix D Frequency measurement uncertainty budget
The reader is referred to Refs. Santagata et al. (2019); Tran (2019) for a detailed description of the line positions uncertainty budget. We only briefly list here the systematic effects and associated uncertainties: (i) we estimate a conservative upper bound on the frequency shift resulting from gas lens effects, wavefront-curvature-induced residual Doppler shifts, the second-order Doppler shift, Zeeman effects, black-body radiation shifts and the photon recoil doublet to be 5 kHz and take this as the corresponding uncertainty; (ii) we assign a conservative 2 kHz systematic uncertainty to the inaccuracy of our model for the line shape (see below); (iii) our 0.02 Pa pressure measurement accuracy and the 5% specified accuracy of the power meter result in pressure- and power-shift-induced systematic uncertainties of 0.1 kHz and 0.5 kHz respectively (pressure and power fluctuations respectively smaller than 0.02 Pa and 10% during a scan and from one to another result in frequency fluctuations of <0.1 kHz and 1 kHz respectively which contribute to our statistical uncertainty); (iv) the 1 Hz uncertainty on the mid-IR frequency scale is dominated by the uncertainty on the LNE-SYRTE frequency reference value used to retrieve the absolute frequency scale using Equation (4).
We use the three unambiguously assigned highest intensity lines shown in FIG. 2(a) to determine the systematic uncertainty resulting from the inaccuracy of our model for the line shape (point (ii) above). We fit averaged pairs of up and down scans with the sum of the spectral line shape described in Appendix C and a polynomial of order with ranging from 2 to 5. For all averaged spectra, we find the standard deviation of the four frequencies resulting from the corresponding fits to be less that 2 kHz, which we take as our conservative systematic uncertainty.
References
References
- Hinds (1997) E. Hinds, “Testing time reversal symmetry using molecules,” Physica Scripta 1997, 34 (1997).
- Roussy et al. (2023) T. S. Roussy, L. Caldwell, T. Wright, W. B. Cairncross, Y. Shagam, K. B. Ng, N. Schlossberger, S. Y. Park, A. Wang, J. Ye, et al., “An improved bound on the electron’s electric dipole moment,” Science 381, 46–50 (2023).
- Fiechter et al. (2022) M. R. Fiechter, P. A. Haase, N. Saleh, P. Soulard, B. Tremblay, R. W. Havenith, R. G. Timmermans, P. Schwerdtfeger, J. Crassous, B. Darquié, et al., “Toward detection of the molecular parity violation in chiral and ,” The Journal of Physical Chemistry Letters 13, 10011–10017 (2022).
- Pastor et al. (2015) P. C. Pastor, I. Galli, G. Giusfredi, D. Mazzotti, and P. De Natale, “Testing the validity of Bose-Einstein statistics in molecules,” Physical Review A 92, 063820 (2015).
- Patra et al. (2020) S. Patra, M. Germann, J.-P. Karr, M. Haidar, L. Hilico, V. Korobov, F. Cozijn, K. Eikema, W. Ubachs, and J. Koelemeij, “Proton-electron mass ratio from laser spectroscopy of at the part-per-trillion level,” Science 369, 1238–1241 (2020).
- Diouf et al. (2019) M. Diouf, F. Cozijn, B. Darquié, E. Salumbides, and W. Ubachs, “Lamb-dips and Lamb-peaks in the saturation spectrum of HD,” Optics Letters 44, 4733–4736 (2019).
- Barontini et al. (2022) G. Barontini, L. Blackburn, V. Boyer, F. Butuc-Mayer, X. Calmet, J. C. López-Urrutia, E. Curtis, B. Darquié, J. Dunningham, N. Fitch, et al., “Measuring the stability of fundamental constants with a network of clocks,” EPJ Quantum Technology 9, 12 (2022).
- Muller et al. (2021) S. Muller, W. Ubachs, K. Menten, C. Henkel, and N. Kanekar, “A study of submillimeter methanol absorption toward : Excitation, invariance of the proton-electron mass ratio, and systematics,” Astronomy & Astrophysics 652, A5 (2021).
- Segal et al. (2018) D. Segal, V. Lorent, R. Dubessy, and B. Darquié, “Studying fundamental physics using quantum enabled technologies with trapped molecular ions,” Journal of Modern Optics 65, 490–500 (2018).
- Mudiayi et al. (2021) J. L. Mudiayi, I. Maurin, T. Mashimo, J. C. de Aquino Carvalho, D. Bloch, S. Tokunaga, B. Darquié, and A. Laliotis, “Linear probing of molecules at micrometric distances from a surface with sub-doppler frequency resolution,” Physical Review Letters 127, 043201 (2021).
- Benabid et al. (2005) F. Benabid, F. Couny, J. Knight, T. Birks, and P. S. J. Russell, “Compact, stable and efficient all-fibre gas cells using hollow-core photonic crystal fibres,” Nature 434, 488–491 (2005).
- Castrillo et al. (2019) A. Castrillo, E. Fasci, H. Dinesan, S. Gravina, L. Moretti, and L. Gianfrani, “Optical determination of thermodynamic temperatures from a line-doublet in the near infrared,” Physical review applied 11, 064060 (2019).
- Mejri et al. (2015) S. Mejri, P. L. T. Sow, O. Kozlova, C. Ayari, S. K. Tokunaga, C. Chardonnet, S. Briaudeau, B. Darquié, F. Rohart, and C. Daussy, “Measuring the Boltzmann constant by mid-infrared laser spectroscopy of ammonia,” Metrologia 52, S314 (2015).
- Herbst and Van Dishoeck (2009) E. Herbst and E. F. Van Dishoeck, “Complex organic interstellar molecules,” Annual Review of Astronomy and Astrophysics 47, 427–480 (2009).
- Galli et al. (2016) I. Galli, S. Bartalini, R. Ballerini, M. Barucci, P. Cancio, M. De Pas, G. Giusfredi, D. Mazzotti, N. Akikusa, and P. De Natale, “Spectroscopic detection of radiocarbon dioxide at parts-per-quadrillion sensitivity,” Optica 3, 385–388 (2016).
- Harrison, Bernath, and Kirchengast (2011) J. J. Harrison, P. F. Bernath, and G. Kirchengast, “Spectroscopic requirements for ACCURATE, a microwave and infrared-laser occultation satellite mission,” Journal of Quantitative Spectroscopy and Radiative Transfer 112, 2347–2354 (2011).
- Guinet et al. (2010) M. Guinet, D. Mondelain, C. Janssen, and C. Camy-Peyret, “Laser spectroscopic study of ozone in the band for the SWIFT instrument,” Journal of Quantitative Spectroscopy and Radiative Transfer 111, 961–972 (2010).
- Myers et al. (2002) T. L. Myers, R. M. Williams, M. S. Taubman, C. Gmachl, F. Capasso, D. L. Sivco, J. N. Baillargeon, and A. Y. Cho, “Free-running frequency stability of mid-infrared quantum cascade lasers,” Optics letters 27, 170–172 (2002).
- Bartalini et al. (2010) S. Bartalini, S. Borri, P. Cancio, A. Castrillo, I. Galli, G. Giusfredi, D. Mazzotti, L. Gianfrani, and P. De Natale, “Observing the intrinsic linewidth of a quantum-cascade laser: beyond the Schawlow-Townes limit,” Physical review letters 104, 083904 (2010).
- Tombez et al. (2011) L. Tombez, J. Di Francesco, S. Schilt, G. Di Domenico, J. Faist, P. Thomann, and D. Hofstetter, “Frequency noise of free-running 4.6 m distributed feedback quantum cascade lasers near room temperature,” Optics letters 36, 3109–3111 (2011).
- Bartalini et al. (2011) S. Bartalini, S. Borri, I. Galli, G. Giusfredi, D. Mazzotti, T. Edamura, N. Akikusa, M. Yamanishi, and P. De Natale, “Measuring frequency noise and intrinsic linewidth of a room-temperature DFB quantum cascade laser,” Optics express 19, 17996–18003 (2011).
- Tombez et al. (2012) L. Tombez, S. Schilt, J. Di Francesco, T. Führer, B. Rein, T. Walther, G. Di Domenico, D. Hofstetter, and P. Thomann, “Linewidth of a quantum-cascade laser assessed from its frequency noise spectrum and impact of the current driver,” Applied Physics B 109, 407–414 (2012).
- Mills et al. (2012) A. A. Mills, D. Gatti, J. Jiang, C. Mohr, W. Mefford, L. Gianfrani, M. Fermann, I. Hartl, and M. Marangoni, “Coherent phase lock of a 9 m quantum cascade laser to a 2 m thulium optical frequency comb,” Optics letters 37, 4083–4085 (2012).
- Galli et al. (2013) I. Galli, M. Siciliani de Cumis, F. Cappelli, S. Bartalini, D. Mazzotti, S. Borri, A. Montori, N. Akikusa, M. Yamanishi, G. Giusfredi, P. Cancio, and P. De Natale, “Comb-assisted subkilohertz linewidth quantum cascade laser for high-precision mid-infrared spectroscopy,” Applied Physics Letters 102, 121117 (2013).
- Sow et al. (2014) P. L. T. Sow, S. Mejri, S. K. Tokunaga, O. Lopez, A. Goncharov, B. Argence, C. Chardonnet, A. Amy-Klein, C. Daussy, and B. Darquié, “A widely tunable 10-m quantum cascade laser phase-locked to a state-of-the-art mid-infrared reference for precision molecular spectroscopy,” Applied Physics Letters 104, 264101 (2014).
- Argence et al. (2015) B. Argence, B. Chanteau, O. Lopez, D. Nicolodi, M. Abgrall, C. Chardonnet, C. Daussy, B. Darquié, Y. Le Coq, and A. Amy-Klein, “Quantum cascade laser frequency stabilization at the sub-Hz level,” Nature Photonics 9, 456 (2015).
- Cappelli et al. (2015) F. Cappelli, G. Villares, S. Riedi, and J. Faist, “Intrinsic linewidth of quantum cascade laser frequency combs,” Optica 2, 836–840 (2015).
- Chomet et al. (2023) B. Chomet, D. Gacemi, O. Lopez, L. Del Balzo, A. Vasanelli, Y. Todorov, B. Darquié, and C. Sirtori, “Highly coherent phase-lock of an 8.1 m quantum cascade laser to a turn-key mid-IR frequency comb,” Applied Physics Letters 122, 231102 (2023).
- Acef (1997) O. Acef, “Metrological properties of optical frequency standard,” Optics Communications 134, 479–486 (1997).
- Santagata et al. (2019) R. Santagata, D. B. A. Tran, B. Argence, O. Lopez, S. K. Tokunaga, F. Wiotte, H. Mouhamad, A. Goncharov, M. Abgrall, Y. L. Coq, H. Alvarez-Martinez, R. L. Targat, W. K. Lee, D. Xu, P.-E. Pottie, B. Darquié, and A. Amy-Klein, “High-precision methanol spectroscopy with a widely tunable SI-traceable frequency-comb-based mid-infrared QCL,” Optica 6, 411–423 (2019).
- Insero et al. (2017) G. Insero, S. Borri, D. Calonico, P. C. Pastor, C. Clivati, D. D’ambrosio, P. Natale, M. Inguscio, F. Levi, and G. Santambrogio, “Measuring molecular frequencies in the 1-10 m range at 11-digits accuracy,” Scientific reports 7, 12780 (2017).
- Sinhal, Johnson, and Willitsch (2022) M. Sinhal, A. Johnson, and S. Willitsch, “Frequency stabilisation and SI tracing of mid-infrared quantum-cascade lasers for precision molecular spectroscopy,” Molecular Physics , e2144519 (2022).
- Sun et al. (2004) Z.-D. Sun, Q. Liu, R. Lees, L.-H. Xu, M. Y. Tretyakov, and V. Dorovskikh, “Dual-mode -laser/microwave-sideband spectrometer with broadband and saturation dip detection for ,” Review of scientific instruments 75, 1051–1060 (2004).
- Lemarchand et al. (2013) C. Lemarchand, S. Mejri, P. L. T. Sow, M. Triki, S. K. Tokunaga, S. Briaudeau, C. Chardonnet, B. Darquié, and C. Daussy, “A revised uncertainty budget for measuring the Boltzmann constant using the doppler broadening technique on ammonia,” Metrologia 50, 623 (2013).
- Bartalini et al. (2007) S. Bartalini, P. Cancio, G. Giusfredi, D. Mazzotti, P. De Natale, S. Borri, I. Galli, T. Leveque, and L. Gianfrani, “Frequency-comb-referenced quantum-cascade laser at 4.4 m,” Optics letters 32, 988–990 (2007).
- Gambetta et al. (2010) A. Gambetta, E. Fasci, A. Castrillo, M. Marangoni, G. Galzerano, G. Casa, P. Laporta, and L. Gianfrani, “Frequency metrology in the near-infrared spectrum of and molecules: testing a new inversion method for retrieval of energy levels,” New Journal of Physics 12, 103006 (2010).
- Borri et al. (2012) S. Borri, I. Galli, F. Cappelli, A. Bismuto, S. Bartalini, P. Cancio, G. Giusfredi, D. Mazzotti, J. Faist, and P. De Natale, “Direct link of a mid-infrared QCL to a frequency comb by optical injection,” Optics Letters 37, 1011–1013 (2012).
- Gatti et al. (2013) D. Gatti, A. A. Mills, M. D. De Vizia, C. Mohr, I. Hartl, M. Marangoni, M. Fermann, and L. Gianfrani, “Frequency-comb-calibrated doppler broadening thermometry,” Physical Review A 88, 012514 (2013).
- Gambetta et al. (2015) A. Gambetta, M. Cassinerio, N. Coluccelli, E. Fasci, A. Castrillo, L. Gianfrani, D. Gatti, M. Marangoni, P. Laporta, and G. Galzerano, “Direct phase-locking of a 8.6-m quantum cascade laser to a mid-IR optical frequency comb: application to precision spectroscopy of ,” Optics letters 40, 304–307 (2015).
- Hansen et al. (2015) M. G. Hansen, E. Magoulakis, Q.-F. Chen, I. Ernsting, and S. Schiller, “Quantum cascade laser-based mid-IR frequency metrology system with ultra-narrow linewidth and -level frequency instability,” Optics letters 40, 2289–2292 (2015).
- Gambetta et al. (2017) A. Gambetta, E. Vicentini, Y. Wang, N. Coluccelli, E. Fasci, L. Gianfrani, A. Castrillo, V. Di Sarno, L. Santamaria, P. Maddaloni, et al., “Absolute frequency measurements of doppler-free ro-vibrational transitions at 8.6 m,” Optics Letters 42, 1911–1914 (2017).
- Lamperti et al. (2018) M. Lamperti, B. AlSaif, D. Gatti, M. Fermann, P. Laporta, A. Farooq, and M. Marangoni, “Absolute spectroscopy near 7.8 m with a comb-locked extended-cavity quantum-cascade-laser,” Scientific reports 8, 1292 (2018).
- Lepère et al. (2022) M. Lepère, O. Browet, J. Clément, B. Vispoel, P. Allmendinger, J. Hayden, F. Eigenmann, A. Hugi, and M. Mangold, “A mid-infrared dual-comb spectrometer in step-sweep mode for high-resolution molecular spectroscopy,” Journal of Quantitative Spectroscopy and Radiative Transfer 287, 108239 (2022).
- Agner et al. (2022) J. A. Agner, S. Albert, P. Allmendinger, U. Hollenstein, A. Hugi, P. Jouy, K. Keppler, M. Mangold, F. Merkt, and M. Quack, “High-resolution spectroscopic measurements of cold samples in supersonic beams using a QCL dual-comb spectrometer,” Molecular Physics 120, e2094297 (2022).
- Komagata et al. (2023) K. Komagata, V. Wittwer, T. Südmeyer, L. Emmenegger, and M. Gianella, “Absolute frequency referencing for swept dual-comb spectroscopy with midinfrared quantum cascade lasers,” Physical Review Research 5, 013047 (2023).
- Yang et al. (2023) G. Yang, V. S. de Oliveira, D. Laumer, C. M. Heyl, A. Yachmenev, I. Hartl, and J. Küpper, “Self-broadening and self-shift in the 3 band of ammonia from mid-infrared-frequency-comb spectroscopy,” Journal of molecular spectroscopy 392, 111744 (2023).
- Laumer et al. (2023) D. Laumer, S. Salman, Y. Ma, K. T. Zawilski, P. G. Schunemann, M. Seidel, C. M. Heyl, and I. Hartl, “Sub-Hz relative linewidths from an interferometrically stabilized mid-infrared frequency comb,” Optics Letters 48, 3055–3058 (2023).
- Picqué and Hänsch (2019) N. Picqué and T. W. Hänsch, “Frequency comb spectroscopy,” Nature Photonics 13, 146–157 (2019).
- Batrla et al. (1987) W. Batrla, H. Matthews, K. Menten, and C. Walmsley, “Detection of strong methanol masers towards galactic H II regions,” Nature 326, 49–51 (1987).
- Singh et al. (2001) H. Singh, Y. Chen, A. Staudt, D. Jacob, D. Blake, B. Heikes, and J. Snow, “Evidence from the pacific troposphere for large global sources of oxygenated organic compounds,” Nature 410, 1078–1081 (2001).
- Lankhaar, Groenenboom, and van der Avoird (2016) B. Lankhaar, G. C. Groenenboom, and A. van der Avoird, “Hyperfine interactions and internal rotation in methanol,” The Journal of chemical physics 145, 244301 (2016).
- Sun et al. (2000) Z.-D. Sun, F. Matsushima, S. Tsunekawa, and K. Takagi, “Sub-Doppler spectroscopy of the C-O stretching fundamental band of methanol by use of microwave sidebands of CO2 laser lines,” J. Opt. Soc. Am. B 17, 2068–2080 (2000).
- Jiu et al. (2010) Z. X. Jiu, D. L. Zuo, L. Miao, Z. H. Cheng, and C. C. Qi, “Pulsed terahertz laser emission pumped by a TEA laser,” Journal of Infrared, Millimeter, and Terahertz Waves 31, 885–891 (2010).
- Argence et al. (2012) B. Argence, E. Prevost, T. Lévèque, R. Le Goff, S. Bize, P. Lemonde, and G. Santarelli, “Prototype of an ultra-stable optical cavity for space applications,” Optics express 20, 25409–25420 (2012).
- Cantin et al. (2021) E. Cantin, M. Tønnes, R. Le Targat, A. Amy-Klein, O. Lopez, and P.-E. Pottie, “An accurate and robust metrological network for coherent optical frequency dissemination,” New Journal of Physics 23, 053027 (2021).
- Xu et al. (2019) D. Xu, P. Delva, O. Lopez, A. Amy-Klein, and P.-E. Pottie, “Reciprocity of propagation in optical fiber links demonstrated to ,” Optics Express 27, 36965–36975 (2019).
- Newbury, Williams, and Swann (2007) N. R. Newbury, P. A. Williams, and W. C. Swann, “Coherent transfer of an optical carrier over 251 km,” Optics Letters 32, 3056–3058 (2007).
- Guena et al. (2012) J. Guena, M. Abgrall, D. Rovera, P. Laurent, B. Chupin, M. Lours, G. Santarelli, P. Rosenbusch, M. E. Tobar, R. Li, K. Gibble, A. Clairon, and S. Bize, “Progress in atomic fountains at LNE-SYRTE,” IEEE Transactions on Ultrasonics, Ferroelectrics, and Frequency Control 59, 391–409 (2012).
- Tran (2019) D. B. A. Tran, Widely tunable and SI-traceable frequency-comb-stabilised mid-infrared quantum cascade laser: application to high precision spectroscopic measurements of polyatomic molecules, Ph.D. thesis, Université Paris 13 - Sorbonne Paris Cité (2019).
- McManus, Kebabian, and Zahniser (1995) J. McManus, P. Kebabian, and M. Zahniser, “Astigmatic mirror multipass absorption cells for long-path-length spectroscopy,” Applied Optics 34, 3336–3348 (1995).
- Rohart et al. (2014) F. Rohart, S. Mejri, P. L. T. Sow, S. K. Tokunaga, C. Chardonnet, B. Darquié, H. Dinesan, E. Fasci, A. Castrillo, L. Gianfrani, and C. Daussy, “Absorption-line-shape recovery beyond the detection-bandwidth limit: Application to the precision spectroscopic measurement of the Boltzmann constant,” Physical Review A 90, 042506 (2014).
- Rohart (2017) F. Rohart, “Overcoming the detection bandwidth limit in precision spectroscopy: The analytical apparatus function for a stepped frequency scan,” Journal of Quantitative Spectroscopy and Radiative Transfer 187, 490–504 (2017).
- Xu et al. (2004) L.-H. Xu, R. Lees, P. Wang, L. Brown, I. Kleiner, and J. Johns, “New assignments, line intensities, and HITRAN database for CH3OH at 10 m,” Journal of Molecular Spectroscopy 228, 453–470 (2004).
- Gordon et al. (2022) I. E. Gordon, L. S. Rothman, R. Hargreaves, R. Hashemi, E. V. Karlovets, F. Skinner, E. K. Conway, C. Hill, R. V. Kochanov, Y. Tan, et al., “The HITRAN2020 molecular spectroscopic database,” Journal of quantitative spectroscopy and radiative transfer 277, 107949 (2022).
- Lees et al. (2007) R. Lees, L.-H. Xu, J. Johns, B. Winnewisser, and M. Lock, “Rotation–torsion–vibration term-value mapping for CH3OH: Torsion-mediated doorways and corridors for intermode population transfer,” Journal of Molecular Spectroscopy 243, 168–181 (2007).
- Sun et al. (2002) Z.-D. Sun, S. Ishikuro, Y. Moriwaki, F. Matsushima, S. Tsunekawa, and K. Takagi, “Sub-Doppler measurements of , K=0, A/E lines of methanol with microwave sidebands of CO2 laser lines,” Journal of Molecular Spectroscopy 211, 162–166 (2002).
- Sun et al. (2003) Z.-D. Sun, T. Mizuochi, M. Kaneko, Y. Moriwaki, F. Matsushima, and K. Takagi, “Sub-Doppler spectroscopy by use of microwave sidebands of CO2 laser lines applied to the CO stretching fundamental band of methanol,” Molecules 8, 92–102 (2003).
- Sun, Lees, and Xu (2006) Z.-D. Sun, R. M. Lees, and L.-H. Xu, “Saturation-dip measurements for the CO stretching band of with a -laser-microwave-sideband spectrometer,” JOSA B 23, 2398–2417 (2006).
- Tochitsky and Butcher (1998) S. Y. Tochitsky and R. Butcher, “Precise measurements of line broadening and line shifts in low-pressure gases using a heterodyne laser spectrometer: applications to and ,” JOSA B 15, 1392–1398 (1998).
- Schilt, Thevenaz, and Robert (2003) S. Schilt, L. Thevenaz, and P. Robert, “Wavelength modulation spectroscopy: combined frequency and intensity laser modulation,” Applied optics 42, 6728–6738 (2003).
- Arndt (1965) R. Arndt, “Analytical line shapes for lorentzian signals broadened by modulation,” Journal of Applied Physics 36, 2522–2524 (1965).