Whitepaper on Reusable Hybrid and Multi-Cloud Analytics Service Framework
Abstract.
Over the last several years, the computation landscape for conducting data analytics has completely changed. While in the past, a lot of the activities have been undertaken in isolation by companies, and research institutions, today’s infrastructure constitutes a wealth of services offered by a variety of providers that offer opportunities for reuse, and interactions while leveraging service collaboration, and service cooperation.
This document focuses on expanding analytics services to develop a framework for reusable hybrid multi-service data analytics. It includes (a) a short technology review that explicitly targets the intersection of hybrid multi-provider analytics services, (b) a small motivation based on use cases we looked at, (c) enhancing the concepts of services to showcase how hybrid, as well as multi-provider services can be integrated and reused via the proposed framework, (d) address analytics service composition, and (e) integrate container technologies to achieve state-of-the-art analytics service deployment capabilities.
Gregor von Laszewski
Wo Chang
Russell Reinsch
Olivera Kotevska
Ali Karimi
Abdul Rahman Sattar
Garry Mazzaferro
Geoffrey C. Fox
section/data.tex section/experimment.tex section/registry.tex usecase/earthquake.tex
1. Introduction
Analytics as a service has become a multi-billion dollar opportunity for the industry. With Big Data’s compound annual growth rate at 61% and its ever-increasing deluge of information in the mainstream, the collective sum of world data will grow from 33 zettabytes (ZB, 1021) in 2018 to 175 ZB by 2025 (John Rydning, 2021). The presence of such a rich source of information requires a massive analysis that can effectively bring about much insight and knowledge discovery. While in the past, emphasis has been placed on the hybrid multi-cloud infrastructure services, the focus is now significantly shifting to offering analytics as services and not just infrastructure as a service to customers and researchers. Hence, it is important to identify how researchers and industry can interoperate with services offered by various service providers. Analog to the terminology in cloud computing, we introduce the terms hybrid analytics services to include services run by remote service providers or by an organization on local resources. In addition, we use the term multi analytics services to indicate that multiple services from potentially multiple service providers work in concert to offer a new capability released to users as analytics services. While applying such services to data, we term the combination of such services as hybrid multi-services data analytics services. If properly put in place, the resulting service accelerates new solutions offered by industry and research as new services with a combined new functionality, which can be reused or replicated. Research institutions and private companies offer a number of services that can be integrated into custom analytics services, offering competing but also collaborating analytics services.
To achieve this goal of developing and integrating such services, a certain degree of platform-independence and platform interoperability is needed to ensure that the pathway to leverage these hybrid and multi-analytics services are kept at a high level while at the same time exposing enough details. It is advantageous to leverage frameworks that are used by many vendors. Here we will use REST services as such a platform as it provides us with the needed abstractions but also allows us to integrate with persistent services such as data services.
Furthermore, we need to support intelligent decision-making as part of the service orchestration. Services must be chosen to fulfill a set of analytics service level requirements posed by the users. It is of particular interest how we can formulate hybrid analytics services and multi-analytics services offered by different providers that provide other features. The user needs to specify this via a simple analytics service provider independent specification.
Our data analysis intends to be capable of determining which service is suitable or chosen based on its requirements and to what degree reusability is offered while replicating the analysis across different services. Hence we will work towards a “Reusable Hybrid Multi-Services Data Analytics Framework”. This results in a research platform that allows the creation of an integrated application platform benefiting from reusable hybrid analytics services.
By integrating such services, we will be able to significantly impact data analytics while leveraging not only one vendor’s implementation but by promoting the reuse services via a many-vendors approach. Not only that, but we will also allow the interplay between different approaches while offering a uniform specification platform. Because we target the topic of this interplay, the effort has been done in collaboration with the NIST Information Access Division (IAD) in the NIST Big Data Working Group.
The paper is structured as follows. First, we present the motivation leading up to this work (Section 2), followed by a discussion about requirements that we derived by analyzing a number of complex use cases. Next, we present our architectural approach, which is based on lessons learned from the requirements we have gathered and lessons learned during our implementation (Section From Big Data Reference Architecture to Analytics Services.: . We present an architectural design capable of supporting the needs we have identified. Finally, we present our conclusions.
2. Enabling Concepts
This section explains the motivation while briefly summarizing the different concepts constituting our work. While our previous work focused on developing a Big Data Reference Architecture and standards roadmap (von Laszewski and Chang, 2019). This work specifically focused on the definition of Analytics Services. This work is a logical enhancement to the earlier work and can leverage activities conducted as part of the NIST Big Data Reference Architecture (NBD-RA) and NBD-RA Interfaces. However, the work here targets explicitly Data Analytics as a pathway to integrate the data analytics ecosystem. This includes not only existing legacy analytics services and tools but also the integration of state-of-the-art AI services, including machine learning and deep learning analytics, within the auspice to create a service-oriented framework integrating all of them. Hence, they can easily be reused by others. Next, we define some of the terminology and concepts we use.
- From Big Data Reference Architecture to Analytics Services.:
-
NIST has developed a Big Data Reference Architecture as part of NBDIF(Chang, 2015f) and identified a number of use cases that motivate it (Chang, 2015c). We leverage this effort (Chang, 2015a, b, c, d, e, f, g; von Laszewski and Chang, 2019; Chang, 2019) while formulating service interoperability specifications that we focus on in this effort and have not been previously addressed in detail. While we previously focused mostly on infrastructure management, this effort enhances the activities to include high-level coordinated service deployments and utilization while leveraging containers. The concepts we introduce next specifically target analytics services and not just infrastructure services. However, the lessons learned from the earlier work significantly influenced this activity.
- Hybrid Analytics Services.:
-
A hybrid analytics service combines the strength of analytics services that are offered by providers in public, private, or on-premise usage scenarios. It leverages them to provide optimized orchestration across private, public, and on-premise analytics. Optimization benefits are not limited to reducing cost but also addressing security and privacy concerns when the data analytics or the data to perform the analytics can not be hosted in public clouds. Many of the major cloud providers such as AWS, Azure, Google, IBM, Oracle, and others have made hybrid clouds a cornerstone of their business model, with each of them essentially promoting their own solutions. Recently, however, we see that the cloud provider’s focus is no longer offering just infrastructure but instead to provide services hiding and abstracting the cloud infrastructure entirely from the users while placing focus on offering services. This has led to vendors also providing hybrid analytics solutions that may integrate multiple services offered by various providers, resulting in solutions with heterogeneous service offerings. Integrating such services involves significant challenges, as each vendor may conform to and or require different integration solutions for addressing various public, private and on-premise analytics services. Customers will generally benefit from a more integrated approach to ease deployment and management concerns.
- Multi-Analytics Services to Cooperate and Compete.:
-
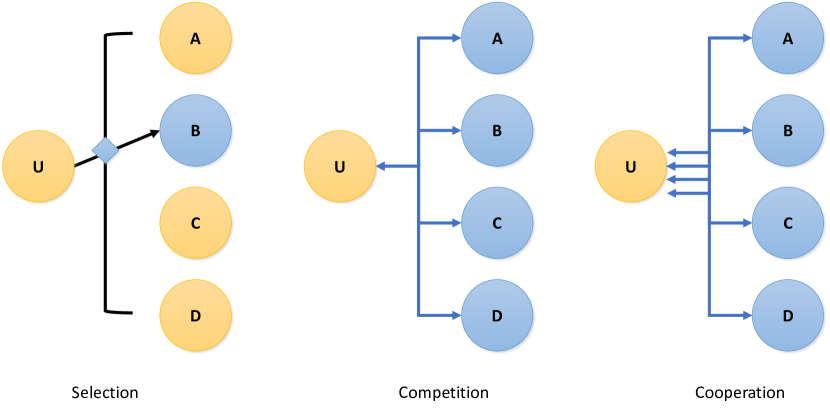
Over the last several years, we have seen an explosion of analytics services, mainly through the integration of AI and deep learning services. High-level analytics services are being developed that hide and abstract the complex infrastructure needed to embed not only services from one vendor but multiple vendors. Hence we speak of multi-analytics services. These services can then be used in cooperation and/or competition. We cooperate if services enhance each other, we compete if a service is chosen over another service due to better service level agreements. Through this interplay of the services, it is beneficial to formalize interoperability between them. In cases of competition, we also need to be able to formulate a competing service that then calls out other services to implement desired analytics tasks.
- Identification of State-of-the-Art Data Analytics Patterns.:
-
Analytics services consumers have to ask why and how now, this opportunity can be addressed to enable this interplay by utilizing hybrid multi-service-based analytics as a service needs are clearly motivated by state-of-the-art data analytics capabilities that have only recently became available. In addition, government agencies have provided some of the most capable high-end computing systems over the last years, they tightly integrated specialized GPUs as well as container technologies to bring forward new data analytics capabilities in these on-premise services. Industry has provided advanced analysis capabilities for some time but have only recently reached a maturity supporting reuse and cooperation opportunities between them.
- FAIR Principle for Analytics Services.:
-
Reusability is an essential part of adaptation. To make it explicitly clear, we adopt the well-known FAIR principal (Wilkinson et al., 2016) but enhance them first by focussing on analytics services, deployability, and operations. Together we use the tern Analytics Service FAIR Principle (AS-FAIR-DO).
To project easy reusability, we strive toward the implementation of the AS-FAIR-DO principle for analytics services. The FAIR principle is typically applied to data; as such, we can apply it to the metadata associated with analytics services. The FAIR principle addresses which to be findable, accessible, interoperable, and reusable. In Figure 1 we explicitly augmented the general FAIR principle with terminology so it can apply to analytics services. The augmentations are colored in red. As such, not only data is part of the principle, but also the data representing the services themselves.
| To be Findable: | |
| F1 | analytics services metadata are assigned a globally unique and persistent identifier |
| F2 | analytics services data are described with rich metadata (defined by R1) |
| F3 | analytics services metadata clearly and explicitly include the identifier of the data related to the analytics services it describes |
| F4 | analytics services metadata are registered or indexed in a searchable resource |
| To be Accessible: | |
| A.1 | analytics services metadata are retrievable by their identifier using a standardized communications protocol |
| A1.1 | analytics services the protocol is open, free, and universally implementable |
| A1.2 | the analytics services protocol allows for an authentication and authorization procedure, where necessary |
| A.2 | metadata are accessible, even when the data are no longer available |
| To be Interoperable: | |
| I1. | analytics services metadata use a formal, accessible, shared, and broadly applicable language for knowledge representation. |
| I2. | analytics services metadata use vocabularies that follow FAIR principles |
| I3. | analytics services metadata include qualified references to other metadata |
| To be Reusable: | |
| R1. | analytics services metadata are richly described with a plurality of accurate and relevant attributes |
| R1.1 | (meta)data are released with a clear and accessible data usage license |
| R1.2 | (meta)data are associated with detailed provenance |
| R1.3 | (meta)data meet domain-relevant community standards |
| To be Deployable: | |
| D.1 | analytics services metadata describing deployability aspects |
| To be Operational: | |
| O.1 | analytics services metadata describing operational aspects |
2.1. Enabling Technology Concepts and Terminology
A number of technologies are enabling us to develop the framework we describe here, and they provide the cornerstone of our efforts.
- Cloud:
-
According to NIST, cloud computing “is a model for enabling ubiquitous, convenient, on-demand network access to a shared pool of configurable computing resources (e.g., networks, servers, storage, applications, and services) that can be rapidly provisioned and released with minimal management effort or service provider interaction.” The model is composed of five characteristics addressing together on-demand self-service, broad network access, resource pooling, rapid elasticity, measured services, software as a service, platform as a service, infrastructure as a service, and private, public, hybrid cloud,
- Hyperscale cloud compute centers:
-
provide compute centers that are scaled based on increased demand by the user. Hence users have seemingly access to resources they require. Such centers continuously update server, network, power and other resources to meet demand while offering services for rent.
- Leadership class computing facilities:
-
In the US and also worldwide (top500, 2022) government agencies have worked towards making Leadership Class Computing Facility (LCCF) is available to the research community. Such facilities provide large-scale computing and data resources. In the US, they are funded by DOE, NSF, and other agencies. While the first exascale computer was delivered at ORNL (top500, 2022) other systems will become online over the next three years. Together the LCCF will comprise an ecosystem for very large-scale computing in support of promoting progress in science.” They are expected to deliver a significant boost in the capable computing power, addressing some of the grand challenges. As such systems are complex and researchers desire ease of access, a service model provides one way of accessing them.
- Representational state transfer (REST):
-
is a software architectural style in support of the design and design and development of services exposed to the World Wide Web. REST defines a set of constraints for how the services behave while focusing on scalability of interactions between components, uniform interfaces, independent deployment of components, and the creation of a layered architecture to facilitate caching components to reduce user-perceived latency, enforce security, and encapsulate legacy systems (REST, 2004).
- Microservices:
-
are an architecture style “to describe a particular way of designing software applications as suites of independently deployable services. While there is no precise definition of this architectural style, there are certain common characteristics around organization around business capability, automated deployment, intelligence in the endpoints, and decentralized control of languages and data. (www-microservices)”
- Analytics as a service:
-
provides access to subscription-based data analytics software through the cloud. Analytics services may include the sophisticated combination of services internally used to provide customized offerings to the users. The range of resource requirements, including the time needed to obtain an answer, could vary widely. For long-running analytics efforts, asynchronous services may be offered, allowing to pick up the result of an analytics task at a later time.
- Data analytics as a service:
-
With increased data demands, it is important to integrate the data storage needs to access data needed by an analytics service. In the case of significant data needs, moving the data to a new service is often impractical. Hence the analytics is often conducted as part of add-on services running close to the data. This is often referred to as "bringing the calculation to the data.”
- Machine and deep learning:
-
. Machine learning enables analysis of data by “learning” from the data. Deep learning [DL] is a subdiscipline of machine learning. DL introduces sophisticated toolkits and frameworks which use multi-layered neural networks that enable non-linear transformations on the data. The network is first trained on a subset of data aka input data; and then new data can be fed to the trained model, to obtain an output such as a prediction. DL models require extensive data and extensive training to be accurate. Another challenge is finding a good model and good hyper parameters to address a particular problem.
3. Use Cases for Analytics Services
Our work is motivated by a number of use cases. The use cases were contributed by community members who are experts in their fields.
The use cases include security; numerical weather prediction; Heating, Ventilation, and Air Conditioning (HVAC) optimization; and earthquake prediction.
Each use case includes a high-level explanation about the problem they address and explicitly comments on requirements needed for an analytics service targeting the individual use case. We summarize the major requirements for all use cases in Table 1
| Attributes | HVAC | Security | Earthquake | Requirements |
|---|---|---|---|---|
| Compute | ||||
| Cloud | ✓ | ✓ | ✓ | ✓ |
| Hybrid | ✓ | ✓ | ✓ | ✓ |
| Multi-Cloud | ✓ | ✓ | ✓ | ✓ |
| Sensors | ✓ | ✓ | ✓ | ✓ |
| LCCF | * | – | ✓ | ✓ |
| Microservices | * | ✓ | * | ✓ |
| Vendor neutral | ✓ | ✓ | ✓ | ✓ |
| REST | ✓ | ✓ | ✓ | ✓ |
| Workflow | ||||
| Catalog | ✓ | ✓ | ✓ | ✓ |
| Cooperation | ✓ | ✓ | ✓ | ✓ |
| Competition | * | ✓ | ✓ | ✓ |
| Orchestrator | * | ✓ | ✓ | ✓ |
| Calculation | ||||
| Modeling | ✓ | ✓ | ✓ | ✓ |
| Calculation | ✓ | ✓ | ✓ | ✓ |
| Deep Learning | ✓ | ✓ | ✓ | ✓ |
| Visualization | ✓ | ✓ | ✓ | ✓ |
| Security | ||||
| Communication | ✓ | ✓ | – | ✓ |
| Data | ✓ | ✓ | – | ✓ |
| Access | ✓ | ✓ | ✓ | ✓ |
| Usage policies | ✓ | ✓ | – | ✓ |
| * = Future | ||||
3.1. Use Case: HVAC Recommendation
Background.
Heating, ventilation and air conditioning (HVAC) systems control air temperatures inside residential, commercial, and industrial buildings. Desired room temperatures can be predetermined/fixed by a technician, or regulated at any time by the user, through the use of a local thermostat, where the user chooses temperature setpoints. This manner of HVAC control only considered user preference inputs at the moment the thermostat is programmed. Modern thermostats are capable of applying machine learning to leverage historical data on user preferences, and existing periodic variances in energy and electricity prices. To improve the HVAC system efficiency over time, introduction of other criterion and inputs into temperature setpoint decision making can reduce costs for consumers and in a scenario involving a million systems, present a potential for electricity service providers to better account for fluctuating consumer demand; and balance load. Here we are also including weather forecasts to the list of external inputs or integrating weather research forecast WRF and we develop an algorithm that can calculate the optimal schedule of HVAC control.
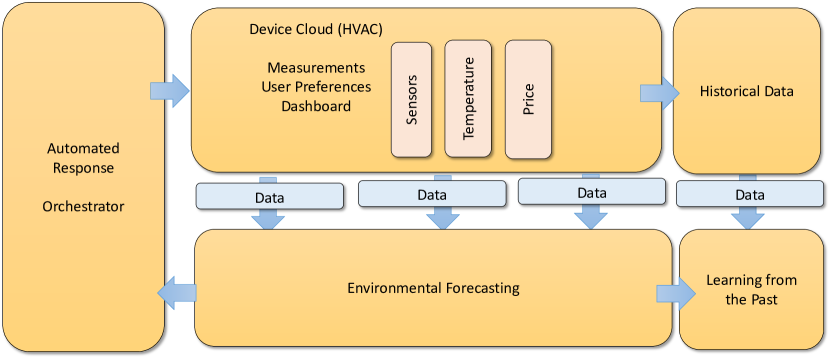
The algorithm deployment is on the cloud as a service, and every time it makes a new setpoint decision, the command is sent to the local thermostat (see Figure 2). Various service frequencies were used to establish the proper pipeline for this application use case. This work aims to analyze the scalability and adaptability of such service scenarios and identify best practices that promote reusable implementations to support aspects of similar use cases addressed by them.
System model.
User comfort level is defined as the allowed temperature range in the house, the range can remain constant during the entire 24-hour cycle, or it can vary based on the time of the day or the day of the week. Since the temperature in the house is affected by the outdoor temperature our goal is to keep the internal temperature within the desired user comfort level. Energy prices fluctuate throughout the day, driven by market dynamics. We describe the pricing function as a sequence of values where corresponds to the price at time slot . At each time slot, the service provider determines the electricity price and charges the customer at the given rate. We determine the user cost based on the price and energy consumption during the time slot. At time , we observe the set of all variables of the system which includes information about the outdoor temperature, the indoor temperature, and the pricing. Based on all this information, the algorithm makes a dynamic decision to set the HVAC set point. This represents the HVAC state in the next time interval . After executing the HVAC setpoint action, we observe the system during time step . These steps are executed in periodic intervals, as presented in Figure 2 and the setpoint recommendation process requires an advanced machine learning algorithm (e.g, reinforcement learning) (Kotevska et al., 2020).
We organized this functionality into three parts: Data input (DI), Functionality parts (FP), and RL agent (RLA). DI collects the data needed for the calculation, such as the following:
-
•
Temperature – Collects current weather temperature.
-
•
Price – Collects current electricity price.
-
•
Historical data – Extract needed data fields and packs it into an intermediate file format. Input data from the output of temperature and price.
FP prepares the inputs for RLA, they are the following:
-
•
Learning from the past – Learns from previous user and system activities.
-
•
Environment forecasting – Incorporates future price and temperature forecasting for timestamp .
-
•
Reward – Generates reward based on the current temperature, price, and user input.
-
•
User preferences – Creates rules based on user temperature preferences.
RLA model estimates the next set-point using the inputs from FP, such as:
-
•
RL agent – Interpolates the output from DI, FP, reward, and user preferences and generates action recommendations for the temperature.
Figure 2 shows the general modeling system flow chart.
Reward is a function of temperature violation and cost. This function is specific to the algorithm that was used in this case reinforcement learning (RL). If the temperature is above the desired setpoint and energy cost is high the reward is negative. While if the temperature is within the setpoint range and the energy price is low the reward is positive. This allows the RL-based method to learn the optimal behavior through continuous interaction with a building environment and without referring to any prior model knowledge.
The results are presented on the home device interface and historic results are presented on the dashboard using the cloud-as-a-service option.
This setup is a general setup that is applicable to one-zone models. Results have shown that RL model has high generalization and adaptability to unseen environments, which indicates its practicability for real-world implementation (Du et al., 2021). The same functionality can be used with different building models and retail price models (Du et al., 2021).
This use case has the implicit requirements needing the following aspects to be addressed by the framework we develop.
-
1.
AS vendor neutral cloud and computer service integration.
-
1.1
AS in cloud. The Analytics Services are on the cloud, and the user has Vendor Neural Access Interface to monitor the current and past behavior. The users can also manage their preferred HVAC behavior using the provided interface by the command line.
-
1.2
AS in LCCF. This feature does not apply to the current use case. However, an extension could be addressing larger scales of the application while integrating analysis on a much larger scale.
-
1.3
AS in microservices. This feature does not apply to this use case. We anticipate that future services may use microservices in order to increase portability.
-
1.1
-
2.
AS architecture.
-
2.1
AS vendor neutral interfaces. The user has access to two interfaces: a) a web-based dashboard to monitor the current and past HVAC status changes and indoor temperature; b) an HVAC-embedded home interface where the user can check and change the desired indoor temperature.
-
2.2
AS REST. The HVAC home interface accepts user preferences and sends them to the cloud using REST services.
-
2.3
AS layers such as interface, service layer, and provider layer. The vendor uses Privacy Cloud for the calculations and data storage, Analytics Services for decision-making analysis, Cooperation Service for external data inputs, and command line for the user to send requests and make any service adjustments.
-
2.1
-
3.
AS workflow.
-
3.1
AS catalog and registry. For this use case, the catalog of services only supports a few operations they are i) temperature set-point adjustment based on outdoor temperature, price, user schedule, and preferences; ii) historical overview; iii) receiving user input for set-point adjustment.
-
3.2
AS cooperation. The cooperation is with external services used for decision-making analysis (e.g., weather forecast, utility energy price).
-
3.3
Competition. This feature does not apply to this use case. In the future alternative analysis algorithms could be integrated that allow collaborative results but also competition.
-
3.4
AS orchestrator. This feature does not apply to this use case. However, an extension could be envisioned that allows the execution of the analysis on different geographically distributed resources to circumvent outages of the center due to unforeseen challenges, such as extreme weather events or power outages.
-
3.1
-
4.
AS calculation.
-
4.1
AS with DL. In this case is used DL ( e.g., reinforcement learning (RL)) for the decision-making analysis.
-
4.2
AS data analytics. In this use case, data analytics provides visualization and statistics for the past behavior and decision-making recommendations for HVAC setpoint settings.
-
4.1
-
5.
AS security. The data transfer to and from the cloud is over a secure protocol.
3.2. Use Case: Continuous Monitoring for Enterprise Security
Background.
Most modern-day big corporations have a hybrid multi-cloud architecture with points of presence on-premise and multiple cloud vendors. Secure-by-design is a key architectural consideration for these enterprises as a safeguard against organized cybercrime activities such as ransomware and sensitive data exfiltration. Continuous monitoring is one of the key elements for secure-by-design whereby critical assets and network communication are continuously monitored for signs of suspicious behavior and any threats identified are responded to in an automated way.
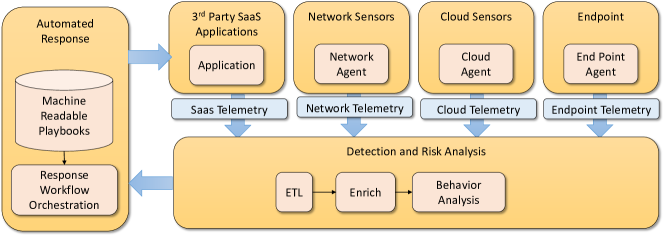
Figure 3 shows a simplified version of a typical Continuous Monitoring Pipeline which usually consists of distributed services for the following functions:
-
1.
Telemetry Collection. Telemetry is typically collected from an endpoint, network, cloud, and 3rd-party Software as a Service (SaaS) applications by endpoint, network, and cloud agents, firewalls, Web Application Firewall (WAF), email security, and vulnerability scanners. Telemetry usually consists of operating system (OS) and application audit logs, vulnerability scan results, software Bill Of Materials (SBOMs), east-west and north-south network packets and flow logs, cloud policies etc.
-
2.
Detection and Risk Analysis. The Detection and Risk Analysis pipeline comprises extract, transform, and load (ETL) for data normalization, enrichment on normalized data by correlating with threat intel from inhouse and 3rd party services, and asset profiling and behavioural analysis for misbehaviour detection which is done using rule-based and machine-learning-based approaches.
-
3.
Automated Response. Automated Response consists of security response playbooks and workflows for alerting, breach containment, mitigation, remediation and asset recovery.
This use case has the implicit requirements needing the following aspects to be addressed by the framework we develop.
-
1.
AS vendor-neutral cloud and computer service integration.
-
1.1
AS in cloud. The Analytics Service for this use case is typically hybrid with points of presence on-premise where analytics modules can run on the sensors and on cloud. On-premise sensors can have support for local storage and running light-weight ETL and machine learning inference, whereas cloud can have more heavy-weight compute and machine learning model training and inference support.
-
1.2
AS in LCCF. This feature does not apply to the current use case.
-
1.3
AS in microservices. Microservices approach is highly applicable to the design of continuous monitoring pipeline where each of the subfunctions for telemetry collection, ETL, enrichment, analytics and automated response can consist of several microservices that could either be developed in-house or leverage 3rd party SaaS.
-
1.1
-
2.
AS architecture.
-
2.1
AS vendor neutral interfaces. Vendor-neutral interfaces would be ideal for different functions of the Continuous Monitoring Pipeline. However, at this time there are no standardized interfaces for technologies related to continuous monitoring. Each vendor typically has its own proprietary set of interfaces and data models and it is up to the consumer of the data to normalize that data.
-
2.2
AS REST. REST is typically used for human and M2M interfaces at different levels in the Continuous Monitoring pipeline. On-premise and cloud agents for telemetry collection support both data push and pull via REST interface. Data Enrichment services can be in-house and 3rd party SaaS which typically have REST interfaces for pulling reference datasets. Analytics and Automated Response pipelines typically have REST interfaces for pipeline configuration and adding or updating content.
-
2.3
AS layers such as interface, service layer, and provider layer. Interface layer is required for data access for experimentation and usecase development, for configuring and adding new functions and content to telemetry collection, analytics, and response functions. The service layer is required to register in-house and 3rd party microservices to support the continuous monitoring pipeline and to register analytics workflows. Provider layer is required to schedule services and workflows on-premise and on cloud.
-
2.1
-
3.
AS workflow.
-
3.1
AS catalog and registry. Continuous Monitoring will comprise several microservices for telemetry collection, ETL, enrichment, analytics, and automated response. These services can be in-house or 3rd party SaaS services running remotely and accessible via APIs. The catalog and registry functionality will be required to catalog and register these services and have required configuration for service setup and service access.
-
3.2
AS cooperation. There can be intra and inter-function collaboration between the services that are part of the Continuous Monitoring Pipeline. For instance, endpoint, network and cloud agents belong to the telemetry collection function and can have intra-function collaboration where they can cooperate with one another on what telemetry to collect on the fly based on contextual and situational awareness. There is also inter-function collaboration for instance between automated response pipeline and endpoint, network and cloud agents for breach containment, mitigation and asset recovery.
-
3.3
AS competition. There can also be competing services and rules can be defined on how to orchestrate between these competing services. For instance, for instance, the Continuous Monitoring Pipeline can have multiple 3rd party and in-house services for threat intelligence enrichment and rulesets can be defined on how to orchestrate between these services to streamline cost, speed, and resources.
-
3.4
AS orchestrator. API-based workflow definition and orchestration capabilities are required for the Continuous Monitoring Pipeline to orchestrate cooperating functions and cooperating and competing microservices that are part of those functions.
-
3.1
-
4.
AS calculation.
-
4.1
AS with DL. Deep Learning is leveraged in the analytics stack for behavior profiling and misbehavior detection and knowledge graph analysis (e.g., graph neural networks and neuro symbolic analysis).
-
4.2
AS data analytics. Data analytics is leveraged for data visualization and model quality and drift detection, and visualizing and report generation on security outcomes and alerts.
-
4.1
-
5.
AS security. AS Security is required for securing data at rest and during transit, for securely storing service access credentials, and for enforcing resource access and usage policies.
3.3. Use Case: Earthquake Prediction Benchmarks
Earthquake prediction of their occurrence and likely-hood is a complex problem. It is difficult because the details of the underground plates and the friction laws between them are not known and furthermore, the earthquake causes phase transitions between plates which makes for unpredictable movement in addition to predicting earthquake energy wave movements. Since both of these problems are so complex with many hidden variables and the equations governing the phenomenon is unknown or incomplete, deep learning can be use to learn the various hidden patterns in the data which the model can then use to forecast earthquakes into the future. The application of models and hyper-parameter sets is an open challenge requiring a large amount of computational power and the investigation of several promising models.
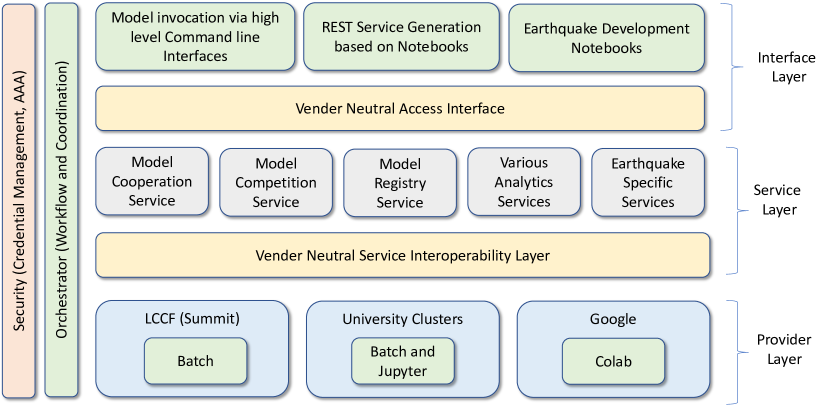
As part of this effort a benchmark activity has been started within the MLCommons Science working Group (von Laszewski et al., 2023c). The usecase deriving from this effort motivates our efforts. Figure 4 shows the architecture of our current efforts which can be generalized to be applicable to many scientific analysis problems.
This use case has the implicit requirements needing the following aspects to be addressed by the framework we develop.
-
1.
AS vendor-neutral cloud and computer service integration.
-
1.1
AS in cloud. The analysis of this use case requires a significant amount of computing time as well as specialized hardware such as the utilization of GPUs. It is beneficial that the analytics services developed can run on hybrid clouds to leverage best availability and cost. Development can be supported by on-premise resources.
-
1.2
AS in LCCF. The availability of large HPC resources if of advantage as the calculation and hardware needs for this problem exceed those of a desktop and can benefit from running many of the models in parallel to select the best once producing a minimal scientific accuracy measurement.
-
1.3
AS in microservices. Although microservices can be used in this effort it has not been much applied due to the greater need of accessing HPC resources.
-
1.1
-
2.
AS architecture.
-
2.1
AS vendor neutral interfaces. Vendor-neutral interfaces are beneficial as it would allow analytics services to be integrated in a plug-in fashion.
-
2.2
AS REST. REST services would be beneficial as the highly specialized analytics services and resources can be accessed through language and implementation-neutral interfaces. This would allow the access of services by non-experts, but also the integration of services that are developed by communities.
-
2.3
AS layers such as interface, service layer, and provider layer. As The interface layers provide the necessary abstractions to benefit from efforts across implementers specializing in various layers such as scientists, interface designers, cloud providers, and HPC providers.
-
2.1
-
3.
AS workflow.
-
3.1
AS catalog and registry. It is beneficial to register the various models and their inputs and outputs as well as performance needs and results. This way components can be chosen based on the implicit analytics performance characteristics. For example, the model of an earthquake near a volcano could be very different from a model close to the movement of a tectonic plate.
-
3.2
AS cooperation. The need of cooperating services and models can enhance the accuracy of the resulting new model calculation.
-
3.3
AS competition. The integration of models found in the future and a dynamic reanalysis of the analytics functions performed earlier in case a better model is found.
-
3.4
AS orchestrator. API-based workflow definition and orchestration capabilities are required for coordinating the complex environments and analytics functions.
-
3.1
-
4.
AS calculation.
-
4.1
AS with DL. Deep Learning is leveraged due to the complexity of the problem and the inaccessibility of details of the earth mantle.
-
4.2
AS data analytics. Data analytics is leveraged for generating the forecasts on a spatial and time-dependent level.
-
4.1
-
5.
AS security. AS Security is used to control access to the various resources. As the research is carried out in an Open Source community other security issues are of little concern.
-
6.
Data needs The data needs can become very large if real-time sensors are integrated. However, smaller data sets are available and are currently used by this application to analyze Earthquakes in California from 1950 till today.
4. Architecture
To support the usecases we briefly described and analyzed their requirements, we have developed a general architecture that can benefit most analytics services while leveraging and integrating hybrid and multi-cloud analytics services.
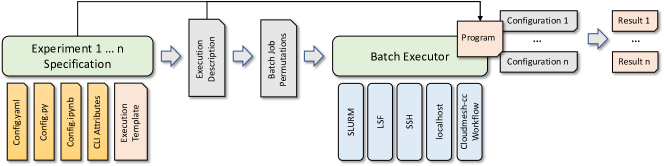
To support our goal to enable the use of hybrid and multi-cloud analytics services, we are exploring architectural patterns that are conducive to use cases such as the one we outlined previously. These patterns are of general use as they can be applied to other use cases. In our case, we define an architecture as depicted in Figure 5.
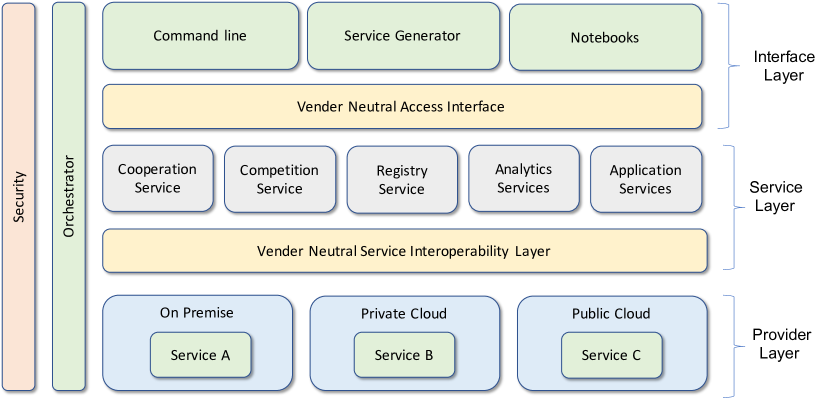
The architecture is organized in layers and contains multiple components in each layer. We distinguish the interface, service, and provider layer. Security and an orchestration service enable the integration of the various components into a coordinated application pipeline.
4.1. Interface Layer
Today’s analytics is invoked through a multitude of interfaces, making it possible to invoke them in different languages, but also high-level frameworks. This is often achieved by an interface layer using REST to communicate with the other layers. For our work, we focus on the command line interface promoting reuse in shells, Jupyter notebooks showcasing the reuse in an interactive analysis capable framework, and our previous work to generate REST services (see Section 4.2.1).
4.1.1. Command Line Interface
To provide reusability within the DevOps application of data analytics pipelines, we provide an enhanced command-line interface that specifically targets hybrid and multi-analytics environments. This is facilitated by adding command options, shell variables, and configuration files that can be passed into the commands. Most importantly, we analyze which specific parameters we need to make available when investigating cooperative and competitive services. The parameters can be directly translated to REST service invocations.
4.1.2. Interactive Notebooks
Although it is important to provide a command-line interface that can easily be used to generate computing activities for solving data analytics tasks, it is even more critical that the framework can be integrated into interactive steering tasks conducted directly by the data scientists. For this, we leverage Jupyter notebooks and integrate service calls to the backend system into the notebooks just as we can in regular Python programs. The difference here is that Jupyter provides a rich set of interactive components and widgets that can be leveraged to prototype interactive services but also parameter studies. While our previous work has been integrated into notebooks, the capabilities of notebooks were not yet fully utilized as the integration was done on the service level but not on a level where Jupyter was used to enhance the service pipeline.
4.2. Service Layer
4.2.1. Generalized Analytics Services
While we have focused previously on the automated generation of services using REST, we need to consider the other aspects of this architecture that are needed to support the data analyst. We have shown that it is possible to create rest services from Python functions and classes while augmenting them with helper services such as data uploads. The development of such services is out of the capability of many data scientists as they focus on developing transformative data analysis functions and not on the infrastructure service generation. Our work is lowering the bar for such implementation and allowing even data analysts to generate reusable REST services (von Laszewski et al., 2021). The effort to learn how to create vendor-independent and computer language-independent services has been reduced from months to days. We can leverage this effort to generate application-specific services quickly. The services generated are integrated into a user-managed service registry. We leverage this service and enabled its exposure via REST through FastAPI as part of the generator.
4.2.2. Hybrid Multi-Analytics Service Registry
While we have previously developed a simplified generalized service registry, we are exploring significant extensions to integrate (a) container images, (b) container services, and (c) analytics services offered by service providers. This registry is specially designed to support cooperating and competing for analytics services. We intend to add the ability to leverage existing repositories, such as GitHub and DockerHub to register suitable analytics services as source code. We will then also add features to provide endpoints to instantiated services so they can be advertised to a large group of users. A neutral vendor specification is used as part of the registry. Such a registry can be hosted by a user or an organization. We will identify if it is possible to leverage GitHub for hosting such a registry. This will require a special set of tools and programs to keep the registry up to date. A user can then integrate such a registry into their analytics pipeline. New analytics service specifications can then be either integrated through direct specifications added to the hosted registry or through the use of GitHub submodules. Using submodules offers the ability to keep up to date with analytics services developed by others and allows updates through automated DevOps-controlled pull requests. This registry technology would completely replace our earlier registry work if successful. It would also allow the integration of private services as private analytics services can be integrated while using private submodules hosted in private repositories. Hence, the details of such modules are not exposed. As GitHub also supports GraphQL we will explore using GraphQL as a mechanism for the specification of Registry entries. To increase privacy, git can also be hosted on-premise.
4.3. Application Services
An application may require the availability of very specific application-oriented analytics services. Our architecture allows us to integrate them while reusing the same vendor-neutral specification format. This includes not only cloud services but also the integration of analytics services that rely on on-premise infrastructure. An example would be access to a supercomputer in the TOP500 list that is used to conduct a complex data analytics task reusing GPUs to conduct deep learning for COVID-19 analysis. This results in two specifications. A general specification that can be reused on other similar on-premise computers, and a second that is specifically targeted to the targeted on-premise infrastructure. This could include the integration of hosted data services or specific network capabilities.
4.4. Analytics Services
Data analysts are developing analytics functions on a regular basis. As we can use our service generator to transform them into analytics services, we will be able to create and register them into our registry. We will expand upon our available services but focus on services that explicitly address multi-cloud and hybrid service use cases.
A good example may be natural language processing to analyze a text with either a local service, a loud hosted service by different vendors. Here, based on input parameters, we create an overarching language analytics service that chooses the various services with the the help of service level requirements and agreements.
4.5. Cooperation and Competition Services
As previously indicated, we already have identified two special use cases of data analytics services that leverage hybrid and multi-analytics services. This is the specification of services that employ:
Cooperation.
Cooperating services are services that use one or more services from hybrid multi-analytics services. They are cooperating together to address the solution to a formidable data analytics problem. Thus the resources form a "team" of services that work together. This includes the integration of specialized services that may not be unique to a particular provider. Still, it also could mean that computational analytics processes could be performed in parallel, and results could be gathered to accelerate the analytics task. A parameter study is a very good example of one kind of cooperating services
Competition.
Here, the available hybrid multi-analytics services directly compete with each other. This can be done by direct selection of services that are more suitable than others. This selection could be based on resource requirements such as time, availability, cost, and features. However, the framework could take "observations" and propose automated conclusions about which services to choose from. A possibility would even be to integrate deep-learning strategies into the selection process.
4.6. Provider Layer
An integral part of the proposal is identifying how we can leverage services from multiple providers, including on-premise services. We have shown in our previous work that we can specify vendor-neutral specifications to access, for example, virtual machines. We will expand this concept while using the concept of containers. However, we also need to identify services that are offered by multiple vendors, such as language processing services. Although they can be directly accessed via vendor-specific interfaces. It will be important to identify if they can be generalized so the users can benefit from a uniform vendor-neutral service interoperability layer. We will identify a usability example to explore the possibilities of this approach.
4.7. Crosscutting Services
We have two crosscutting services. One is the orchestrator that allows the specification of service pipelines to combine the various services that are needed for application implementation. The other is a security service that will enable us to access the various services through the required authentication and authorization mechanisms. The latter we have demonstrated in cloudmesh where users can manage their own access to a multi-cloud environment ta access their activated analytics services. We will leverage from that effort but also leverage from open-source solutions that can be embedded in our vendor-neutral service specification, such as basic and OAUTH security. In general, we abstract the security calls to be callouts to the appropriate authentication mechanisms.
4.8. Security
Analytics services have a variety of security needs. This includes authentication, authorization and audit (Section 4.8.1). Data and use may also need to be secured and privacy concerns need to be addressed (Section 4.8.2).
4.8.1. Authentication, Authorization and Audit (AAA)
Authentication and Authorization functions would be needed across the Analytics Service Framework to authenticate and authorize human-to-machine (H2M) and machine-to-machine (M2M) communication between the interface layer and the service layer and between the service layer and the provider layer.
Communication to the services in the Service Layer would be via RESTful APIs. For authenticating to services in the Service Layer, Single-Sign on (SSO) using token-based access control schemes like OAuth, SAML, or Kerberos will be used. Most Web Service frameworks support these SSO mechanisms out-of-the-box. Once the client is authenticated, authorization checks are done to ensure the client is authorized for the requested CRUD operation on the REST resource.
Authentication and authorization for machine-to-machine (M2M) access between the service layer and Private and Public Cloud in the provider layer will be done using Cloud’s Role-based Access Control (RBAC) and Attribute-based Access Control (ABAC) functions and Identity and Access Management (IAM) policies. Service accounts are provisioned in the cloud environment for service clients, and these service accounts are given appropriate roles based on the Principles of Least Privilege (PoLP).
Client actions such as access to resources, changes to configuration, and changes to roles and access policies should be continuously monitored and audited. Most web service frameworks have basic audit and logging functions that can create audit trails on files, databases, or remote logging services. Audit on cloud providers can be done by enabling cloud audit trails and cloud alerts.
4.8.2. Privacy
The Analytics Service Framework will have appropriate controls in place to ensure data privacy. The framework will support encryption of data at rest and in transit, both intra-layer and inter-layer, to safeguard against unwanted access to data. Any data that is copied over for processing purposes by the framework will be deleted once the processing is done. The framework will also allow administrators to delete inactive users and service accounts and revoke accesses. Sensitive attributes in the data will be masked from users and services based on roles and policies. The framework will also audit and log any access to data which can then be monitored in a Security Incident Event Management System (SIEM) for unwanted or abnormal access.
There are some other privacy controls that the broader ecosystem should have which would be out of the scope for the Analytics Service Framework because they don’t belong there. Some of these include having a data inventory to map data storage, classification of all data and governance processes in place to ensure data literacy and manage data lifecycle within an organization.
4.8.3. Federation
As some services in the analytics framework may be distributed across a variety of services owned by different providers it is beneficial to allow the integration of a service federation. NIST has spearheaded an extensive document (Lee et al., 2020) addressing such federation that could be leveraged and federated services could be developed based on is.
5. Implementation
5.1. Defining and Finding Reusable Analytics Services
Defining and Finding Reusable Analytics Services is an important aspect of the usability of services. To ensure findability we need a Service catalog and a service registry.
5.1.1. Analytics Service Catalogue
Motivation.
Cloud providers offer a considerable set of analytics services to their customers. There are many analytics services available, and a user needs to be able to quickly obtain an overview of such available services. This helps identify further actions to evaluate them and identify if further investigation is justified. The catalog contains enough details to locate the service and evaluate its usefulness. However, it may not provide technical details captured by a service registry instead.
Access Requirements.
The catalog may be public or may be restricted while authorized entities may access it. As analytics services may evolve. Hence, time-dependent versioned descriptions of the services must be able to be included. An organizational entity may manage its own catalogs. It is desirable to have the catalogs be uniform so that they can be combined into a larger catalog combining entries of multiple organizations.
Federation.
The offerings are typically limited to a particular vendor. Users can benefit from a federated service catalog to search and explore for needed services by the user. In contrast to a registry, a catalog may not include all technical details but could, in contrast, include services that lack such details and thus can be the basis of an exploratory process. A Federated analytics service repository is could be hosted on GitHub. The catalog contains the following attributes, many of which are also used in an analytics service registry.
The catalog is organized as a list of entries, where each entry contains a number of attributes. These attributes may be required or optional. We list in Table 2 in the column Catalog.
5.1.2. Analytics Service Registry
Motivation.
The goal of a federated analytics service registry is to establish federated registries to locate and consume analytics services with persistent identifiers across organizations.
A service registry can serve as a public, private, or federated registry. The first two properties define whether the registry is public or private. In the case of a private registry, proper security measures need to be taken into account to govern access. Our framework does not make any recommendations about the security framework chosen and it is up to the implementer to specify it. In the case of a federated registry, more than one registry can be joined, to provide the user the impression of a single registry.
Within the analytics services, we distinguish two classes. The first class are instantiated (running) services that are offered by a service provider and allow direct reuse. The second class are library providers that distribute analytics activity not as an instantiated service, but as a source code library which can be deployed as a service.
A simple use case can be formulated as follows. A user wants to find an analytics service and needs to identify candidate services based on their descriptions and features. A user wants to find services quickly and therefore expects modern keyword search and taxonomy, faceted search, query functionalities; as well as descriptions that facilitate location and identification of relevant and appropriate analytics services, from the registry.
The registry contains enough details to not only locate the service, but also how to use it.
Access Requirements.
Public Analytics Service Registry. Public analytics discovery services are intended to allow users to find publicly hosted services. The information provided includes the provider, [x], and [y], and / thus reduces users’ efforts in locating relevant services.
- Levels of Assurance (LoA) in User Identity.:
-
Most readers should be familiar with functionality to sign in with ORCHID, or Facebook or something known to the user. In general identity management scenarios, this provision enables what is referred to as guest identities, which is useful for many users who are interested in invoking low-level activities or less sensitive operations. With respect to federated service authentication and authorization, OIDC guest identities meet a low level of assurance. In contrast, users with higher LoAs are afforded permissions to perform to privileged activities or gain access to more sensitive xyz.
- Multi factor Authentication in User Identity.:
-
A means for authenticating users via two or more types of authentication. An MFA instrument can elevate a user’s level of assurance profile. RAF and IGTF are examples of such assurance framework standards. OpenID Connect, SAML, and X.509 are examples of services that expose interfaces for multiple authentication.
- Private Analytics Service Registry.:
-
Analytics Services stored in private registries are only available to authenticated and authorized / member users. Private registries allow providers to build virtual organizations [/ VOMS] that advertise specialized services to its user community. In contrast to a public analytics registry, access controls in private registries are more restricted. In addition, different group privileges may restrict the visible analytics service to the user (see related sections on user identity and levels of user privilege).
- Federated Analytics Service Registry.:
-
A user wants to make selection decisions regarding which service to use. Analytics service brokers and providers therefore offer a federated analytics service in which multiple services from multiple providers are included. Rather than having to visit multiple, separate providers’ registries, the user can visit the federated registry of the analytics broker to look up all potentially suitable services, via a single interface and browser. It may be expected that federated registries abstract the technical effort that casual users would experience during location and inspection of published analytics services. Underlying analytics service registry technologies leverage cross-organization persistent identifiers, enhanced with information that the original service provider may not have available, and xyz. such "enrichment" may could include, for example, cost comparisons, or (some type of) ratings from its user community.
- Enhanced Analytics Service Registry.:
-
Both public and private registries may need to be enhanced by providing detailed information so the user has a better understanding of the offering and allows comparison to similar artifacts maintained and published in the registry. Information details may include, for example, benchmark information, service level agreements, or cost measures such as carbon cost, or technical limitations such as storage access and availability for big data.
Registry Namespace.
To allow uniform integration of entries into a unified namespace, URLs are used to distinguish the services. This includes two different entities. Firstly, an entity that defines the code base of a service. Such a code base could be for example hosted on publicly accessible code repositories. Secondly, the namespace could include instantiated analytics service endpoints that define a running instance of an analytics service.
The attributes are listed in Table 2. Some attributes may be optional and may be dependent on whether they are deployed services, or contain a library that may be deployed.
| Catalog provider | Service provider | Library provider | ||
| Name | Description | Register | ||
| ID | UUID, globally unique | + | + | + |
| Name | Name of the service | + | + | + |
| Title | Human readable title | + | + | + |
| Public | True if Public (needs use case to delineate what pub private means) | + | + | + |
| Description | Human readable short Description of the Service | + | + | + |
| Endpoint | The endpoint of the service | + | + | - |
| List of Input Parameters | A list of parameters to the service. The parameters have each the form of name, function, type, value, and access. The type indicates the data type. The access indicates if the parameter is a data stream, database, single value/function, or event. The function responds to a different function in case multiple are provided by the service. | o | + | + |
| List of Output Parameters style (event, stream, data) value timestamp | List of responses cast by the service. The responses have the form of function, name, type, value, access, and timestamp. The type indicates the data type. The access indicates if the parameter is a data stream, database, single value/function, or event. The function responds to a different function in case multiple are provided by the service. | o | + | + |
| Version | The version number or tag of the service | + | + | + |
| License | The license description | + | + | + |
| Protocol | Example: REST | + | + | + |
| Microservice | True if microservices used | + | + | + |
| Modified | Modification Timestamp | + | + | + |
| Owner | Name of the distributing entity, organization or individual. It could be a vendor. | + | + | o |
| Author | Contact details of the people or organization responsible for the service | + | o | + |
| Tags | Human readable common tags that are used to identify the service that are associated with the service | + | o | o |
| Categories | A category that this service belongs to (NLB, Finance, …) | + | o | o |
| Created | date and time on which the analytics service was instantiated or created instantiated | + | + | + |
| Heartbeat | State and timestamp of the last check when the service was active | - | o | - |
| Documentation | Link to a URL with a detailed description of the service Source Link to the source code if available | + | o | o |
| Specification/Schema | Pointer to where specification schema is located | o | + | + |
| AdditionalMetadata | Pointer to where additional is located including the one here. | o | o | o |
| SLA | Serves level agreement including cost | o | o | o |
| CachingInterval | If a service is accessed a lot, the caching interval can be used to put a limitation on the Response with an LRU cache | + | o | - |
| DataIntegration | In case of big data the data cannot be provided as a parameter to the analysis function. Instead, we need to provide the data as endpoint. However, often tata may need to be uploaded or can be downloaded. In this case this field provides the upload and download endpoints and the protocol to access the data | o | o | o |
| Authors | contact details of the people or organization responsible for the service (freeform string) | + | + | + |
| += required; o= optional, -= not applicable | ||||
Benefits of a federated analytics service registry
A service registry can publicize and improve end-user access to data from different sources, by overcoming some of the challenges inherent in describing and surfacing document content and format. Publication, and discovery of information resources are enriched with metadata enabling the findability and reusability of a service supporting the FAIR principle. While describing the interfaces and allowing for the instantiation or the reuse of already instantiated services we address the accessibility and interoperability. With respect to analytics as a service, end users should be able to find various analytic services and similar services without having to individually search multiple locations or databases, each built to operate on its own, unique storage and retrieval constructs. Through these descriptions automated service integration can be provisioned while targeting not only the functionality involved, but also allowing service level considerations to be addressed. Furthermore, such analytics services could provide significant security implications such as the protection of a database while only exposing a subset of approved analytics functions that are executed on the data sets. This includes partial and controlled sharing of data mashups that can be made available to the community and registered to make reuse easier without everyone having to replicate the service.
5.2. Service Federation
This section discusses aspect of federated registries to locate and consume analytics services with persistent identifiers across organizations.
This is not the term is at this time in the document not properly used.
We use so far
(1) federation of catalog and registry (2) federation of services stored in the registry and catalog (3) federaion of services through high level services delegatiing to other services.
5.2.1. Analytics Service Pipelines
Motivation.
In many cases a big data analysis is split up in multiple subtasks. These subtasks may be reusable in other analytics pipelines. Hence it is desirable to be able to specify and use them in a coordinated fashion allowing reuse of the logic represented by the analysis. Users must have a clear understanding on what the analysis is doing and how it can be invoked and integrated.
Access Requirements.
The analysis must include a clear and easy to understand specification that encourages reuse and provides sufficient details about its functionality, data dependency and performance. Analytics services may have authentication, autorotation and access controls build in that enable access buy users controlled by the service providers.
5.2.2. Workflow Controlled Computing
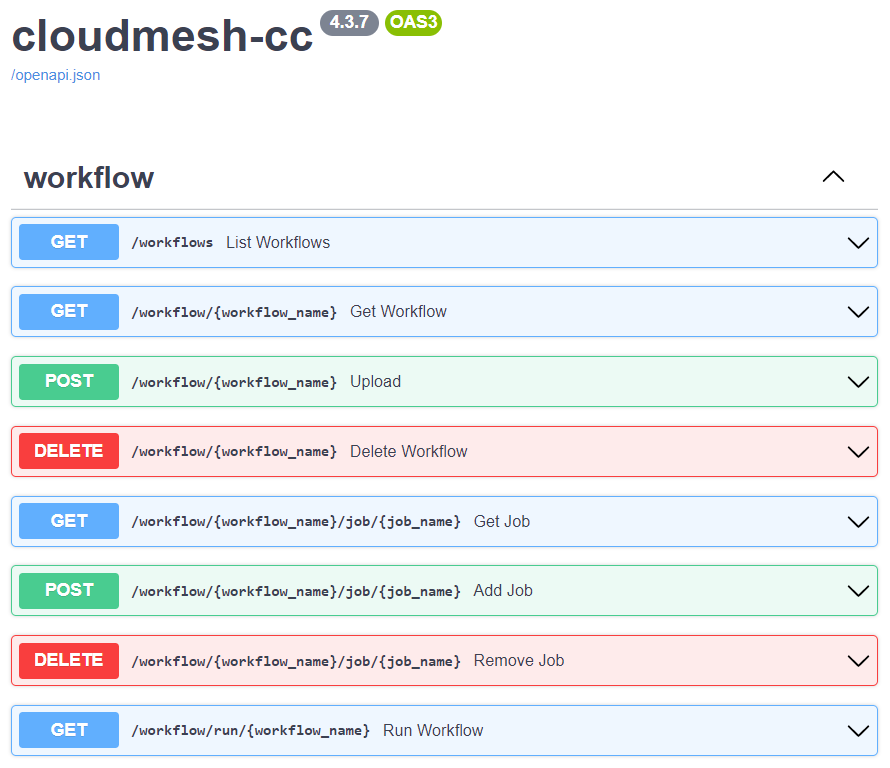
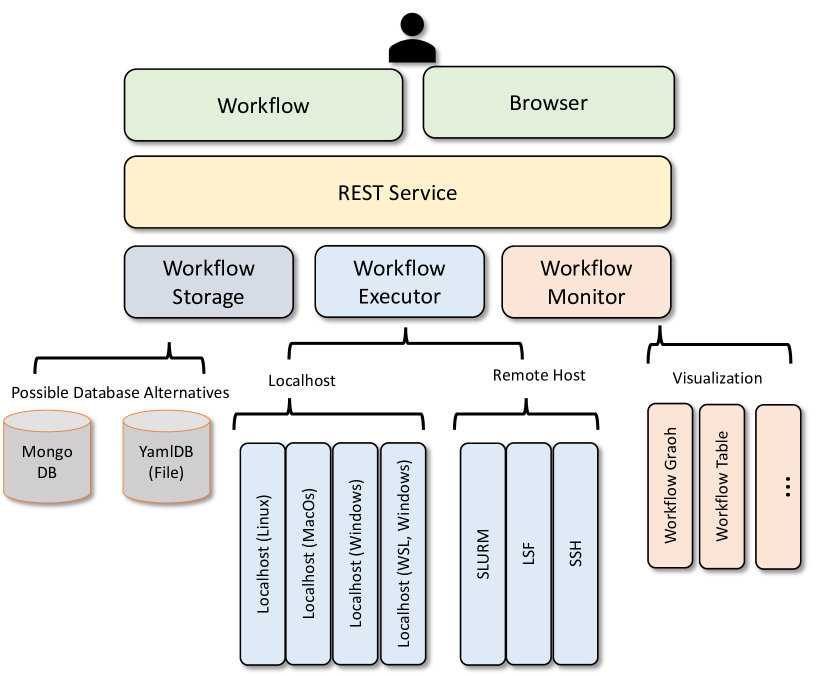
High-performance computing (HPC) is for decades a very important tool for science. Scientific tasks can leverage the processing power of a supercomputer so they can run at previously unobtainable high speeds or utilize specialized hardware for acceleration that otherwise are not available to the user. HPC can be used for analytic programs that leverage machine learning applied to large data sets to, for example, predict future values or to model current states. For such high-complexity projects, there are often multiple complex programs that may be running repeatedly in either competition or cooperation. This may include resources in the same or different data centers. We developed a hybrid multi-cloud analytics service framework that was created to manage heterogeneous and remote workflows, queues, and jobs. It can be used through a Python API, the command line, and a REST service. It is supported on multiple operating systems like macOS, Linux, and Windows 10 and 11. The workflow is specified via an easy-to-define YAML file. Specifically, we have developed a library called Cloudmesh Controlled Computing (cloudmesh-cc) that adds workflow features to control the execution of jobs on remote compute resources, while at the same time leveraging capabilities provided by the local compute environments to directly interface with graphical visualizations better suited for the desktop. The goal is to provide numerous workflows that in cooperation enhances the experience of the analytics tasks. This includes a REST service and command line tools to interact with it.
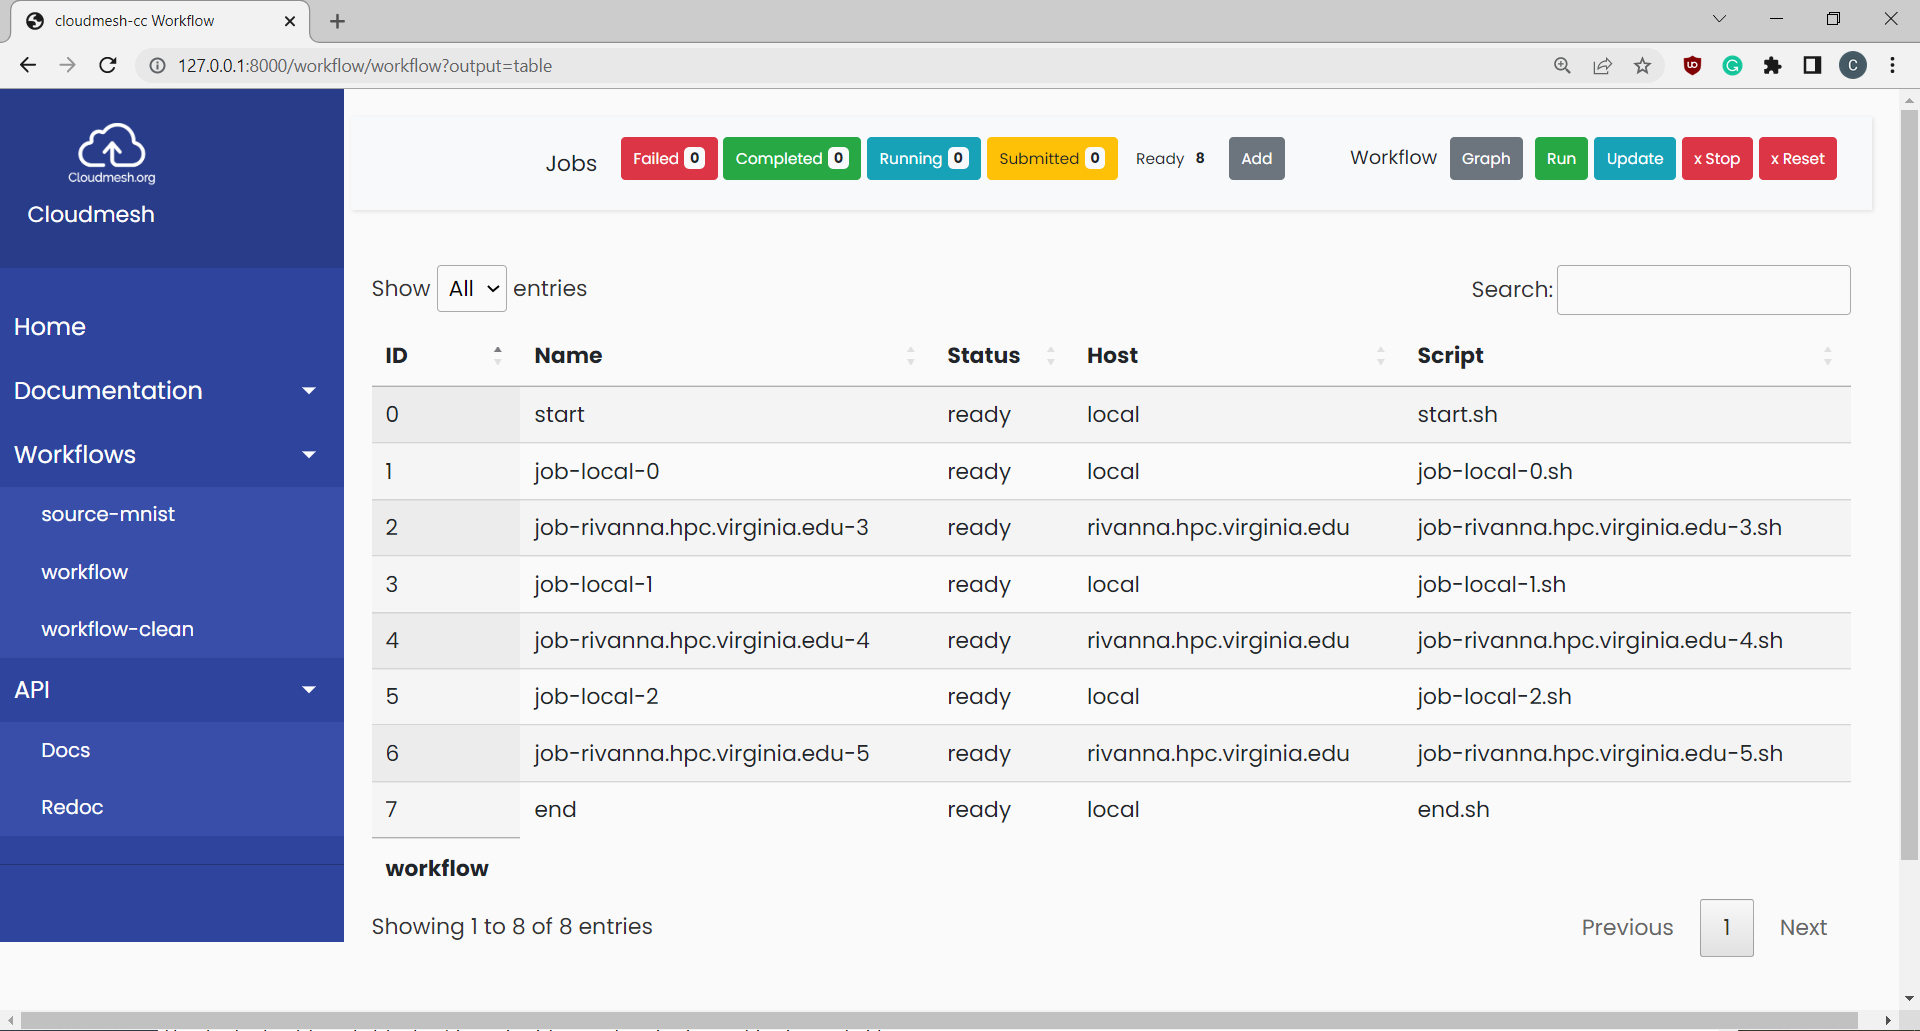
We have tested the framework while running various MNIST application examples, including include Multilayer Perceptron, LSTM (Long short-term memory), Auto-Encoder, Convolutional, and Recurrent Neural Networks, Distributed Training, and PyTorch training. A much larger application using earthquake prediction has also been used.
5.3. Data Management
As data is to be integrated and analyzed as well as produced the framework must include a sufficiently broad ability to access data from a wide variety of sources and utilize many different services. This includes files, object stores, and databases. To address the access of file-based data we have integrated into cloudmesh components to deal with transfers and copies from remote resources, as well as developed a component that deals with many file transfers through Globus. The later overcomes restrictions due to file numbers and improves transfer speed, and access speed.
Managing data in analytics services is an important implicit requirement. The data has to be readily accessible and may have to be pre-staged to the resources where the computation is performed. Also one has to make sure that policy restrictions are appropriately dealt with in order to perform the analytics tasks. The policy restrictions typically include the total size of the data for a particular user or group but also could include the number of files.
For this reason, it is advantageous to have a service that can deal with such restrictions. Unfortunately, such services are not readily available based on our experience with different HPC centers offering compute resources for analytics tasks and jobs.
Available services are typically restricted to filesystems that are accessible on the compute nodes as well as services that copy between local computers or between compute centers. The later is frequently covered by ‘rsync‘ over SSH or UDP, or through Globus (www, 2022) as a service. However, when we tried using Globus we found that it is not usable when millions of files are involved, but performs well when in such cases a tar file is produced over many files and the tar file is transfered in a single operation. We also encountered frequent timeouts on the servers that were involved in a server-server transfer using many file transfers.
To simplify this we developed a program cloudmesh-globus (cloudmesh, 2022) that allows us to specify an entire directory with many files that first automatically package the directory and transfers the compressed file to the remote machine where it then gets uncompressed and placed in the appropriate file system. Hence such steps have not to be done by hand by the researcher, but are done automated providing a simplified filesystem-to-filesystem service via Globus without issues.
Other alternatives could include cloudmesh-storage (von Laszewski, 2023b) which include prototype transfer services even among cloud providers such as amazon, azure, and Google, while leveraging a compute services conducting file copies between the involved parties.
5.4. Package Analytic Algorithms as Service Payloads
It is important to package analytic algorithms with well-defined input and output parameters as service payloads that can be reusable, deployable, and operational across multi-cores, CPUs, and GPU computing platforms. In addition, it is possible to package analytics services on several different levels. This includes containers, binary packages, source code, as well as the distribution of analytics functions that can be send between services.
6. Application
Next, we list some elementary application examples that identify the usefulness of this framework.
6.1. Analytics Parameter Study Experiments
One of the important aspects of analytics as a service is the ability to integrate long-running analytics tasks either on the current computer, remote computers, or batch queuing systems from HPC tasks. These tasks can be executed directly on the host system but can simplify access for the user by placing them behind REST services. This is a common compute pattern as part of parameter studies that explore a variety of parameters producing analytics results that can then be explored either in collaboration or competition.
For this purpose, we use two services. First, the Cloudmesh Compute Coordinator, that coordinates computational tasks onto hybrid heterogeneous resources, and second, the Cloudmesh Experiment Executor, that coordinates how to execute various parameter settings to achieve the desired results with these analytics settings.
Together these services allow the following.
-
1.
Provisioning one or multiple compute nodes on which the parameter experiment is conducted.
-
2.
Create hyperparameters for the analytics calculation suitable for the compute resources.
-
3.
Prepare the compute resources with the needed data and programs to conduct the analytics functions. This can be done by copying the source to the nodes or using a GitHub repository to obtain the source.
-
4.
Configuring the system’s software to prepare for a benchmark run by installing or compiling the code in a way that is best suited for the resource).
-
5.
Executing the analytics function and capturing the results
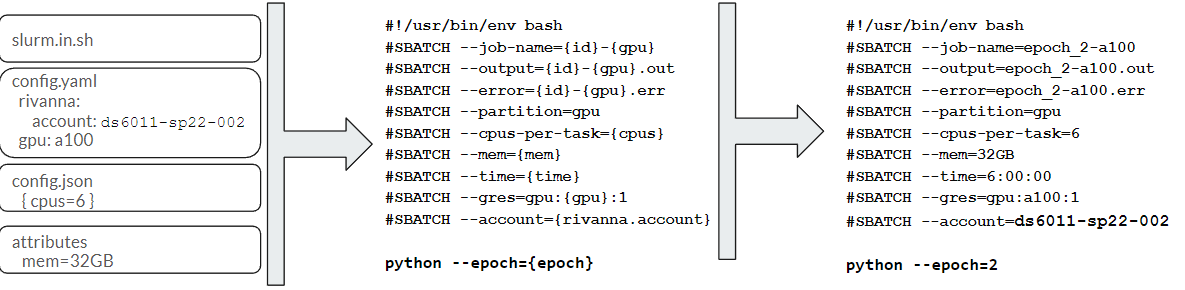
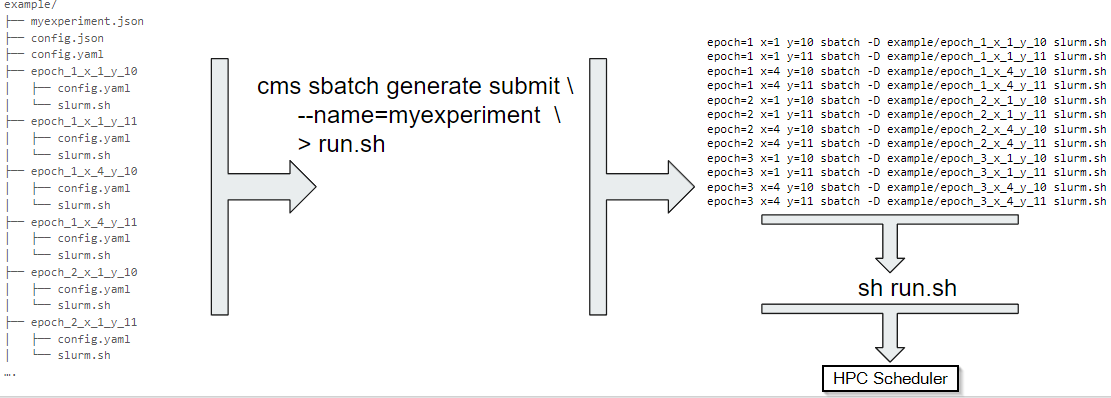
This logic is captured as part of the analytics parameter experiment management and is implemented using the Cloudmesh Experiment Executor (cloudmesh-ee) utility specifically targeting execution pattern (von Laszewski, 2023a; von Laszewski et al., 2023b, c). This utility provides the ability to specify configurable parameters that perform one-to-one substitutions and a special experiments parameter set, which creates a permutation for all parameter values as distinct experiments.
This allows the user to provide a single script with a configuration file containing multiple hyperparameter values and have them expand into hundreds of configurations without having to prepare each configuration manually. A typical workflow of development is illustrated in Figure 12 and Figure 12.
6.2. NLP
Natural Language Processing is one of the first services offered by many cloud providers. This is motivated by analyzing large amounts of text in volume and number and deriving automated content from it. Popular services include keyword extraction, sentiment analysis, auto summary, and translation. The services are offered often by large cloud providers such as Google, IBM Watson, and Amazon to consumers for a fee. In addition, such tools are also offered as stand-alone components and software packages.
As many such services are offered by the different providers, and standalone components and software packages exist, it allows us to use them to test the framework for implementing hybrid and multi-cloud analytics services. We can therefore analyze each of their APIs and compare functionality as well as the performance characteristics of local as well as cloudservices. We also can test our design of the cloud service catalog to identify the strategy of dynamically locating similar services and integrating them into a service offering.
For our work, we have restricted our analysis to two cloud services from Amazon and Google, while the integration of a third from Amazon is under development. Furthermore, we have only considered the translation service as it provides an easy abstraction of a service that translates a text from a source language to a target language:
def translate(text, source_langauge, target_langauage, ...): ... return translation
Each of the services is implemented with a different API. We contrast the API in Figure … showcasing the difference in invoking a translation service as well as showcasing the result of the JSON response of such a service.
If the interface is on purpose defined differently a switch will cost extra work and may therefore not be in the interest of the users. It is obvious that users can benefit from a uniform implementation of this API in order to easily switch from one provider to the other. Naturally, the cloud providers typically do not have any interest in providing such a uniform API as it may entice the customers to switch service providers.
Hence a multicloud CLI implementation may look as follows, where the provider flag is used to distinguish the different cloud providers offering the translation service. Naturally, we could also utilize a local translation programs such as offered by industry and easily make this example is a hybrid service that also integrates with a local implementation.
cms nlp translate --provider=google --from=en --to=de hello worldcms nlp translate --provider=aws --from=en --to=de hello worldcms nlp translate --provider=local --from=en --to=de hello world
As each of the services returns natively a different output, it is beneficial to unify the output and create a mapping from the originating service to the output. An example of such a uniform output is given next.
{’date’: ’05/02/2022 14:45:45’, ’input’: ’hello world’, ’input_language’: ’en’, ’output’: ’Hallo Welt’, ’output_language’: ’de’, ’provider’: ’aws’, ’time’: 0.2641}
Other parameters such as service region can easily be integrated in this example. Furthermore, it is obvious that the commandline application underlying API can be used in a REST service implementation and can be generalized into different REST service frameworks. For our implementation, we have used FastAPI and used the closest regional service center to our location.
The result of the translation that simply translates a text from German “Hallo Welt” to English “Hello World” is showcased for 100 invocations in Figure 13.
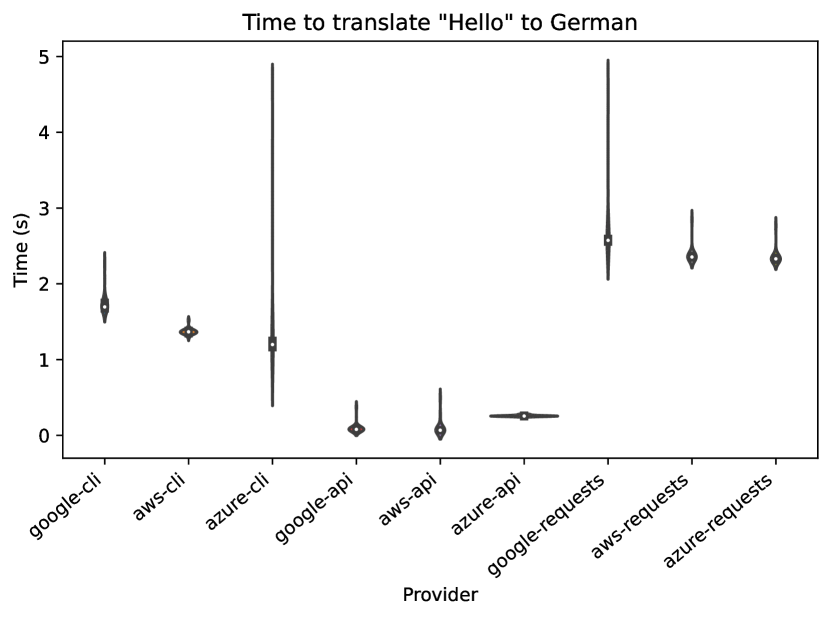
Such a performance analysis could be performed based on customer needs and could indicate factors for preferential service choices. This may include besides time other factors such as cost and quality, or even service level reliability at different times.
For us, we found that for the short query, we used the service offered by AWS to translate the text was on average faster when executed from Bloomington, IN to the closest service centers for the provider.
| google-cli | aws-cli | azure-cli | google-api | aws-api | azure-api | google-requests | aws-requests | azure-requests | |
|---|---|---|---|---|---|---|---|---|---|
| count | 20.000000 | 20.000000 | 20.000000 | 20.000000 | 20.000000 | 20.000000 | 20.000000 | 20.000000 | 20.000000 |
| mean | 1.737850 | 1.369900 | 1.365600 | 0.094800 | 0.099300 | 0.257150 | 2.681500 | 2.381500 | 2.352550 |
| std | 0.134381 | 0.043240 | 0.664569 | 0.066135 | 0.104365 | 0.009292 | 0.429593 | 0.111200 | 0.100339 |
| min | 1.643000 | 1.297000 | 1.120000 | 0.069000 | 0.064000 | 0.245000 | 2.532000 | 2.330000 | 2.299000 |
| 25% | 1.675250 | 1.346750 | 1.162750 | 0.075000 | 0.066750 | 0.251000 | 2.556750 | 2.349250 | 2.316500 |
| 50% | 1.695000 | 1.366500 | 1.198500 | 0.079000 | 0.067500 | 0.255000 | 2.574000 | 2.354000 | 2.329500 |
| 75% | 1.749000 | 1.378750 | 1.246750 | 0.085750 | 0.069250 | 0.259500 | 2.592750 | 2.367750 | 2.341500 |
| max | 2.266000 | 1.520000 | 4.170000 | 0.374000 | 0.497000 | 0.280000 | 4.481000 | 2.848000 | 2.766000 |
6.3. Earthquake Result
While using this framework we have conducted a parameter study for earthquake forecasting. Figure 14(a) and 14 show the results of this application. A more in depth paper about this application has been published in (von Laszewski et al., 2023c), (von Laszewski et al., 2023b) and (von Laszewski et al., 2023a).
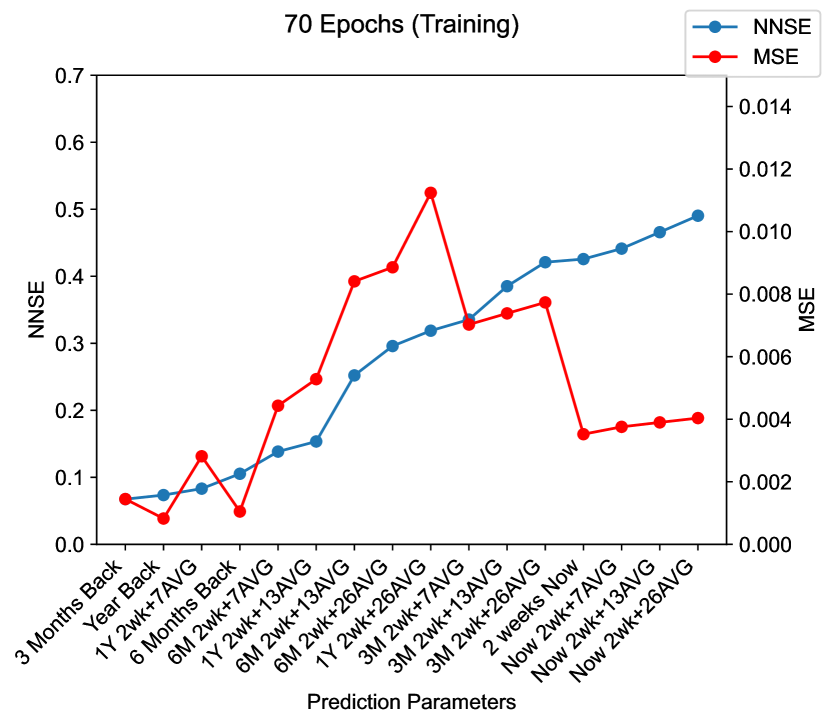
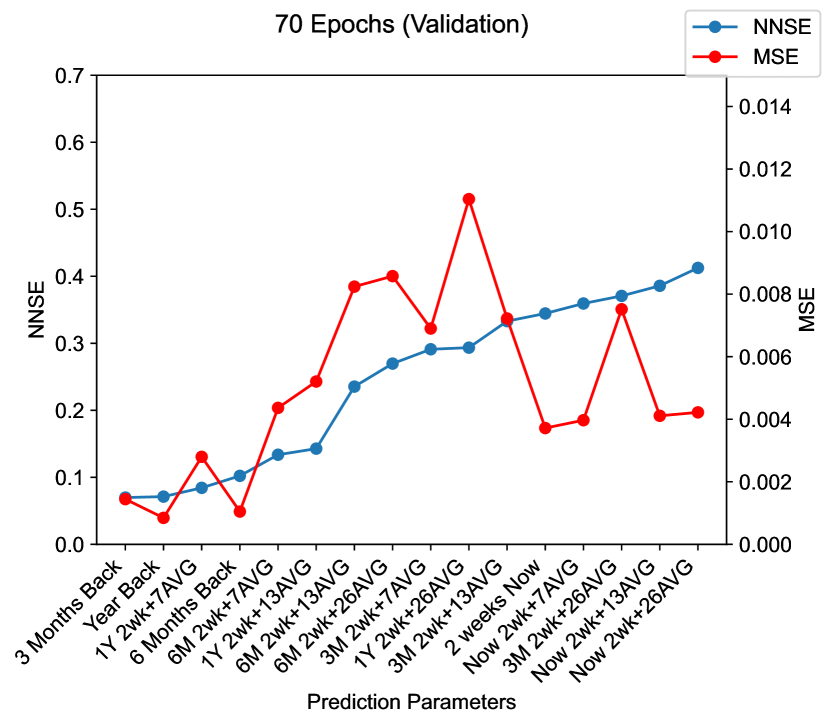
7. Conclusion
In this paper, we have outlined our thoughts on building an analytics services framework. We have integrated aspects to make these services hybrid services across various compute providers including HPC, clouds, and microservices.
In addition to this exploratory thought, a component-based prototype implementation leveraging cloudmesh has been used to verify the feasibility of the approach. It has then been tested theoretically on some applications, while it also has been practically explored in the area of natural language processing and earthquake forecasting.
Furthermore, the framework has been used intensely as part of the MLCommons Science Working group where it was used for additional application.
Acknowledgement
Work was in part funded by NIST 60NANB21D151T the NSF 1829704 and 2200409. The work was also funded by the Department of Energy under the grant Award No. DE-SC0023452. The work was conducted at the Biocomplexity Institute and Initiative at the University of Virginia.
This manuscript has been co-authored by UT-Battelle, LLC under Contract No. DE-AC05-00OR22725 with the U.S. Department of Energy. The publisher, by accepting the article for publication, acknowledges that the U.S. Government retains a non-exclusive, paid up, irrevocable, world-wide license to publish or reproduce the published form of the manuscript, or allow others to do so, for U.S. Government purposes. The DOE will provide public access to these results in accordance with the DOE Public Access Plan (http://energy.gov/downloads/doe-public-access-plan).
References
- (1)
- www (2022) 2022. Data Transfer With Globus. https://www.globus.org/data-transfer [Online; accessed 9. Dec. 2022].
- Chang (2015a) Wo L Chang. 2015a. NIST Big Data Interoperability Framework: Volume 1, Definitions. Technical Report. https://nvlpubs.nist.gov/nistpubs/SpecialPublications/NIST.SP.1500-1.pdf
- Chang (2015b) Wo L Chang. 2015b. NIST Big Data Interoperability Framework: Volume 2, Big Data Taxonomies. Technical Report. https://nvlpubs.nist.gov/nistpubs/SpecialPublications/NIST.SP.1500-2.pdf
- Chang (2015c) Wo L Chang. 2015c. NIST Big Data Interoperability Framework: Volume 3, Use Cases and General Requirements. Technical Report. https://nvlpubs.nist.gov/nistpubs/SpecialPublications/NIST.SP.1500-3.pdf
- Chang (2015d) Wo L Chang. 2015d. NIST Big Data Interoperability Framework: Volume 4, Security and Privacy. Technical Report. https://nvlpubs.nist.gov/nistpubs/SpecialPublications/NIST.SP.1500-4.pdf
- Chang (2015e) Wo L Chang. 2015e. NIST Big Data Interoperability Framework: Volume 5, Architectures White Paper Survey. Technical Report. https://nvlpubs.nist.gov/nistpubs/SpecialPublications/NIST.SP.1500-5.pdf
- Chang (2015f) Wo L Chang. 2015f. NIST Big Data Interoperability Framework: Volume 6, Reference Architecture. Technical Report. https://nvlpubs.nist.gov/nistpubs/SpecialPublications/NIST.SP.1500-6.pdf
- Chang (2015g) Wo L Chang. 2015g. NIST Big Data Interoperability Framework: Volume 7, Standards Roadmap. Technical Report. https://nvlpubs.nist.gov/nistpubs/SpecialPublications/NIST.SP.1500-7.pdf
- Chang (2019) Wo L Chang. 2019. NIST Big Data Interoperability Framework: Volume 9: Modernization and Adoption. Technical Report. https://nvlpubs.nist.gov/nistpubs/SpecialPublications/NIST.SP.1500-10r1.pdf
- cloudmesh (2022) cloudmesh. 2022. cloudmesh-globus. https://github.com/cloudmesh/cloudmesh-globus [Online; accessed 9. Dec. 2022].
- Du et al. (2021) Yan Du, Helia Zandi, Olivera Kotevska, Kuldeep Kurte, Jeffery Munk, Kadir Amasyali, Evan Mckee, and Fangxing Li. 2021. Intelligent multi-zone residential HVAC control strategy based on deep reinforcement learning. Applied Energy 281 (2021), 116117.
- John Rydning (2021) John Rydning. 2021. Worldwide Global DataSphere and Global StorageSphere Structured and Unstructured Data Forecast, 2021-2025. https://www.idc.com/getdoc.jsp?containerId=US47998321 IDC.
- Kotevska et al. (2020) Olivera Kotevska, Kuldeep Kurte, Jeffrey Munk, Travis Johnston, Evan Mckee, Kalyan Perumalla, and Helia Zandi. 2020. Rl-hems: Reinforcement learning based home energy management system for hvac energy optimization. Technical Report. Oak Ridge National Lab.(ORNL), Oak Ridge, TN (United States).
- Lee et al. (2020) Craig A Lee, Robert B Bohn, and Martial Michel. 2020. The NIST Cloud Federation Reference Architecture. Technical Report. https://doi.org/10.6028/nist.sp.500-332
- REST (2004) REST 2004. Representational state transfer. https://en.wikipedia.org/w/index.php?title=Representational_state_transfer&oldid=1090380967
- top500 (2022) top500 2022. TOP500. https://www.top500.org
- von Laszewski (2023a) Gregor von Laszewski. 2023a. cloudmesh-ee. https://github.com/cloudmesh/cloudmesh-ee [Online; accessed 8. Sep. 2023].
- von Laszewski (2023b) Gregor von Laszewski. 2023b. cloudmesh-storage. https://github.com/cloudmesh/cloudmesh-storage [Online; accessed 8. Sep. 2023].
- von Laszewski and Chang (2019) Gregor von Laszewski and Wo L Chang. 2019. NIST Big Data Interoperability Framework: Volume 8, Reference Architecture Interface. Technical Report. https://nvlpubs.nist.gov/nistpubs/SpecialPublications/NIST.SP.1500-9r1.pdf
- von Laszewski et al. (2023a) Gregor von Laszewski, J.P. Fleischer, and Geoffrey C. Fox. 2023a. Hybrid Reusable Computational Analytics Workflow Management with Cloudmesh Applied to the MLCommons Cloudmask Application. https://arxiv.org/pdf/2210.16941.pdf 12 pages.
- von Laszewski et al. (2023b) Gregor von Laszewski, J.P. Fleischer, Geoffrey C. Fox, Juri Papay, Sam Jackson, and Jeyan Thiyagalingam. 2023b. Templated Hybrid Reusable Computational Analytics Workflow Management with Cloudmesh, Applied to the Deep Learning MLCommons Cloudmask Application. In eScience’23. Second Workshop on Reproducible Workflows, Data, and Security (ReWorDS 2022), Limassol, Cyprus. https://github.com/cyberaide/paper-cloudmesh-cc-ieee-5-pages/raw/main/vonLaszewski-cloudmesh-cc.pdf
- von Laszewski et al. (2023c) Gregor von Laszewski, J.P. Fleischer, R. Knuuti, G.C. Fox, J. Kolessar, T.S. Butler, and J. Fox. 2023c. Opportunities for enhancing MLCommons efforts while leveraging insights from educational MLCommons earthquake benchmarks efforts. Frontiers in High Performance Computing, 1, 1233877 (Oct. 2023), 31. https://doi.org/10.3389/fhpcp.2023.1233877
- von Laszewski et al. (2021) Gregor von Laszewski, Anthony Orlowski, Richard H. Otten, Reilly Markowitz, Sunny Gandh, Adam Chai, Geoffrey C. Fox, and Wo L. Chang. 2021. Using GAS for Speedy Generation of HybridMulti-Cloud Auto Generated AI Services. In IEEE COMPSAC 2021: Intelligent and Resilient Computing for a Collaborative World45th Anniversary Conference. IEEE, All Virtual. https://ieeecompsac.computer.org/2021/
- Wilkinson et al. (2016) Mark D. Wilkinson, Michel Dumontier, IJsbrand Jan Aalbersberg, Gabrielle Appleton, Myles Axton, Arie Baak, Niklas Blomberg, Jan-Willem Boiten, Luiz Bonino da Silva Santos, Philip E. Bourne, Jildau Bouwman, Anthony J. Brookes, Tim Clark, Mercè Crosas, Ingrid Dillo, Olivier Dumon, Scott Edmunds, Chris T. Evelo, Richard Finkers, Alejandra Gonzalez-Beltran, Alasdair J. G. Gray, Paul Groth, Carole Goble, Jeffrey S. Grethe, Jaap Heringa, Peter A. C ’t Hoen, Rob Hooft, Tobias Kuhn, Ruben Kok, Joost Kok, Scott J. Lusher, Maryann E. Martone, Albert Mons, Abel L. Packer, Bengt Persson, Philippe Rocca-Serra, Marco Roos, Rene van Schaik, Susanna-Assunta Sansone, Erik Schultes, Thierry Sengstag, Ted Slater, George Strawn, Morris A. Swertz, Mark Thompson, Johan van der Lei, Erik van Mulligen, Jan Velterop, Andra Waagmeester, Peter Wittenburg, Katherine Wolstencroft, Jun Zhao, and Barend Mons. 2016. The FAIR Guiding Principles for scientific data management and stewardship. Scientific Data 3, 1 (2016), 160018. https://doi.org/10.1038/sdata.2016.18