Illuminating evaporating protostellar outflows: ERIS/SPIFFIER reveals the dissociation and ionization of HH 900††thanks: Based on observations collected at the European Southern Observatory under ESO programmes 110.257T.001 and 0101.C-0391(A).
Abstract
Protostellar jets and outflows are signposts of active star formation. In H ii regions, molecular tracers like CO only reveal embedded portions of the outflow. Outside the natal cloud, outflows are dissociated, ionized, and eventually completely ablated, leaving behind only the high-density jet core. Before this process is complete, there should be a phase where the outflow is partially molecular and partially ionized. In this paper, we capture the HH 900 outflow while this process is in action. New observations from the ERIS/SPIFFIER near-IR integral field unit (IFU) spectrograph using the K-middle filter (=2.06–2.34 µm) reveal emission from the dissociating outflow and Br- tracing its ionized skin. Both lines trace the wide-angle outflow morphology but only extends 5000 au into the H ii region while Br- extends the full length of the outflow (12,650 au), indicating rapid dissociation of the molecules. has higher velocities further from the driving source, consistent with a jet-driven outflow. Diagnostic line ratios indicate that photoexcitation, not just shocks, contributes to the excitation in the outflow. We argue that HH 900 is the first clear example of an evaporating molecular outflow and predict that a large column of neutral material that may be detectable with ALMA accompanies the dissociating molecules. Results from this study will help guide the interpretation of near-IR images of externally irradiated jets and outflows such as those obtained with the James Webb Space Telescope (JWST) in high-mass star-forming regions where these conditions may be common.
keywords:
Herbig-Haro objects – ISM: jets and outflows – photodissociation region (PDR) – Infrared: ISM – stars: formation – stars: protostars1 Introduction
Protostellar jets and outflows are produced by actively accreting young stellar objects (YSOs). Fast, collimated jets launched close to the YSO are often seen at visual wavelengths in hydrogen recombination and forbidden emission lines that are excited in shocks. Molecular emission lines in the millimetre (mm) and infrared (IR) trace outflows that may be launched directly from the circumstellar disk or entrained from the surrounding medium by an underlying jet. Jets and outflows may coexist and which component is more prominent / visible depends on the environment and evolutionary stage of the source (see Bally, 2016, for a recent review).
A few well-studied examples like HH 46/47 have played an important role in understanding the relationship between jets and outflows. HH 46/47 is a parsec-scale bipolar outflow (Stanke et al., 1999). The fast, collimated jet that emerges from an embedded young stellar object (YSO) is well-studied in bright recombination and forbidden lines that trace shock-excited gas in the jet body (e.g., Heathcote et al., 1996; Hartigan et al., 2005; Hartigan et al., 2011; Erkal et al., 2021). On the opposite side of the embedded driving source, a classic molecular outflow propagates into the natal cloud with a wide-angle morphology traced by both the Spitzer Space Telescope (Noriega-Crespo et al., 2004) and the Atacama Large Millimeter Array (ALMA; Arce et al., 2013; Zhang et al., 2016).
Most of our knowledge about jets and outflows comes from sources like HH 46/47 – those located in nearby star-forming regions that are forming primarily or exclusively low-mass stars. In regions with high-mass stars, the observational picture may look quite different. Copious UV photons from the most massive stars illuminate the surrounding cloud, including jets and outflows that emerge into the H ii region. External irradiation renders the entire jet body visible (Bally et al., 2006a; Smith et al., 2010), unlike jets in more quiescent regions where the only material emitting at visual and infrared wavelengths has been heated and excited in shock fronts (e.g., Bally & Reipurth, 2001). This is a distinct advantage for measuring the mass-loss rate (and thus accretion history of the driving source) because it can be determined using the physics of photoionized gas rather than complex, non-linear, and time-dependent shock models (Reipurth et al., 1998; Bally et al., 2006b).
Once jets and outflows emerge into the H ii region, molecules will quickly be dissociated. Traditional molecular outflow tracers, like CO, will only be seen in portions of the flow that remain embedded in the cloud (e.g., Cortes-Rangel et al., 2020). Outside the cloud, the outflow will be dissociated, ionized, and finally, completely ablated, leaving behind only the high-density jet core. Before this process is complete, there should be a phase where the molecular outflow is only partially dissociated with an ionized skin. The idea of an ionized outflow has been proposed for a few sources in the Carina Nebula (HH 666 and HH 900; Smith et al., 2004; Hartigan et al., 2015; Reiter et al., 2015b, a). So far, there have been no unambiguous detections of a molecular outflow that extends into the H ii region.
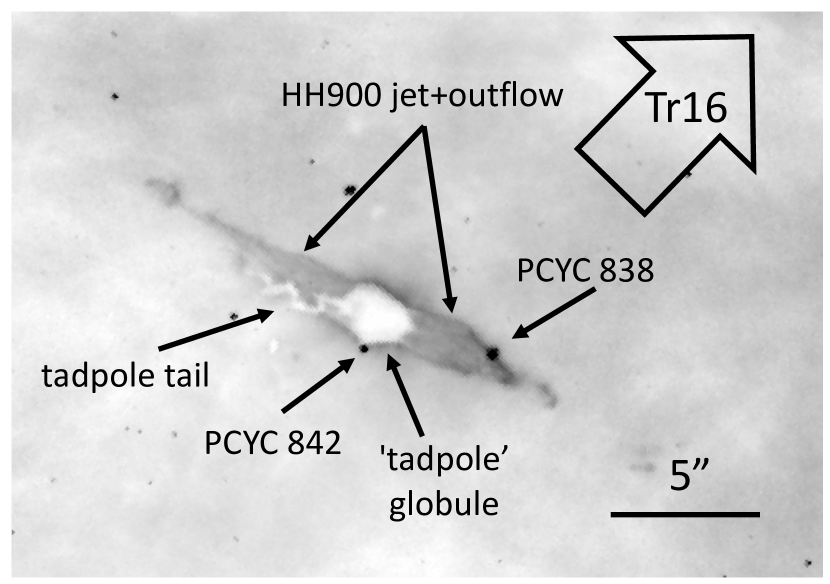
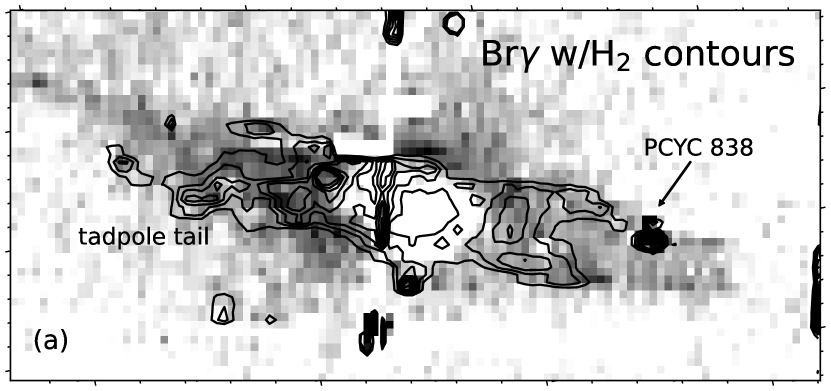
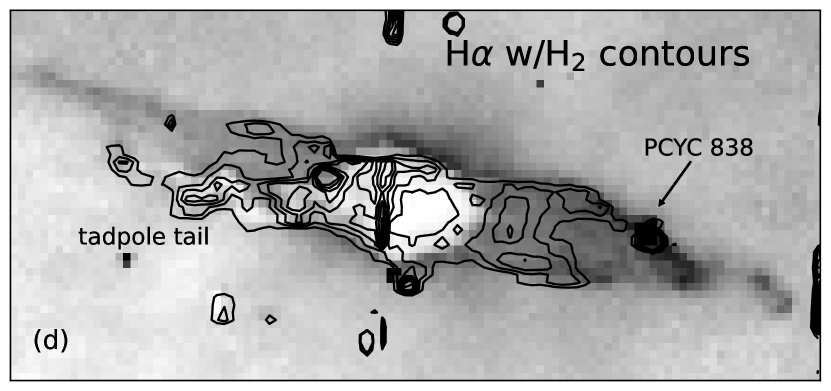
In this paper, we present the first clear case of an evaporating molecular outflow. The HH 900 jet+outflow, emerges from a small, tadpole-shaped globule located in the heart of the Carina Nebula (see Figure 1). Dozens of O- and B-type stars in the nearby Trumpler 16 (Tr16) star cluster illuminate the system and may have triggered its formation (Reiter et al., 2020b). H emission traces a wide-angle bipolar outflow that emerges from the opaque globule (Smith et al., 2010). Unusually for an outflow, the H emission appears to taper as it gets further from the driving source. This is the morphology expected for a jet-driven outflow (see, e.g., Arce et al., 2007), consistent with H tracing the ionized skin of the outflow driven by an underlying jet (seen in [Fe ii]; Reiter et al. 2015a, 2019).
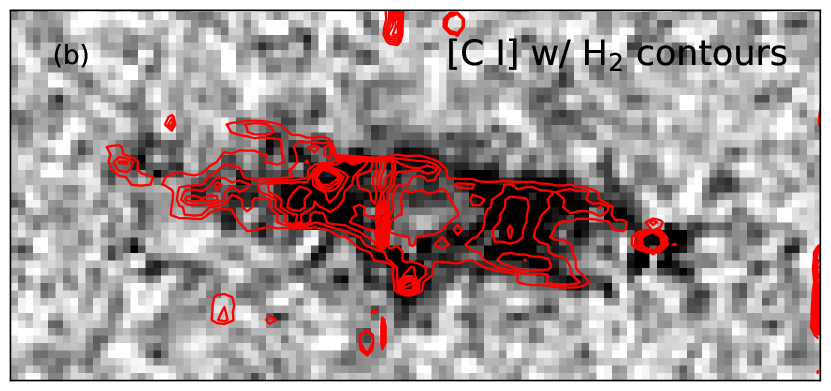
CO observations with ALMA reveal a bipolar molecular outflow that extends only to the edge of the globule where it abruptly ends (Reiter et al., 2020a). In seeing-limited near-IR narrowband images, H2 emission extends from the globule edge along the outflow axis (Hartigan et al., 2015). Optical integral field unit spectroscopy from the Multi-Unit Spectroscopic Explorer (MUSE) revealed extended [C i] emission from the same region as the (Reiter et al., 2019). [C i] is often observed to be coincident with H2 in partially molecular gas (e.g., Escalante et al., 1991), suggesting that the region where both lines are detected traces the transition between the fully molecular and fully ionized portions of the outflow. Together, these observations strongly suggest that HH 900 has a dissociating molecular outflow.
To test this hypothesis, we obtained new near-IR integral field unit spectroscopic observations from the Enhanced Resolution Imager and Spectrograph (ERIS) on the Very Large Telescope (VLT). These high spatial and spectral resolution observations allow us to probe the three key features we expect if HH 900 has a dissociating molecular outflow, namely: (1) the same morphology in molecular () and ionized (Br-) gas; (2) similar kinematics in molecular () and ionized (Br-) gas that are distinct from the fast, collimated jet (Reiter et al., 2015a); and (3) gas that is primarily photoexcited. These data provide comparable angular resolution and spatial coverage to previous observations obtained with the Hubble Space Telescope (HST)/ACS, VLT/MUSE, and ALMA, providing a comprehensive view of the outflow.
2 Observations
2.1 SPIFFIER/ERIS
We observed HH 900 (RA=10:45:19.3, Dec=59:44:23) using the recently-commissioned SPIFFIER near-IR integral field unit spectrograph of the VLT/ERIS instrument (Davies et al., 2018, 2023). SPIFFIER is the refurbished integral field unit spectrograph SPIFFI (SPectrometer for Infrared Faint Field Imaging) that was previously part of the Spectrograph for INtegral Field Observations in the Near Infrared (SINFONI). Data were obtained as part of the ERIS Science Verification 111https://www.eso.org/sci/activities/vltsv/erissv.html for Pr. Id. 110.257T (PI: M. Reiter) on the night of 05 December 2022.
We used the lowest resolution plate scale which provides mas spatial pixels (spaxels) over an field-of-view. Two overlapping pointings capture the entire extent of the HH 900 jet+outflow (excluding distant bow shocks). Observations were obtained in good weather with seeing 0.8″. We also utilized laser guide star (LGS) adaptive optics (AO) correction to further improve the image quality.
We used the high-resolution K-middle filter (=2.06–2.34 m) which covers the H2 line at 2.12 m and Br at 2.16 m simultaneously with spectral resolution R11,200. The corresponding velocity resolution is 25 km s-1.
Data were reduced using a beta version of the ERIS pipeline provided by ESO at the time of the Science Verification run and executed through the ESO Reflex workflow (Freudling et al., 2013). The pipeline corrects the data from the instrumental signatures, i.e. darks and flats, calibrates a wavelength solution using the associated arc lamps, applies a field distortion mapping, computes and substracts the sky contribution, and generates a resampled 3D data cube. This is then used in the following analysis.
The systemic velocity of HH 900 was measured by Reiter et al. (2020a) who found km s-1. For the coordinates of Carina, km s-1 (Kiminki & Smith, 2018). Using this, we compute a heliocentric velocity of km s-1 for HH 900. All velocities in this paper are reported relative to the heliocentric velocity of HH 900.
2.2 Archival data
To align the ERIS/SPIFFIER data with the archival images, we use header astrometry for preliminary registration, then apply additional linear offsets to align the point sources near the globule and outflow. The spatially-resolved globule and tadpole tail provide a second check for data with few point sources (i.e. from ALMA). Data were additionally rotated and shifted to minimize subtraction residuals. Typical alignment uncertainties are on the order of a pixel (0.15″).
2.2.1 HST H and [Fe ii]
A narrowband H image was obtained with the F658N filter on the Advanced Camera for Surveys (ACS) on 04 August 2014 (programme GO-13390, PI: N. Smith). The narrowband [Fe ii] 1.64 µm (F164N) and offline continuum (F167N) images were obtained with the infrared channel of the Wide-Field Camera 3 (WFC3-IR) on 28 December 2013 (programme GO-13391, PI: N. Smith). Details of these data and their reduction are presented in Reiter et al. (2015a).
2.2.2 MUSE
The HH 900 system was observed with the Multi-Unit Spectroscopic Explorer (MUSE) integral field unit spectrograph on the VLT 03 April 2018 (programme ID 0101.C-0391(A); PI: M. Reiter). These observations utilised the GALACSI Adaptive Optics module in Wide Field Mode (WFM) to provide 0.8″ angular resolution over the 1′ 1′ field-of-view. MUSE provides spectral coverage from 4650–9300Å with a gap between 5800–5950Å for the laser guide stars with spectral resolution . Details of those observations may be found in Reiter et al. (2019).
2.2.3 ALMA
ALMA Band 6 observations of the HH 900 system were obtained on 08 May 2017 and 25 September 2017 using medium and long baseline configurations (programme ID 2016.1.01537.S, PI: A. Guzmán). The maximum angular resolution is 0.02″, comparable to the resolution of H images from HST. CO lines were observed with a velocity resolution of 0.08 km s-1. Anaylsis and details may be found in Reiter et al. (2020a).
3 Results
| Line | wavelength |
|---|---|
| [µm] | |
| 1-0 S(1) | 2.12183 |
| Br- | 2.16612 |
| 1-0 S(0) | 2.22329 |
| 2-1 S(1) | 2.24772 |
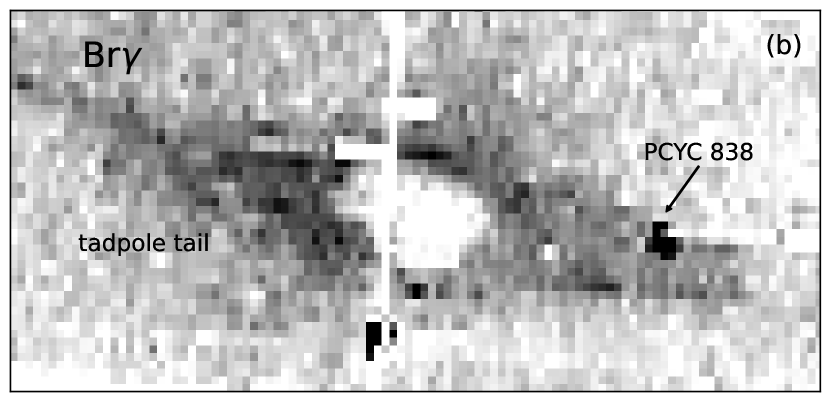
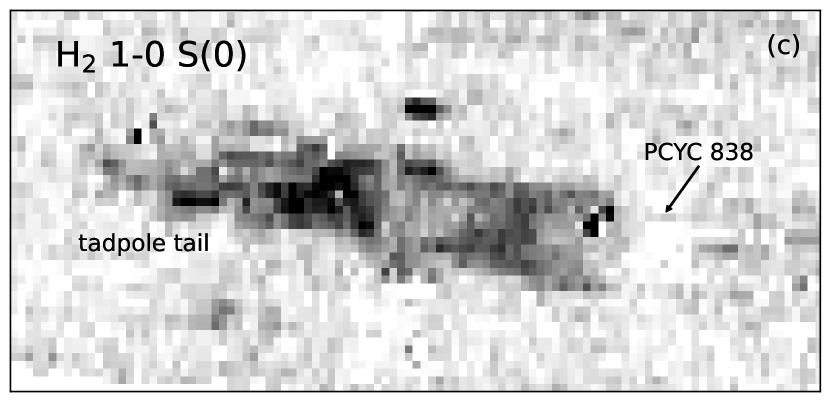
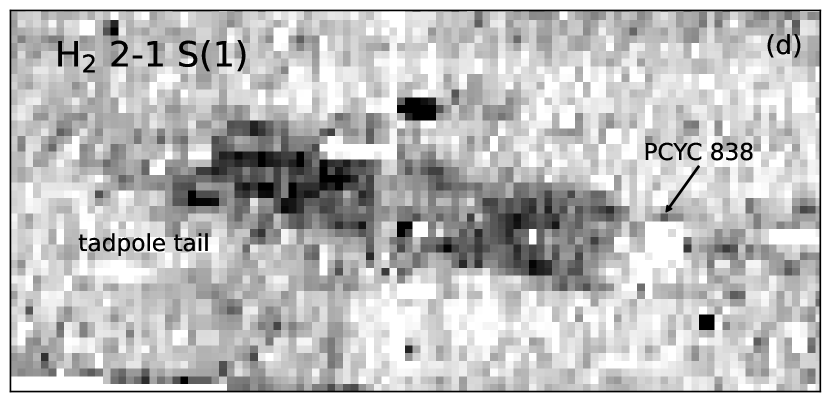
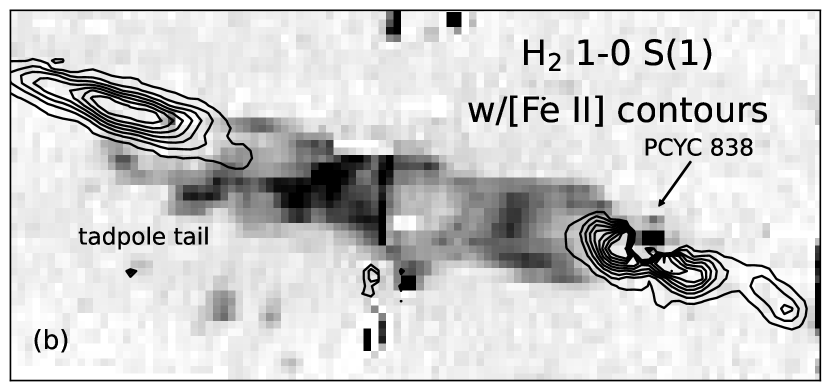
We detected Br- and 3 bright lines with ERIS/SPIFFIER (see Table 3 and Figure 2). All of the detected lines are spatially extended, tracing the bipolar HH 900 outflow.
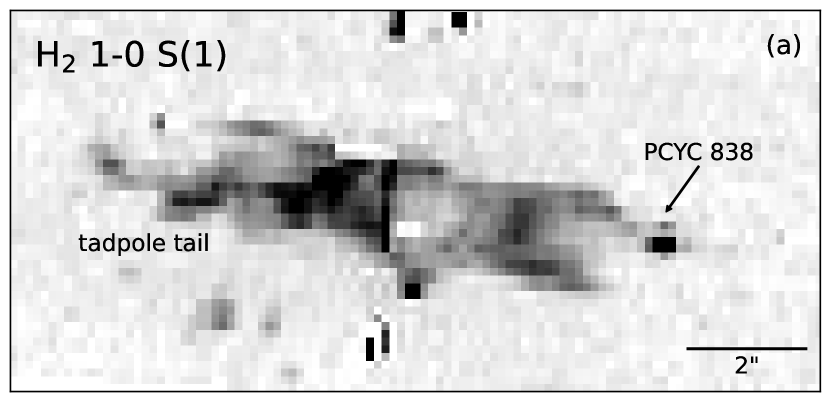
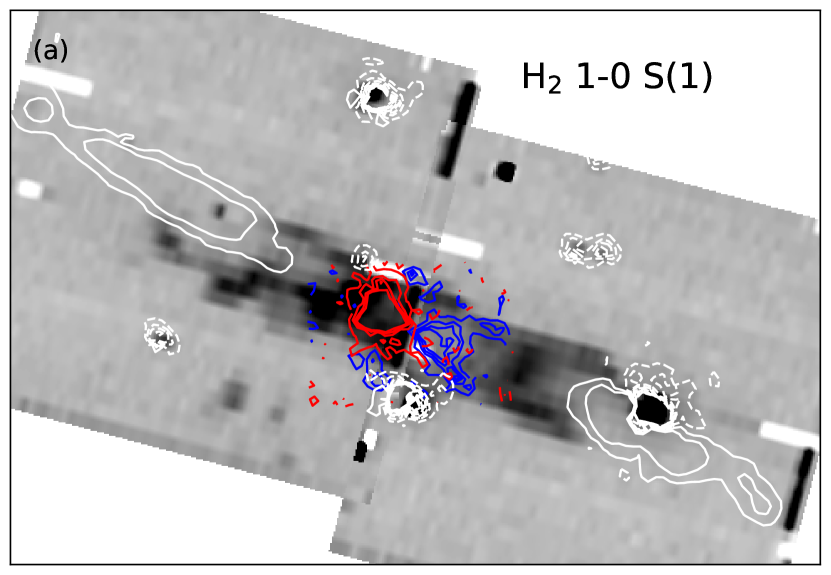
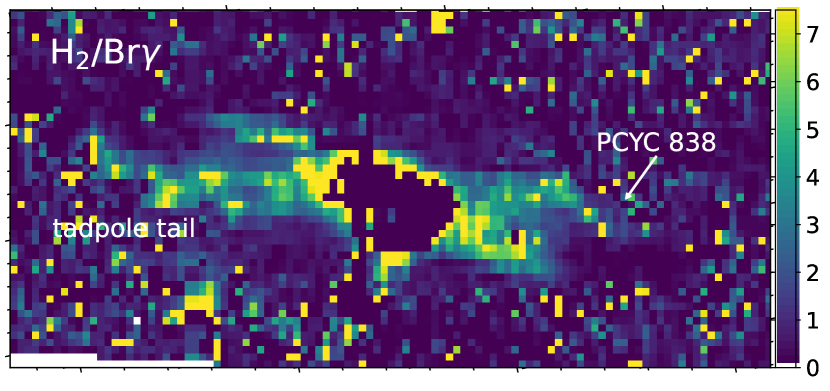
Bright emission from all lines also trace the ionization front on the globule surface. The tadpole tail is prominent in images, tracing the same morphology seen in silhouette in H (Smith et al., 2010) and in emission in CO (Reiter et al., 2020a).
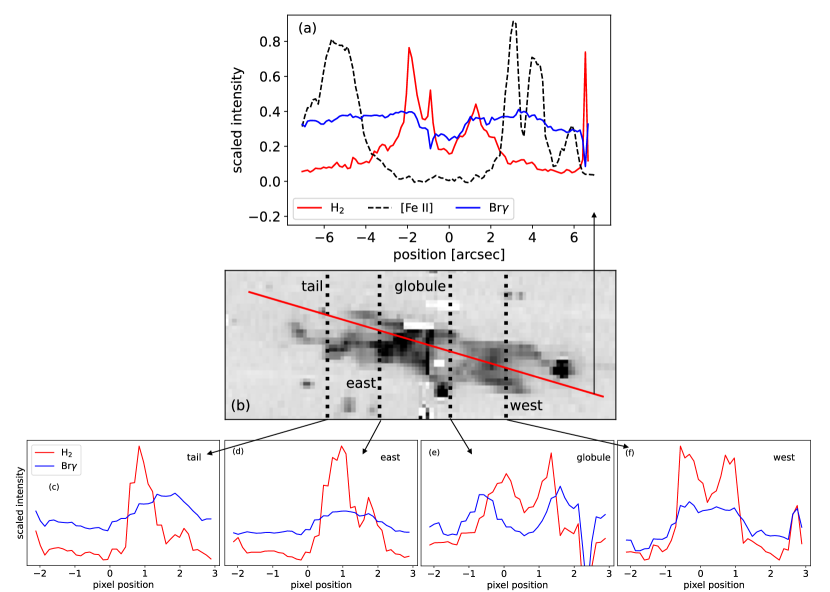
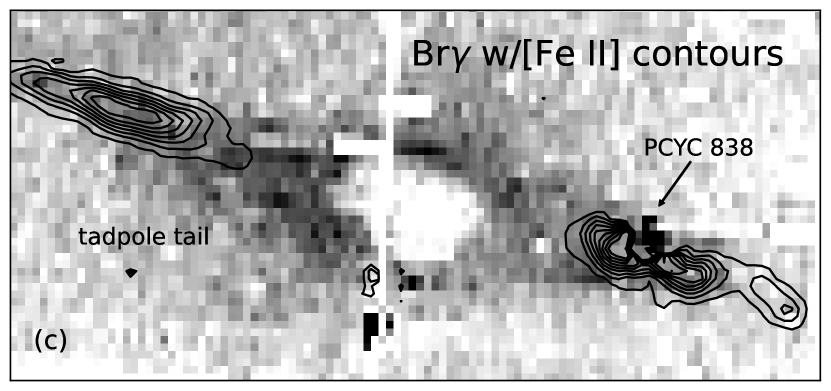
Both Br- and emission from HH 900 trace the wide-angle outflow, extending smoothly from where the CO outflow ends at the edge of the globule (see Figure 3 and Reiter et al., 2020a). Br- emission traces the same morphology as H, as expected. In the H ii region, traces a broadly similar morphology to the ionized outflow traced by H and Br- but the surface brightness is less uniform. appears limb-brightened with a measurable dip in the intensity at the mid-point of the outflow lobe (see Figure 4). emission is less extended, reaching only ″ (0.02 pc) from the globule, compared to ″ (0.06 pc) for H and Br-. This is the same extent seen in seeing-limited images from Hartigan et al. (2015) and coincides with the [C i] emission seen with MUSE (see Figure 3 and Reiter et al., 2019).
In the following analysis, we refer to the 2.12 µm line simply as ‘’ and specify the transition of the other lines where used.
3.1 Velocity structure


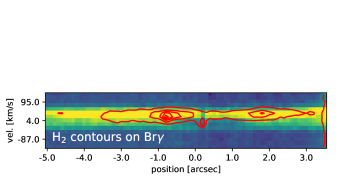
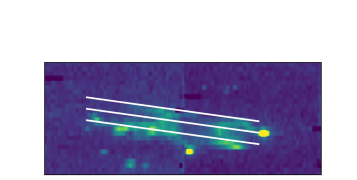
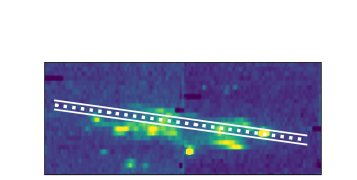
The HH 900 outflow lies close to the plane of the sky, with a tilt angle (Reiter et al., 2015a). The bulk of the outflow velocity is therefore captured in the tangential motions in the plane of the sky. We benefit from the high velocity resolution of SPIFFIER/ERIS to measure the more modest radial velocities from the outflow. To measure the velocity of the outflow components traced by and Br-, we construct position-velocity (P-V) diagrams of each line (see Figure 5). We extract a slice 5 pixels wide through the center of the jet+outflow. Both H2 and Br- show blueshifted emission from the western limb of the jet and redshifted emission to the east, consistent with other velocity measurements of the jet+outflow (Reiter et al., 2015a, 2020a).
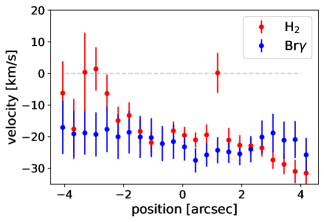
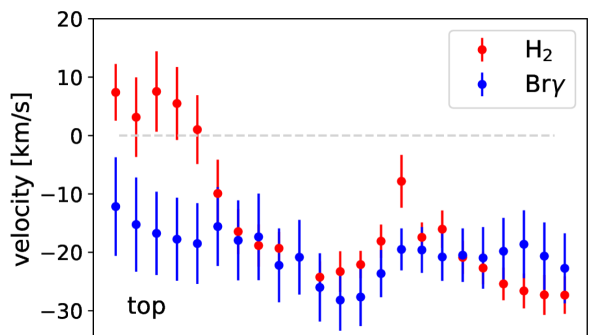
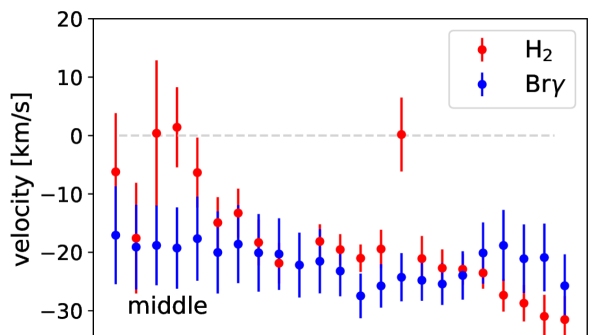
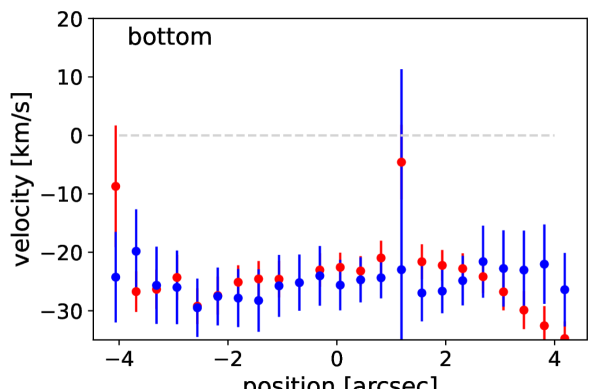
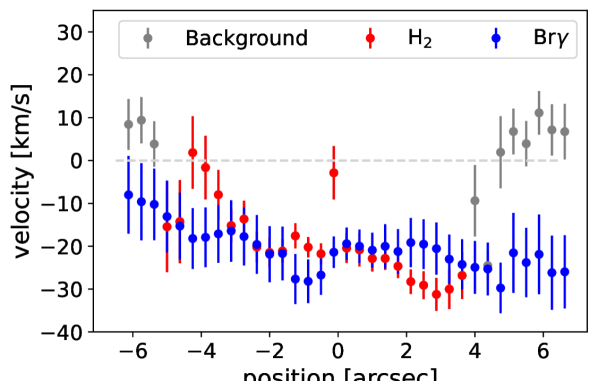
To obtain a more precise estimate, we fit a Gaussian to the velocity profile in different slices across the outflow. We take the average emission in three-pixel-wide slices (the equivalent of three columns in the P-V diagrams). Line profiles are largely single-peaked. Low velocities between ″ and ″ (on the eastern side of the globule) are contaminated by the blueshifted tadpole tail (see Appendix B and Figure 10). Note that the tadpole tail is blueshifted on the same (eastern) side of the globule where the outflow is redshifted. Overall, velocities in the outflow are faster than Br-.
Velocity measurements for the HH 900 jet+outflow were previous reported by Reiter et al. (2015a). Br- velocities are consistent with the marginally-resolved blueshifted velocities seen in the western limb of the outflow in H (which reach a maximum blueshifted velocity of -16 km s-1). All outflow velocities traced by and Br- are slower than the [Fe ii] emission from the jet (30 km s-1; see Appendix A).
3.2 The YSOs
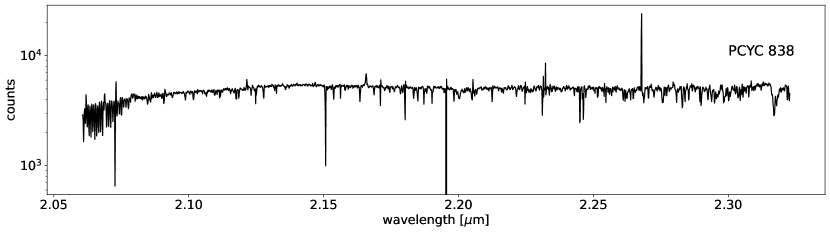
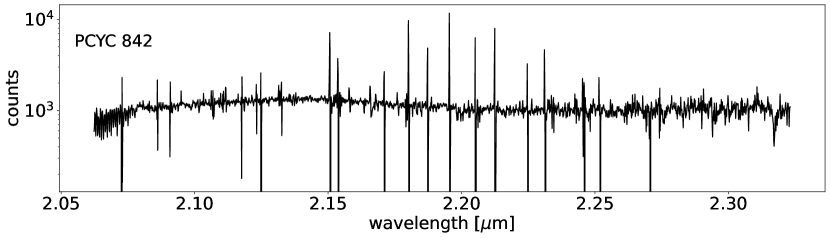
The HH 900 driving source remains unseen at near-IR wavelengths as it is deeply embedded inside the tadpole-shaped globule. However, we detect two point sources that are visible outside the globule (see Figure 1). Both were identified as candidate young stellar objects (YSOs) in the Pan Carina YSO Catalog (PCYC) by Povich et al. (2011). We use aperture extraction to isolate the stellar spectrum and remove the sky background. For both objects, the ‘sky’ background includes nebular emission from the H ii region and structured emission from either the edge of the globule or the limb-brightened HH 900 outflow. As a result, the Br- and line profiles may be contaminated with residual nebular emission. Spectra of both sources are shown in Appendix C.
The first source, PCYC 838, lies directly on top of the western limb of the HH 900 jet+outflow. We detect Br- in emission in the PCYC 838 YSO spectrum but no lines. Br- emission may indicate active accretion (e.g., Fairlamb et al., 2017). However, we do not detect other indicators of the circumstellar disk such as the CO bandhead in emission or absorption (e.g., Carr, 1989; Calvet et al., 1991). The absence of the molecular bands may point to a slightly higher mass for this object, consistent with the spectral type (roughly G-type) estimated from the optical spectrum (Reiter et al., 2019) and the mass estimated from the best-fitting model of the spectral energy distribution ( M⊙; Povich et al., 2011).
A second star, identified as candidate YSO PCYC 842 by Povich et al. (2011), lies at the bottom of the tadpole-shaped globule. No prominent emission lines (i.e. Br-) are detected in this source. No millimeter continuum or molecular line emission associated with this source was detected with ALMA (Reiter et al., 2020a), suggesting a lack of circumstellar material. Indeed, Reiter et al. (2015a) questioned whether this source is a YSO based on its motion toward the globule and the low resolution of the data used for its original classification. The relatively featureless spectrum of this source does not provide evidence that this source is young or actively accreting.
4 HH 900 as an evaporating molecular outflow
We argue that the morphology, velocity, and excitation of the extended and Br- emission in HH 900 trace an ionized and evaporating outflow. In this picture, the molecular outflow is rapidly but not instantaneously dissociated once it emerges into the H ii region. Extended emission traces the extent (and therefore the time) that molecules survive in the H ii region. Spatially coincident [C i] emission seen with MUSE supports this interpretation (see Figure 3). The ionization potential of carbon is lower than hydrogen (11.26 eV compared to 13.6 eV), so [C i] is expected to coexist with partially dissociated (see, e.g., Osterbrock & Ferland, 2006).
High spatial and spectral resolution integral field unit spectroscopy with ERIS allows us to perform three key tests of this hypothesis. If HH 900 is an evaporating molecular outflow we expect: (1) the same morphology in molecules () and recombination lines (Br-); (2) similar outflow-like kinematics in molecular () and recombination lines (Br-) that are distinct from the fast, collimated jet traced by [Fe ii]; and (3) photoexcitation dominating over shock excitation in the outflow. We discuss each test individually below.
4.1 Morphology
emission extends beyond the edge of the globule, tracing the same wide-angle flow as Br- (see Figure 6). The appears limb-brightened, as though tracing the edges of an outflow cavity. The width of the and Br profiles are comparable for intensity tracings through the outflow (see Figure 4). This is in contrast to tracings through the globule itself that show an offset of 0.5″ between the Br- and emission peaks.
The key morphological difference between and Br- is their extent. reaches 2.2″ (0.02 pc) from the globule edge into the H ii region. The terminal edge of the limb-brightened outflow coincides with the onset of [Fe ii] emission from the jet (see Figure 6). Br- extends 5.5″ (0.06 pc) tracing the full length of the jet seen in H and [Fe ii]. This is consistent with an evaporating molecular outflow if disappears at the point where molecules are completely dissociated.
4.2 Outflow velocities
Outflow velocities traced by increase with distance from the driving source. This Hubble-like flow is characteristic of jet-driven outflows (see Figure 2 from Arce et al., 2007). The highest velocities are km s-1, remarkably similar to the highest velocities seen from the embedded CO outflow (Reiter et al., 2020a). velocities are 10 km s-1 faster than Br- in both limbs of the outflow (see Figure 5) and for all slices across the globule (see Appendix B). This velocity difference is comparable to the sound speed in ionized gas ( km s-1), the expected velocity of a photoevaporative flow.
The fastest velocities measured in and Br- are both lower than in the collimated [Fe ii] jet where Reiter et al. (2015a, 2019) found fast, steady velocities up to 30 km s-1. Br- outflow velocities are consistent with zero while the fastest velocities are closer to 30 km s-1. Several other outflows have been observed to have a nested or ‘onion-layer’ structure with fast, highly collimated components on the jet axis surrounded by slower, wider angle layers (e.g. Lavalley-Fouquet et al., 2000; Bacciotti et al., 2000; Pyo et al., 2003; Coffey et al., 2008). This same structure is seen in HH 900 with [Fe ii] emission tracing the fast core of the jet while traces molecular layers either lifted from the disk or entrained from the envelope/globule. On the surface is the ionized Br- emission where the strong external radiation field first encounters the slowest, widest layers of the outflow.
4.3 Excitation
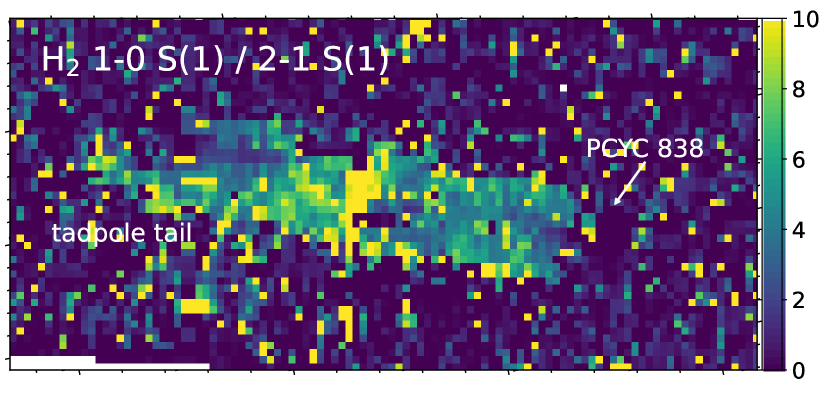
We measure two different emission line ratios in the spatially-resolved outflow to determine the excitation of the gas. All four emission lines detected with these ERIS observations are within a narrow wavelength range so differences in wavelength-dependent extinction are negligible. We expect /Br-1 for a dissociating outflow where photoexcitation will play a dominant role (the expected ratio in shock-excited gas is 1; see discussion in e.g., Yeh et al., 2015). The 1-0 S(1) / 2-1 S(1) ratio provides an additional diagnostic. For shock-excited gas, models predict a line ratio (Shull & Hollenbach, 1978); for photo-excited gas, the expected line ratio is (Black & van Dishoeck, 1987).
Line ratio maps are shown in Figure 7. We take the ratio of the integrated intensity (moment 0) obtained by integrating each line over an interval 4 Å from the line center. Ambient nebular emission is estimated from the median value of the sky above and below HH 900.
The /Br- ratio is throughout the HH 900 system. The highest values are seen on the eastern edge of the globule and in a few knots in the tadpole tail indicating that shock-excitation contributes in these portions of the system. Ratios in the outflow are lower but increase to higher values toward the outflow edges. No part of the system has /Br- .
The interpretation of the 1-0 S(1) / 2-1 S(1) ratio map is less clear. All values in the 1-0 S(1) / 2-1 S(1) ratio map are 10, below the range expected for shock-excited gas (10). However, throughout the map, the flux ratio is 3, larger than expected for pure photoexcitation. Unlike the /Br- ratio map, the globule edge is not prominent in the 1-0 S(1) / 2-1 S(1) ratio map and there are no prominent bright spots in the tadpole tail.
Based on these ratio maps, the simplest interpretation is that a combination of shocks and photoexcitation contribute to the observed emission. Note that the typical knot sizes seen in the spectacular HH 212 jet are 250500 au (Zinnecker et al., 1998). At the distance of Carina (2.35 kpc; Göppl & Preibisch, 2022), this corresponds to – too small to be resolved with ERIS.
5 Discussion
Evaporating molecular outflows are the missing piece that connects (cold) molecular outflows seen inside clouds with the hot ionized jets laid bare in H ii regions. Once outflows leave the protection of their natal cocoons, external irradiation rapidly heats, dissociates, and ionizes them. This explains the abrupt end of CO outflows like HH 900 at the edge of the globule (or dust pillar in the case of HH 901 and HH 902, see Cortes-Rangel et al., 2020).
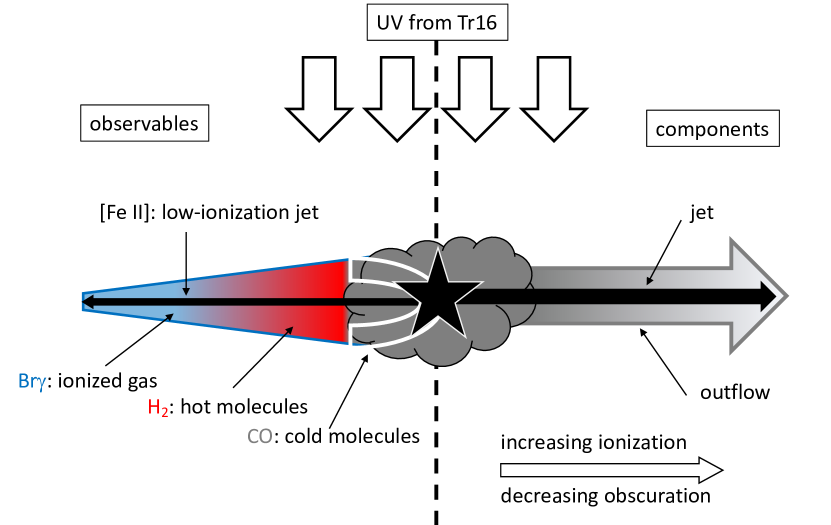
In HH 900, the CO outflow morphology connects smoothly with the ionized outflow traced by H and Br- that is seen outside the globule. Near-IR [Fe ii] emission traces the fast, collimated jet that bisects the wide-angle ionized outflow. However, this component is first detected 1.5″ from the edges of the globule. Non-instantaneous dissociation of the molecular outflow provides one explanation for this gap. In this region, all UV photons are consumed ionizing the skin of the outflow (Br-; H) and dissociating molecules just inside it (; [C i]), exhausting the high energy photons before they can reach the core and ionize Fe (first ionization requires 7.6 eV). Essentially, slices along the outflow at different distances from the globule trace the development and progression of a photodissociation region (PDR) through the column of outflowing gas (see Figure 9).
In a less punishing environment than Carina, HH 900 would look like a traditional molecular outflow with CO tracing more of its extent. The HH 900 YSO remains deeply embedded in the globule with the only detection to date in the millimeter continuum with ALMA. This suggests that the source evolutionary stage is in the Class 0/I regime, consistent with HH 900 being in the most active outflow phase (we discuss the mass-loss rates in Section 5.1).
One of the outstanding challenges for understanding the local and large-scale impact of protostellar jets and outflows is obtaining a full mass census. Typically, only one component is visible: the underlying (atomic) jet is unseen in molecular outflows while optical and near-IR images reveal collimated atomic jets that have largely escaped their natal clouds and may no longer be surrounded by a molecular outflow. External illumination reveals all of these components in the HH 900 jet+outflow. The system is younger than other well-studied examples of externally irradiated jets (e.g., in Orion, Bally & Reipurth, 2001; Bally et al., 2006a; Kirwan et al., 2023), capturing a consequential but not well understood outflow phase.
External irradiation in the H ii region alters the observable diagnostics but provides an extraordinary opportunity because it also illuminates the entire body of the jet+outflow. Mass-loss rates can therefore be estimated using the well-understood physics of photoionized gas instead of non-linear and time-dependent shock models. Following Bally et al. (2006a), we can use the well-studied environment to determine the dissociation time, and therefore the mass-loss rate, of the dissociating molecular outflow.
5.1 Mass-loss rate
We make a simple estimate of the photodissociation rate of molecular hydrogen entrained in the outflow. The free space photodissociation rate is s-1 (Sternberg et al., 2014; Bialy, 2020) where is the Draine UV radiation field strength (Draine, 1978). Ignoring shielding, the photodissociation rate of at the surface of a slab irradiated from one side (the outflow in our case) is
| (1) |
From Smith (2006), the FUV luminosity of Tr16 is log(LFUV) L⊙. We convert this to the local flux assuming the median distance to the OB stars in Tr16 from Alexander et al. (2016). This gives an incident Draine UV radiation field of , corresponding to a dissociation timescale of 1.2 years. For an outflow velocity of 30 km s-1, this gives a distance of 8 au for the extent of the outflow. This is 3 orders of magnitude smaller than the observed extent of HH 900 (5000 au, see Section 4.1).
This simple estimate ignores the effect of shielding. However, can be shielded by dust (which may also be present in the outflow Smith et al., 2010; Reiter et al., 2019, 2020a) or it can self-shield, provided a sufficiently large column (Sternberg et al., 2014). Including self-shielding, the dissociation rate becomes
| (2) |
where is the dust column optical depth and is the H2 self-shielding parameter; both depend on the H2 column . We follow Bialy (2020) and adopt cm2. For we use the Draine & Bertoldi (1996) fit
| (3) |
where cm-2 and cm s-1. This gives an photodissociation timescale that depends only on the column for a given . We solve this expression for the column that enables the H2 outflow to extend au with a flow velocity of km s-1. We calculate the photodissociation timescale and multiply by a characteristic speed (30 km s-1) to obtain the maximum observable extent.
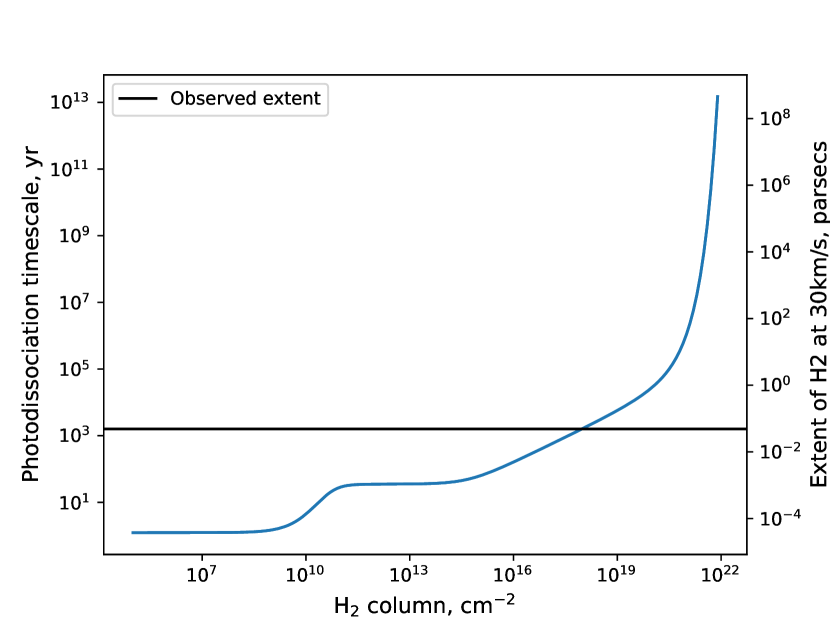
Results from this simple analysis are shown in Figure 8. We estimate that an column of cm-2 is required to reproduce the observed extent of the outflow. Assuming the outflow is a cylinder, we convert this to a volume density by dividing by the observed width of the outflow. For an column density of cm-2 and a jet width of 1.5″ (3450 au), the volume density is cm-3. We compute the mass-loss rate of the outflow assuming a constant density and radius in a cylindrical jet
| (4) |
where is the mass of molecular hydrogen and km s-1 is the characteristic velocity of the outflow. From this, we estimate M⊙ yr-1.
This simple estimate yields a mass-loss rate two orders of magnitude smaller than estimated for the ionized component, M⊙ yr-1 (Smith et al., 2010). The mass-loss rate of the molecular outflow inside the globule is an order of magnitude higher than the ionized component with an average M⊙ yr-1 (Reiter et al., 2020a). The highest mass-loss rate is measure in the low-ionization jet core with M⊙ yr-1 (Reiter et al., 2016).
The large discrepancy between the mass-loss rates in the molecular outflow measured inside and outside the globule is not entirely surprising. We ignore any dust shielding in the outflow despite indirect evidence for dust in the outflow. In addition, we argue that emission traces partially dissociated molecular gas. The column of neutral material tracing the brief phase between dissociation and ionization should increase once the outflow is in the H ii region. Near the edge of the globule where the outflow first emerges into the H ii region, we expect that the sum of the molecular (), neutral (C i?), and ionized (H or Br-) components to be comparable to the CO mass-loss rate measured inside the globule. This implies that there is a large column of neutral material in the outflow. Future observations of neutral gas tracers like C i with ALMA may reveal the mass and extent of this neutral component.
Finally, we note that the low volume density we estimate in is consistent with photoexcited gas. Black & van Dishoeck (1987) predict that, in steady state, the boundary layer should have . We derive an that is 13 smaller than the reported by Smith et al. (2010), consistent with this prediction.
6 Conclusions
In H ii regions, jets and outflows that emerge from their natal clouds will be externally illuminated, dissociated, and ionized by UV photons from nearby high-mass stars. In this paper, we present new near-IR integral field unit spectroscopy from ERIS/SPIFFIER that provides the first clear evidence that HH 900 is a dissociating and evaporating molecular outflow. Extended and Br- emission trace the wide-angle outflow as it smoothly extends from the edge of the CO outflow. emission extends 2.2″ (0.02 pc) from the globule edge, tracing the molecule survival time. The ionized outflow, traced by Br-, reveals the full extent of the outflow as it reaches 5.5″ into the H ii region.
These new spatially and spectrally resolved observations of HH 900 allow us to perform three tests to confirm that HH 900 is an evaporating molecular outflow. First, we show that and Br- trace the same morphology as long as molecules survive. Second, we show that both lines trace outflow-like kinematics. Velocities of both lines are modest where the outflow emerges from the globule, then increases to speeds approaching the high velocity of the underlying jet seen in [Fe ii]. Velocities between each component differ by 10 km s-1 with [Fe ii] tracing the fastest velocities, intermediate, and Br- the slowest, consistent with the layered velocity structure seen in other outflows. Third, diagnostic line ratios indicate a significant contribution from photoexcitation to the excitation in the outflow. Together, these tests provide strong evidence that an evaporating molecular outflow connects the cold (CO) outflow seen inside the globule with the hot ionized outflow (H, Br-) seen in the H ii region.
To the best of our knowledge, this is the first direct evidence for an evaporating molecular outflow. As such, these observations provide an excellent test case for models of irradiated jets and outflows (i.e., Estrella-Trujillo et al., 2021). Finally, near-IR observations from the James Webb Space Telescope (JWST) will soon be revealing jets and outflows in many high-mass star-forming regions (e.g., Reiter et al., 2022). These externally irradiated sources will likely have more in common with objects like HH 900 than the well-studied jets seen in more local, quiescent regions.
Acknowledgements
We would like to thank the referee, Dr. William Henney, for a prompt and thoughtful report that improved the quality of the manuscript. We would like to thank Lowell Tacconi-Garman for support with the preparation, reduction, and analysis of the new ERIS/SPIFFIER data. We wish to thank Nathan Smith for productive discussion about the velocity structure of HH 900. TJH is funded by a Royal Society Dorothy Hodgkin Fellowship and UKRI ERC guarantee funding (EP/Y024710/1). CFM is funded by the European Union (ERC, WANDA, 101039452). DI is funded by the European Research Council (ERC) via the ERC Synergy Grant ECOGAL (grant 855130). Views and opinions expressed are however those of the author(s) only and do not necessarily reflect those of the European Union or the European Research Council Executive Agency. Neither the European Union nor the granting authority can be held responsible for them.
Based on observations collected at the European Southern Observatory under ESO programmes 110.257T.001 and 0101.C-0391(A). This paper makes use of the following ALMA data: ADS/JAO.ALMA #2016.1.01537.S. ALMA is a partnership of ESO (representing its member states), NSF (USA) and NINS (Japan), together with NRC (Canada) and NSC and ASIAA (Taiwan) and KASI (Republic of Korea), in cooperation with the Republic of Chile. The Joint ALMA Observatory is operated by ESO, AUI/NRAO and NAOJ. This work uses observations made with the NASA/ESA Hubble Space Telescope, obtained from the Data Archive at the Space Telescope Science Institute, which is operated by the Association of Universities for Research in Astronomy, Inc., under NASA contract NAS 5-26555. The HST observations are associated with GO 13390 and GO 13391. This research made use of Astropy,444http://www.astropy.org a community-developed core Python package for Astronomy (Astropy Collaboration et al., 2013; Price-Whelan et al., 2018). This research made use of APLpy, an open-source plotting package for Python (Robitaille & Bressert, 2012).
Data Availability
The ERIS data that are presented in this paper are publicly available from the ESO archive555https://archive.eso.org/cms.html. Archival MUSE data are also available from the ESO archive. The ALMA data used in this study are publicly available from the ALMA archive666https://almascience.nrao.edu/aq/?result_view=observations. Data from HST are publicly available via the MAST archive777https://mast.stsci.edu/portal/Mashup/Clients/Mast/Portal.html.
References
- Alexander et al. (2016) Alexander M. J., Hanes R. J., Povich M. S., McSwain M. V., 2016, AJ, 152, 190
- Arce et al. (2007) Arce H. G., Shepherd D., Gueth F., Lee C.-F., Bachiller R., Rosen A., Beuther H., 2007, Protostars and Planets V, pp 245–260
- Arce et al. (2013) Arce H. G., Mardones D., Corder S. A., Garay G., Noriega-Crespo A., Raga A. C., 2013, ApJ, 774, 39
- Astropy Collaboration et al. (2013) Astropy Collaboration et al., 2013, aap, 558, A33
- Bacciotti et al. (2000) Bacciotti F., Mundt R., Ray T. P., Eislöffel J., Solf J., Camezind M., 2000, ApJ, 537, L49
- Bally (2016) Bally J., 2016, ARA&A, 54, 491
- Bally & Reipurth (2001) Bally J., Reipurth B., 2001, ApJ, 546, 299
- Bally et al. (2006a) Bally J., Licht D., Smith N., Walawender J., 2006a, AJ, 131, 473
- Bally et al. (2006b) Bally J., Licht D., Smith N., Walawender J., 2006b, AJ, 131, 473
- Bialy (2020) Bialy S., 2020, Communications Physics, 3, 32
- Black & van Dishoeck (1987) Black J. H., van Dishoeck E. F., 1987, ApJ, 322, 412
- Calvet et al. (1991) Calvet N., Patino A., Magris G. C., D’Alessio P., 1991, ApJ, 380, 617
- Carr (1989) Carr J. S., 1989, ApJ, 345, 522
- Chang & Deming (1996) Chang E. S., Deming D., 1996, Solar Physics, 165, 257
- Coffey et al. (2008) Coffey D., Bacciotti F., Podio L., 2008, ApJ, 689, 1112
- Cortes-Rangel et al. (2020) Cortes-Rangel G., Zapata L. A., Toalá J. A., Ho P. T. P., Takahashi S., Mesa-Delgado A., Masqué J. M., 2020, AJ, 159, 62
- Davies et al. (2018) Davies R., et al., 2018, in Evans C. J., Simard L., Takami H., eds, Society of Photo-Optical Instrumentation Engineers (SPIE) Conference Series Vol. 10702, Ground-based and Airborne Instrumentation for Astronomy VII. p. 1070209 (arXiv:1807.05089), doi:10.1117/12.2311480
- Davies et al. (2023) Davies R., et al., 2023, A&A, 674, A207
- Draine (1978) Draine B. T., 1978, ApJS, 36, 595
- Draine & Bertoldi (1996) Draine B. T., Bertoldi F., 1996, ApJ, 468, 269
- Erkal et al. (2021) Erkal J., et al., 2021, ApJ, 919, 23
- Escalante et al. (1991) Escalante V., Sternberg A., Dalgarno A., 1991, ApJ, 375, 630
- Estrella-Trujillo et al. (2021) Estrella-Trujillo D., Velázquez P. F., Raga A. C., Esquivel A., 2021, ApJ, 918, 75
- Fairlamb et al. (2017) Fairlamb J. R., Oudmaijer R. D., Mendigutia I., Ilee J. D., van den Ancker M. E., 2017, MNRAS, 464, 4721
- Freudling et al. (2013) Freudling W., Romaniello M., Bramich D. M., Ballester P., Forchi V., García-Dabló C. E., Moehler S., Neeser M. J., 2013, A&A, 559, A96
- Göppl & Preibisch (2022) Göppl C., Preibisch T., 2022, A&A, 660, A11
- Hartigan et al. (2005) Hartigan P., Heathcote S., Morse J. A., Reipurth B., Bally J., 2005, AJ, 130, 2197
- Hartigan et al. (2011) Hartigan P., et al., 2011, ApJ, 736, 29
- Hartigan et al. (2015) Hartigan P., Reiter M., Smith N., Bally J., 2015, AJ, 149, 101
- Heathcote et al. (1996) Heathcote S., Morse J. A., Hartigan P., Reipurth B., Schwartz R. D., Bally J., Stone J. M., 1996, AJ, 112, 1141
- Kiminki & Smith (2018) Kiminki M. M., Smith N., 2018, MNRAS, 477, 2068
- Kirwan et al. (2023) Kirwan A., et al., 2023, A&A, 673, A166
- Lavalley-Fouquet et al. (2000) Lavalley-Fouquet C., Cabrit S., Dougados C., 2000, A&A, 356, L41
- Levenson et al. (2000) Levenson N. A., et al., 2000, ApJ, 533, L53
- Noriega-Crespo et al. (2004) Noriega-Crespo A., et al., 2004, ApJS, 154, 352
- Osterbrock & Ferland (2006) Osterbrock D. E., Ferland G. J., 2006, Astrophysics of gaseous nebulae and active galactic nuclei
- Povich et al. (2011) Povich M. S., et al., 2011, ApJS, 194, 14
- Price-Whelan et al. (2018) Price-Whelan A. M., et al., 2018, aj, 156, 123
- Pyo et al. (2003) Pyo T.-S., et al., 2003, ApJ, 590, 340
- Rebolledo et al. (2016) Rebolledo D., et al., 2016, MNRAS, 456, 2406
- Reipurth et al. (1998) Reipurth B., Bally J., Fesen R. A., Devine D., 1998, Nature, 396, 343
- Reiter et al. (2015a) Reiter M., Smith N., Kiminki M. M., Bally J., Anderson J., 2015a, MNRAS, 448, 3429
- Reiter et al. (2015b) Reiter M., Smith N., Kiminki M. M., Bally J., 2015b, MNRAS, 450, 564
- Reiter et al. (2016) Reiter M., Smith N., Bally J., 2016, MNRAS, 463, 4344
- Reiter et al. (2019) Reiter M., McLeod A. F., Klaassen P. D., Guzmán A. E., Dale J. E., Mottram J. C., Garay G., 2019, MNRAS, 490, 2056
- Reiter et al. (2020a) Reiter M., Guzmán A. E., Haworth T. J., Klaassen P. D., McLeod A. F., Garay G., Mottram J. C., 2020a, MNRAS, 496, 394
- Reiter et al. (2020b) Reiter M., Haworth T. J., Guzmán A. E., Klaassen P. D., McLeod A. F., Garay G., 2020b, MNRAS, 497, 3351
- Reiter et al. (2022) Reiter M., Morse J. A., Smith N., Haworth T. J., Kuhn M. A., Klaassen P. D., 2022, MNRAS, 517, 5382
- Robitaille & Bressert (2012) Robitaille T., Bressert E., 2012, APLpy: Astronomical Plotting Library in Python, Astrophysics Source Code Library (ascl:1208.017)
- Shull & Hollenbach (1978) Shull J. M., Hollenbach D. J., 1978, ApJ, 220, 525
- Smith (2006) Smith N., 2006, MNRAS, 367, 763
- Smith et al. (2004) Smith N., Bally J., Brooks K. J., 2004, AJ, 127, 2793
- Smith et al. (2010) Smith N., Bally J., Walborn N. R., 2010, MNRAS, 405, 1153
- Stanke et al. (1999) Stanke T., McCaughrean M. J., Zinnecker H., 1999, A&A, 350, L43
- Sternberg et al. (2014) Sternberg A., Le Petit F., Roueff E., Le Bourlot J., 2014, ApJ, 790, 10
- Yeh et al. (2015) Yeh S. C. C., Seaquist E. R., Matzner C. D., Pellegrini E. W., 2015, ApJ, 807, 117
- Zhang et al. (2016) Zhang Y., et al., 2016, ApJ, 832, 158
- Zinnecker et al. (1998) Zinnecker H., McCaughrean M. J., Rayner J. T., 1998, Nature, 394, 862
Appendix A Reconciling HH 900 velocities
The systematic velocity of HH 900 was not known when Reiter et al. (2015a) analyzed the [Fe ii] emission from the jet. The derived velocity of km s-1 is much redder than Carina itself which has a heliocentric velocity of km s-1 (Rebolledo et al., 2016). Re-examining the spectra in Reiter et al. (2015a), we find that the estimated systematic velocity is almost exactly equal to the heliocentric velocity correction for the date of observation (15.75 km s-1).
We have remeasured the HH 900 jet velocities from the FIRE spectra presented in Reiter et al. (2015a) including the heliocentric velocity correction and the known velocity of the system (see Section 2 and Reiter et al., 2020a). This centers the [Fe ii] emission symmetrically around the source velocity, extending to km s-1.
We note that the jet velocities measured from [Fe ii] emission in Reiter et al. (2015a) and Reiter et al. (2019) were both asymmetric with the blueshifted jet extending to km s-1 while the redshifted jet extended to km s-1. This offset corresponds to the blueshift of km s-1 of HH 900 relative to Carina.
Appendix B P-V slices
We show three slices through the HH 900 jet+outflow in Figure 10. As in Section 3.1, each slice is 5 spatial pixels wide. The slice through the top edge of HH 900 and the globule offer the most pristine measure of the outflow kinematics as this is unaffected by the tadpole tail. The middle P-V slice is the same as discussed in Section 3.1. The P-V slice along the bottom of the outflow and globule are clearly affected by the blueshifted tadpole tail which is brighter than the outflow in . The tadpole globule is not resolved in Br-. Based on diffraction-limited H images (see Figure 1), we expect the tail, like the globule, would be seen in silhouette, so does not affect the Br- velocities.
Appendix C YSO spectra