Constraining the slow-diffusion zone size and electron injection spectral index for the Geminga pulsar halo
Abstract
Measuring the electron diffusion coefficient is the most straightforward task in the study of gamma-ray pulsar halos. The updated measurements of the spatial morphology and spectrum of the Geminga halo by the HAWC experiment enable us to constrain parameters beyond the diffusion coefficient, including the size of the slow-diffusion zone and the electron injection spectrum from the pulsar wind nebulae (PWN). Based on the two-zone diffusion model, we find that the slow-diffusion zone size () around Geminga is within the range of pc. The lower boundary of this range is determined by the goodness of fit of the model to the one-dimensional morphology of the Geminga halo. The upper limit is derived from fitting the gamma-ray spectrum of the Geminga halo, along with the expectations for the power-law index of the injection spectrum based on simulations and PWN observations, i.e., . With set at its lower limit of pc, we obtain the maximum permitted by the HAWC spectrum measurement, with an upper limit of at a significance. Moreover, we find that when pc and , the predicted positron spectrum generated by Geminga at Earth coincides with the AMS-02 measurement in the GeV range.
I Introduction
According to the standard evolution model, pulsar wind nebulae (PWNe) associated with middle-aged pulsars ( kyr) are typically in the bow-shock stage Gaensler and Slane (2006), during which they traverse the interstellar medium (ISM) while maintaining a compact size of pc. High-energy electrons and positrons111Electrons will denote both electrons and positrons hereafter if not specified. that escape from the PWNe and diffuse into the ISM generate gamma-ray halos around their respective pulsars via inverse Compton (IC) scattering of background photons. These phenomena are referred to as pulsar halos Sudoh et al. (2019); Fang (2022); Liu (2022); López-Coto et al. (2022). Since the morphology of pulsar halos traces the spatial distribution of their parent electrons, they serve as ideal indicators for investigating cosmic-ray propagation in localized regions of the Galaxy Evoli et al. (2018); Fang et al. (2019a); Liu et al. (2019); Wang et al. (2021); Fang et al. (2021a). Furthermore, the gamma-ray spectrum of pulsar halos is determined by the energy spectrum of the escaped electrons rather than those remaining confined within the PWNe, thus providing unique insight into the process of electron escape from the PWNe Fang and Bi (2022); Fang et al. (2022).
The diffusion coefficient inferred from the morphology of the identified pulsar halos is about two orders of magnitude smaller than the Galactic average Abeysekara et al. (2017); Aharonian et al. (2021); Fang et al. (2022); Albert et al. (2023a), which also ensures that these halos are bright enough to be detected by current experiments. The slow-diffusion phenomenon around the pulsars has a crucial impact on interpreting issues such as the cosmic-ray positron excess Hooper et al. (2017); Fang et al. (2018); Tang and Piran (2019); Xi et al. (2019); Fang et al. (2019b); Manconi et al. (2020) and the diffuse TeV gamma-ray excess Linden and Buckman (2018); Dekker et al. (2023); Yan et al. (2023). To accurately address these issues, comprehension of the slow-diffusion mechanism is essential. This slow diffusion could be attributed to a turbulent environment generated by the host supernova remnants of the pulsars Fang et al. (2019a) or by the escaped electrons themselves Evoli et al. (2018); Mukhopadhyay and Linden (2022). Alternatively, it may be explained by the projection effects under anisotropic diffusion without needing an additional turbulent magnetic field Liu et al. (2019); De La Torre Luque et al. (2022); Fang et al. (2023).
A definitive conclusion on the slow-diffusion mechanism remains elusive. Nonetheless, we can still investigate the physical parameters associated with pulsar halos phenomenologically. Recently, the High-Altitude Water Cherenkov (HAWC) experiment provided updated observations of a prototypical pulsar halo, namely the Geminga halo Albert et al. (2023b). Compared to the initial work on the Geminga halo Abeysekara et al. (2017), the precision of the spatial morphology measurement has been significantly enhanced, and the gamma-ray flux has been accurately measured in distinct energy ranges. We will show that these improvements enable us to provide valuable constraints on the size of the slow-diffusion zone and the form of the PWN electron injection spectrum, thereby broadening our scope beyond simple diffusion coefficient measurements.
In this study, we ground our calculation in the two-zone diffusion model, where the slow-diffusion zone is confined to a specific vicinity around the pulsar. This phenomenological model could appropriately characterize the electron propagation associated with pulsar halos. In Sec. II, we present the calculation of the morphology and energy spectrum of the Geminga halo. In Sec. III, we fit the latest one-dimensional morphology measured by HAWC and give a lower limit for the slow-diffusion zone size using the goodness-of-fit test. In Sec. IV, we fit the gamma-ray energy spectrum of Geminga. The HAWC measurement shows a very hard spectrum in TeV. We demonstrate that this feature can be interpreted by a reasonable electron injection spectrum under the two-zone diffusion model. We provide constraints on the index of the power-law term of the injection spectrum and also estimate the maximum slow-diffusion zone size. Based on these parameter constraints, Sec. V revisits the potential for Geminga to account for the cosmic-ray positron excess. Sec. VI is the conclusion.
II Two-zone Diffusion model
The magnetic field turbulence downstream of the SNR shock could be significantly enhanced compared to the far upstream, resulting in a downstream diffusion coefficient two orders of magnitude smaller than the ISM Fang et al. (2019a); Wang et al. (2022). This suggests that the slow-diffusion environment can be understood if the pulsar remains within the downstream region of its corresponding SNR Fang et al. (2019a). Among the observed pulsar halos, the pulsar associated with the Monogem halo indeed resides within the downstream region of its corresponding SNR, which has been strongly supported by pulsar scintillation observations Yao et al. (2022). Given the scale of SNRs, the slow-diffusion zone around pulsars may span several tens of parsecs.
Alternatively, if the slow diffusion is attributed to the escaped electrons from PWNe amplifying the surrounding magnetic turbulence via streaming instability, the diffusion coefficient could only be significantly reduced in the vicinity of pulsars as the growth rate of turbulence is directly proportional to the electron number density gradient Evoli et al. (2018). Therefore, a two-zone diffusion model with a slow-diffusion zone spanning several tens of parsecs is a plausible approximation. The current paper does not discuss the scenario of interpreting pulsar halos with anisotropic diffusion.
High-energy electrons are accelerated by PWNe and subsequently released into the ISM. The electron propagation in the ISM could be described by the diffusion-loss equation as
| (1) |
where is the differential electron number density, and is the electron energy. The diffusion coefficient in the two-zone diffusion model takes the form of
| (2) |
where is the location of the pulsar, is the size of the slow-diffusion zone, and are diffusion parameters for the slow-diffusion zone, and and are those for the typical ISM. Considering the energy range of the HAWC measurement, we set the reference energy for the diffusion coefficient at TeV. This ensures that is minimally affected by the selection of . We adopt cm s-1 and as inferred from the cosmic-ray boron-to-carbon ratio Yuan et al. (2017).
The second term on the right-hand side of Eq. (1) is the energy-loss term, where is the electron energy-loss rate. We take the magnetic field strength of G for the synchrotron loss rate. For the IC scattering, we adopt the seed photon field given in Ref. Abeysekara et al. (2017) and the parametrization method given in Ref. Fang et al. (2021b) to calculate the energy-loss rate.
The third term on the right-hand side of Eq. (1) is the source term. Assuming the time profile of the source function follows the pulsar spin-down luminosity, it takes the form of
| (3) |
where is the current electron injection spectrum, is the characteristic age of the pulsar, is the pulsar spin-down time scale, and corresponds to the birth time of the pulsar. The characteristic age of Geminga is kyr as given by the Australia Telescope Nation Facility (ATNF) pulsar catalog Manchester et al. (2005), and is set to be kyr.
The injection energy spectrum is assumed to be a power law with a super-exponential cutoff as
| (4) |
where the form of the cutoff term is suggested by the mechanism of the relativistic shock acceleration Dempsey and Duffy (2007).
We numerically solve Eq. (1) using the finite volume method Fang et al. (2018). A semi-analytical method is also applicable for two-zone diffusion Osipov et al. (2020). We integrate the resulting electron number density over the line of sight from Earth to the vicinity of the pulsar to obtain the electron surface density. This allows us to derive the one-dimensional gamma-ray morphology of the halo, , using the standard calculation of IC scattering Blumenthal and Gould (1970), where is the angle away from the pulsar. The gamma-ray spectrum within an arbitrary angular radius around the pulsar is then calculated by
| (5) |
The distance of the Geminga pulsar to the Earth takes pc as measured by trigonometric parallax Faherty et al. (2007).
III Lower limit of the slow-diffusion zone size
The one-dimensional gamma-ray morphology of the Geminga halo provided by HAWC, also known as the surface brightness profile (SBP), exhibits a median energy of TeV Albert et al. (2023b). This corresponds to a parent electron energy of TeV Abeysekara et al. (2017). Therefore, the shape of the SBP is predominantly determined by the diffusion coefficient at TeV and is minimally influenced by parameters describing energy dependence, such as or . In the fitting process of this section, we consider and the normalization as free parameters. The values of and remain fixed as in the initial HAWC paper Abeysekara et al. (2017), and we find that variations in these parameters have negligible impact on the fitting results. To compare with the HAWC data, we also convolve a point spread function with a containment radius of on the model.
The SBP centered on Geminga provided by HAWC includes contributions from both the Geminga and Monogem halos. The component of the Monogem halo is determined using the SBP measurement center on Monogem, where only the data within a radius of is considered to avoid significant influence from the Geminga halo at larger angles. The Monogem halo is characterized using a one-zone diffusion model, yielding cm s-1. We fix the Monogem halo component in the following fitting process.
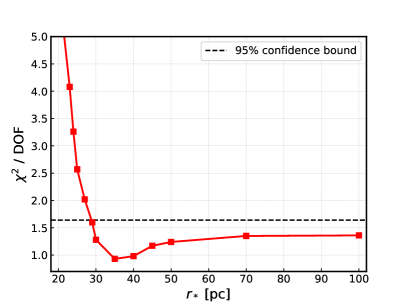
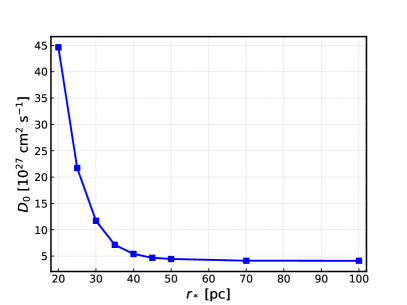
We assume varying sizes for the slow-diffusion zone and fit these models to the SBP data centered on Geminga. The minimum reduced chi-square statistic for each is illustrated in the left panel of Fig. 1. With degrees of freedom (DOF), the confidence bound for the reduced is , as marked by the dashed line in the figure. It can be seen that models with pc are excluded at the confidence level by the chi-square test. The chi-square statistic is minimized at when pc. Beyond pc, there is no significant change in the goodness of fit. The corresponding for each is depicted in the right panel of Fig. 1. When pc, the best-fit tends to be cm2 s-1, consistent with that given by the HAWC paper. For models with pc, a larger is required to widen the SBP to match the data.
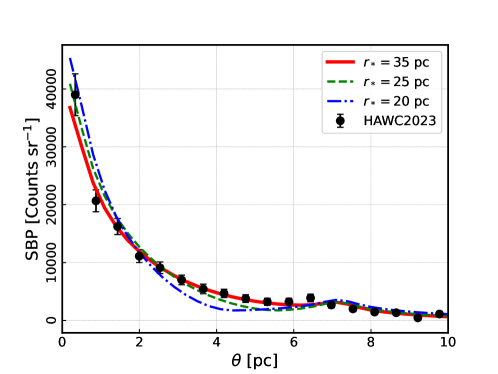
Fig. 2 provides an intuitive explanation for excluding models with a small . In the two-zone diffusion model, electrons disperse rapidly once they leave the slow-diffusion zone, resulting in a significant flux reduction in the fast-diffusion zone compared to the slow-diffusion zone. The flux of the fast-diffusion zone is so low that it is difficult to distinguish them from the background. As a result, the SBP of the pulsar halo under two-zone diffusion appears to be more contracted if is smaller, which accounts for the trend shown in the right panel of Fig. 1. If is too small, a significant reduction in flux will occur at a location too close to the pulsar. For instance, in the case of pc depicted in Fig. 2, the model significantly underestimates the data in the angular range of to due to the transition from the slow- to fast-diffusion zone. This results in a very poor goodness of fit that cannot be rectified by assuming a larger .
On the other hand, the current SBP measurement does not constrain the upper limit of . For Geminga, an angular distance of corresponds to a transverse spatial distance of pc. This means that when exceeds pc, the variation in SBP within predicted by different models is insignificant. However, as we will show in the next section, the gamma-ray energy spectrum could enable us to estimate the upper limit of .
Although HAWC also provides the preliminary SBP centered on Monogem, since the Monogem halo is significantly dimmer than the Geminga halo, the SBP is heavily influenced by the Geminga halo at large angles. The Geminga halo may display asymmetry in its morphology Chen et al. (2023), but in the absence of two-dimensional data, we cannot estimate the contribution of the Geminga halo to this SBP accurately. Therefore, we do not investigate the slow-diffusion zone size corresponding to the Monogem halo in this study.
IV Constraints of gamma-ray spectrum on parameters
The HAWC spectrum measurement of the Geminga halo ranging from TeV indicates that the electron injection spectrum is consistent with the form presented in Eq. (4), with TeV. Nevertheless, the gamma-ray spectrum from to TeV exhibits a hard nature, indicating the necessity for a hard power-law term in the injection spectrum. However, under one-zone diffusion, even though a very hard injection spectrum of is assumed, the model still does not fit the observed gamma-ray spectrum well Albert et al. (2023a).
Assuming the one-zone diffusion model with cm2 s-1 and , as used in the HAWC work, the gamma-ray flux within around the pulsar constitutes of the total angle-integrated spectrum. Consequently, the spectral measurement provided by HAWC approximately represents the integrated gamma-ray spectrum within .
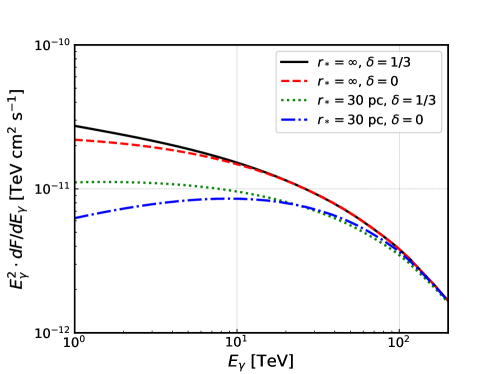
The integrated gamma-ray spectrum within a specific angle is determined not only by the electron injection spectrum but also by and , as illustrated in Fig. 3, where . Given that is constrained by the SBP data, a smaller corresponds to faster diffusion of low-energy electrons, making them more likely to escape from and consequently yielding a harder gamma-ray spectrum. Moreover, within the energy range of interest, the characteristic diffusion distance of low-energy electrons is larger than that of high-energy electrons. This implies that a smaller results in a higher proportion of low-energy electrons escaping from , thereby producing a harder gamma-ray spectrum. As can be seen from Fig. 3, the impact of on the spectral shape is significant. Therefore, under the two-zone diffusion model, a very hard injection spectrum might not be necessary. This point has also been demonstrated in our previous studies Fang et al. (2021a, 2022).
The analysis in Sec. III indicates that pc may serve as the lower limit for the slow-diffusion size, and we typically regard as the lower limit for the energy index of the diffusion coefficient. With this set of parameters, we explore the maximum permissible injection spectral index derived from the observation. We fit the integrated gamma-ray spectrum obtained from the model within to the spectral measurements of the Geminga halo by HAWC (including the flux upper limits with confidence), with , , and the normalization as free parameters. We impose constraints on using the likelihood ratio test. The likelihood ratio is defined as , where is the global maximum likelihood, and is the local maximum likelihood when the spectral index is fixed at . According to Wilks’ theorem, follows the chi-square distribution with one DOF. When equals and , we can respectively determine the and confidence bounds for .
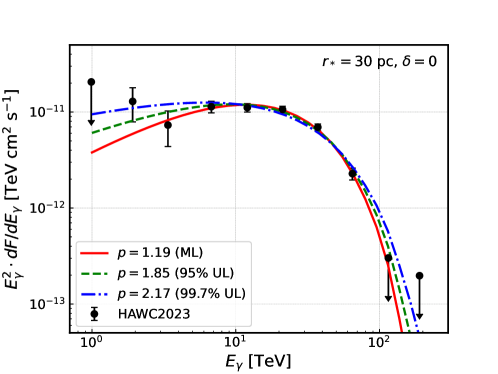
The maximum likelihood we obtained is , and the upper limits at and confidence levels are and , respectively. The fitting effects of these three scenarios on the data are illustrated in Fig. 4. It can be seen that when is larger, the model tends to overestimate the flux at low and high energy ranges while underestimating the flux at the intermediate energy range. The best-fit in different scenarios are all around TeV. For larger values, such as or , as predicted by Komolgorov’s or Kraichnan’s theory, the resulting injection spectral index is correspondingly larger. We have reiterated the fitting procedure and summarized the results in Table 1.
| maximum likelihood | upper limit | upper limit | |
|---|---|---|---|
| 0.81 | |||
| 0.59 | |||
On the other hand, we fit the spectral data under the assumption of varying values while maintaining . The derived confidence upper limits of from these fits are summarized in Table 2, indicating a decrease in the upper limit of as increases. Numerical simulations suggest that the spectral index of electrons within a bow-shock PWN could approach at the colliding flow between the stellar-wind termination shock and the bow shock Bykov et al. (2017). However, existing theories or observations do not support spectral indices to be smaller. Moreover, the x-ray PWN of Geminga exhibits two components with distinct spectral indices, with the harder and softer components corresponding to and , respectively Posselt et al. (2017). As discussed in Ref. Fang and Bi (2022), these components may indicate two disparate modes of electron escape, suggesting that the total injection spectrum could be a composite of both components. Consequently, for the Geminga halo, an injection spectral index of can be regarded as the lower limit. This allows us to estimate the upper limit of . At pc, the upper limit of falls below , suggesting that models with pc are disfavored. Combined with the lower limit obtained in Sec. III, we are able to provide a comprehensive constraint on the slow-diffusion zone size, which lies between and pc.
| [pc] | |||||
|---|---|---|---|---|---|
| UL for | 0.87 |
Recently, the x-ray observation by eROSITA provides an upper limit of G for the ISM magnetic field within around the Geminga pulsar Khokhriakova et al. (2023). This is lower than the G adopted in the initial HAWC study and our above calculations. Thus, we also consider a scenario with G, where the synchrotron energy-loss rate for electrons is significantly reduced. This change notably affects the lifetime of higher-energy electrons, thereby influencing the estimation of the cutoff term in the electron injection spectrum. When shifts from G to G in the case of pc and , the best-fit varies from TeV to TeV. However, this adjustment in magnetic field strength has a negligible effect on , with its confidence upper limit merely changing from to , leaving our conclusion unaffected.
V Implication on the positron excess
The positron excess is one of the most intriguing phenomena in cosmic-ray studies. As measured by space experiments Adriani et al. (2009); Ackermann et al. (2012); Aguilar et al. (2013), the high-energy positron spectrum significantly exceeds the predicted secondary positron flux produced by cosmic-ray nuclei spallation during Galactic propagation. Among astrophysical accelerators, pulsars (or their PWNe) are the most plausible sources of this excess Hooper et al. (2009); Yuksel et al. (2009); Yin et al. (2013), given their capacity to generate high-energy electron/positron pairs.
The positron spectrum measured by AMS-02 reveals a high-energy cutoff at GeV with a significance of Aguilar et al. (2019); Kounine (2023). As discussed in our previous studies, this cutoff is likely attributed to the cooling effect of the positrons generated by a dominant source rather than the superposition of multiple sources Fang et al. (2019b). This is due to the fact that pulsars or PWNe are unlikely to share a common acceleration limit at TeV. Among observed pulsars, the most plausible dominant sources of the measured high-energy positrons are Geminga, Monogem, and PSR B1055-52 Fang et al. (2019b); Bykov et al. (2019); Martin et al. (2022), all of which are nearby and middle-aged pulsars.
Within the framework of the two-zone diffusion model, the contribution of nearby pulsars to the positron spectrum at Earth is primarily affected by parameters such as the diffusion coefficient, the slow-diffusion zone size, and the positron injection spectrum. We use parameters determined from fitting the HAWC data (as detailed in Sec. III and IV) to predict the contribution of Geminga to the positron spectrum at Earth. As shown in Fig. 2 of Ref. Fang et al. (2019b), the positron spectrum produced by Geminga, under assumptions of pc and , is too hard compared to the AMS-02 measurement. Reducing or increasing can yield a softer positron spectrum. Intriguingly, as indicated in Table 2, an inverse correlation exists between the required and when interpreting the gamma-ray spectrum of the Geminga halo. Consequently, by setting to its lower limit of pc, we can achieve the softest possible positron spectrum at Earth. Furthermore, a smaller corresponds to faster diffusion of low-energy positrons, enabling more low-energy positrons to reach Earth and further soften the spectrum.
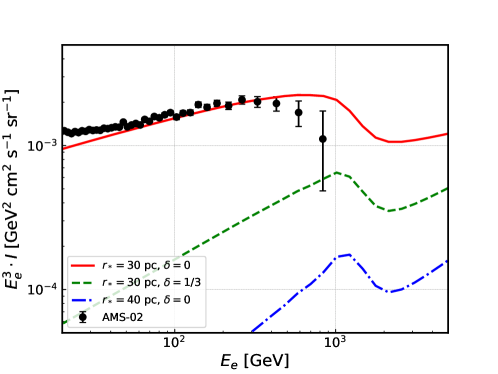
As an optimistic estimate, we adopt pc and , along with the upper limit of the injection spectrum index and the corresponding best-fit normalization derived in Sec. IV. The predicted positron energy spectrum, , depicted by the red solid line in Fig. 5, is consistent with the measurements of both absolute flux and spectral shape below GeV. However, the predicted spectral cutoff occurs at a higher energy than observed. One possible explanation is that the positrons traverse regions with higher magnetic field strength than assumed, resulting in a spectral cutoff at lower energies. Alternatively, an older pulsar, such as PSR B1055-52, could be the main contributor to the high-energy positrons instead of Geminga. Fig. 5 also shows two additional scenarios with a larger or a larger , where is set as the corresponding confidence limits presented in Tables 1 and 2. Under these conditions, the positron flux produced by Geminga is insufficient to interpret the observation.
It should be noted that the calculations above are based on extrapolating the parameters derived by the HAWC measurements to lower energies. As the positron excess primarily occurs between GeV to TeV, the GeV gamma-ray measurements of the Geminga halo would impose more direct constraints on the positron injection spectrum and the diffusion coefficient within this energy range Xi et al. (2019); Di Mauro et al. (2019); Zhou et al. (2022). However, there is no definitive conclusion on the GeV measurements of the Geminga halo at present.
VI Conclusion
Based on the latest SBP and gamma-ray spectrum measurements of the Geminga halo by HAWC, we have studied the slow-diffusion zone size () around Geminga and the parameters of the electron injection spectrum. Current theories expect slow diffusion to be confined within tens of parsecs around Geminga, leading us to employ a two-zone diffusion model to characterize electron propagation. Our results suggest that is within the range of pc. The lower end of this range is constrained by the goodness of fit when fitting the SBP with the model. Models with pc are disfavored by the chi-square test with a confidence level higher than . The SBP derived from these models declines too quickly with increasing compared to the data, owing to a significant drop in the electron number density beyond .
The upper limit of is estimated by fitting the gamma-ray spectrum of the Geminga halo, along with the expectations for the power-law index () of the electron injection spectrum based on simulations and PWN observations, where . Under the two-zone diffusion model, the derived exhibits an inverse correlation with when fitting the angle-integrated gamma spectrum within around the pulsar. For pc, the upper limit of at a confidence level falls below , implying that those models are disfavored.
Conversely, when is set to its lower limit of pc, we obtain the maximum permitted by the HAWC spectrum measurement, with an upper limit of at a confidence level. We also find that when pc and , the positron flux generated by Geminga at Earth fits well with the positron spectrum measured by AMS-02 in the GeV range, in terms of both the spectral shape and the absolute flux. Notably, the upper limit of coincides with that required to interpret the diffuse gamma-ray excess using gamma-ray pulsar halos, where Yan et al. (2023). Besides, the cutoff energy of the electron injection spectrum is determined to be TeV.
In interpreting the gamma-ray spectrum of the halo, the energy index of the diffusion coefficient () also exhibits degeneracy with and . We have considered several typical values for (, , and ). The above upper limits for and are derived under the condition of . If increases, these constraints would be stricter. For example, when , the upper limit for would decrease to . In the near future, the Large High Altitude Air Shower Observatory (LHAASO) is expected to provide energy-dependent morphology measurements for the Geminga halo, which could break the degeneracy among the parameters.
Acknowledgements.
The author would like to thank H. Zhou and R. Torres for sharing the energy range of the Geminga halo morphology measurements and the point spread function size of HAWC. This work is supported by the National Natural Science Foundation of China under grants No. 12105292 and No. U2031110.References
- Gaensler and Slane (2006) B. M. Gaensler and P. O. Slane, Ann. Rev. Astron. Astrophys. 44, 17 (2006), arXiv:astro-ph/0601081 .
- Sudoh et al. (2019) T. Sudoh, T. Linden, and J. F. Beacom, Phys. Rev. D 100, 043016 (2019), arXiv:1902.08203 [astro-ph.HE] .
- Fang (2022) K. Fang, Front. Astron. Space Sci. 9, 1022100 (2022), arXiv:2209.13294 [astro-ph.HE] .
- Liu (2022) R.-Y. Liu, Int. J. Mod. Phys. A 37, 2230011 (2022), arXiv:2207.04011 [astro-ph.HE] .
- López-Coto et al. (2022) R. López-Coto, E. de Oña Wilhelmi, F. Aharonian, E. Amato, and J. Hinton, Nature Astron. 6, 199 (2022), arXiv:2202.06899 [astro-ph.HE] .
- Evoli et al. (2018) C. Evoli, T. Linden, and G. Morlino, Phys. Rev. D 98, 063017 (2018), arXiv:1807.09263 [astro-ph.HE] .
- Fang et al. (2019a) K. Fang, X.-J. Bi, and P.-F. Yin, Mon. Not. Roy. Astron. Soc. 488, 4074 (2019a), arXiv:1903.06421 [astro-ph.HE] .
- Liu et al. (2019) R.-Y. Liu, H. Yan, and H. Zhang, Phys. Rev. Lett. 123, 221103 (2019), arXiv:1904.11536 [astro-ph.HE] .
- Wang et al. (2021) S.-H. Wang, K. Fang, X.-J. Bi, and P.-F. Yin, Phys. Rev. D 103, 063035 (2021), arXiv:2101.01438 [astro-ph.HE] .
- Fang et al. (2021a) K. Fang, S.-Q. Xi, and X.-J. Bi, Phys. Rev. D 104, 103024 (2021a), arXiv:2107.02140 [astro-ph.HE] .
- Fang and Bi (2022) K. Fang and X.-J. Bi, Phys. Rev. D 105, 103007 (2022), arXiv:2203.01546 [astro-ph.HE] .
- Fang et al. (2022) K. Fang, S.-Q. Xi, L.-Z. Bao, X.-J. Bi, and E.-S. Chen, Phys. Rev. D 106, 123017 (2022), arXiv:2207.13533 [astro-ph.HE] .
- Abeysekara et al. (2017) A. Abeysekara et al. (HAWC), Science 358, 911 (2017), arXiv:1711.06223 [astro-ph.HE] .
- Aharonian et al. (2021) F. Aharonian et al. (LHAASO), Phys. Rev. Lett. 126, 241103 (2021), arXiv:2106.09396 [astro-ph.HE] .
- Albert et al. (2023a) A. Albert et al. (HAWC), Astrophys. J. Lett. 944, L29 (2023a), arXiv:2301.04646 [astro-ph.HE] .
- Hooper et al. (2017) D. Hooper, I. Cholis, T. Linden, and K. Fang, Phys. Rev. D 96, 103013 (2017), arXiv:1702.08436 [astro-ph.HE] .
- Fang et al. (2018) K. Fang, X.-J. Bi, P.-F. Yin, and Q. Yuan, Astrophys. J. 863, 30 (2018), arXiv:1803.02640 [astro-ph.HE] .
- Tang and Piran (2019) X. Tang and T. Piran, Mon. Not. Roy. Astron. Soc. 484, 3491 (2019), arXiv:1808.02445 [astro-ph.HE] .
- Xi et al. (2019) S.-Q. Xi, R.-Y. Liu, Z.-Q. Huang, K. Fang, and X.-Y. Wang, Astrophys. J. 878, 104 (2019), arXiv:1810.10928 [astro-ph.HE] .
- Fang et al. (2019b) K. Fang, X.-J. Bi, and P.-F. Yin, Astrophys. J. 884, 124 (2019b), arXiv:1906.08542 [astro-ph.HE] .
- Manconi et al. (2020) S. Manconi, M. Di Mauro, and F. Donato, Phys. Rev. D 102, 023015 (2020), arXiv:2001.09985 [astro-ph.HE] .
- Linden and Buckman (2018) T. Linden and B. J. Buckman, Phys. Rev. Lett. 120, 121101 (2018), arXiv:1707.01905 [astro-ph.HE] .
- Dekker et al. (2023) A. Dekker, I. Holst, D. Hooper, G. Leone, E. Simon, and H. Xiao, (2023), arXiv:2306.00051 [astro-ph.HE] .
- Yan et al. (2023) K. Yan, R.-Y. Liu, R. Zhang, C.-M. Li, Q. Yuan, and X.-Y. Wang, (2023), arXiv:2307.12363 [astro-ph.HE] .
- Mukhopadhyay and Linden (2022) P. Mukhopadhyay and T. Linden, Phys. Rev. D 105, 123008 (2022), arXiv:2111.01143 [astro-ph.HE] .
- De La Torre Luque et al. (2022) P. De La Torre Luque, O. Fornieri, and T. Linden, Phys. Rev. D 106, 123033 (2022), arXiv:2205.08544 [astro-ph.HE] .
- Fang et al. (2023) K. Fang, H.-B. Hu, X.-J. Bi, and E.-S. Chen, Phys. Rev. D 108, 023017 (2023), arXiv:2304.04570 [astro-ph.HE] .
- Albert et al. (2023b) A. Albert et al. (HAWC), PoS ICRC2023, 710 (2023b).
- Wang et al. (2022) B. B. Wang, G. P. Zank, L. L. Zhao, and L. Adhikari, Astrophys. J. 932, 65 (2022).
- Yao et al. (2022) J. Yao et al., Astrophys. J. 939, 75 (2022), arXiv:2209.14059 [astro-ph.HE] .
- Yuan et al. (2017) Q. Yuan, S.-J. Lin, K. Fang, and X.-J. Bi, Phys. Rev. D 95, 083007 (2017), arXiv:1701.06149 [astro-ph.HE] .
- Fang et al. (2021b) K. Fang, X.-J. Bi, S.-J. Lin, and Q. Yuan, Chin. Phys. Lett. 38, 039801 (2021b), arXiv:2007.15601 [astro-ph.HE] .
- Manchester et al. (2005) R. N. Manchester, G. B. Hobbs, A. Teoh, and M. Hobbs, Astron. J. 129, 1993 (2005), arXiv:astro-ph/0412641 .
- Dempsey and Duffy (2007) P. Dempsey and P. Duffy, Mon. Not. Roy. Astron. Soc. 378, 625 (2007), arXiv:0704.0168 [astro-ph] .
- Osipov et al. (2020) S. M. Osipov, A. M. Bykov, A. E. Petrov, and V. I. Romansky, J. Phys. Conf. Ser. 1697, 012009 (2020).
- Blumenthal and Gould (1970) G. Blumenthal and R. Gould, Rev. Mod. Phys. 42, 237 (1970).
- Faherty et al. (2007) J. Faherty, F. M. Walter, and J. Anderson, Astrophys. Space Sci. 308, 225 (2007).
- Chen et al. (2023) E.-S. Chen et al. (LHAASO), PoS ICRC2023, 613 (2023).
- Bykov et al. (2017) A. M. Bykov, E. Amato, A. E. Petrov, A. M. Krassilchtchikov, and K. P. Levenfish, Space Sci. Rev. 207, 235 (2017), arXiv:1705.00950 [astro-ph.HE] .
- Posselt et al. (2017) B. Posselt, G. Pavlov, P. Slane, R. Romani, N. Bucciantini, A. Bykov, O. Kargaltsev, M. Weisskopf, and C. Y. Ng, Astrophys. J. 835, 66 (2017), arXiv:1611.03496 [astro-ph.HE] .
- Khokhriakova et al. (2023) A. Khokhriakova, W. Becker, G. Ponti, M. Sasaki, B. Li, and R. Y. Liu, (2023), arXiv:2310.10454 [astro-ph.HE] .
- Adriani et al. (2009) O. Adriani et al. (PAMELA), Nature 458, 607 (2009), arXiv:0810.4995 [astro-ph] .
- Ackermann et al. (2012) M. Ackermann et al. (Fermi-LAT), Phys. Rev. Lett. 108, 011103 (2012), arXiv:1109.0521 [astro-ph.HE] .
- Aguilar et al. (2013) M. Aguilar et al. (AMS), Phys. Rev. Lett. 110, 141102 (2013).
- Hooper et al. (2009) D. Hooper, P. Blasi, and P. D. Serpico, JCAP 01, 025 (2009), arXiv:0810.1527 [astro-ph] .
- Yuksel et al. (2009) H. Yuksel, M. D. Kistler, and T. Stanev, Phys. Rev. Lett. 103, 051101 (2009), arXiv:0810.2784 [astro-ph] .
- Yin et al. (2013) P.-F. Yin, Z.-H. Yu, Q. Yuan, and X.-J. Bi, Phys. Rev. D 88, 023001 (2013), arXiv:1304.4128 [astro-ph.HE] .
- Aguilar et al. (2019) M. Aguilar et al. (AMS), Phys. Rev. Lett. 122, 041102 (2019).
- Kounine (2023) A. Kounine, PoS ICRC2023, 065 (2023).
- Bykov et al. (2019) A. M. Bykov, A. E. Petrov, A. M. Krassilchtchikov, K. P. Levenfish, S. M. Osipov, and G. G. Pavlov, Astrophys. J. Lett. 876, L8 (2019), arXiv:1904.09430 [astro-ph.HE] .
- Martin et al. (2022) P. Martin, A. Marcowith, and L. Tibaldo, Astron. Astrophys. 665, A132 (2022), arXiv:2206.11803 [astro-ph.HE] .
- Di Mauro et al. (2019) M. Di Mauro, S. Manconi, and F. Donato, Phys. Rev. D 100, 123015 (2019), [Erratum: Phys.Rev.D 104, 089903 (2021)], arXiv:1903.05647 [astro-ph.HE] .
- Zhou et al. (2022) G.-Y. Zhou, Z.-H. Yu, Q. Yuan, and H.-H. Zhang, Commun. Theor. Phys. 74, 105403 (2022), arXiv:2205.07038 [astro-ph.HE] .