Brain-Inspired Reservoir Computing Using Memristors with Tunable Dynamics and Short-Term Plasticity: Supporting Information
Pennsylvania State University]Department of Mechanical Engineering, The Pennsylvania State University, 336 Reber Building, University Park, PA 16802 Pennsylvania State University]Department of Mechanical Engineering, The Pennsylvania State University, 336 Reber Building, University Park, PA 16802 Pennsylvania State University]Department of Mechanical Engineering, The Pennsylvania State University, 336 Reber Building, University Park, PA 16802
1 Supporting Figures

2 Supporting Discussion
2.1 Model Description
The conductance of the alamethicin-based memristor is directly proportional to the number of pores formed by the alamethicin peptides within the insulating DPhPC membrane when exposed to a suprathreshold voltage. Furthermore, as voltage is applied, the membrane area increases due to electrowetting, leading to a further increase in the conductance. This phenomenon can be modeled using the following equation:
| (1) |
where is the number of alamethicin pores per unit area, and is the area of the lipid membrane. Furthermore, the conductance, , can be expressed as follows:
| (2) |
where is the average conductance per alamethicin pore1. Based on the works of Najem et al. 1, the state equation for can be expressed as a first-order system:
| (3) |
where is the time constant and is the steady-state number of open pores per area2. These two terms are also exponential functions of voltage and the full equation can be expanded as:
| (4) |
where , , , and are the time constant with applied, the number of pores open at , the voltage required to drive an -fold increase in , and the voltage required to drive an -fold increase in respectively. These four parameters determine both the nonlinearity and the time constant of the memristor’s conductance response. The model of an alamethicin-based memristor is described in more detail by Eisenberg et al. 2 and Najem et al. 1. As an extension of the Eisenberg model, we introduce an additional condition into the model. This condition modifies certain parameters when the applied voltage surpasses the insertion threshold, , as follows:
| (5) |
where is the empirically-determined ion channel insertion threshold, and , , , and are the parameters of the model below and above the threshold, respectively. These additional terms and the conditional statement allow the model to fit experimental data at relatively high voltages and frequencies. Boheim et al. 3 described a similar implementation of the alamethicin model. In this study, we investigate how variations in material composition can impact these seven parameters, resulting in distinct temporal responses for each composition under identical inputs. Specifically, we manipulate the concentration of alamethicin peptides and perform parameter fitting for each concentration, as outlined in Equation 5 (see Methods section).
2.2 Model Fitting
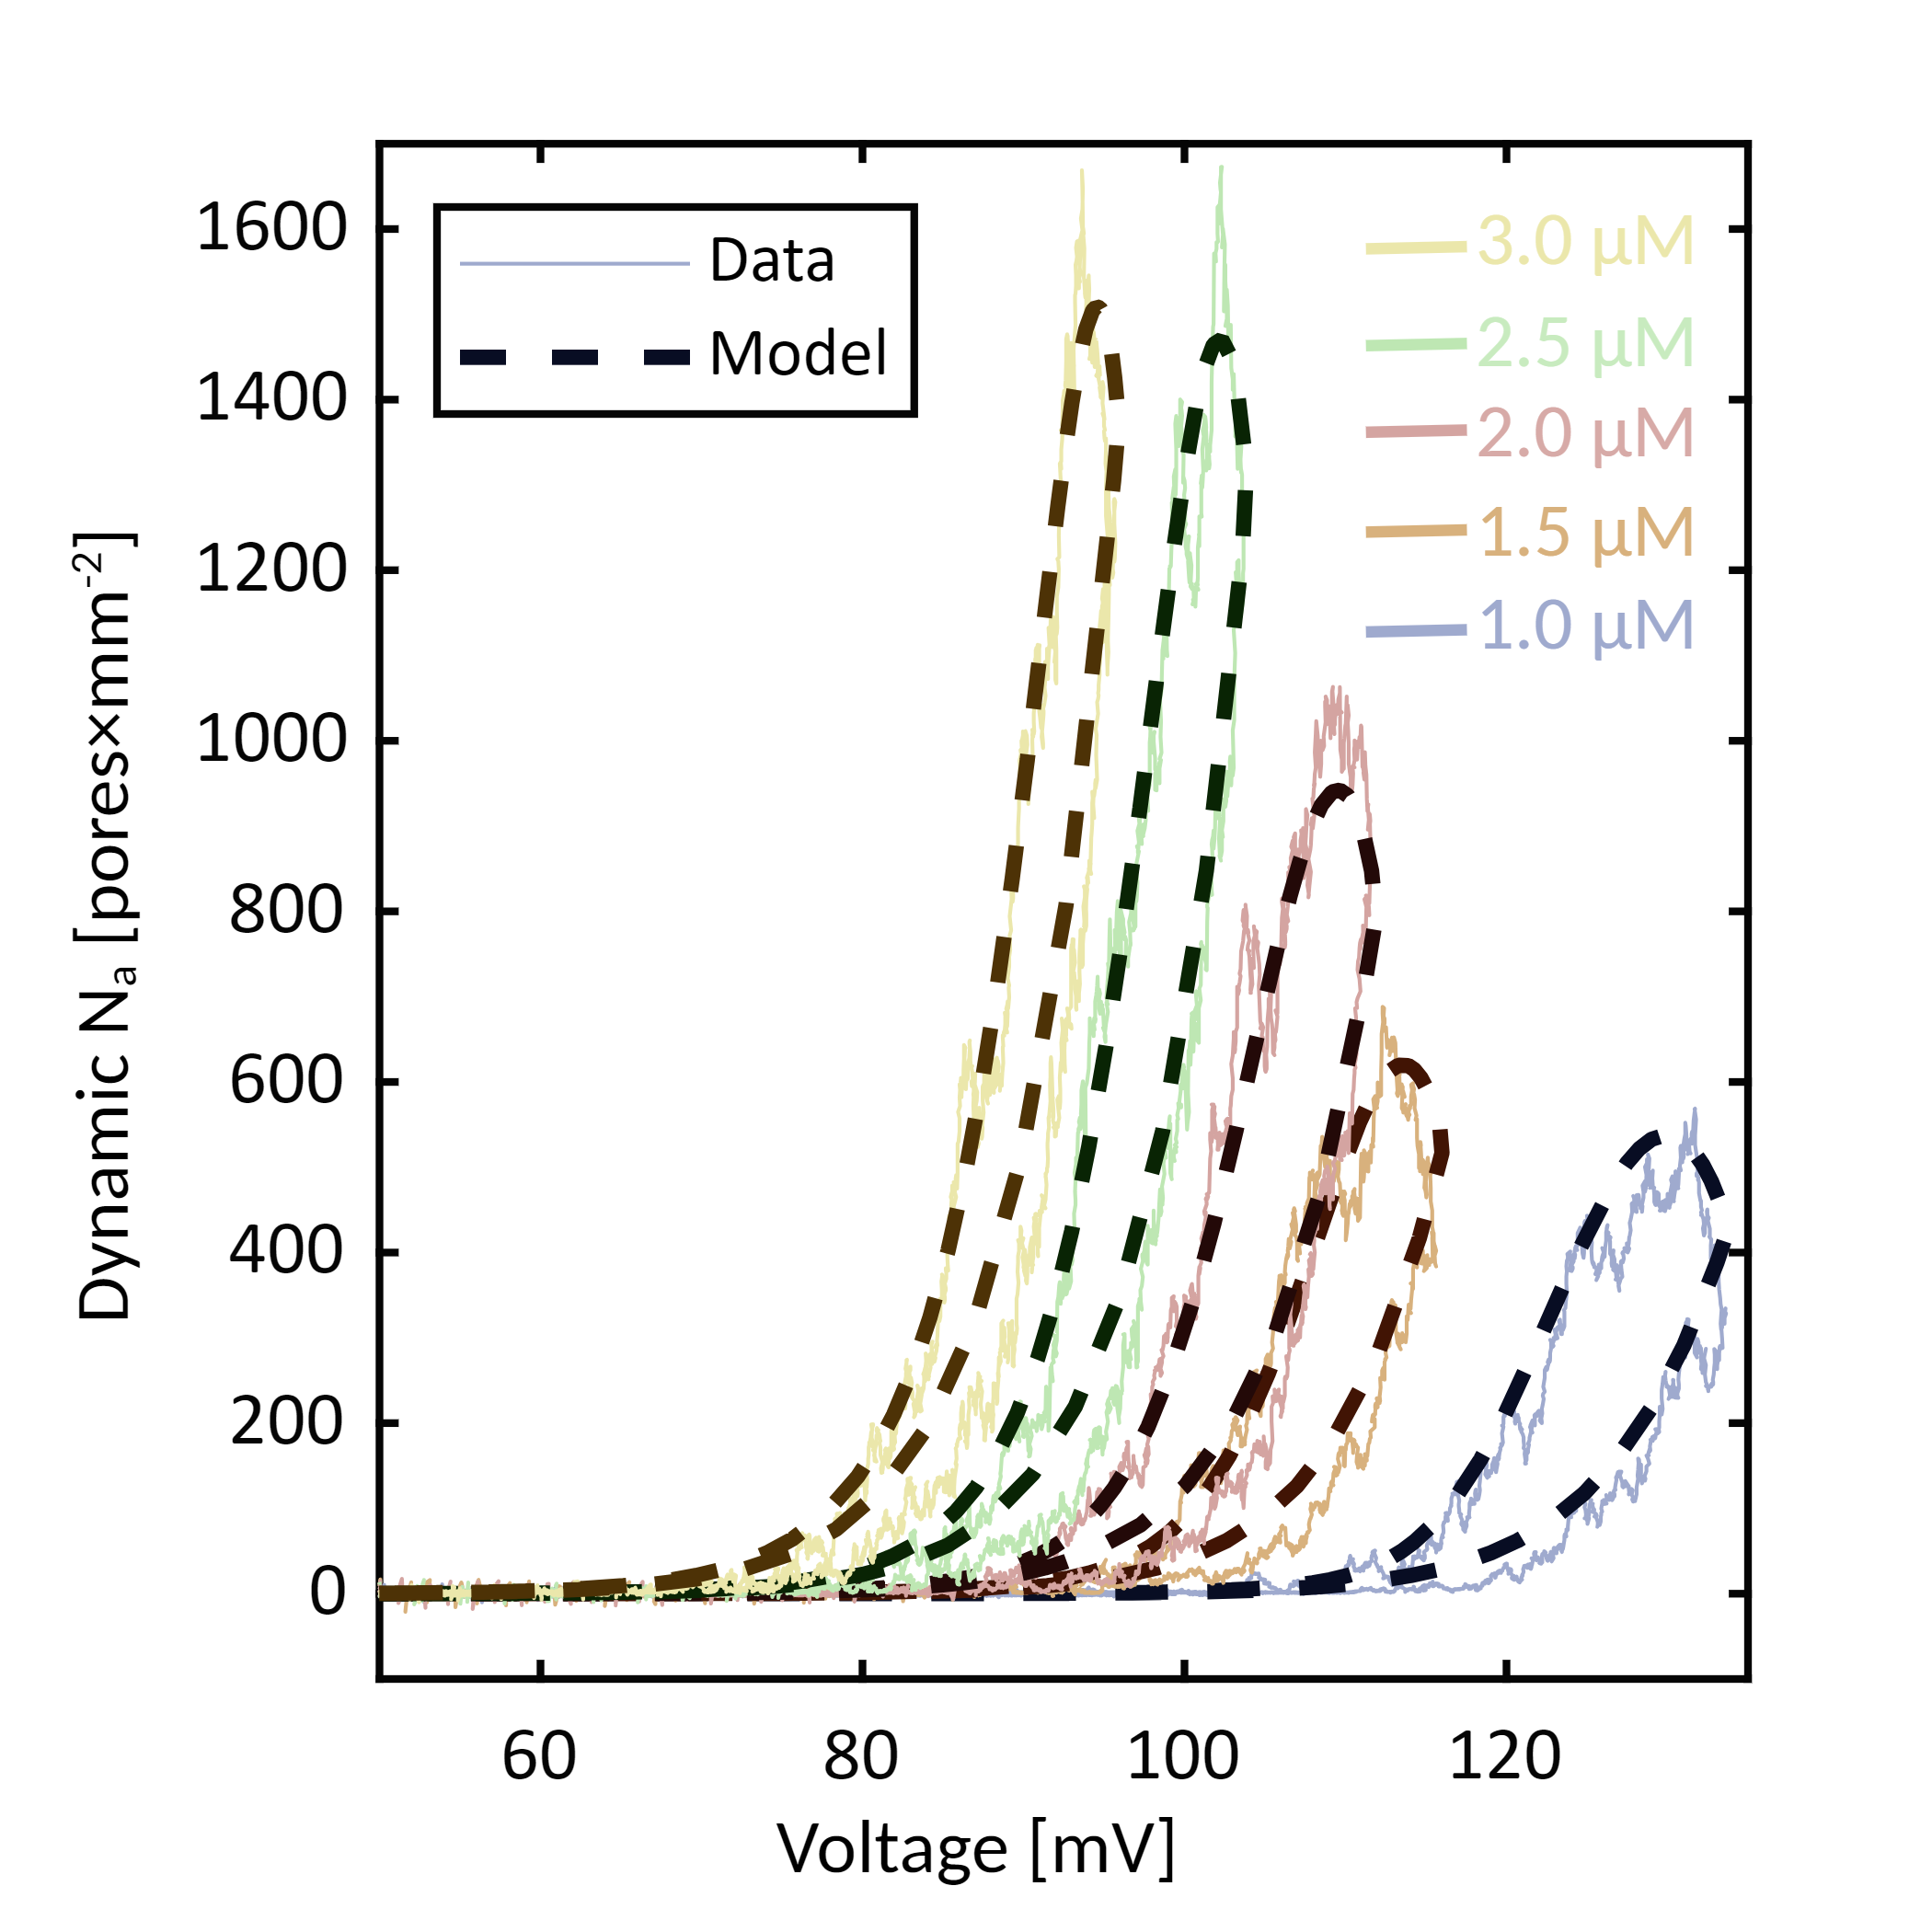
To find the parameters for exactly 1 M KCl and 10 mM MOPS, as well as various alamethicin concentrations, a consistent parameter-fitting routine was required. The fitting procedure, as described in the main text and elaborated here, was followed to generate the parameters presented in Table S1. In Figure S4, a sample of the waveforms used to stimulate the devices and an example of the recorded response is displayed. Initially, a slow voltage sweep at 2 mHz was chosen to determine the steady-state conductance relationship with voltage. The symmetric response observed in both the rising and falling voltage regions, as shown in Figure S2a, indicates that the sweep rate is slow enough to achieve an approximately steady-state conductance at each voltage point swept over. Sweeping at a faster rate, such as 200 mHz, results in an asymmetric conductance response, as seen in Figure S1. The slow sweep current response is divided by the applied voltage at each time step to calculate conductance values. These conductance values are then further divided by the area of the DIB and the conductance of an average alamethicin pore to determine the number of alamethicin pores per unit area. The fitting process involves applying a simple exponential function:
| (6) |
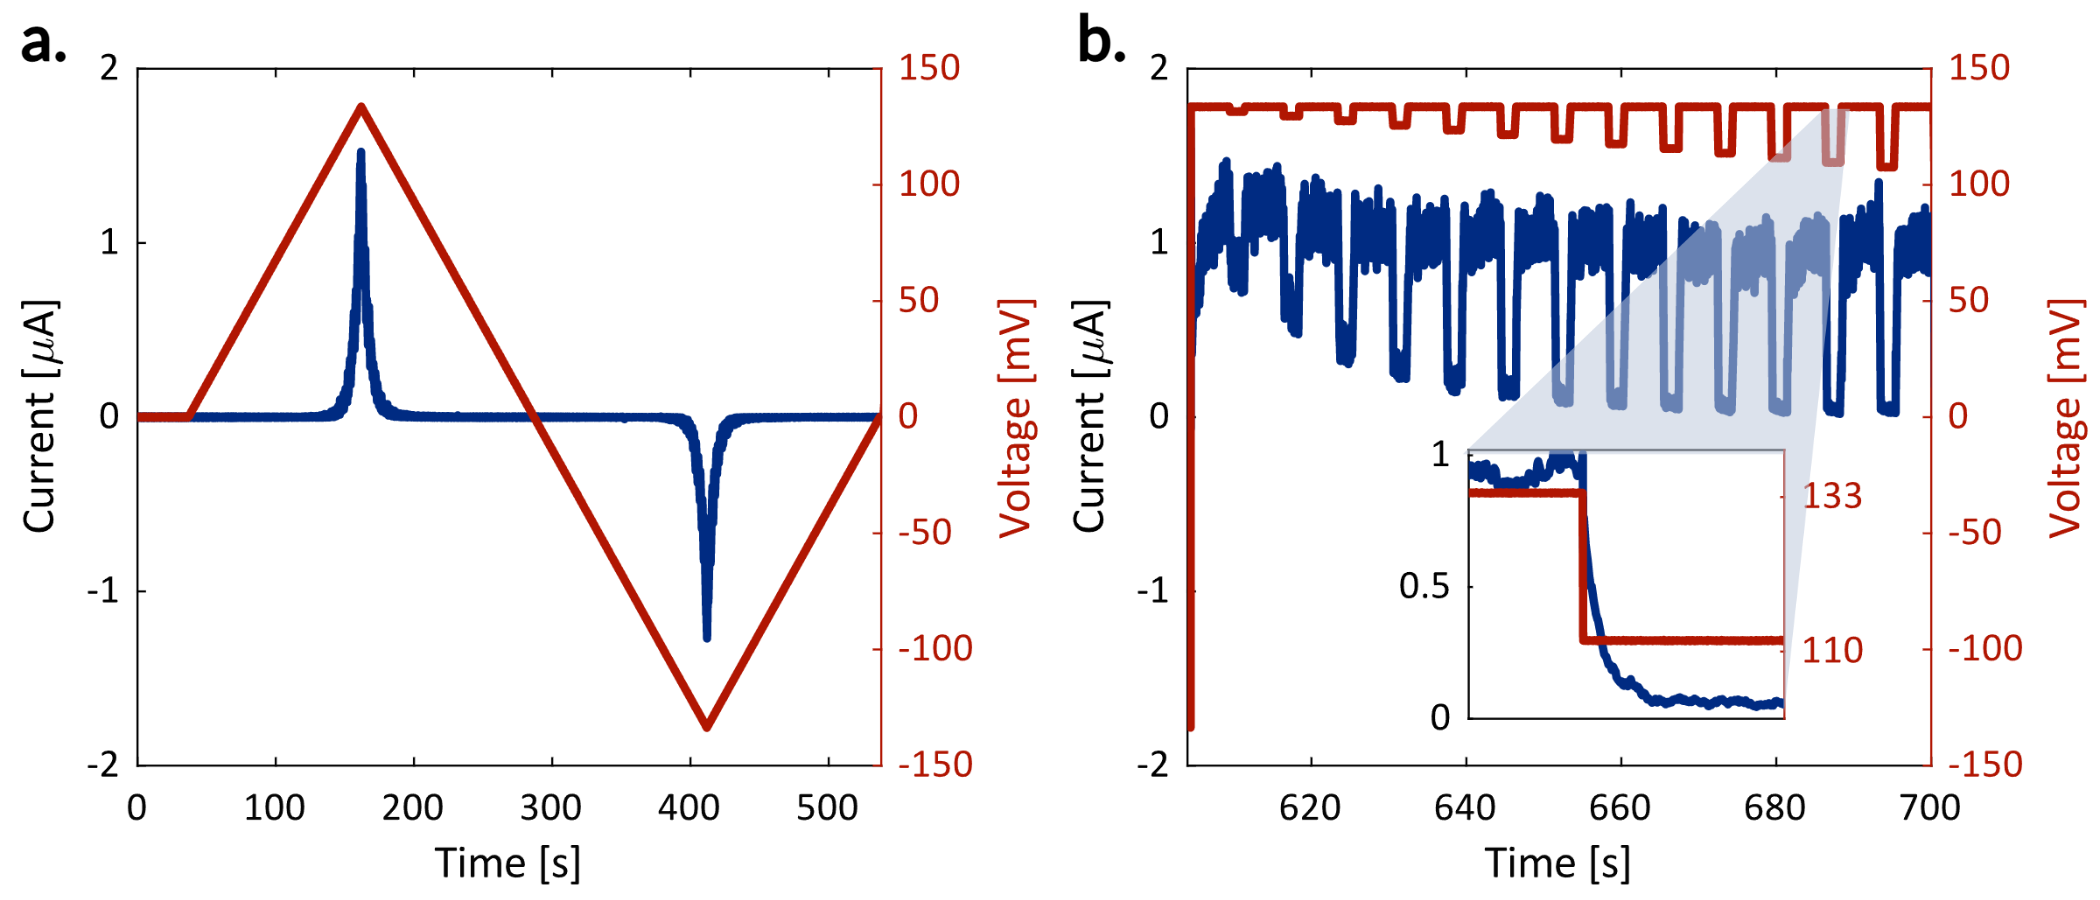
This equation approximates the steady-state number of pores per area, and it is very accurate for large values of . However, it is non-zero for all subthreshold voltages, which in reality, will have precisely zero pores formed. Therefore, in practice, this model is impractical for use with sub-macroscopic currents ( 10 nA). Despite this, this model assumption faithfully reproduces large conductance responses in response to a wide range of voltages as shown in Figure S1. Next, the time constants were fit to a function of voltage as well. The time constants, as explained in the main text, are determined by reducing the voltage from an initially held higher value to a lower inspection voltage. Figure S2b shows a sample of the voltage waveform and current response. These current responses were divided by the voltage applied to obtain conductance. The time constant of the decay was found by fitting the response to a simple exponential function in time:
| (7) |
where , , , and are the conductance, time, a fitted scaling parameter, and the time constant, respectively. In the original formulations of the alamethicin model, the time constants had a similar relationship to voltage as the steady-state number of inserted pores:
| (8) |
For low voltages and low concentrations, this simple function is sufficient to explain the empirical relationship1, 4, 2. Nevertheless, we noticed a deviation from this relationship at elevated voltages and conductances, which became more pronounced at even higher voltages. As such, we split the fitting into two separate conditional sections. From applied voltages below the threshold, , we fit a single exponential relationship as follows:
| (9) |
On the other hand, for voltages above the switching threshold, , we fit a separate exponential as follows:
| (10) |
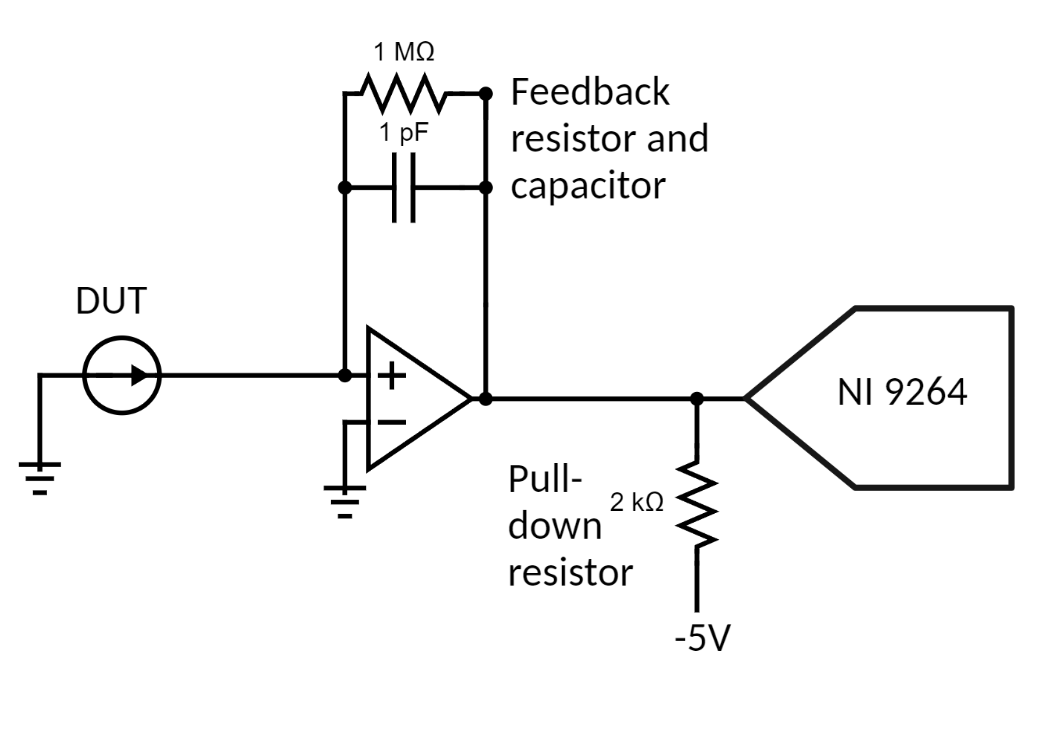
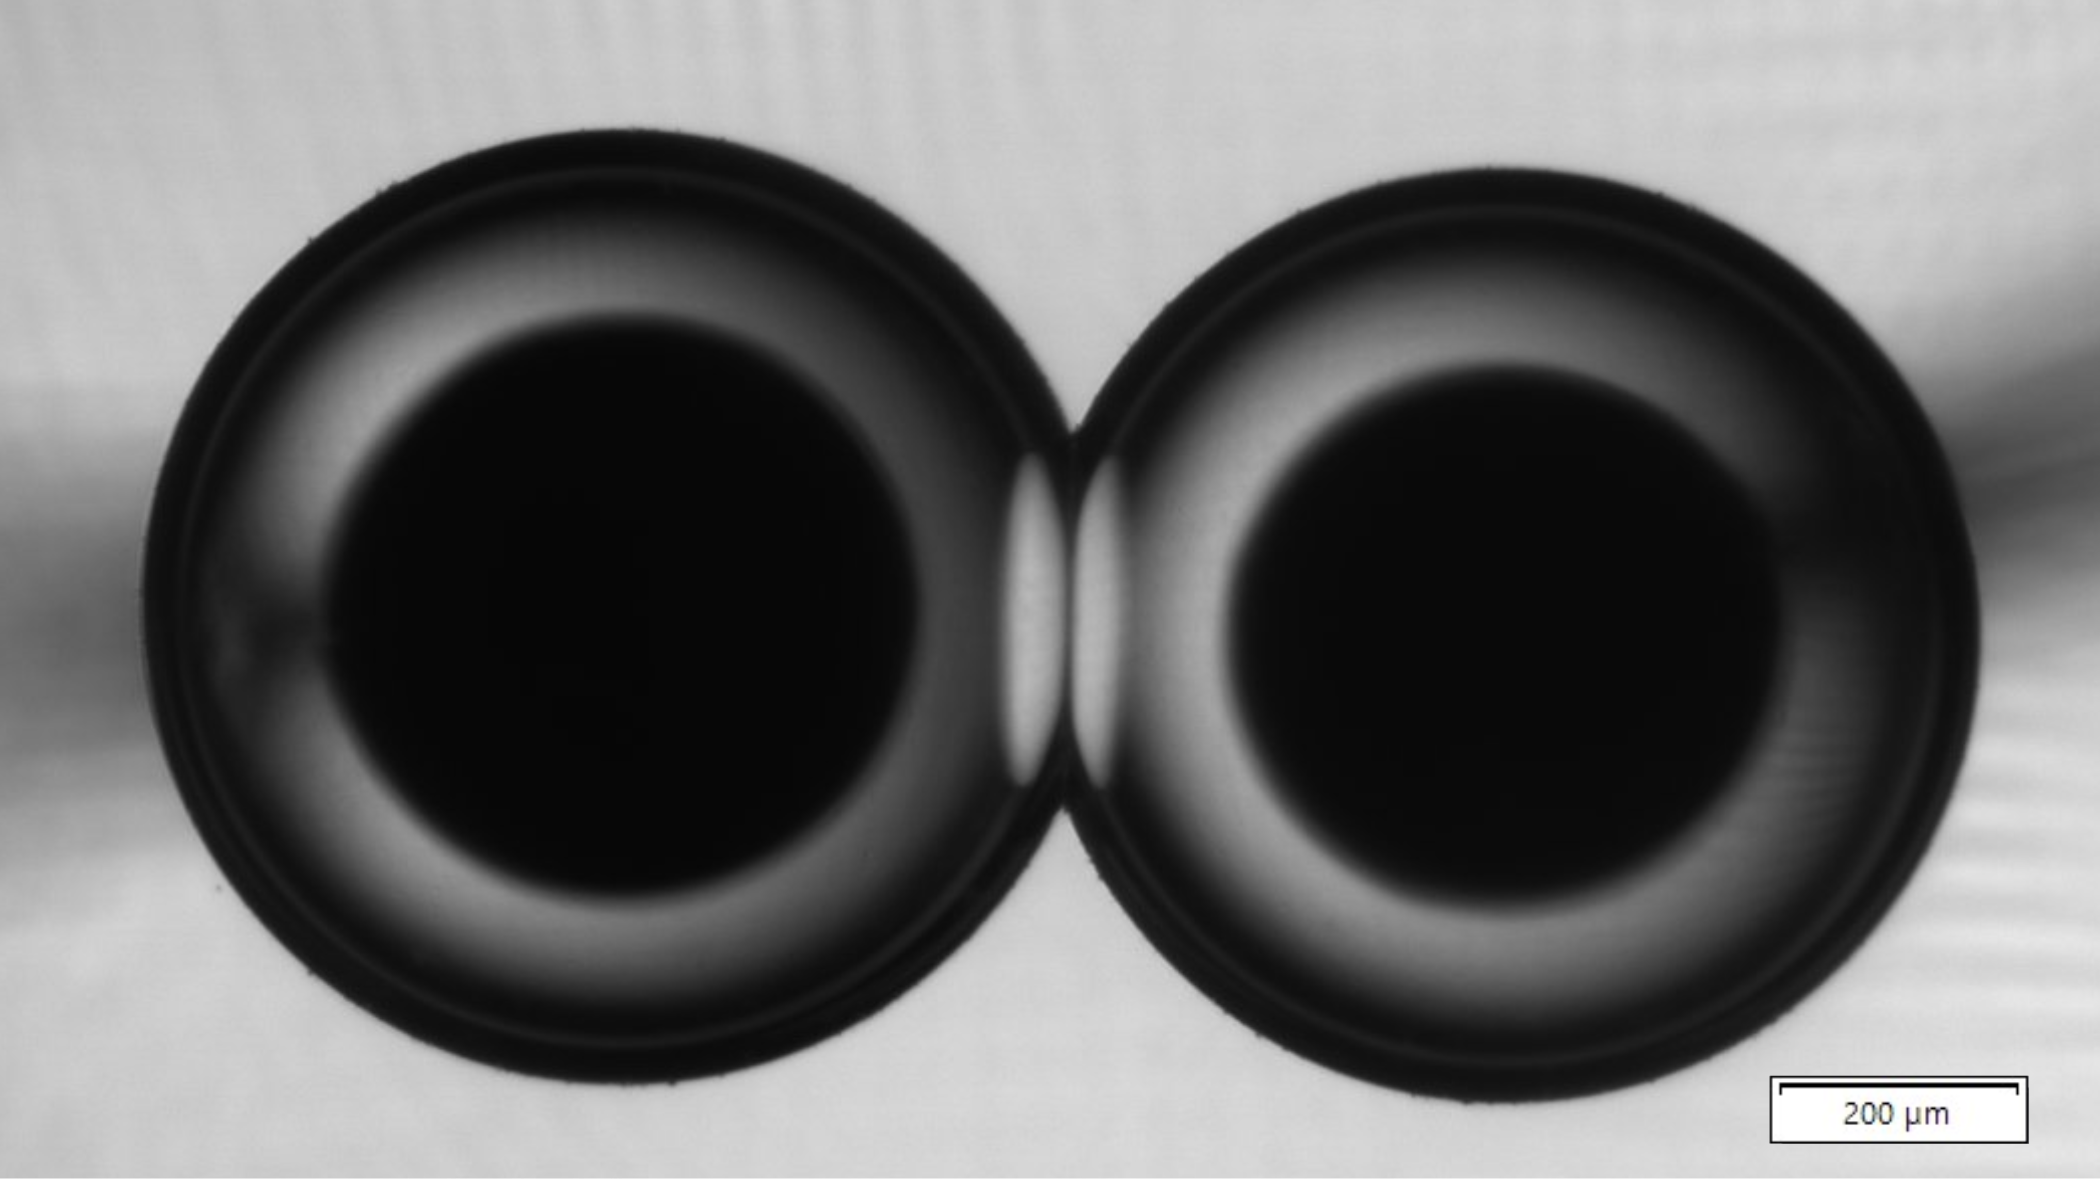
This adjustment allowed our model to successfully predict the memristors’ conductance response to long waveforms of medium to high voltages (Figure S4b) by increasing model fidelity in a larger region of input values. Finally, due to constructing lipid bilayers using the hanging-drop method, bilayer area changes as a function of voltage 1. In operations at near-constant voltages (varying by only a few tens of mV), the change in bilayer area is negligible. However, when fitting for the model parameters, wide ranges of voltages are applied, and the change in membrane area is significant. This is relevant because the conductivity of the membrane scales linearly with increased area, and these bilayer area changes are also transient in time. To account for these changes and to exclude their effect on the model, a video recording of the droplet interface bilayers was taken while the fitting waveforms were applied. Changes in area were determined by visual changes in the contact diameter between the two droplets. Videos synchronized with the voltage waveforms allowed us to divide the measured conductance at all time steps by the membrane area to find the conductance per area, . Furthermore, we divided by , which represents the average conductance per alamethicin pore, with the specific value of being sourced from the literature 4. The resulting normalized value, , represents the number of pores per unit area and is the variable evaluated in the state equation (Supplemental Equation 5)
2.3 SONDS task and signal-to-noise ratio
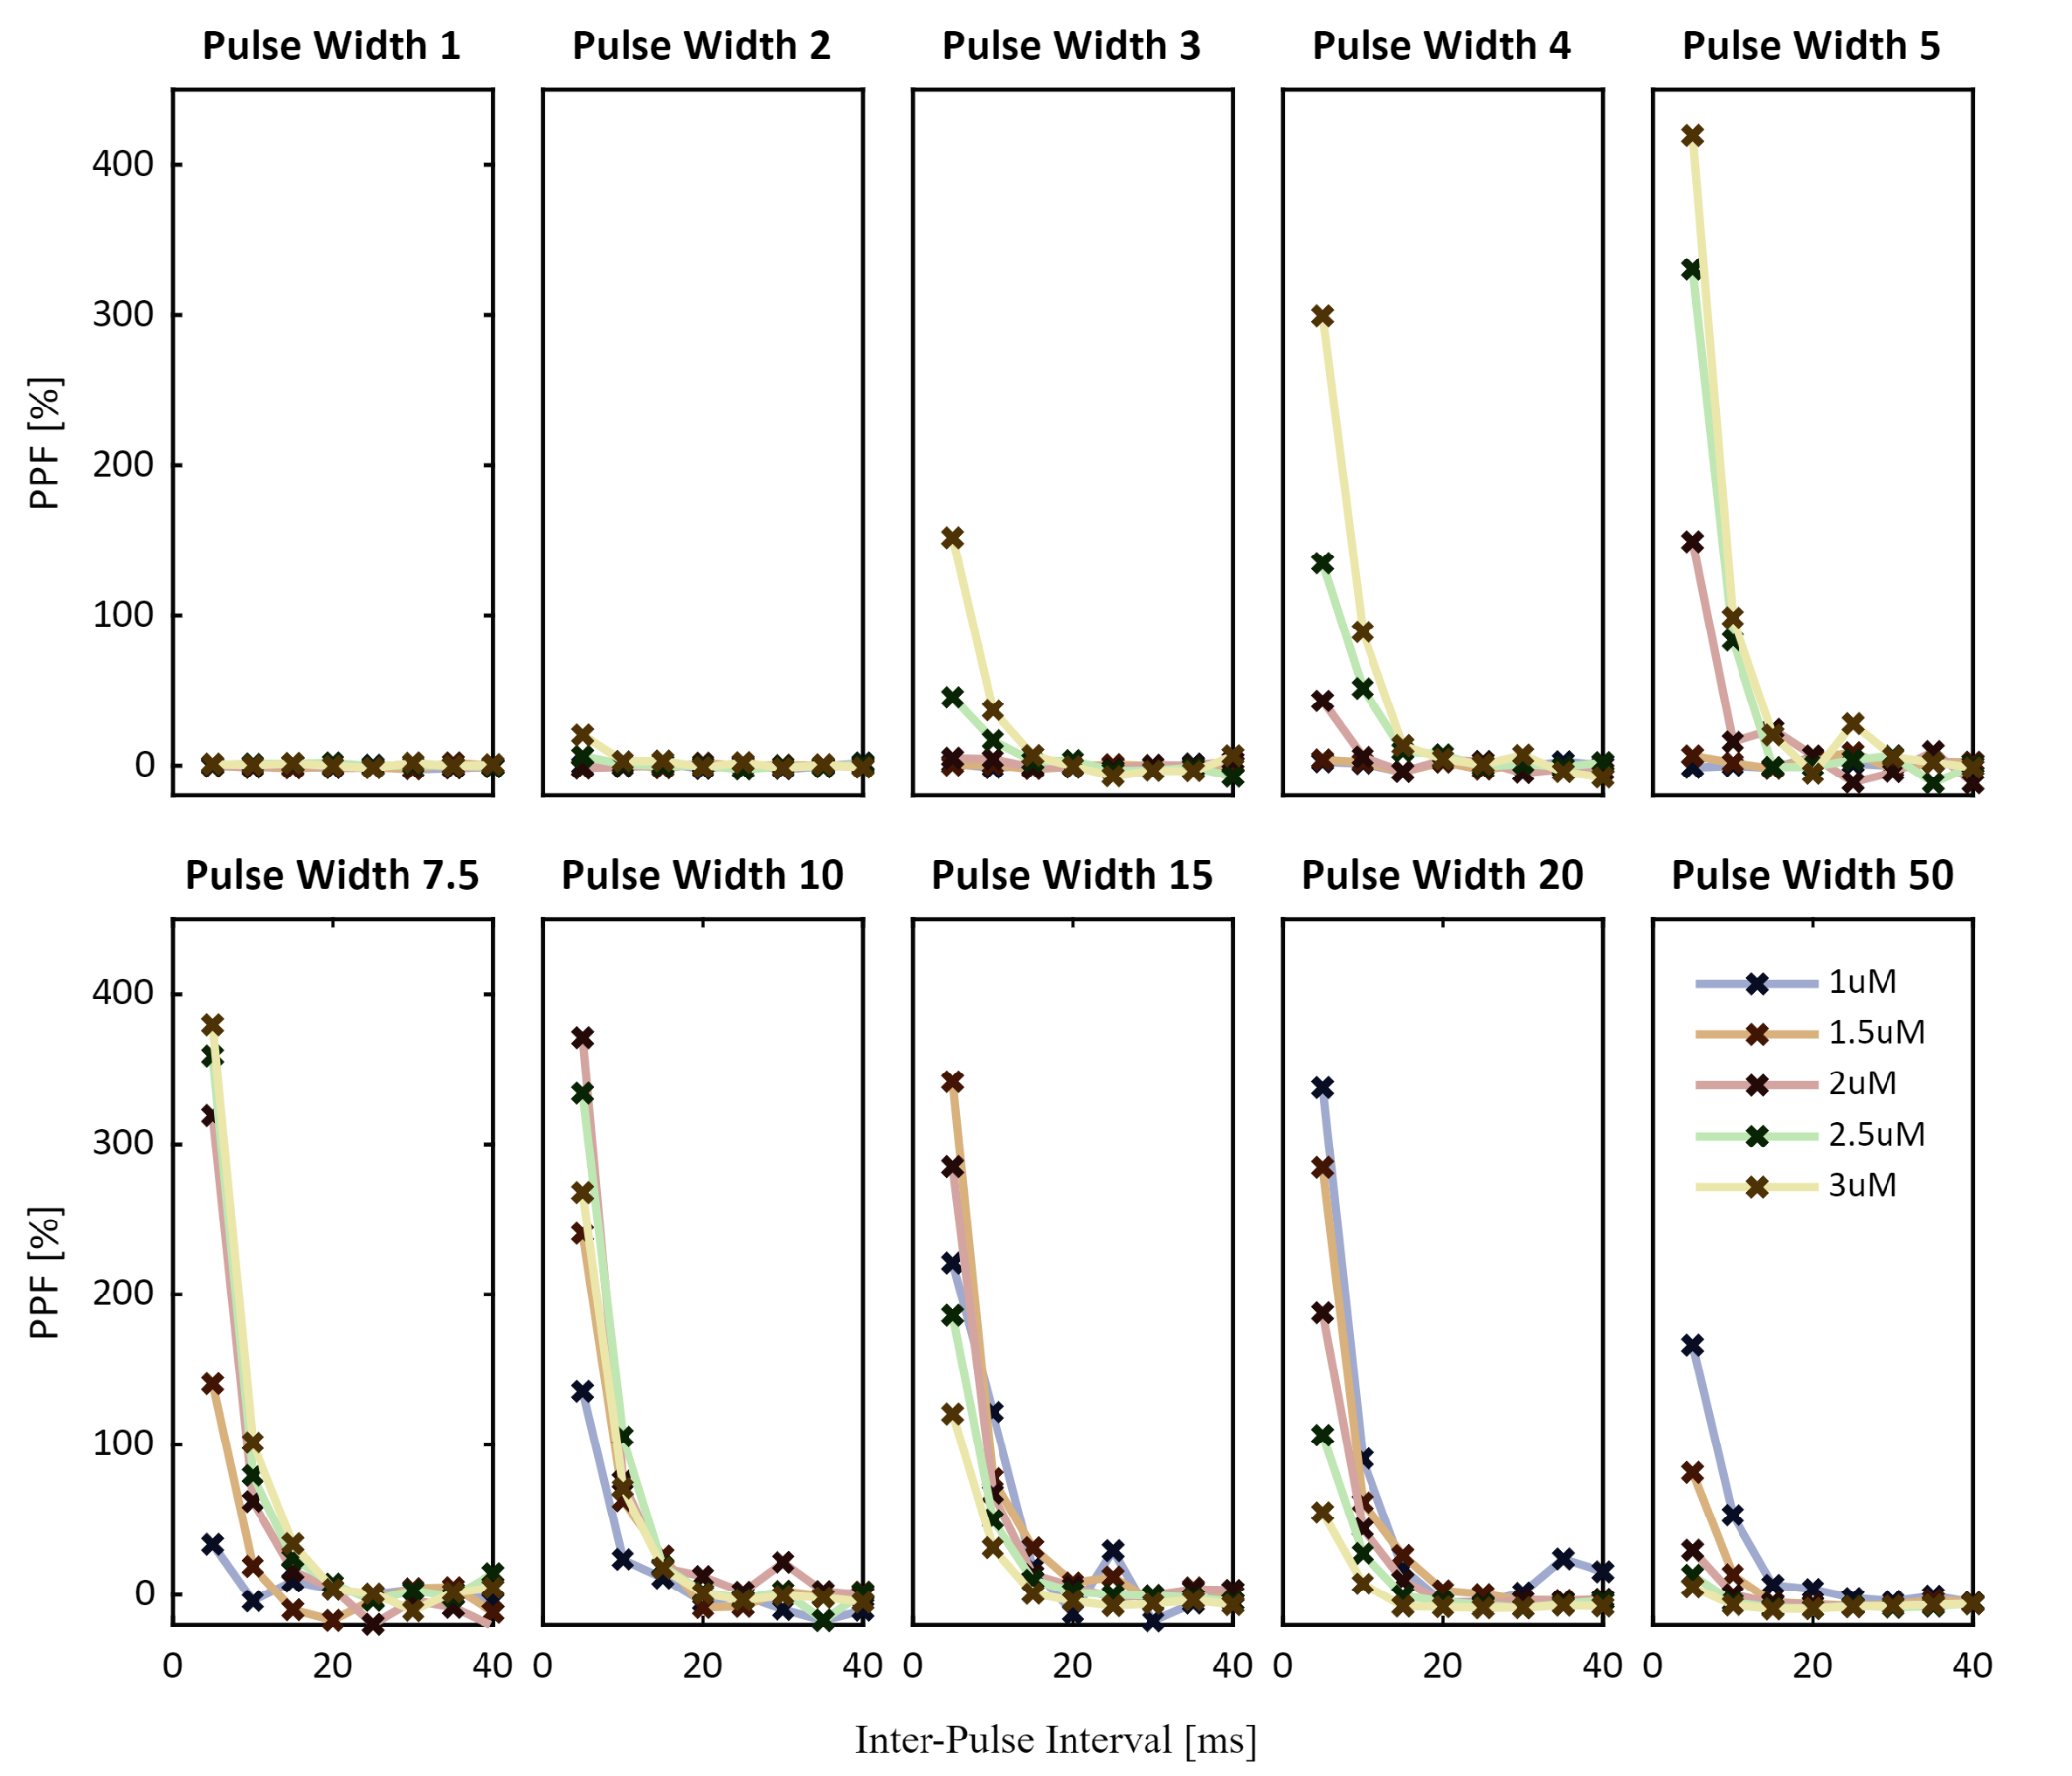
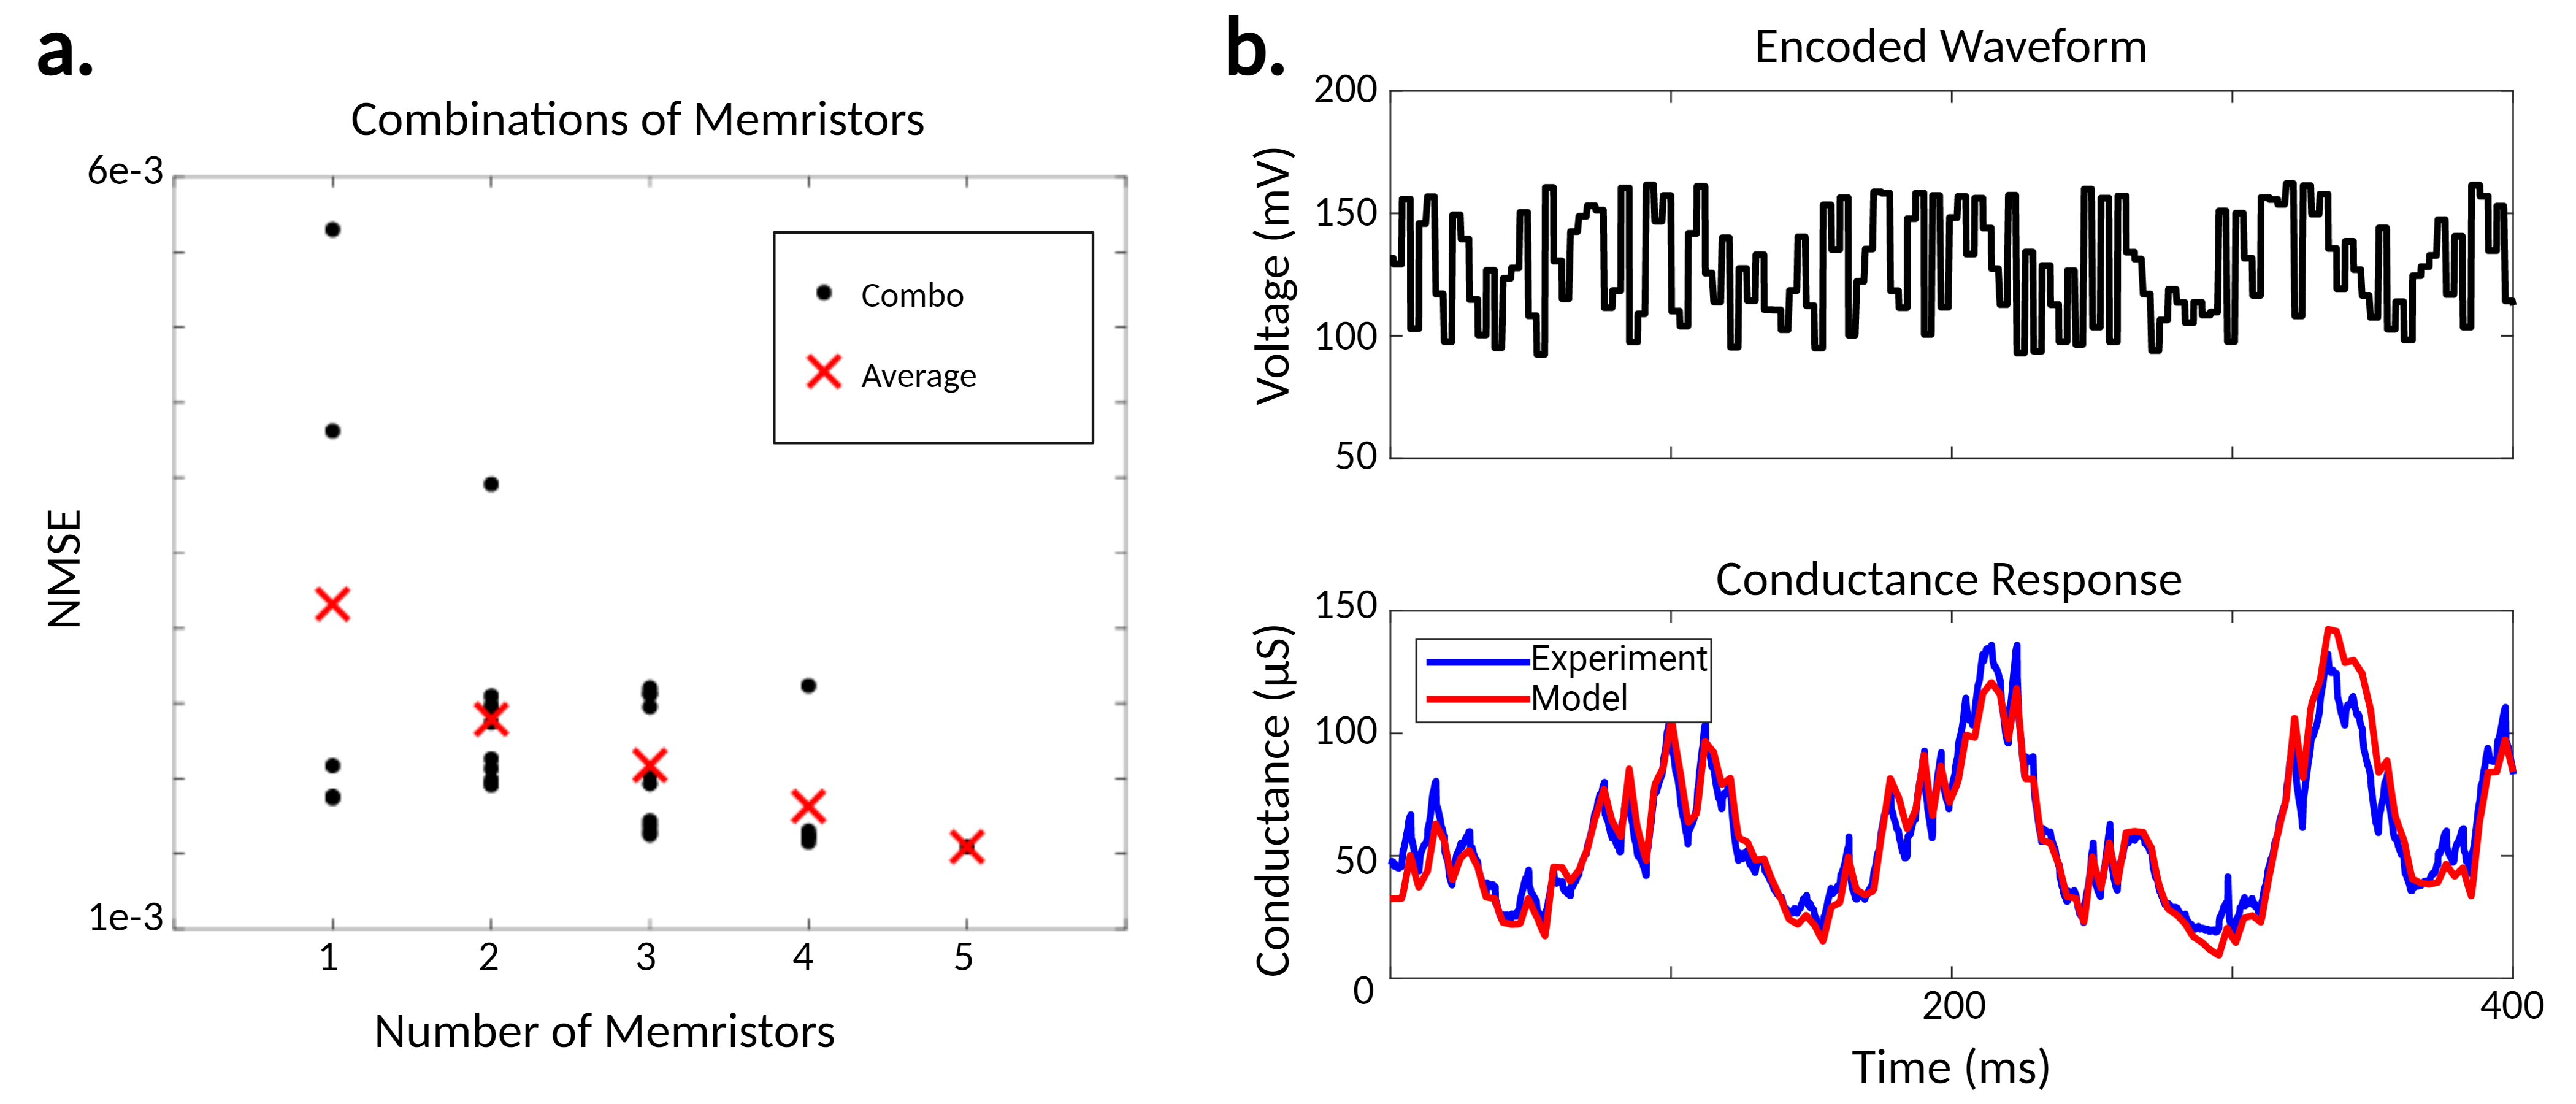
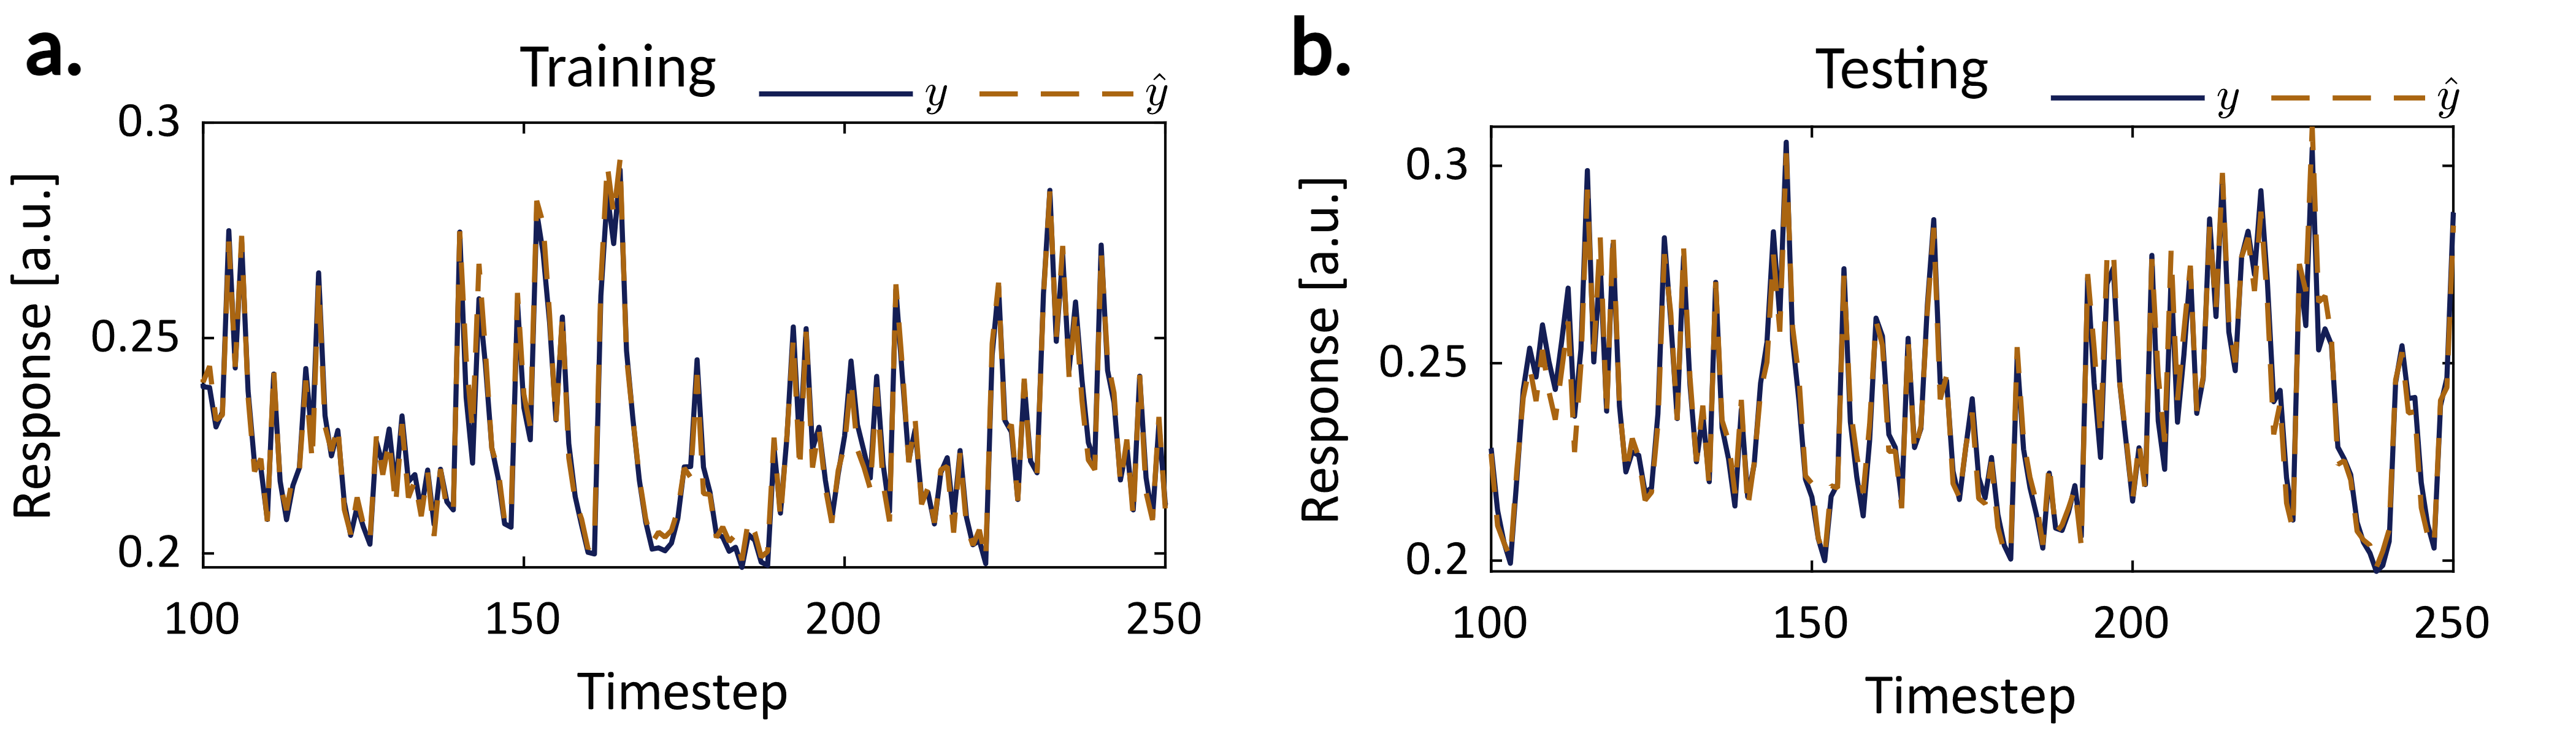
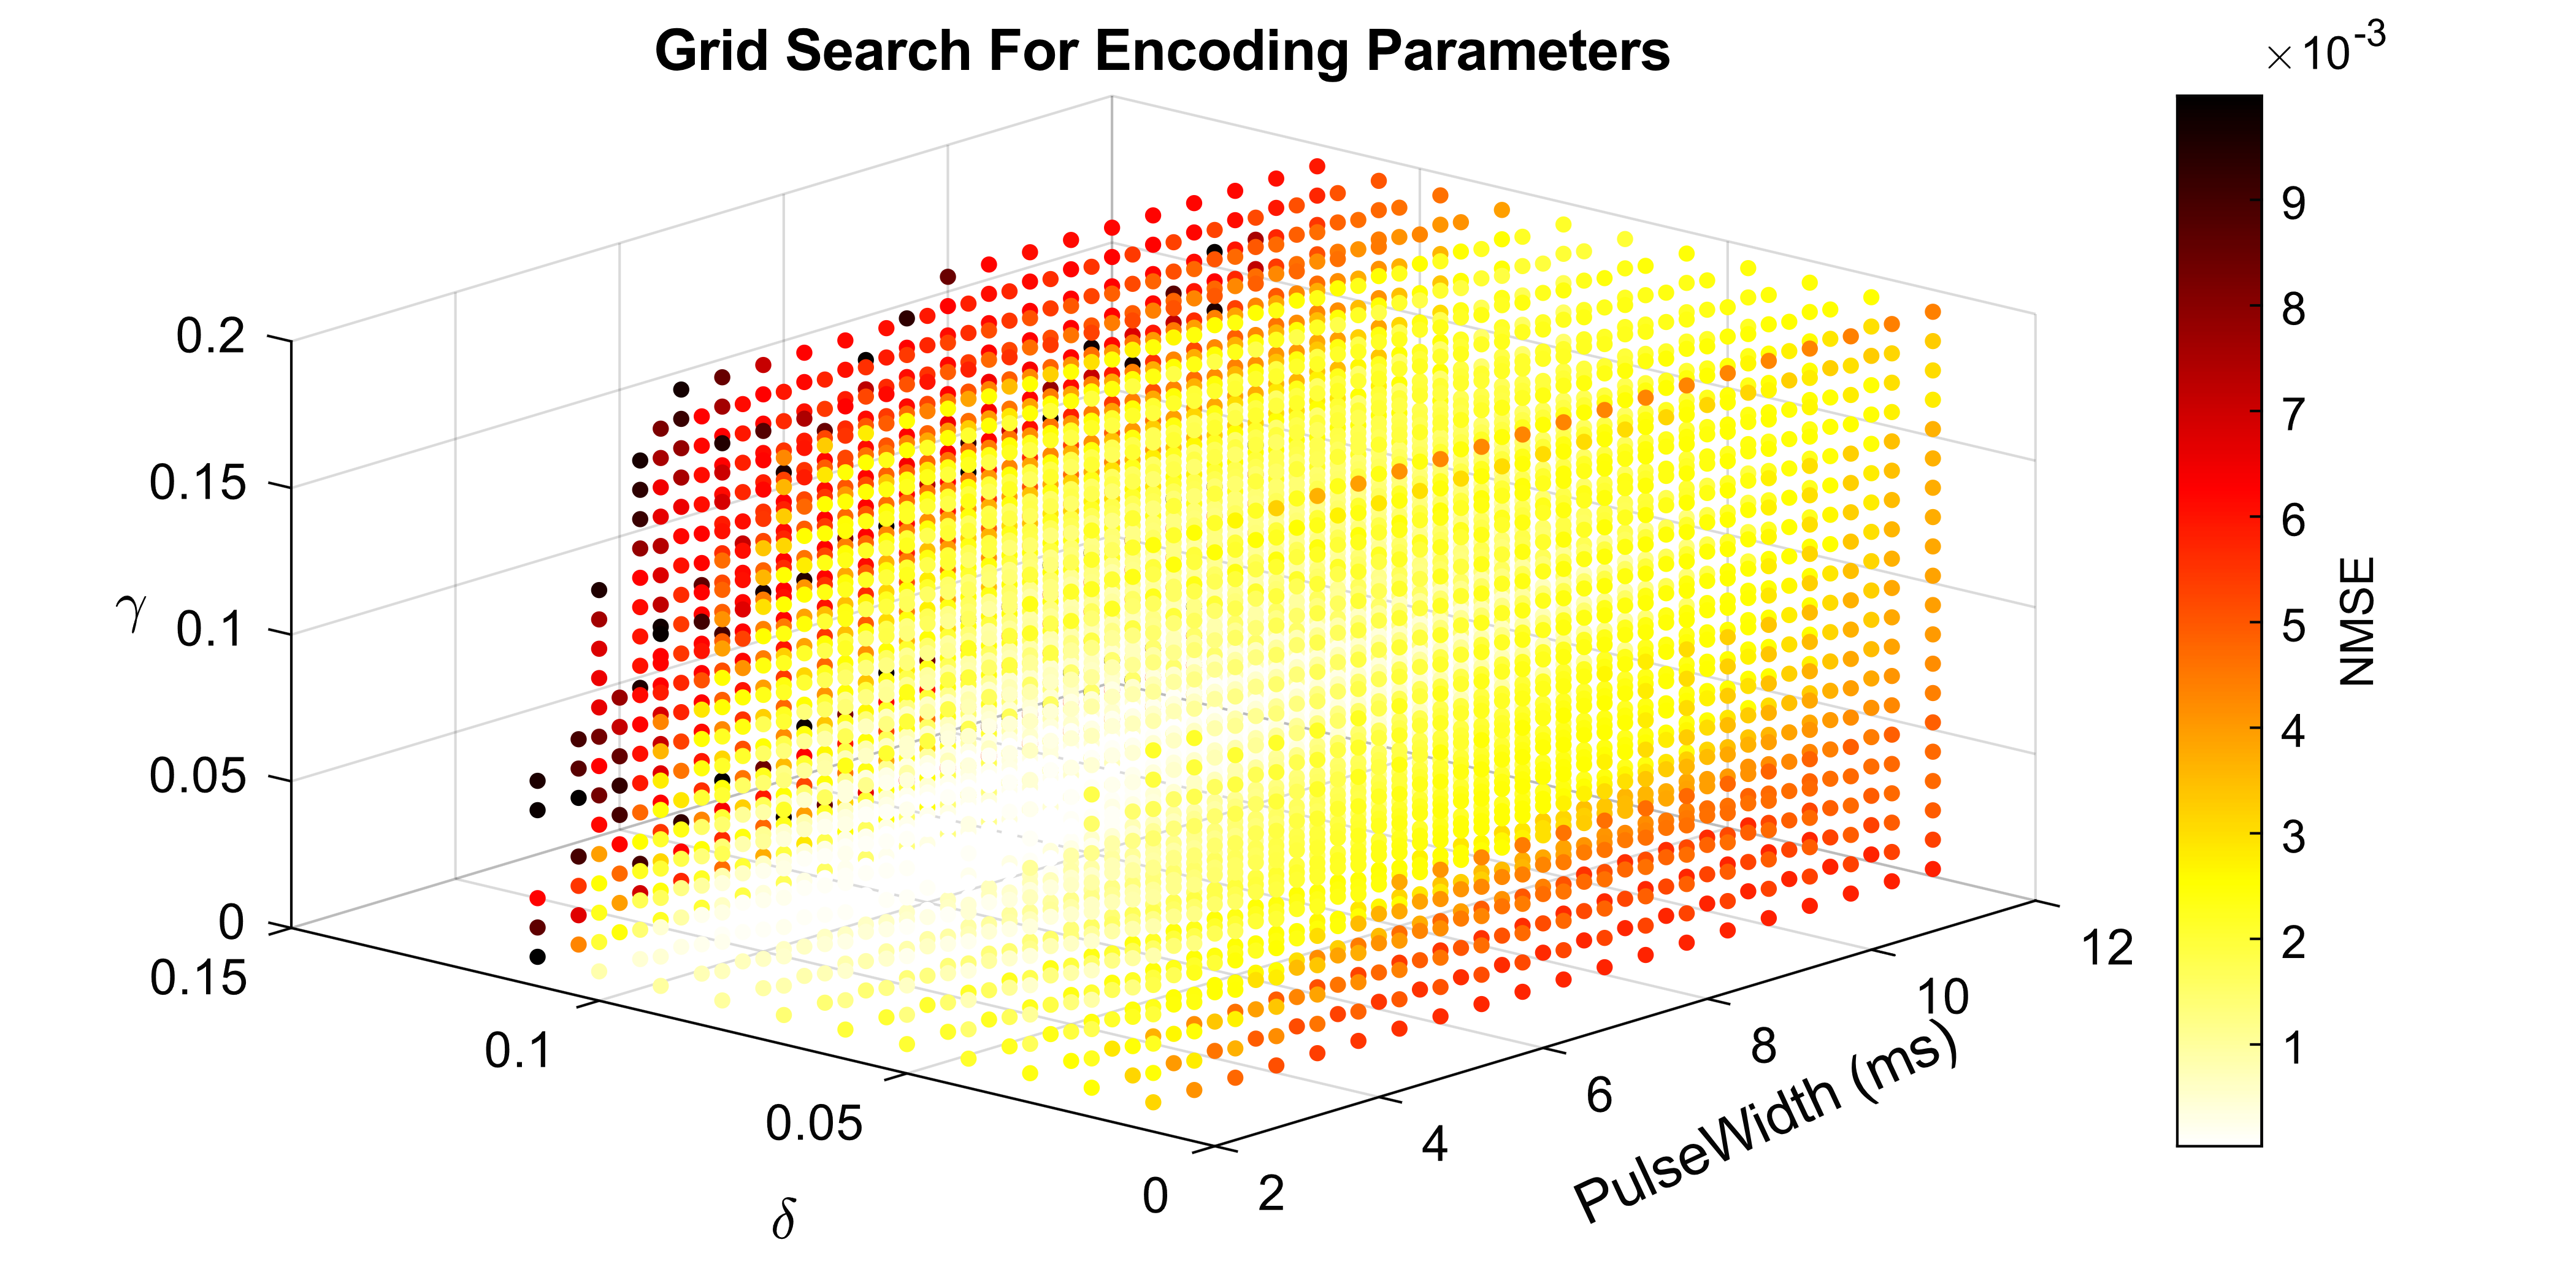
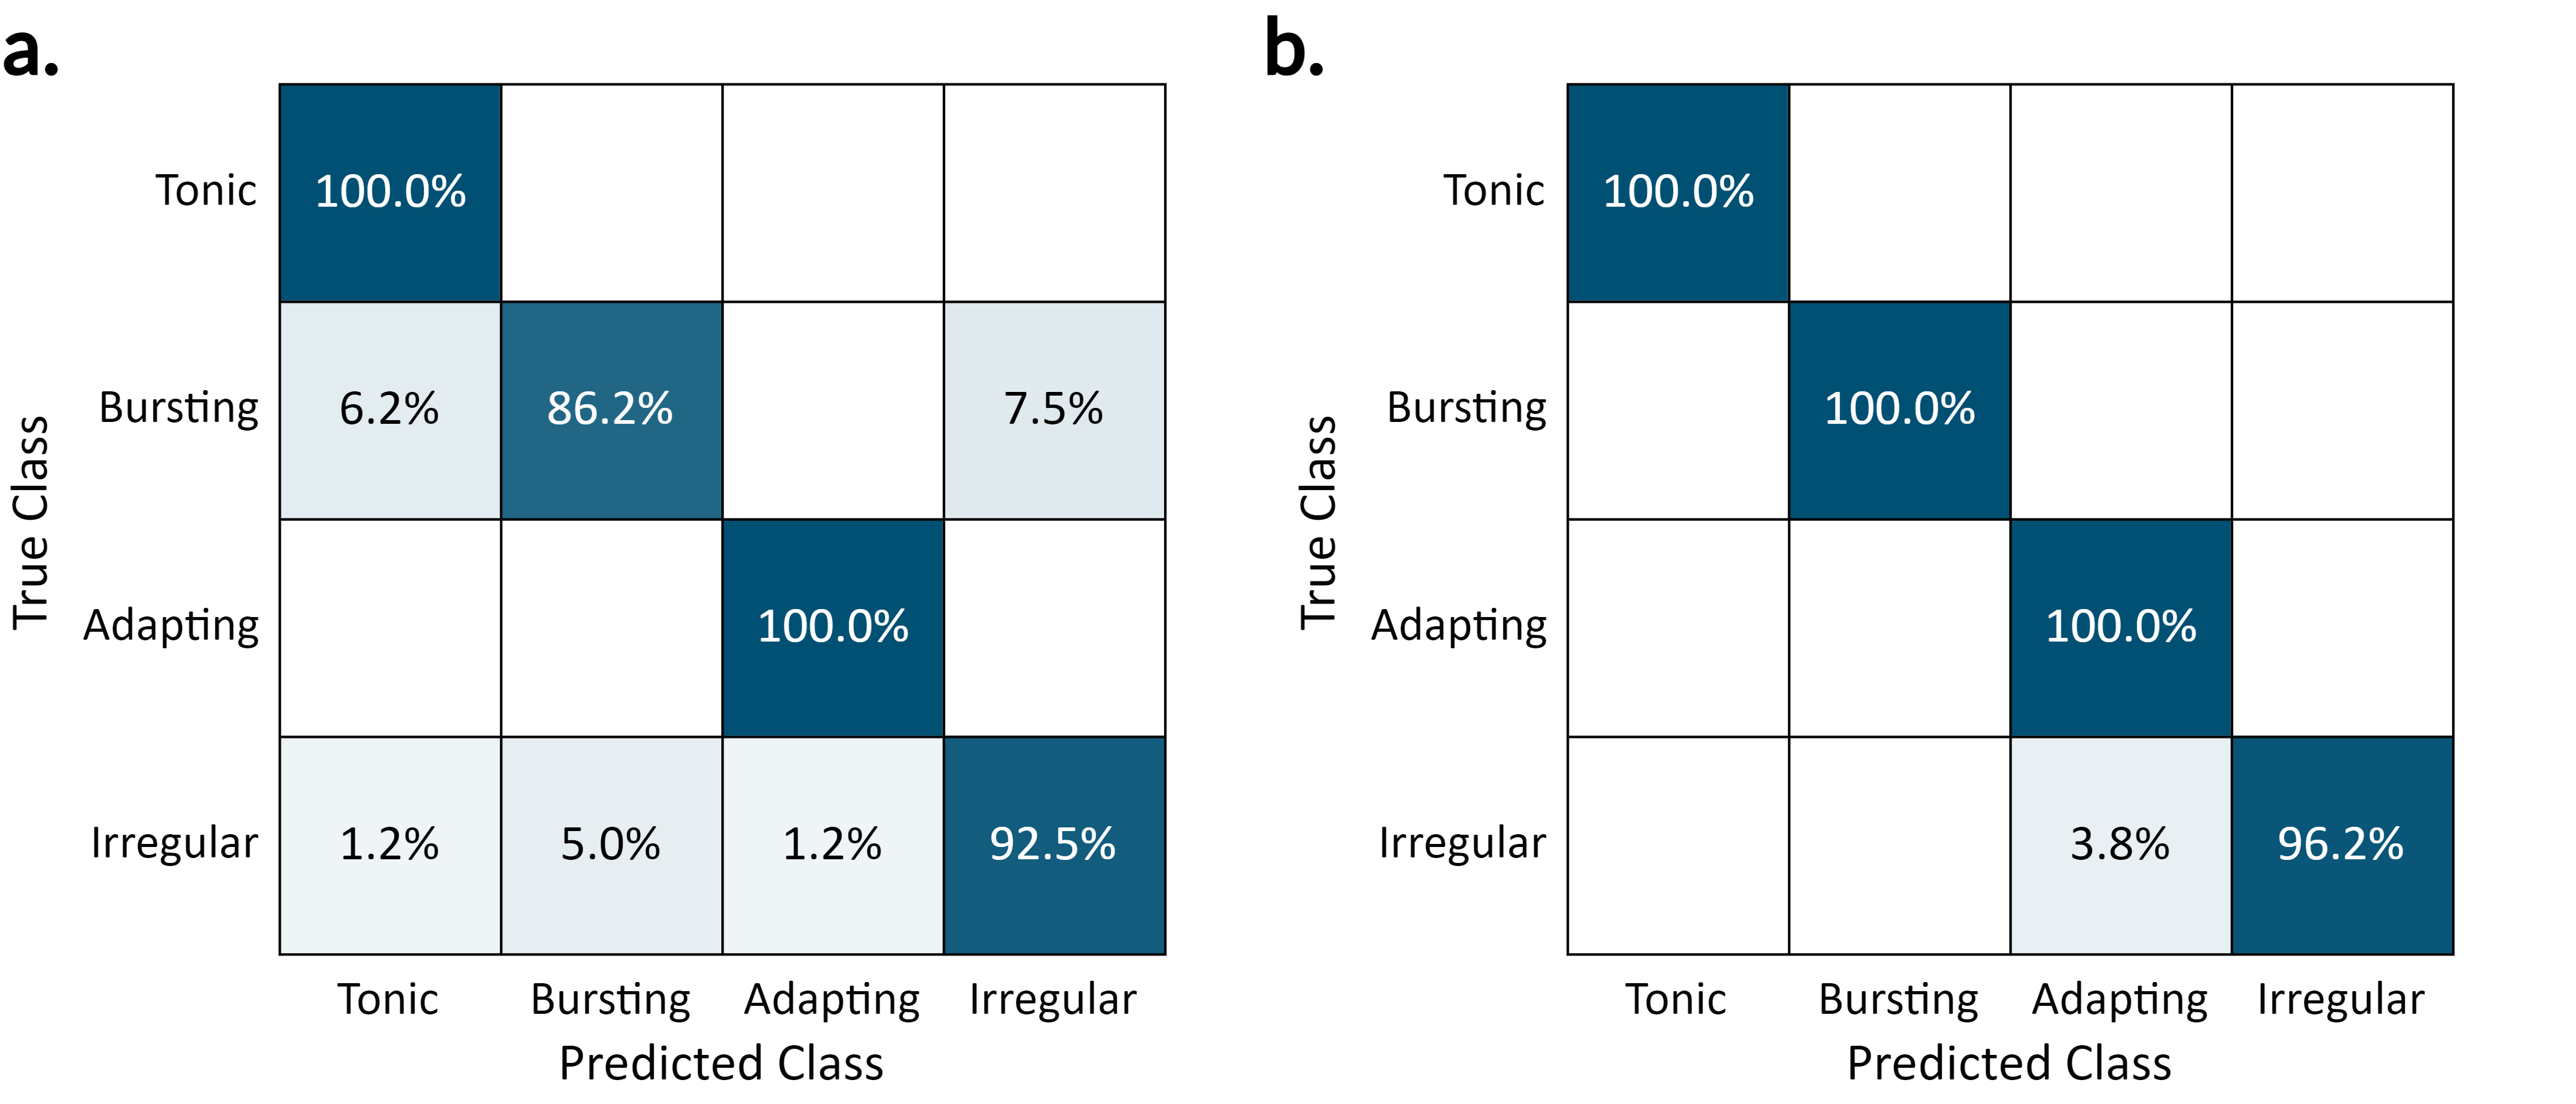
As noted in the main text, the noiseless simulation of 5 memristors could form a reservoir that was significantly more accurate in predicting the second-order task than the experimental results. Figure S5 shows the training and testing data for the simulated memristor reservoir. The increased accuracy can, in part, be attributed to low-alamethicin-concentration memristors, which operate at significantly lower conductances compared to high-concentration memristors. The measurement noise remained consistent across all memristors since they were assessed using the same hardware. However, due to the lower absolute conductance in low-concentration memristors, their signal-to-noise ratio was inherently diminished, resulting in a less reliable contribution to the reservoir layer. This effect was observed in single memristor reservoirs. The highest NMSEs were recorded for high alamethicin concentrations. Nonetheless, simulations indicate that when all memristors exhibit equally strong signal-to-noise ratios, the advantages of a more diverse reservoir become more evident. Furthermore, this signal-to-noise limitation prevented us from utilizing the best-predicted encoding parameters in the experimental implementation (as shown in the bright white region of Figure S6). The parameters used in the experimental section were optimized considering this practical constraint. However, the existence of even better simulation results suggests further potential for optimizing memristor reservoirs.
3 Supporting Table
| [Alm] | |||||||
|---|---|---|---|---|---|---|---|
| (M) | (mV) | () | (mV) | (ms) | (mV) | (ms) | (mV) |
| 1.0 | 5.4 | 0.044 | 45.4 | 1 | 11.4 | 0.00085 | 107 |
| 1.5 | 5.5 | 1.3 | 45.4 | 1 | 14.2 | 0.017 | 85 |
| 2.0 | 5.6 | 5.4 | 46.4 | 1.1 | 13.9 | 0.019 | 79 |
| 2.5 | 5.5 | 22.4 | 44.4 | 1 | 16.5 | 0.076 | 69 |
| 3.0 | 5.7 | 140 | 43.2 | 1.1 | 19.0 | 0.2 | 57 |
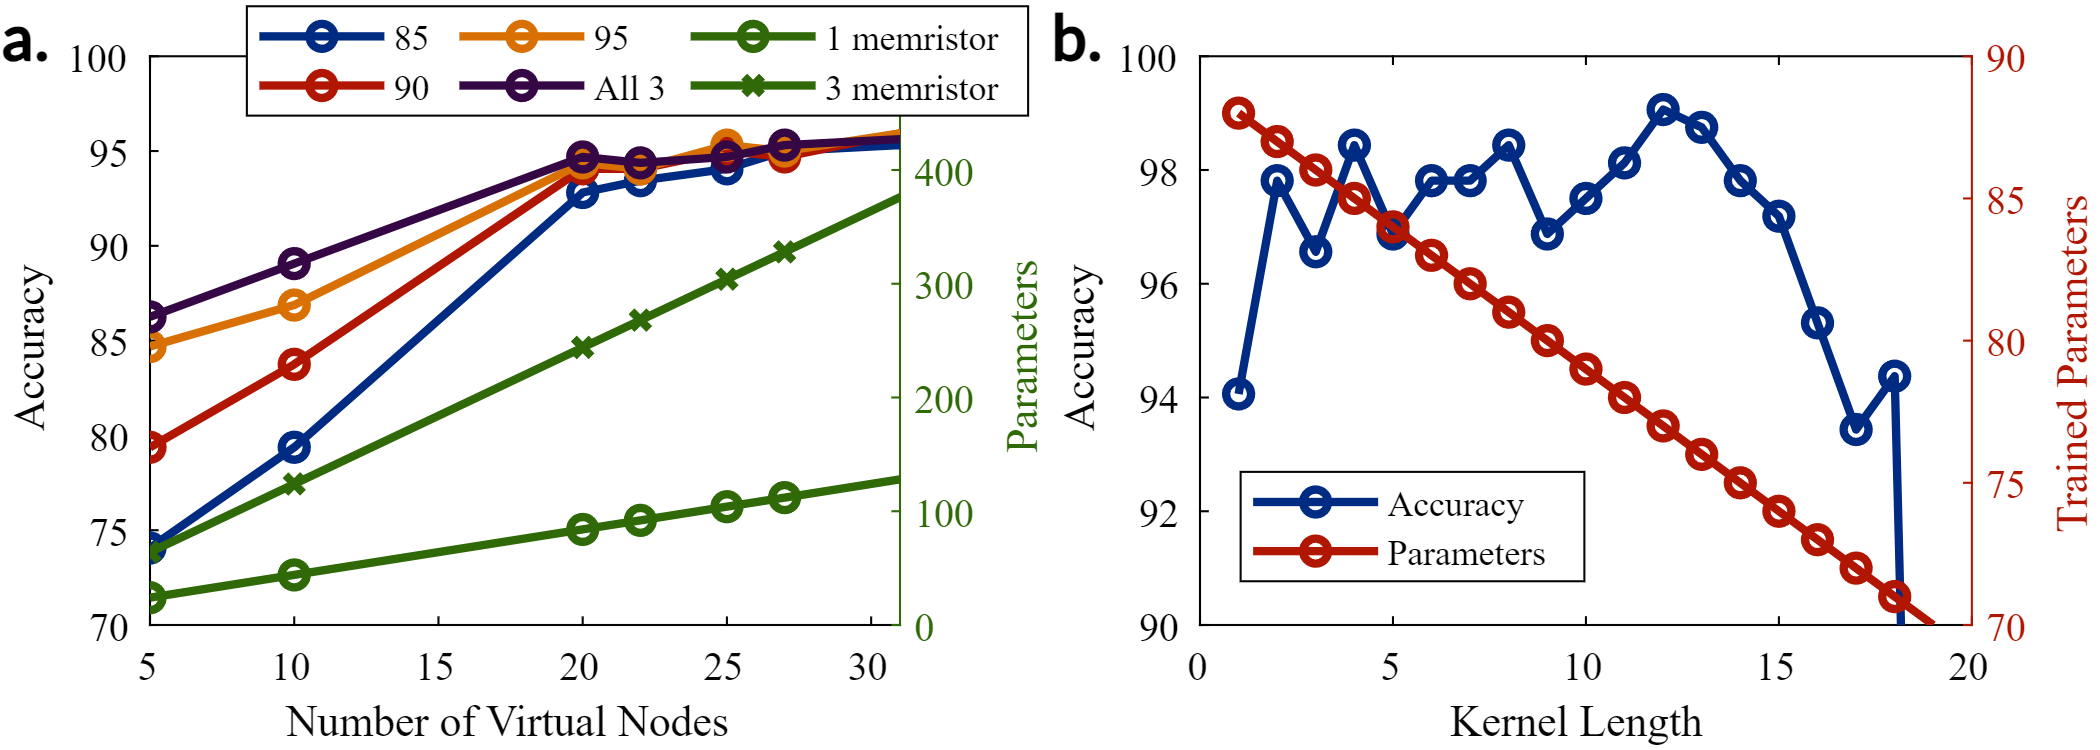
| Offsets (mV) | Kernel Size | Accuracy () | Parameters |
|---|---|---|---|
| 85 | 81.5 | 50 | |
| 90 | 93.1 | 56 | |
| 95 | 93.7 | 50 | |
| 85,90 | 95.3 | 85 | |
| 90,95 | 95.0 | 77 | |
| 85,95 | 95.3 | 73 | |
| 85,90,95 | 96.5 | 80 |
References
- Najem et al. 2018 Najem, J. S.; Taylor, G. J.; Weiss, R. J.; Hasan, M. S.; Rose, G.; Schuman, C. D.; Belianinov, A.; Collier, C. P.; Sarles, S. A. Memristive ion channel-doped biomembranes as synaptic mimics. ACS nano 2018, 12, 4702–4711
- Eisenberg et al. 1973 Eisenberg, M.; Hall, J. E.; Mead, C. The nature of the voltage-dependent conductance induced by alamethicin in black lipid membranes. The Journal of membrane biology 1973, 14, 143–176
- Boheim and Kolb 1978 Boheim, G.; Kolb, H.-A. Analysis of the multi-pore system of alamethicin in a lipid membrane: I. Voltage-jump current-relaxation measurements. The Journal of Membrane Biology 1978, 38, 99–150
- Okazaki et al. 2003 Okazaki, T.; Sakoh, M.; Nagaoka, Y.; Asami, K. Ion channels of alamethicin dimer N-terminally linked by disulfide bond. Biophysical journal 2003, 85, 267–273