Star Formation Efficiency in Nearby Galaxies Revealed with a New CO-to-H2 Conversion Factor Prescription
Abstract
Determining how galactic environment, especially the high gas densities and complex dynamics in bar-fed galaxy centers, alters the star formation efficiency (SFE) of molecular gas is critical to understanding galaxy evolution. However, these same physical or dynamical effects also alter the emissivity properties of CO, leading to variations in the CO-to-H2 conversion factor () that impact the assessment of the gas column densities and thus of the SFE. To address such issues, we investigate the dependence of on local CO velocity dispersion at 150 pc scales using a new set of dust-based measurements, and propose a new prescription that accounts for CO emissivity variations across galaxies. Based on this prescription, we estimate the SFE in a sample of 65 galaxies from the PHANGS–ALMA survey. We find increasing SFE towards high surface density regions like galaxy centers, while using a constant or metallicity-based results in a more homogeneous SFE throughout the centers and disks. Our prescription further reveals a mean molecular gas depletion time of 700 Myr in the centers of barred galaxies, which is overall 3–4 times shorter than in non-barred galaxy centers or the disks. Across the galaxy disks, the depletion time is consistently around 2–3 Gyr regardless of the choice of prescription. All together, our results suggest that the high level of star formation activity in barred centers is not simply due to an increased amount of molecular gas but also an enhanced SFE compared to non-barred centers or disk regions.
1 Introduction
Star formation in galaxies is governed by the amount of molecular gas and the efficiency with which that gas is converted into stars. To understand the evolutionary process of star formation activity within galaxies, it is critical to measure the molecular gas star formation efficiency (SFE; defined as the ratio between star formation rate, SFR, and molecular gas mass, ), or molecular gas depletion time () (see review by Saintonge & Catinella, 2022). Previous studies have found that SFR and molecular gas surface densities are highly correlated (i.e., the molecular Kennicutt-Schmidt relation, or mKS relation; Kennicutt, 1998) and that is usually at 1–4 Gyr across nearby star-forming galaxies (e.g., Bigiel et al., 2008; Leroy et al., 2008; Saintonge et al., 2011; Schruba et al., 2011; Utomo et al., 2017; Sun et al., 2023). Despite the minor variation in general, is also found to vary systematically with local and global host galaxy properties, which could be driven by environmental and/or dynamical effects from e.g., metallicity, molecular cloud structure, bar instabilities, active galactic nuclei, or galaxy interactions (Saintonge et al., 2011, 2012; Schruba et al., 2019; Ellison et al., 2021a, b; Querejeta et al., 2021; Lu et al., 2022; Villanueva et al., 2022; Jiménez-Donaire et al., 2023; Maeda et al., 2023).
The assessment of molecular gas SFE relies heavily on the CO-to-H2 conversion factor ()111 is defined for the CO line in most literature, but it can also be evaluated for other transitions. In this work, when we refer to , we mean unless otherwise specified.:
| (1) |
where () is the total molecular gas mass (surface density) and () is the line luminosity (intensity) of CO =1–0. is known to vary with molecular gas conditions such as density, temperature, and dynamical state (see review by Bolatto et al., 2013, hereafter B13), which are the same conditions that could also alter the intrinsic SFE of the molecular gas. Due to the lack of a widely-agreed prescription that can accurately predict , many studies could only assume a constant referencing the Milky Way (MW) disk average (e.g., B13) to convert CO observations to molecular gas mass. This has made variation one of the dominant sources of uncertainty in current molecular gas and SFE studies (see discussions in Ellison et al., 2020a; Maeda et al., 2023; Sun et al., 2023).
The impacts of variations on both SFE and cloud evolutionary timescale estimates are particularly critical in galaxy centers (Leroy et al., 2013; Utomo et al., 2017; Muraoka et al., 2019; Ellison et al., 2020a; Pessa et al., 2021; Maeda et al., 2023; Sun et al., 2023). In those environments, can be 5–15 times lower than the Galactic disk value (Ackermann et al., 2012; Sandstrom et al., 2013; Israel, 2020; Teng et al., 2022, 2023; den Brok et al., 2023). The lower in galaxy centers is likely driven by CO emissivity variations due to higher excitation and/or stronger dynamical effects such as turbulence or inflowing gas (Narayanan et al., 2012; Papadopoulos et al., 2012; Bolatto et al., 2013; Gong et al., 2020; Teng et al., 2023). These effects may also explain the low seen in mergers or (ultra-)luminous infrared galaxies (U/LIRGs) (Downes & Solomon, 1998; Krieger et al., 2017; Sliwa et al., 2017; Cicone et al., 2018; Herrero-Illana et al., 2019).
Reducing the uncertainty in molecular gas and SFE studies, and thereby improving our understanding in star formation and galaxy evolution, requires a robust prescription that can be systematically applied to large samples of galaxies with diverse environments. Recent studies have proposed various types of prescription depending on metallicity, stellar mass surface density, SFR, SFE, and/or CO line-related properties (Genzel et al., 2012; Narayanan et al., 2012; Bolatto et al., 2013; Hunt et al., 2015; Amorín et al., 2016; Accurso et al., 2017; Renaud et al., 2019; Gong et al., 2020; Madden et al., 2020; Ramambason et al., 2023). However, establishing a reliable calibration remains a challenge because it requires measurements covering a sufficient sample of galaxies spanning a broad range of molecular gas physical and dynamical conditions, and the two most realistic ways to measure in nearby galaxies are via dust emission (which is typically restricted to kpc resolutions; Israel 1997; Leroy et al. 2011; Sandstrom et al. 2013; Schruba et al. 2017; Pitts & Barnes 2021; den Brok et al. 2023; Yasuda et al. 2023; Chiang et al. 2023) or multi-CO isotopologue observations (which is expensive at cloud scales; Sliwa et al. 2017; Cormier et al. 2018; Israel 2020; Sharda et al. 2022; Teng et al. 2022, 2023).
Thanks to the high resolution and sensitivity of the Atacama Large Millimeter/submillimeter Array (ALMA), CO (isotopologue) observations are now routinely possible at cloud scales in nearby galaxies (e.g., Leroy et al., 2021; Davis et al., 2022; Koda et al., 2023; Williams et al., 2023). In particular, recent studies modeling multi-CO isotopologues in nearby galaxy centers have revealed that CO opacity is the dominant driver of variations (Israel, 2020; Teng et al., 2022, 2023). This strong dependence of on CO opacity further leads to a clear anti-correlation between and the observed line width at 100 pc scales in barred galaxy centers (Teng et al., 2023, hereafter T23).
Motivated by these latest measurements of , we will test if the correlation found in T23 also applies to the 12 galaxies (labeled with * in Table LABEL:tab:sample, including 8 barred and 4 non-barred) which have dust-inferred values at kpc scales (from Chiang et al. 2023; hereafter C23) and molecular gas velocity dispersion measured at 150-pc scales (from the PHANGS–ALMA survey; Leroy et al., 2021; Sun et al., 2022). The results of this comparison lead us to a new prescription capturing CO emissivity effects in star-forming galaxies. In this paper, we present this prescription, discuss its physical implications, and study its impact on SFE across a sizable sample of galaxy centers and disks with diverse properties.
2 Data and Measurements
2.1 PHANGS Datasets
Our analysis is based on various molecular gas and star formation properties, leveraging a database developed by Sun et al. (2022) which assembled multi-wavelength measurements of 80 galaxies from the PHANGS–ALMA survey (Leroy et al., 2021). From this database, we extract multiple physical quantities in matched hexagonal apertures with fixed sizes of 1.5 kpc. The quantities used in this work include: intensity-weighted mean molecular gas velocity dispersion measured at 150-pc scale (), area-weighted mean CO(2–1) line integrated intensity (), stellar mass surface density (), SFR surface density (), and gas-phase metallicity (, normalized to the solar value and calibrated based on Pettini & Pagel 2004). All these quantities are corrected for the effects of galaxy inclination and data sensitivity limits (see Sun et al. 2022 for more details).
To further explore trends in galaxies with or without stellar bars, we adopt the classification of stellar bars for PHANGS galaxies (Querejeta et al., 2021). Table LABEL:tab:sample lists the 65 galaxies included in our analysis, which is the overlap between Querejeta et al. (2021) and Sun et al. (2022). This sample from PHANGS has high-resolution CO(2–1) data with beam sizes of 150 pc or smaller. Columns (6–10) in Table LABEL:tab:sample show the measurements extracted from Sun et al. (2022) for the central 1.5 kpc regions of those galaxies.
| Galaxy | Bar | Dist. | Incl. | P.A. | |||||||
|---|---|---|---|---|---|---|---|---|---|---|---|
| [Mpc] | [deg] | [deg] | [Z⊙] | [K km s-1] | [M⊙ pc-2] | [km s-1] | [yr] | ||||
| (1) | (2) | (3) | (4) | (5) | (6) | (7) | (8) | (9) | (10) | (11) | (12) |
| IC1954 | 1 | 12.8 | 57.1 | 63.4 | 1.10 | -1.67 | 7.5 | 2.51 | 7.1 | 0.36 | 9.08 |
| IC5273 | 1 | 14.2 | 52.0 | 234.1 | 1.12 | -1.59 | 4.7 | 2.48 | 7.4 | 0.34 | 8.78 |
| NGC0253* | 1 | 3.7 | 75.0 | 52.5 | 1.33 | 0.3166 | 198.2 | 990.2 | 28.5 | -0.15 | 8.88 |
| NGC0628* | 0 | 9.8 | 8.9 | 20.7 | 1.29 | -1.82 | 6.3 | 3.03 | 5.4 | 0.45 | 9.26 |
| NGC0685 | 1 | 19.9 | 23.0 | 100.9 | 1.23 | -2.15 | 2.8 | 2.42 | 6.8 | 0.37 | 9.15 |
| NGC1087 | 1 | 15.8 | 42.9 | 359.1 | 1.19 | -1.12 | 24.7 | 2.68 | 13.4 | 0.12 | 8.82 |
| NGC1097 | 1 | 13.6 | 48.6 | 122.4 | 1.34 | -0.29 | 196.0 | 3.61 | 33.1 | -0.20 | 8.57 |
| NGC1300 | 1 | 19.0 | 31.8 | 278.0 | 1.33 | -1.57 | 44.6 | 3.25 | 23.2 | -0.07 | 9.33 |
| NGC1317 | 1 | 19.1 | 23.2 | 221.5 | 1.33 | -1.45 | 25.2 | 3.64 | 18.0 | 0.02 | 9.06 |
| NGC1365 | 1 | 19.6 | 55.4 | 201.1 | 1.36 | 0.04 | 462.4 | 3.80 | 25.6 | -0.11 | 8.70 |
| NGC1385 | 0 | 17.2 | 44.0 | 181.3 | 1.21 | -1.00 | 15.0 | 2.78 | 9.5 | 0.25 | 8.60 |
| NGC1433 | 1 | 18.6 | 28.6 | 199.7 | 1.35 | -1.46 | 44.6 | 3.63 | 17.3 | 0.03 | 9.33 |
| NGC1511 | 0 | 15.3 | 72.7 | 297.0 | 1.18 | -1.17 | 12.4 | 2.60 | 7.5 | 0.33 | 8.79 |
| NGC1512 | 1 | 18.8 | 42.5 | 261.9 | 1.34 | -1.36 | 31.9 | 3.41 | 11.3 | 0.19 | 9.24 |
| NGC1546 | 0 | 17.7 | 70.3 | 147.8 | 1.29 | -1.52 | 45.0 | 3.08 | 7.9 | 0.31 | 9.67 |
| NGC1559 | 1 | 19.4 | 65.4 | 244.5 | 1.29 | -1.47 | 10.5 | 2.77 | 6.6 | 0.38 | 9.06 |
| NGC1566 | 1 | 17.7 | 29.5 | 214.7 | 1.34 | -0.97 | 55.7 | 3.63 | 28.7 | -0.15 | 8.76 |
| NGC1637 | 1 | 11.7 | 31.1 | 20.6 | 1.20 | -0.82 | 12.2 | 2.57 | 22.8 | -0.07 | 8.03 |
| NGC1792 | 0 | 16.2 | 65.1 | 318.9 | 1.33 | -1.35 | 52.0 | 3.08 | 10.7 | 0.21 | 9.46 |
| NGC1809 | 0 | 20.0 | 57.6 | 138.2 | 1.14 | -1.71 | 2.2 | 2.19 | 3.1 | 0.65 | 8.88 |
| NGC2090 | 0 | 11.8 | 64.5 | 192.5 | 1.22 | -2.19 | 4.5 | 2.79 | 4.2 | 0.54 | 9.57 |
| NGC2283 | 1 | 13.7 | 43.7 | -4.1 | 1.18 | -1.93 | 3.0 | 2.31 | 5.1 | 0.47 | 9.07 |
| NGC2566 | 1 | 23.4 | 48.5 | 312.0 | 1.34 | -0.05 | 265.0 | 3.16 | 26.5 | -0.12 | 8.53 |
| NGC2835 | 1 | 12.2 | 41.3 | 1.0 | 1.21 | -2.23 | 2.2 | 2.47 | 4.3 | 0.53 | 9.30 |
| NGC2903 | 1 | 10.0 | 66.8 | 203.7 | 1.33 | -0.81 | 55.8 | 3.15 | 19.7 | -0.01 | 8.73 |
| NGC2997 | 0 | 14.1 | 33.0 | 108.1 | 1.34 | -0.95 | 68.5 | 3.21 | 16.2 | 0.06 | 9.03 |
| NGC3059 | 1 | 20.2 | 29.4 | -14.8 | 1.29 | -0.84 | 23.1 | 2.68 | 11.4 | 0.18 | 8.58 |
| NGC3137 | 0 | 16.4 | 70.3 | -0.3 | 1.18 | -2.53 | 3.0 | 2.19 | 3.2 | 0.64 | 9.85 |
| NGC3351* | 1 | 10.0 | 45.1 | 193.2 | 1.29 | -0.71 | 34.4 | 3.18 | 19.2 | -0.01 | 8.43 |
| NGC3507 | 1 | 23.6 | 21.7 | 55.8 | 1.30 | -1.57 | 17.3 | 3.16 | 23.4 | -0.08 | 8.91 |
| NGC3511 | 1 | 13.9 | 75.1 | 256.8 | 1.22 | -1.94 | 17.2 | 2.50 | 6.6 | 0.38 | 9.74 |
| NGC3521* | 0 | 13.2 | 68.8 | 343.0 | 1.36 | -1.66 | 14.8 | 3.50 | 6.7 | 0.37 | 9.40 |
| NGC3596 | 0 | 11.3 | 25.1 | 78.4 | 1.10 | -1.55 | 6.3 | 2.68 | 7.0 | 0.36 | 8.90 |
| NGC3621 | 0 | 7.1 | 65.8 | 343.8 | 1.23 | -1.86 | 8.4 | 2.66 | 5.2 | 0.46 | 9.44 |
| NGC3626 | 1 | 20.0 | 46.6 | 165.2 | 1.31 | -1.40 | 11.2 | 3.52 | 13.5 | 0.12 | 8.76 |
| NGC3627* | 1 | 11.3 | 57.3 | 173.1 | 1.35 | -1.19 | 64.9 | 3.53 | 34.6 | -0.22 | 8.98 |
| NGC4254* | 0 | 13.1 | 34.4 | 68.1 | 1.30 | -1.10 | 35.7 | 3.27 | 10.3 | 0.22 | 9.06 |
| NGC4293 | 1 | 15.8 | 65.0 | 48.3 | 1.31 | -1.11 | 45.0 | 2.92 | 27.4 | -0.13 | 8.82 |
| NGC4298 | 0 | 14.9 | 59.2 | 313.9 | 1.22 | -1.79 | 14.3 | 2.69 | 9.7 | 0.24 | 9.38 |
| NGC4303 | 1 | 17.0 | 23.5 | 312.4 | 1.32 | -0.83 | 70.8 | 3.52 | 16.9 | 0.04 | 8.91 |
| NGC4321* | 1 | 15.2 | 38.5 | 156.2 | 1.34 | -0.78 | 101.0 | 3.35 | 19.5 | -0.01 | 8.96 |
| NGC4457 | 1 | 15.1 | 17.4 | 78.7 | 1.30 | -1.15 | 38.7 | 3.69 | 29.0 | -0.15 | 8.77 |
| NGC4496A | 1 | 14.9 | 53.8 | 51.1 | 1.04 | -2.21 | 1.6 | 2.17 | 2.8 | 0.69 | 9.29 |
| NGC4535 | 1 | 15.8 | 44.7 | 179.7 | 1.32 | -1.03 | 43.1 | 2.78 | 20.1 | -0.02 | 8.83 |
| NGC4536* | 1 | 16.2 | 66.0 | 305.6 | 1.30 | -0.56 | 110.3 | 3.30 | 21.0 | -0.04 | 8.76 |
| NGC4540 | 1 | 15.8 | 28.7 | 12.8 | 1.14 | -1.90 | 3.9 | 2.65 | 6.3 | 0.40 | 9.07 |
| NGC4548 | 1 | 16.2 | 38.3 | 138.0 | 1.34 | -1.96 | 9.7 | 3.38 | 24.8 | -0.10 | 9.03 |
| NGC4569* | 1 | 15.8 | 70.0 | 18.0 | 1.35 | -1.13 | 112.1 | 3.24 | 27.6 | -0.14 | 9.23 |
| NGC4571 | 0 | 14.9 | 32.7 | 217.5 | 1.23 | -2.36 | 2.5 | 2.63 | 2.7 | 0.70 | 9.63 |
| NGC4689* | 0 | 15.0 | 38.7 | 164.1 | 1.26 | -1.81 | 9.2 | 2.61 | 5.6 | 0.44 | 9.40 |
| NGC4731 | 1 | 13.3 | 64.0 | 255.4 | 1.02 | -1.97 | 1.6 | 1.99 | 5.1 | 0.47 | 8.85 |
| NGC4781 | 1 | 11.3 | 59.0 | 290.0 | 1.09 | -1.76 | 9.1 | 2.59 | 8.2 | 0.30 | 9.20 |
| NGC4826 | 0 | 4.4 | 59.1 | 293.6 | 1.27 | -1.43 | 27.9 | 3.26 | 21.8 | -0.05 | 9.01 |
| NGC4941* | 1 | 15.0 | 53.4 | 202.2 | 1.25 | -1.31 | 6.9 | 3.00 | 18.7 | 0.00 | 8.34 |
| NGC4951 | 0 | 15.0 | 70.2 | 91.2 | 1.15 | -1.77 | 10.0 | 2.67 | 11.4 | 0.18 | 9.14 |
| NGC5042 | 0 | 16.8 | 49.4 | 190.6 | 1.18 | -2.15 | 2.2 | 2.52 | 5.3 | 0.46 | 9.14 |
| NGC5068 | 1 | 5.2 | 35.7 | 342.4 | 0.98 | -2.01 | 1.0 | 2.33 | 3.6 | 0.60 | 8.79 |
| NGC5128 | 0 | 3.7 | 45.3 | 32.2 | 1.36 | -0.78 | 45.3 | 3.70 | 22.7 | -0.07 | 8.56 |
| NGC5134 | 1 | 19.9 | 22.7 | 311.6 | 1.30 | -1.94 | 4.9 | 3.33 | 11.4 | 0.18 | 9.00 |
| NGC5248* | 1 | 14.9 | 47.4 | 109.2 | 1.30 | -0.97 | 72.6 | 3.35 | 15.7 | 0.07 | 9.08 |
| NGC5530 | 0 | 12.3 | 61.9 | 305.4 | 1.23 | -2.02 | 6.4 | 3.00 | 4.8 | 0.50 | 9.51 |
| NGC5643 | 1 | 12.7 | 29.9 | 318.7 | 1.29 | -0.29 | 42.0 | 2.88 | 26.7 | -0.12 | 7.98 |
| NGC6300 | 1 | 11.6 | 49.6 | 105.4 | 1.31 | -0.55 | 41.1 | 2.85 | 36.2 | -0.23 | 8.11 |
| NGC7456 | 0 | 15.7 | 67.3 | 16.0 | 1.09 | -2.70 | 0.9 | 1.99 | 2.7 | 0.70 | 9.56 |
| NGC7496 | 1 | 18.7 | 35.9 | 193.7 | 1.21 | -0.43 | 46.2 | 2.72 | 23.7 | -0.08 | 8.20 |
| Note. (1) Galaxies with an asterisk are those with measurements (see Section 2.2); (2) bar classification (Querejeta et al., 2021); (3) distance (Anand et al., 2021); (4–5) inclination and position angles (Lang et al., 2020); (6–10) the central 1.5 kpc measurements of gas-phase metallicity (PP04-based), kpc-averaged SFR surface density, kpc-averaged CO(2-1) integrated intensity, kpc-averaged stellar mass surface density, and CO intensity-weighted mean velocity dispersion at 150-pc scale (Sun et al., 2022); (11) derived from (10) using Equation 2; (12) molecular gas depletion time derived from (7), (8), and (11) using Equation 6. | |||||||||||
2.2 Dust-based Measurements
We obtain spatially resolved from C23, where is measured at 2 kpc resolution across 41 nearby ( Mpc) and moderately-inclined () spiral galaxies with resolved measurements of CO integrated intensity (including PHANGS-ALMA) and atomic gas. The authors assumed a constant dust-to-metals ratio to constrain the total gas mass with dust and metallicity measurements. In their sample, 8 barred and 4 non-barred galaxies from PHANGS have dust-based measurements (those with an * in Table LABEL:tab:sample). These measurements typically cover out to a galactocentric radius of 10 kpc, including 2000 Nyquist-sampled data points. It is based on these data that we examine scaling relations of and develop an prescription in Section 3.1.
The measurements in C23 were derived based on the PHANGS CO(2–1) data, and we directly use their measurements to ensure methodological consistency when we derive molecular gas surface density and SFE (see Sections 3.3 and 3.4). To compare with most literature using , however, we convert the measured to by assuming a CO(2–1)/(1–0) ratio () of 0.65. Such results can be easily reverted to via a linear scaling with 0.65. We note that C23 also provided measurements assuming a SFR-dependent , and we have checked that using such does not change any of our results qualitatively (see Section 3.1).
We also note that the metallicity adopted by C23 for computing is based on the S-calibration in Pilyugin & Grebel (2016, hereafter PG16S), which is different from the O3N2 calibration used for the PHANGS dataset based on Pettini & Pagel (2004, hereafter PP04). Recent studies suggest that PG16S is a more reliable metallicity prescription than PP04 (e.g., Kreckel et al., 2019). With the data on 12 galaxies, we find that PP04 estimates result in 0.2 dex higher than PG16S (see also De Vis et al., 2019), which might be due to the mismatch in the adopted solar oxygen abundance value under different calibration schemes (e.g., or 8.69; see discussion in Esteban et al., 2022). Throughout this work, we adopt PG16S-based from C23 for analyses restricted to these 12 galaxies. However, due to the lack of PG16S-based measurements on all 65 PHANGS galaxies, we use the PP04-based when implementing metallicity-dependent prescriptions across the full sample for consistency.
To evaluate the credibility of the observed trends with our parameters of interest (i.e., and ), we calculate for each parameter bin the number of pixels with reliable measurements divided by the number of pixels with measured or . For , we find the fraction of reliable pixels to be 70–100% for bins with km s-1, while it drops significantly to in lower velocity dispersion bins222This is likely due to a large amount of low S/N measurements clustering around 2.5 km/s, which is the velocity resolution of the PHANGS CO data. This means that our data coverage is insufficient to accurately represent regions with km s-1. As for , the corresponding completeness of is above across regions with , while it drops below at lower metallicities (where the PHANGS-ALMA dataset has poorer coverage). These “incomplete” regimes will be excluded by our fitting and analysis in Section 3.1, where we present the new prescription.
3 Results
(a)
(b)
(a)
(b)
3.1 A Velocity Dispersion-based Prescription
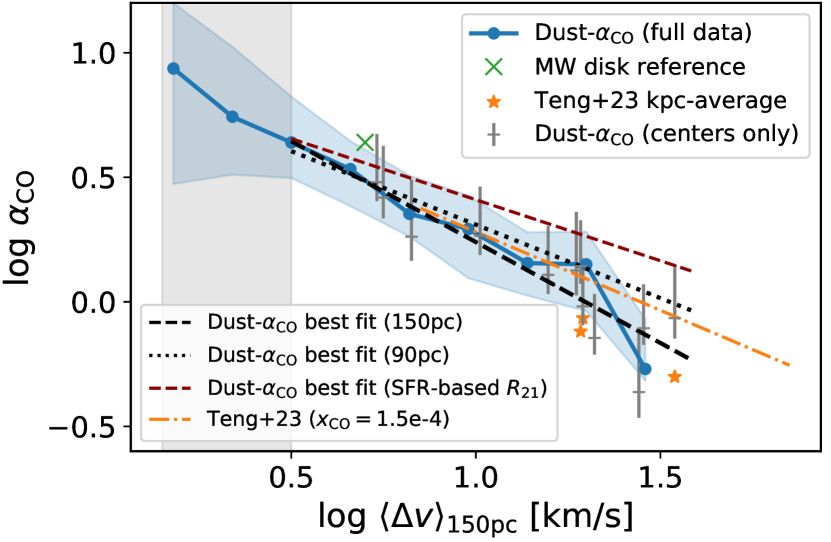
To investigate how the dust-based varies with local velocity dispersion, we use nearest-neighbor matching to relate the measurements at 2-kpc scales with the velocity dispersion which is measured at 150-pc scale and then averaged over 1.5-kpc-sized apertures via intensity weighting (). As shown in Figure 1(a), the data clearly follow an inverse power-law relation, which is in close agreement with the fit by T23 on three barred galaxy centers at 100 pc scales (i.e., dash-dotted orange line, assuming a CO/H2 abundance of ). The central regions of the 12 galaxies (vertical, gray bars in Figure 1(a)) align well with the overall trend, showing that velocity dispersion can trace variations in both the centers and disks333In this paper, center refers to the central 2 kpc-sized aperture at =0, and disks represents the rest of the measurements.. The green cross sign marks the typical MW disk values of 4.35 and km s-1, which also agrees with the overall trend. The shaded area in Figure 1(a) indicates the regime where data is incomplete (see Section 2.2).
Excluding the incomplete regime, we conduct a least-squares fitting in log-log space based on the remaining 1600 data points, using the curve_fit function in scipy.optimize. The best-fit power-law relation to these data from 12 galaxies is represented by
| (2) |
where and are in units of and km s-1, respectively. The best-fit relation is shown by the black dashed line in the top panel of Figure 1(a) and is consistent with the trend of the binned medians. The dispersion of data with respect to Equation 2 is dex, and the standard deviation error returned by curve_fit is 0.02 for both the fitted slope and intercept. We remind readers that the data here are converted from assuming , and thus it should be scaled by if is known. If a SFR-dependent is used following C23, the trend of in Figure 1(a) could be shallower by 30–40%, as indicated by the red dashed line.
While the functional fit in Equation 2 is based on measured at 150-pc scale, we also find a similar best-fit relation (dotted line) for six of those galaxies where is available. Because does not vary strongly between 90 and 150 pc scales (see also Sun et al., 2022), we would not expect this to change our results, and thus Equation 2 should be applicable with measurements around 100-pc resolutions. We note that the evaluation of can also be affected by the number of gas components overlapping along the same sightlines, which could increase in barred galaxy centers. However, such effect is found to be mild (see T23, Appendix A), and we expect it to be even milder in our case, as is averaged over kpc-sized regions.
3.2 Comparison to Previous Literature
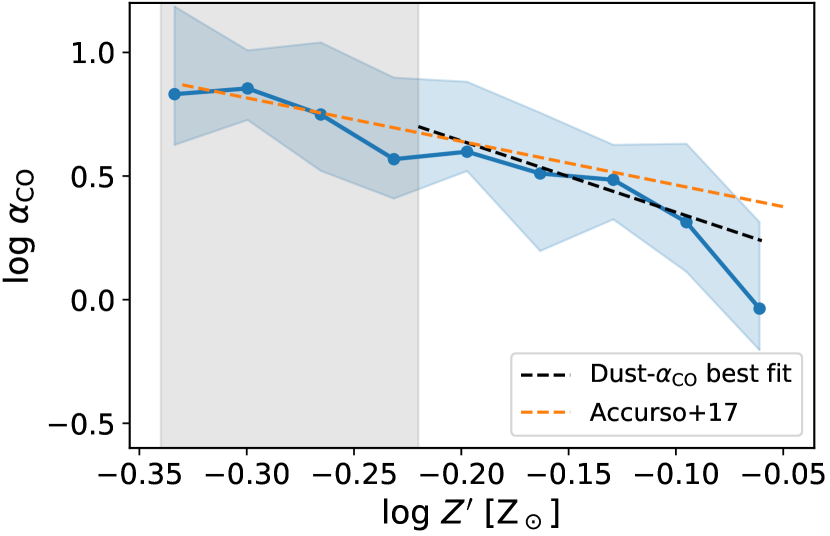
We compare our -based prescription with existing prescriptions in the literature, including those based on metallicity (Accurso et al., 2017; Sun et al., 2020a) or combining metallicity and stellar mass surface density (B13). First, we investigate if metallicity alone could trace the observed variations. Figure 1(b) relates the measured with metallicity, using the same metallicity as those used in C23 to calculate (see Section 2.2). The data and the power-law fit (black dashed line) overall agrees with the purely metallicity-dependent prescription from Accurso et al. (2017) (orange dashed line)444The in the original prescription [] was based on the PP04 calibration. Here we convert their prescription to the same (PG16S-based) metallicity scale as we adopt, using an approximate conversion based on De Vis et al. (2019)., although the data scatter is larger than the trend with velocity dispersion. In the regime where our dataset is complete, the scatter of the observed is 0.1 dex with and 0.3 dex with . This shows a significant improvement in predicting with our -based prescription, compared to current metallicity-dependent prescriptions.
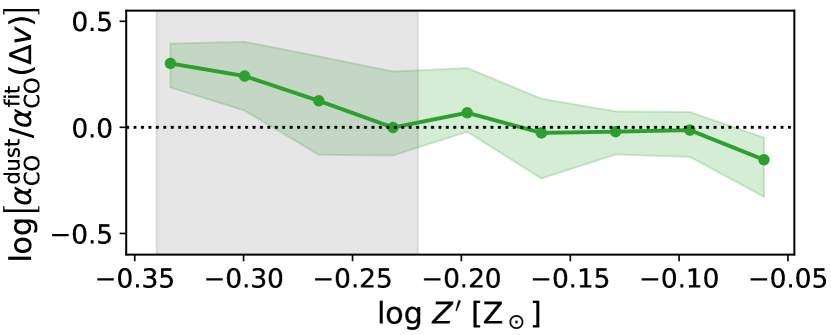
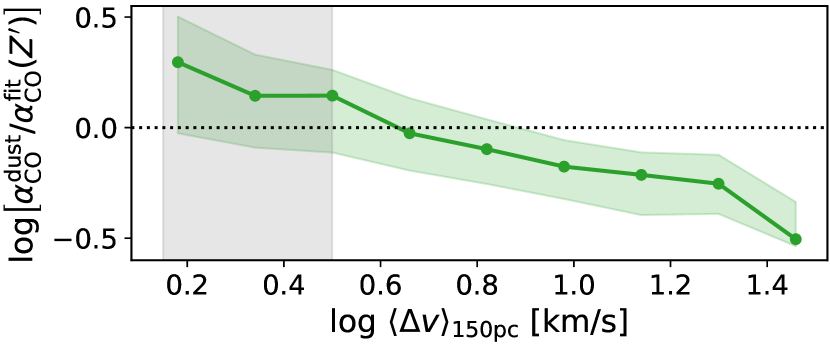
In the bottom panels of Figures 1(a) and (b), we relate the residuals of each fit with or , in order to check if metallicity effects can explain any residual variation of around the trend, or the opposite. Above the completeness limit, we find no trend between the residuals from the prescription and metallicity. On the other hand, the residuals from the metallicity fit clearly decrease with above the completeness threshold. This suggests that is crucial for tracing the changes, even without including metallicity effects. We have checked that the correlation with seen in this regime may come from the correlation between and , as both variables decrease with the galactocentric radius.
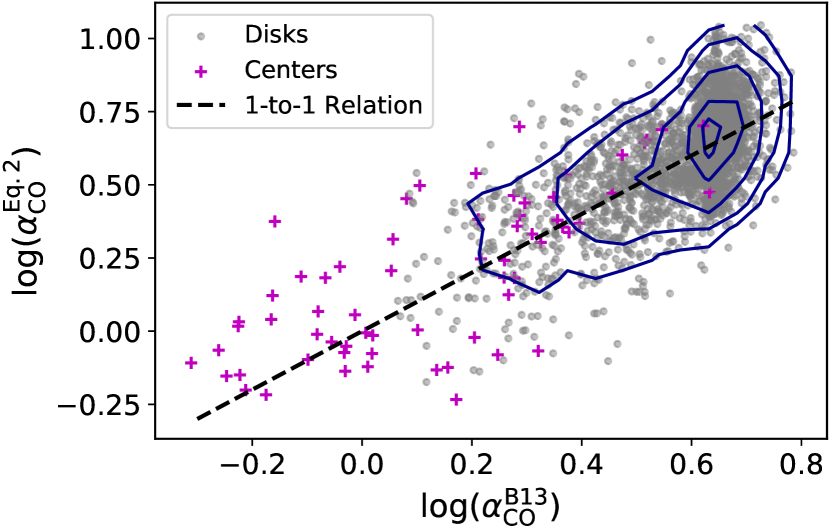
Taking both metallicity and emissivity effects into account, B13 also suggested a tentative prescription555The original prescription included a molecular cloud surface density term which was assumed at 100 M⊙ pc-2. Here we adopt the same value and note that this helps avoid unrealistic values in low surface density regions (Sun et al. 2023, T23). based on measurements in nearby disks and (U)LIRGs:
| (3) |
where if pc-2 or otherwise. To compare the derived from our proposed prescription (Equation 2) with that from B13, we apply both prescriptions to galaxies in the PHANGS sample (see Table LABEL:tab:sample) using kpc-scale and . As we find even with a (likely-overestimated) Galactic (Sun et al., 2022), we neglect in Equation 3. We note that C23 also reported a similar relation that scales with .
Figure 2(a) compares the values predicted by Equations 2 and 3. Excluding the regime of where B13 enforces a MW-like value with (which also corresponds to the low-confidence regime of our -based prescription), the two prescriptions show an overall match with a 0.5 dex scatter. Despite a significant scatter, this general agreement may indicate that and are tracing the same physical process that drives variations. A likely scenario is that is set by the additional gravitational potential from stellar components, which can thus be tracked by (see B13 and C23). It is also possible that is a proxy of molecular gas surface densities and/or local CO intensities which could also reflect opacity and changes, as previous studies have found good correlations between these properties (Sun et al., 2022, see also Section 4 for further discussion).
The B13 prescription was mostly based on measurements that were independent from ours and included several U/LIRGs in their sample, and the 0.5 dex scatter with our prescription is also consistent with the uncertainty estimated by B13. Therefore, the rough agreement seen in Figure 2(a) may also provide additional evidence for the validity of our proposed prescription. Compared to a -based prescription, one advantage of using a -based prescription is that straightforwardly traces the optical depth change (Teng et al., 2022, 2023), making it closer to the underlying physics that could control variations. Another advantage is that can be directly obtained from the CO data. Thus, no ancillary multi-band data are needed to estimate , which circumvents uncertainties in translating observations into . We remind readers that our prescription is calibrated to in CO (2–1), which is typically consistent with in CO (1–0) but may be different from that measured in higher- CO lines (Yuan et al., 2020; Teng et al., 2022, 2023). We also point out that systematic measurements of at 150-pc resolutions can be difficult across more extreme starbursts like U/LIRGs (e.g., Wilson et al., 2019), which are usually more distant and/or more morphologically-disturbed than the galaxies in our sample.
We note that the scaling of with in Equation 2 is similar to what would be predicted by simple theoretical arguments. As shown by Equation 8 in Gong et al. (2020, see also related derivations in Chapter 19 of and Chapter 8 of ), the excitation temperature () under Large Velocity Gradient approximation with assumptions of a two-level optically-thick system can be written as
| (4) |
where and are the density and size of a CO-emitting molecular cloud, respectively. To first order, we also have from the cloud. Thus, combining Equation 1 with Equation 4, we obtain
| (5) |
The resulting dependence on the inverse square root of is similar to the fits in Figure 1. While the fitted slope for (Equation 2) is slightly steeper than -0.5, we emphasize that the above calculation is highly simplified and is only for providing an intuitive check with theoretical expectations.
3.3 Star Formation Efficiency in Galaxy Centers
As determines the total molecular gas surface density (, in units of M⊙ pc-2), the variation of directly affects the estimation of molecular gas depletion time () or SFE ():
| (6) |
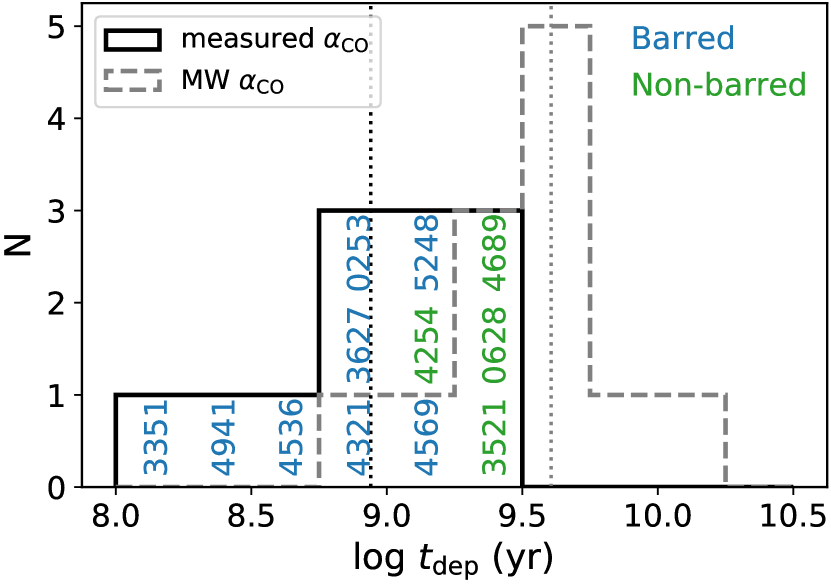
While we examine only the SFE in this work, we note that the impact of on estimating the SFE per molecular cloud free-fall time is even more significant, as also affects the assessment of cloud density which changes the free-fall time (e.g., Querejeta et al., 2023; Sun et al., 2023). Motivated by the clear trend of galaxy centers having lower values (Figures 1(a) and 2(a)), we derive for the 12 galaxy centers with measurements (C23; T23), using kpc-scale and (see Table LABEL:tab:sample). Then, we examine how in galaxy centers derived from the measured would differ from that using the standard MW of 4.35 (or 6.7 in terms of ) .
Figure 2(b) presents histograms of for the 12 galaxy centers. For the histogram using the measured , we separate barred and non-barred galaxies with different colors. We find that the median with the MW is 4–5 times longer than that with the measured . Furthermore, adopting the MW results in a similar of 3 Gyr between barred and non-barred centers. In contrast, if the measured is used, the median of barred and non-barred centers becomes 0.6 Gyr and 2.0 Gyr, respectively, differing by more than a factor of three. This suggests that SFE in barred galaxy centers tend to be higher than non-barred galaxy centers, and that using a constant can obscure such a trend.
(a)
(b)
3.4 Systematic Impact on Star Formation Efficiency
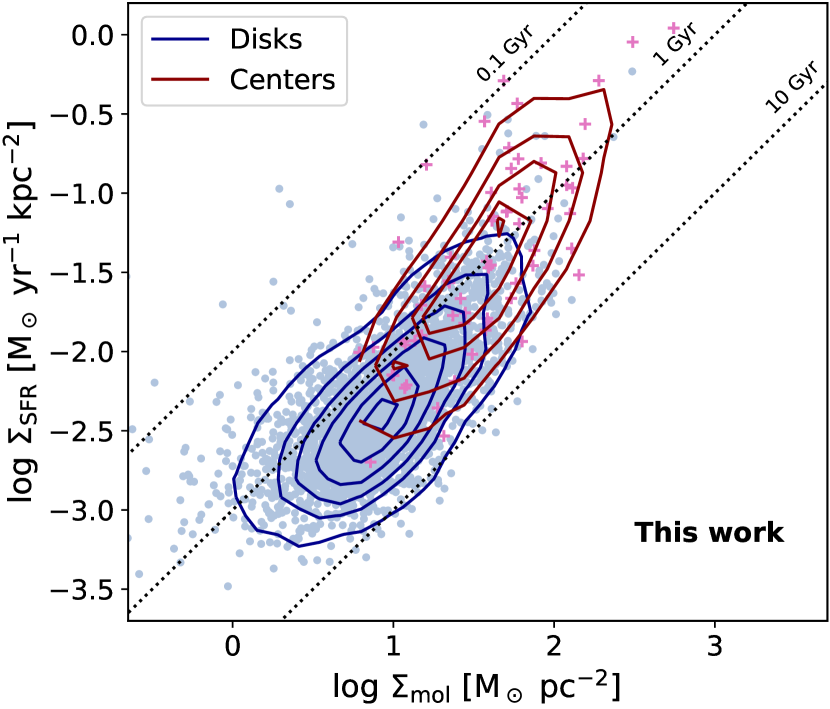
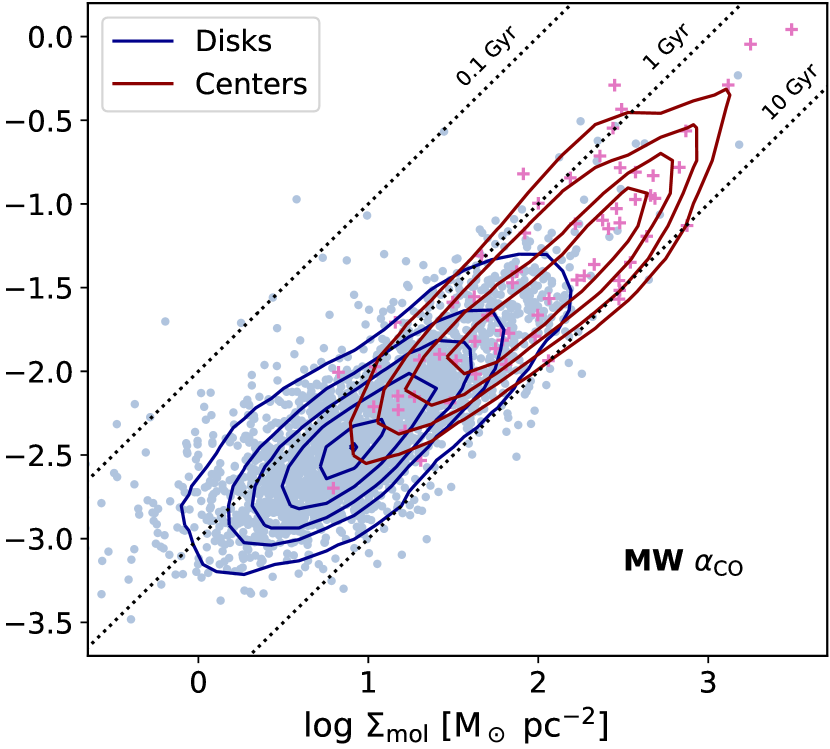
With the PHANGS sample (Table LABEL:tab:sample), we investigate the impact of different prescriptions on SFE or in the centers and disks of barred and non-barred galaxies. Figure 3 shows the molecular Kennicutt-Schmidt (mKS) relation across all 65 galaxies measured at the 1.5-kpc scale, comparing determined from our prescription (Equation 2) with that determined using a MW . It is clear that adopting the MW results in a wider range of with values reaching M⊙ pc-2 in galaxy centers, while our prescription suggests M⊙ pc-2 in general. Furthermore, our prescription reveals a trend of higher SFE towards higher , which steepens the mKS relation for galaxy centers and other high- regions. With the MW , however, both galaxy centers and disks exhibit a roughly constant SFE. These results show that and in galaxy centers may overall be overestimated by a factor of 5 with the MW , and that the choice of greatly affects our understanding of galactic-scale star formation.
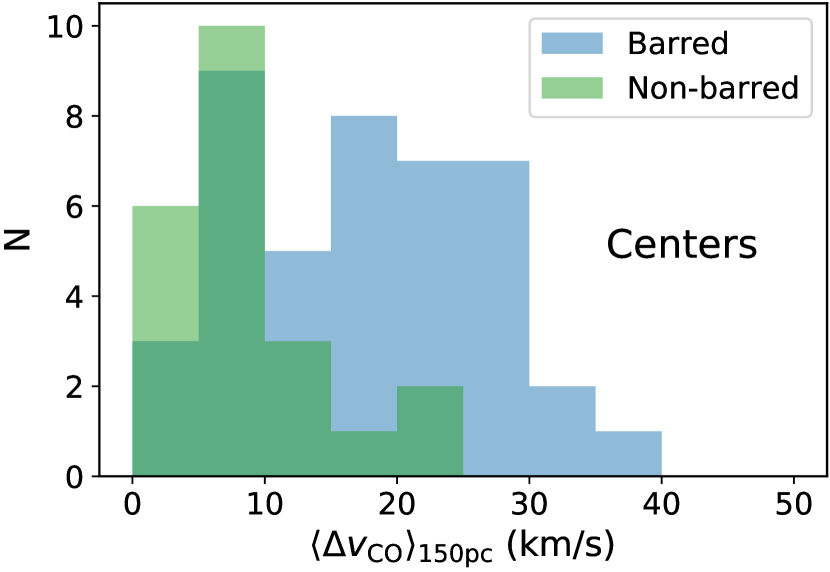
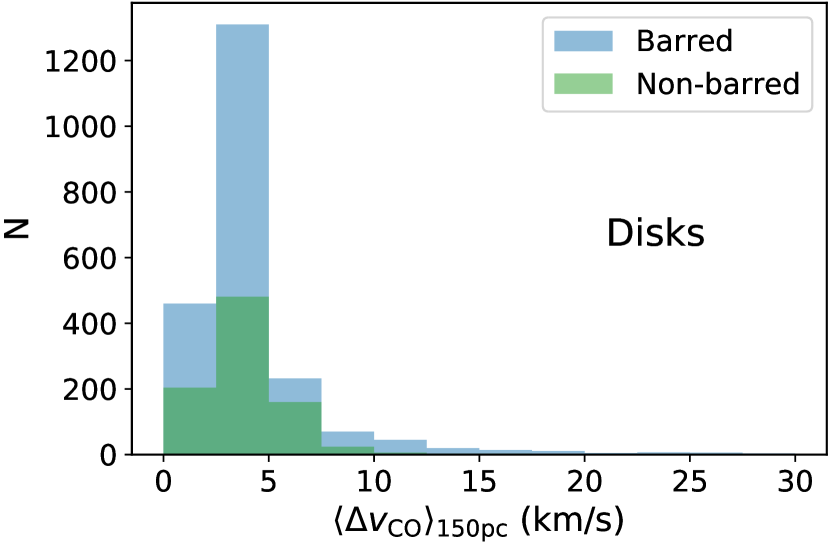
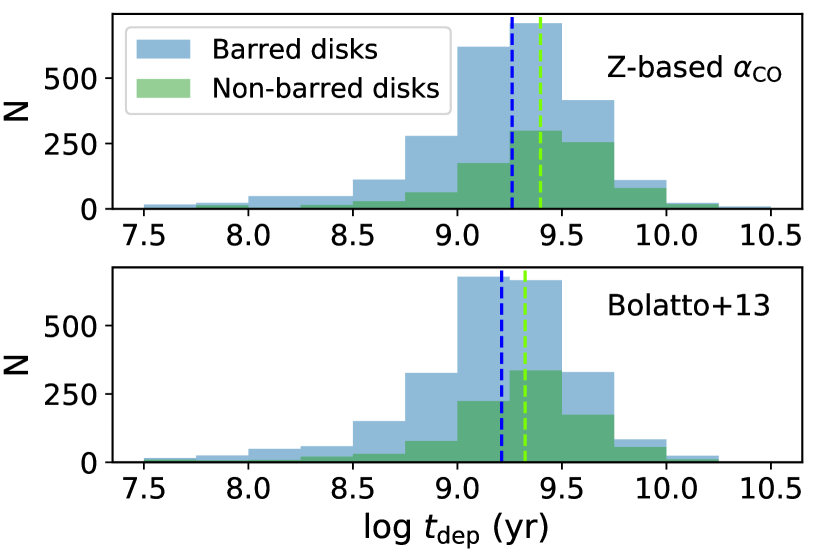
Figure 4 presents histograms of velocity dispersion and across the PHANGS sample, separating centers (upper panels) and disks (lower panels) for barred (blue) and non-barred (green) galaxies. In non-barred galaxy centers, is typically km s-1, while barred centers span a significantly wider range up to 40 km s-1. On the other hand, barred and non-barred disks show consistent velocity dispersion, with typically below 5 km s-1 but reaching up to 10 km s-1. These distributions agree with Sun et al. (2020b), who reported similar between galaxy disks and non-barred centers but an overall 5 times higher in barred centers.
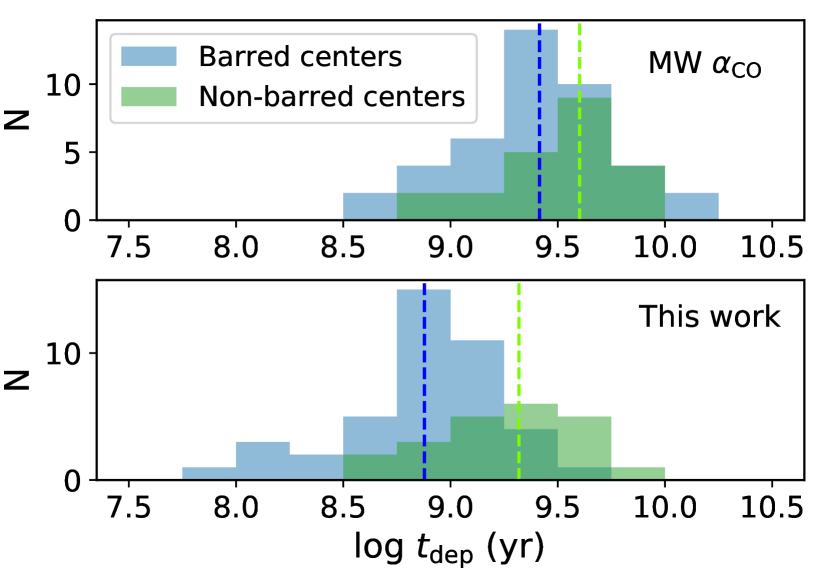
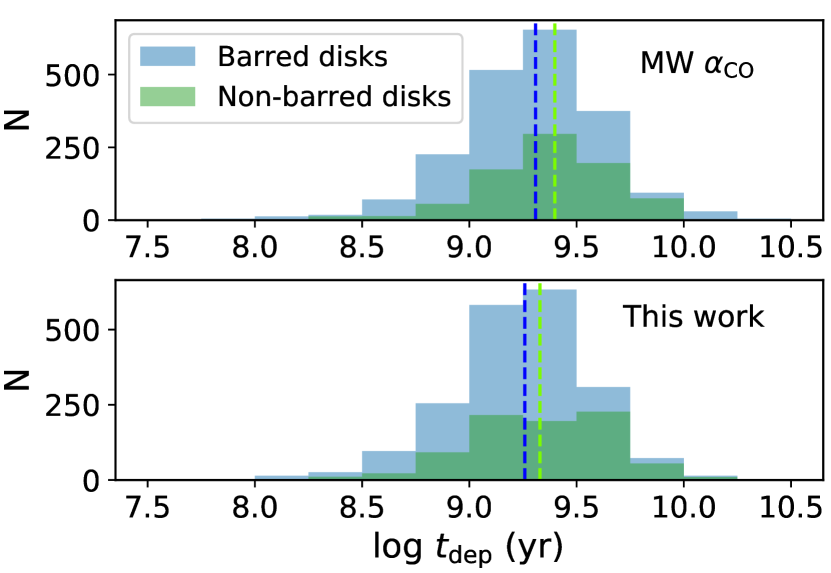
We then examine the distribution of derived with different prescriptions. Using our -based prescription, we find distinctly different between barred and non-barred centers, with the mean/median of in barred galaxy centers (700 Myr) being 3 times shorter than in non-barred centers ( Gyr). The 16th–84th percentile ranges for in barred and non-barred centers is 0.3–1.6 and 0.8–3.6 Gyr, respectively. In contrast, all other prescriptions result in dex difference between the median of the two types of systems. Such a small difference between barred and non-barred centers is even true for the B13 prescription which shows similarly short for all galaxy centers that generally matches our results. Particularly, the MW leads to two completely overlapping distributions, overestimating the overall in barred galaxy centers by a factor of 3–4 if compared to our results. As for the disks, the median of remains consistent at 2–3 Gyr across all four prescriptions, while it is found to be systematically lower in barred galaxies than in non-barred galaxies by 0.1 dex.
Notably, our prescription reveals short down to 100 Myr in some barred galaxy centers, which is not seen with other prescriptions. Such a short time scale is supported by recent simulations of galaxy centers including effects from bar-driven inflows (e.g., Armillotta et al., 2019; Sormani et al., 2020; Moon et al., 2021). In addition, we note that the overall for galaxy centers is similar between our result and B13’s, both suggesting 1 Gyr which is shorter than the disks value of 3 Gyr. This factor-of-three difference between centers and disks is consistent with recent simulations (e.g., Tress et al., 2020a). However, using the MW or -based for galaxy centers obscures such difference and leads to similar across entire galaxies.
4 Discussion
The correlation of with 100-pc scale velocity dispersion with only a dex scatter (see Section 3.1), contrary to 0.3 dex or larger scatter using - and/or -based prescriptions, shows that velocity dispersion is an excellent observational tracer for variations in star-forming galaxies. The rationale behind such a strong relation may be that directly traces the optical depth changes that are the dominant effect responsible for altering across these galaxies, as it has been shown that opacity variation is the primary driver of in various galaxy centers (Israel, 2020; Teng et al., 2022, 2023). However, effects of CO-dark gas and CO excitation can also be important to explain variations across the galaxy disks, which have therefore motivated previous prescriptions based on metallicity and/or CO integrated intensity (e.g., Narayanan et al., 2012; Hunt et al., 2015; Amorín et al., 2016; Accurso et al., 2017; Gong et al., 2020).
As discussed in Section 3.2, the correlation of with metallicity () is indirectly included in the dependence with because both and vary with galactocentric radius and are thus correlated. Furthermore, statistical studies on molecular cloud properties have shown that velocity dispersion also correlates well with molecular gas surface density and the CO integrated intensity across galaxy disks (Heyer et al., 2009; Sun et al., 2020b, 2022; Rosolowsky et al., 2021). Therefore, it is likely that our -based prescription contains opacity variations and metallicity gradients as well as the physics of the – correlation suggested by simulation studies (Narayanan et al., 2012; Gong et al., 2020; Hu et al., 2022). This means that the proposed prescription (Equation 2) may incorporate more than one piece of physics into a single scaling relation, which could explain why the trend holds across different galactic environments. We also note that metallicity effects on should be more drastic in low-metallicity dwarf galaxies due to the lack of dust shielding that can prevent CO from dissociation, and thus metallicity variations being included in our -based prescription might only be true in the context of MW-like star-forming disk galaxies as represented by the PHANGS sample.
In Sections 3.3 and 3.4, our prescription (based on the dust measurements) suggests lower in barred galaxy centers that lead to higher SFE than non-barred centers and the disks. This low and high SFE in barred centers imply that the amount of molecular gas can be overestimated by previous studies due to inaccurate or the assumption of a constant SFE. By comparing the derived under different assumptions for all galaxies in Table LABEL:tab:sample, we find that the median of barred centers is 3 times higher than that of non-barred centers if using a MW-like . On the other hand, our prescription results in only 1.3 times higher in barred centers. Therefore, it is likely that the enhanced SFE is a more important factor causing high SFR observed in barred galaxy centers, compared to an increased amount of molecular gas driven inwards by bars.
Recent studies using prescriptions from Narayanan et al. (2012) or B13 also show that barred galaxies tend to have higher central gas concentration than non-barred galaxies, although the degree of concentration is not as significant as using a constant (Sakamoto et al., 1999; Sheth et al., 2005; Schinnerer et al., 2006; Kuno et al., 2007). Such accumulation of gas towards the centers can increase SFR in barred centers, and it is consistent with the theoretical expectation that non-axisymmetric gravitational potential from bars can induce gas inflows and transport more gas into galaxy centers (e.g., Wada & Habe, 1995; Regan & Teuben, 2004; Kim et al., 2012; Tress et al., 2020b). Bars thus influence the secular evolution of galaxies by redistributing molecular gas mass and angular momentum (see review by Kormendy & Kennicutt, 2004).
Studies have also shown that if changes were treated properly, starbursts in galaxy centers and variations of SFRs across nearby galaxies are primarily driven by higher SFE rather than increased molecular gas fraction (Leroy et al., 2013; Ellison et al., 2020a, b; den Brok et al., 2023). This is contrary to studies using constant, -based, or -based , which resulted in similar SFE between barred and non-barred galaxies (e.g., Saintonge et al., 2012; Querejeta et al., 2021, see also Section 3.4). With our proposed prescription, we find enhanced SFE in barred centers, which could originate from variations in molecular gas distribution, density structure, or dynamical effects of turbulence and shocks powered by stellar feedback (e.g., Kainulainen et al., 2009; Renaud et al., 2012; Liu et al., 2023). However, these factors driving SFE variations are the same ones that can alter CO emissivity and . Therefore, only with accurate values can we disentangle SFE from and unravel the physical drivers of SFR. Using the latest and best possible measurements of and molecular gas properties across a sample of nearby galaxies, our work lays a foundation for benchmarking calibration in star-forming galaxies (including starbursting galaxy centers) and allows for further investigation on SFE, SFE per cloud free-fall time, or other related properties that can improve our knowledge of galaxy evolution.
5 Conclusions
We construct a new prescription applicable to star-forming galaxies, where CO emissivity variations are critical in altering . The prescription is a major step towards precise calibration of across galaxies, and it reveals unprecedented trends in star formation properties which may have been obscured by previous prescriptions. Our key results are summarized as follows:
-
1.
The strong anti-correlation between measured and CO velocity dispersion () at 100-pc scales shows that is useful for predicting , and it suggests that CO opacity altered by changes or other correlated properties of the molecular gas across the entire galaxies are primary drivers of in star-forming galaxies.
-
2.
The proposed prescription (Equation 2) is applicable to regions with metallicity above and km s-1. The expected scatter in is dex, which is a substantial improvement over existing prescriptions. Our -based prescription has the advantage of connecting directly to the physical causes of change (e.g., CO opacity) as well as requiring only the CO observations which is most relevant to tracing molecular gas.
-
3.
With the measured , we find distinctly shorter molecular gas depletion time () in barred galaxy centers than non-barred galaxy centers, as well as a generally shorter in galaxy centers than the disks. In contrast, assuming a constant MW results in Gyr for all regions, which underestimates the star formation efficiency (SFE) in galaxy centers and also obscures the difference between barred and non-barred galaxies.
-
4.
Our prescription reveals short down to 100 Myr in barred galaxy centers, with the median (0.7 Gyr) being 3 times shorter than in non-barred galaxy centers (2.1 Gyr). However, all other prescriptions (MW, metallicity-based, and B13) show dex difference between the two regions, even if B13 results in an overall shorter for galaxy centers which aligns better with our results. Thus, SFE in barred galaxy centers may be underestimated by a factor of three or more in previous studies due to uncertainties.
- 5.
This work was carried out as part of the PHANGS collaboration. Y.-H.T. and K.S. acknowledge funding support from NRAO Student Observing Support Grant SOSPADA-012 and from the National Science Foundation (NSF) under grant No. 2108081. Y.-H.T. also acknowledges support by the Ministry of Education of Taiwan through Government Scholarship to Study Abroad. J.S. acknowledges support by the Natural Sciences and Engineering Research Council of Canada (NSERC) through a Canadian Institute for Theoretical Astrophysics (CITA) National Fellowship. KG is supported by the Australian Research Council through the Discovery Early Career Researcher Award (DECRA) Fellowship (project number DE220100766) funded by the Australian Government. KG is supported by the Australian Research Council Centre of Excellence for All Sky Astrophysics in 3 Dimensions (ASTRO 3D), through project number CE170100013. HAP acknowledges support by the National Science and Technology Council of Taiwan under grant 110-2112-M-032-020-MY3. MB gratefully acknowledges support from the ANID BASAL project FB210003 and from the FONDECYT regular grant 1211000. IC thanks the National Science and Technology Council for support through grant 111-2112-M-001-038-MY3, and the Academia Sinica for Investigator Award AS-IA-109-M02. JC acknowledges funding from the Belgian Science Policy Office (BELSPO) through the PRODEX project “JWST/MIRI Science exploitation” (C4000142239). MC gratefully acknowledges funding from the DFG through an Emmy Noether Research Group (grant number CH2137/1-1). COOL Research DAO is a Decentralized Autonomous Organization supporting research in astrophysics aimed at uncovering our cosmic origins. SKS acknowledges financial support from the German Research Foundation (DFG) via Sino-German research grant SCHI 536/11-1. AU acknowledges support from the Spanish grant PID2019-108765GB-I00, funded by MCIN/AEI/10.13039/501100011033. J. D. H. gratefully acknowledges financial support from the Royal Society (University Research Fellowship; URF/R1/221620).
This paper makes use of the following ALMA data: ADS/JAO.ALMA#2012.1.00650.S, ADS/JAO.ALMA#2013.1.00803.S, ADS/JAO.ALMA#2013.1.01161.S, ADS/JAO.ALMA#2015.1.00925.S, ADS/JAO.ALMA#2015.1.00956.S, ADS/JAO.ALMA#2017.1.00392.S, ADS/JAO.ALMA#2017.1.00766.S, ADS/JAO.ALMA#2017.1.00886.L, ADS/JAO.ALMA#2018.1.01321.S, ADS/JAO.ALMA#2018.1.01651.S. ADS/JAO.ALMA#2018.A.00062.S. ALMA is a partnership of ESO (representing its member states), NSF (USA), and NINS (Japan), together with NRC (Canada), NSC and ASIAA (Taiwan), and KASI (Republic of Korea), in cooperation with the Republic of Chile. The Joint ALMA Observatory is operated by ESO, AUI/NRAO, and NAOJ. The National Radio Astronomy Observatory is a facility of the National Science Foundation operated under cooperative agreement by Associated Universities, Inc. This work is based in part on data products from the Wide-field Infrared Survey Explorer(Wright et al., 2010), which is a joint project of the University of California, Los Angeles, and the Jet Propulsion Laboratory/California Institute of Technology, funded by the National Aeronautics and Space Administration. We acknowledge the usage of the SAO/NASA Astrophysics Data System.
References
- Accurso et al. (2017) Accurso, G., Saintonge, A., Bisbas, T. G., & Viti, S. 2017, MNRAS, 464, 3315, doi: 10.1093/mnras/stw2580
- Ackermann et al. (2012) Ackermann, M., Ajello, M., Atwood, W. B., et al. 2012, ApJ, 750, 3, doi: 10.1088/0004-637X/750/1/3
- Amorín et al. (2016) Amorín, R., Muñoz-Tuñón, C., Aguerri, J. A. L., & Planesas, P. 2016, A&A, 588, A23, doi: 10.1051/0004-6361/201526397
- Anand et al. (2021) Anand, G. S., Lee, J. C., Van Dyk, S. D., et al. 2021, MNRAS, 501, 3621, doi: 10.1093/mnras/staa3668
- Armillotta et al. (2019) Armillotta, L., Krumholz, M. R., Di Teodoro, E. M., & McClure-Griffiths, N. M. 2019, MNRAS, 490, 4401, doi: 10.1093/mnras/stz2880
- Astropy Collaboration et al. (2013) Astropy Collaboration, Robitaille, T. P., Tollerud, E. J., et al. 2013, A&A, 558, A33, doi: 10.1051/0004-6361/201322068
- Astropy Collaboration et al. (2018) Astropy Collaboration, Price-Whelan, A. M., Sipőcz, B. M., et al. 2018, AJ, 156, 123, doi: 10.3847/1538-3881/aabc4f
- Bigiel et al. (2008) Bigiel, F., Leroy, A., Walter, F., et al. 2008, AJ, 136, 2846, doi: 10.1088/0004-6256/136/6/2846
- Bolatto et al. (2013) Bolatto, A. D., Wolfire, M., & Leroy, A. K. 2013, ARA&A, 51, 207, doi: 10.1146/annurev-astro-082812-140944
- Chiang et al. (2023) Chiang, I.-D., Sandstrom, K. M., Chastenet, J., et al. 2023, arXiv e-prints, arXiv:2311.00407, doi: 10.48550/arXiv.2311.00407
- Cicone et al. (2018) Cicone, C., Severgnini, P., Papadopoulos, P. P., et al. 2018, ApJ, 863, 143, doi: 10.3847/1538-4357/aad32a
- Cormier et al. (2018) Cormier, D., Bigiel, F., Jiménez-Donaire, M. J., et al. 2018, MNRAS, 475, 3909, doi: 10.1093/mnras/sty059
- Davis et al. (2022) Davis, T. A., Gensior, J., Bureau, M., et al. 2022, MNRAS, 512, 1522, doi: 10.1093/mnras/stac600
- De Vis et al. (2019) De Vis, P., Jones, A., Viaene, S., et al. 2019, A&A, 623, A5, doi: 10.1051/0004-6361/201834444
- den Brok et al. (2023) den Brok, J. S., Bigiel, F., Chastenet, J., et al. 2023, arXiv e-prints, arXiv:2302.03044, doi: 10.48550/arXiv.2302.03044
- Downes & Solomon (1998) Downes, D., & Solomon, P. M. 1998, ApJ, 507, 615, doi: 10.1086/306339
- Draine (2011) Draine, B. T. 2011, Physics of the Interstellar and Intergalactic Medium
- Ellison et al. (2021a) Ellison, S. L., Lin, L., Thorp, M. D., et al. 2021a, MNRAS, 501, 4777, doi: 10.1093/mnras/staa3822
- Ellison et al. (2020a) Ellison, S. L., Thorp, M. D., Pan, H.-A., et al. 2020a, MNRAS, 492, 6027, doi: 10.1093/mnras/staa001
- Ellison et al. (2020b) Ellison, S. L., Thorp, M. D., Lin, L., et al. 2020b, MNRAS, 493, L39, doi: 10.1093/mnrasl/slz179
- Ellison et al. (2021b) Ellison, S. L., Wong, T., Sánchez, S. F., et al. 2021b, MNRAS, 505, L46, doi: 10.1093/mnrasl/slab047
- Esteban et al. (2022) Esteban, C., Méndez-Delgado, J. E., García-Rojas, J., & Arellano-Córdova, K. Z. 2022, ApJ, 931, 92, doi: 10.3847/1538-4357/ac6b38
- Genzel et al. (2012) Genzel, R., Tacconi, L. J., Combes, F., et al. 2012, ApJ, 746, 69, doi: 10.1088/0004-637X/746/1/69
- Gong et al. (2020) Gong, M., Ostriker, E. C., Kim, C.-G., & Kim, J.-G. 2020, ApJ, 903, 142, doi: 10.3847/1538-4357/abbdab
- Harris et al. (2020) Harris, C. R., Millman, K. J., van der Walt, S. J., et al. 2020, Nature, 585, 357, doi: 10.1038/s41586-020-2649-2
- Herrero-Illana et al. (2019) Herrero-Illana, R., Privon, G. C., Evans, A. S., et al. 2019, A&A, 628, A71, doi: 10.1051/0004-6361/201834088
- Heyer et al. (2009) Heyer, M., Krawczyk, C., Duval, J., & Jackson, J. M. 2009, ApJ, 699, 1092, doi: 10.1088/0004-637X/699/2/1092
- Hu et al. (2022) Hu, C.-Y., Schruba, A., Sternberg, A., & van Dishoeck, E. F. 2022, ApJ, 931, 28, doi: 10.3847/1538-4357/ac65fd
- Hunt et al. (2015) Hunt, L. K., García-Burillo, S., Casasola, V., et al. 2015, A&A, 583, A114, doi: 10.1051/0004-6361/201526553
- Hunter (2007) Hunter, J. D. 2007, Computing In Science & Engineering, 9, 90
- Israel (1997) Israel, F. P. 1997, A&A, 328, 471. https://arxiv.org/abs/astro-ph/9709194
- Israel (2020) —. 2020, A&A, 635, A131, doi: 10.1051/0004-6361/201834198
- Jiménez-Donaire et al. (2023) Jiménez-Donaire, M. J., Brown, T., Wilson, C. D., et al. 2023, A&A, 671, A3, doi: 10.1051/0004-6361/202244718
- Kainulainen et al. (2009) Kainulainen, J., Beuther, H., Henning, T., & Plume, R. 2009, A&A, 508, L35, doi: 10.1051/0004-6361/200913605
- Kennicutt (1998) Kennicutt, Robert C., J. 1998, ApJ, 498, 541, doi: 10.1086/305588
- Kim et al. (2012) Kim, W.-T., Seo, W.-Y., Stone, J. M., Yoon, D., & Teuben, P. J. 2012, ApJ, 747, 60, doi: 10.1088/0004-637X/747/1/60
- Koda et al. (2023) Koda, J., Hirota, A., Egusa, F., et al. 2023, ApJ, 949, 108, doi: 10.3847/1538-4357/acc65e
- Kormendy & Kennicutt (2004) Kormendy, J., & Kennicutt, Robert C., J. 2004, ARA&A, 42, 603, doi: 10.1146/annurev.astro.42.053102.134024
- Kreckel et al. (2019) Kreckel, K., Ho, I. T., Blanc, G. A., et al. 2019, ApJ, 887, 80, doi: 10.3847/1538-4357/ab5115
- Krieger et al. (2017) Krieger, N., Ott, J., Beuther, H., et al. 2017, ApJ, 850, 77, doi: 10.3847/1538-4357/aa951c
- Krumholz (2015) Krumholz, M. R. 2015, arXiv e-prints, arXiv:1511.03457, doi: 10.48550/arXiv.1511.03457
- Kuno et al. (2007) Kuno, N., Sato, N., Nakanishi, H., et al. 2007, PASJ, 59, 117, doi: 10.1093/pasj/59.1.117
- Lang et al. (2020) Lang, P., Meidt, S. E., Rosolowsky, E., et al. 2020, ApJ, 897, 122, doi: 10.3847/1538-4357/ab9953
- Leroy et al. (2008) Leroy, A. K., Walter, F., Brinks, E., et al. 2008, AJ, 136, 2782, doi: 10.1088/0004-6256/136/6/2782
- Leroy et al. (2011) Leroy, A. K., Bolatto, A., Gordon, K., et al. 2011, ApJ, 737, 12, doi: 10.1088/0004-637X/737/1/12
- Leroy et al. (2013) Leroy, A. K., Walter, F., Sandstrom, K., et al. 2013, AJ, 146, 19, doi: 10.1088/0004-6256/146/2/19
- Leroy et al. (2021) Leroy, A. K., Schinnerer, E., Hughes, A., et al. 2021, ApJS, 257, 43, doi: 10.3847/1538-4365/ac17f3
- Liu et al. (2023) Liu, D., Schinnerer, E., Cao, Y., et al. 2023, ApJ, 944, L19, doi: 10.3847/2041-8213/aca973
- Lu et al. (2022) Lu, A., Boyce, H., Haggard, D., et al. 2022, MNRAS, 514, 5035, doi: 10.1093/mnras/stac1583
- Madden et al. (2020) Madden, S. C., Cormier, D., Hony, S., et al. 2020, A&A, 643, A141, doi: 10.1051/0004-6361/202038860
- Maeda et al. (2023) Maeda, F., Egusa, F., Ohta, K., Fujimoto, Y., & Habe, A. 2023, ApJ, 943, 7, doi: 10.3847/1538-4357/aca664
- Moon et al. (2021) Moon, S., Kim, W.-T., Kim, C.-G., & Ostriker, E. C. 2021, ApJ, 914, 9, doi: 10.3847/1538-4357/abfa93
- Muraoka et al. (2019) Muraoka, K., Sorai, K., Miyamoto, Y., et al. 2019, PASJ, 71, S15, doi: 10.1093/pasj/psz015
- Narayanan et al. (2012) Narayanan, D., Krumholz, M. R., Ostriker, E. C., & Hernquist, L. 2012, MNRAS, 421, 3127, doi: 10.1111/j.1365-2966.2012.20536.x
- Papadopoulos et al. (2012) Papadopoulos, P. P., van der Werf, P., Xilouris, E., Isaak, K. G., & Gao, Y. 2012, ApJ, 751, 10, doi: 10.1088/0004-637X/751/1/10
- Pérez & Granger (2007) Pérez, F., & Granger, B. E. 2007, Computing in Science and Engineering, 9, 21, doi: 10.1109/MCSE.2007.53
- Pessa et al. (2021) Pessa, I., Schinnerer, E., Belfiore, F., et al. 2021, A&A, 650, A134, doi: 10.1051/0004-6361/202140733
- Pettini & Pagel (2004) Pettini, M., & Pagel, B. E. J. 2004, MNRAS, 348, L59, doi: 10.1111/j.1365-2966.2004.07591.x
- Pilyugin & Grebel (2016) Pilyugin, L. S., & Grebel, E. K. 2016, MNRAS, 457, 3678, doi: 10.1093/mnras/stw238
- Pitts & Barnes (2021) Pitts, R. L., & Barnes, P. J. 2021, ApJS, 256, 3, doi: 10.3847/1538-4365/ac063d
- Querejeta et al. (2023) Querejeta, M., Pety, J., Schruba, A., et al. 2023, arXiv e-prints, arXiv:2310.06501, doi: 10.48550/arXiv.2310.06501
- Querejeta et al. (2021) Querejeta, M., Schinnerer, E., Meidt, S., et al. 2021, A&A, 656, A133, doi: 10.1051/0004-6361/202140695
- Ramambason et al. (2023) Ramambason, L., Lebouteiller, V., Madden, S. C., et al. 2023, arXiv e-prints, arXiv:2306.14881, doi: 10.48550/arXiv.2306.14881
- Regan & Teuben (2004) Regan, M. W., & Teuben, P. J. 2004, ApJ, 600, 595, doi: 10.1086/380116
- Renaud et al. (2019) Renaud, F., Bournaud, F., Daddi, E., & Weiß, A. 2019, A&A, 621, A104, doi: 10.1051/0004-6361/201834397
- Renaud et al. (2012) Renaud, F., Kraljic, K., & Bournaud, F. 2012, ApJ, 760, L16, doi: 10.1088/2041-8205/760/1/L16
- Rosolowsky et al. (2021) Rosolowsky, E., Hughes, A., Leroy, A. K., et al. 2021, MNRAS, 502, 1218, doi: 10.1093/mnras/stab085
- Saintonge & Catinella (2022) Saintonge, A., & Catinella, B. 2022, ARA&A, 60, 319, doi: 10.1146/annurev-astro-021022-043545
- Saintonge et al. (2011) Saintonge, A., Kauffmann, G., Wang, J., et al. 2011, MNRAS, 415, 61, doi: 10.1111/j.1365-2966.2011.18823.x
- Saintonge et al. (2012) Saintonge, A., Tacconi, L. J., Fabello, S., et al. 2012, ApJ, 758, 73, doi: 10.1088/0004-637X/758/2/73
- Sakamoto et al. (1999) Sakamoto, K., Okumura, S. K., Ishizuki, S., & Scoville, N. Z. 1999, ApJ, 525, 691, doi: 10.1086/307910
- Sandstrom et al. (2013) Sandstrom, K. M., Leroy, A. K., Walter, F., et al. 2013, ApJ, 777, 5, doi: 10.1088/0004-637X/777/1/5
- Schinnerer et al. (2006) Schinnerer, E., Böker, T., Emsellem, E., & Lisenfeld, U. 2006, ApJ, 649, 181, doi: 10.1086/506265
- Schruba et al. (2019) Schruba, A., Kruijssen, J. M. D., & Leroy, A. K. 2019, ApJ, 883, 2, doi: 10.3847/1538-4357/ab3a43
- Schruba et al. (2011) Schruba, A., Leroy, A. K., Walter, F., et al. 2011, AJ, 142, 37, doi: 10.1088/0004-6256/142/2/37
- Schruba et al. (2017) Schruba, A., Leroy, A. K., Kruijssen, J. M. D., et al. 2017, ApJ, 835, 278, doi: 10.3847/1538-4357/835/2/278
- Sharda et al. (2022) Sharda, P., Menon, S. H., Federrath, C., et al. 2022, MNRAS, 509, 2180, doi: 10.1093/mnras/stab3048
- Sheth et al. (2005) Sheth, K., Vogel, S. N., Regan, M. W., Thornley, M. D., & Teuben, P. J. 2005, ApJ, 632, 217, doi: 10.1086/432409
- Sliwa et al. (2017) Sliwa, K., Wilson, C. D., Matsushita, S., et al. 2017, ApJ, 840, 8, doi: 10.3847/1538-4357/aa689b
- Sormani et al. (2020) Sormani, M. C., Tress, R. G., Glover, S. C. O., et al. 2020, MNRAS, 497, 5024, doi: 10.1093/mnras/staa1999
- Sun et al. (2020a) Sun, J., Leroy, A. K., Ostriker, E. C., et al. 2020a, ApJ, 892, 148, doi: 10.3847/1538-4357/ab781c
- Sun et al. (2020b) Sun, J., Leroy, A. K., Schinnerer, E., et al. 2020b, ApJ, 901, L8, doi: 10.3847/2041-8213/abb3be
- Sun et al. (2022) Sun, J., Leroy, A. K., Rosolowsky, E., et al. 2022, AJ, 164, 43, doi: 10.3847/1538-3881/ac74bd
- Sun et al. (2023) Sun, J., Leroy, A. K., Ostriker, E. C., et al. 2023, ApJ, 945, L19, doi: 10.3847/2041-8213/acbd9c
- Teng et al. (2022) Teng, Y.-H., Sandstrom, K. M., Sun, J., et al. 2022, ApJ, 925, 72, doi: 10.3847/1538-4357/ac382f
- Teng et al. (2023) —. 2023, ApJ, 950, 119, doi: 10.3847/1538-4357/accb86
- Tress et al. (2020a) Tress, R. G., Smith, R. J., Sormani, M. C., et al. 2020a, MNRAS, 492, 2973, doi: 10.1093/mnras/stz3600
- Tress et al. (2020b) Tress, R. G., Sormani, M. C., Glover, S. C. O., et al. 2020b, MNRAS, 499, 4455, doi: 10.1093/mnras/staa3120
- Utomo et al. (2017) Utomo, D., Bolatto, A. D., Wong, T., et al. 2017, ApJ, 849, 26, doi: 10.3847/1538-4357/aa88c0
- Villanueva et al. (2022) Villanueva, V., Bolatto, A. D., Vogel, S., et al. 2022, ApJ, 940, 176, doi: 10.3847/1538-4357/ac9d3c
- Virtanen et al. (2020) Virtanen, P., Gommers, R., Oliphant, T. E., et al. 2020, Nature Methods, 17, 261, doi: https://doi.org/10.1038/s41592-019-0686-2
- Wada & Habe (1995) Wada, K., & Habe, A. 1995, MNRAS, 277, 433, doi: 10.1093/mnras/277.2.433
- Williams et al. (2023) Williams, T. G., Bureau, M., Davis, T. A., et al. 2023, MNRAS, 525, 4270, doi: 10.1093/mnras/stad2455
- Wilson et al. (2019) Wilson, C. D., Elmegreen, B. G., Bemis, A., & Brunetti, N. 2019, ApJ, 882, 5, doi: 10.3847/1538-4357/ab31f3
- Wright et al. (2010) Wright, E. L., Eisenhardt, P. R. M., Mainzer, A. K., et al. 2010, AJ, 140, 1868, doi: 10.1088/0004-6256/140/6/1868
- Yasuda et al. (2023) Yasuda, A., Kuno, N., Sorai, K., et al. 2023, PASJ, 75, 743, doi: 10.1093/pasj/psad034
- Yuan et al. (2020) Yuan, Y., Krumholz, M. R., & Burkhart, B. 2020, MNRAS, 498, 2440, doi: 10.1093/mnras/staa2432