Comparing emission- and absorption-based gas-phase metallicities in GRB host galaxies at using JWST
Abstract
JWST/NIRSpec is providing sensitive spectroscopic observations of distant galaxies, extending our view of cosmic chemical evolution out to the epoch of reionization and down to galaxy masses 1–2 dex lower than previously possible at . These observations nevertheless remain heavily dominated by light from luminous star forming regions. An alternative and sensitive probe of the metallicity of galaxies is through absorption lines imprinted on the luminous afterglow spectra of long gamma ray burst (GRBs) from intervening material within their host galaxy. However, these two independent but complementary probes need to be cross-calibrated before they can be combined. We present the first results from a cycle-1 JWST program to investigate the relation between the metallicity of the neutral gas measured with GRB afterglow absorption lines to the emission line metallicity of the star forming regions of the GRB host measured with NIRSpec. Using an initial sample of seven GRB host galaxies at , we find a tight relation between absorption and emission line metallicities when using the recent Laseter et al. (2023) metallicity diagnostic, implying a relatively chemically-homogeneous multi-phase interstellar medium, and indicating that absorption and emission line probes can be directly combined to investigate the chemical enrichment of galaxies. However, the relation is less clear when using other diagnostics, such as and . Ultimate confirmation of the relation between absorption and emission line metallicities will require a more direct determination of the emission line metallicity via the detection of temperature-sensitive auroral lines in our GRB host galaxy sample.
keywords:
gamma-ray burst: general; galaxies: abundances; galaxies: star formation1 Introduction
The chemical enrichment of galaxies across cosmic time encodes vital information on galaxy evolution, tracing the successive episodes of star formation that synthesise and recycle metals back into the galaxy interstellar medium (ISM).
The most direct method available to trace metals in the gas phase is using metal recombination lines (e.g. Osterbrock, 1989; Peimbert et al., 1993). These probe the ionised gas in Hii regions and are relatively unaffected by temperature fluctuations. However, they are extremely faint ( times fainter than the hydrogen recombination line, H), limiting this method to only the highest-resolution spectra of nearby systems (e.g. Esteban et al., 2009, 2014). Alternatively, measurements of the electron temperature () in Hii regions can also provide (semi-)direct metallicity estimates (e.g. Peimbert, 1967; Osterbrock, 1989). This method requires metal auroral lines such as [O iii]4363, which although still faint ( times fainter than H), are ten times brighter than metal recombination lines and are thus detectable in a wider range of systems in the nearby Universe, or in gravitationally lensed galaxies out to (e.g. Villar-Martín et al., 2004; Christensen et al., 2012; Sanders et al., 2016). Oxygen auroral lines have now also been detected out to for a few galaxies with the James Webb Space Telescope (JWST, e.g. Curti et al., 2022; Trump et al., 2022; Schaerer et al., 2022; Arellano-Córdova et al., 2022; Heintz et al., 2023; Nakajima et al., 2023; Rhoads et al., 2023), but these remain the exception.
In the absence of metal recombination or auroral lines, indirect metallicity estimates obtained via strong emission line ratios must be used (e.g. Kewley & Dopita, 2002; Pettini & Pagel, 2004; Maiolino et al., 2008; Pilyugin & Grebel, 2016). Calibrations for such diagnostics are now becoming possible at high redshift (e.g. Laseter et al., 2023; Hirschmann et al., 2023; Sanders et al., 2023). However, strong-line metallicity estimates are known to vary by up to dex depending on the line ratios chosen and the calibration sample used (Kewley & Ellison, 2008; Teimoorinia et al., 2021). Therefore, careful selection of the most appropriate diagnostic for the sample at hand is required. However, all such emission line methods are luminosity-weighted tracers of the star forming regions of galaxies, which at contain just 20% of the baryon fraction (Fukugita & Peebles, 2004; Behroozi et al., 2010; McGaugh et al., 2010; Peeples et al., 2014), with the bulk of the metal budget residing in cold gas within the galaxy disc, or circumgalactic medium (CGM) (Péroux & Howk, 2020).
A very different but complementary method of studying the cosmic build up of heavy elements is with absorption line studies, using the luminous light offered by background quasi-stellar objects (QSOs) and long gamma ray bursts (GRBs). Prominent absorption lines imprinted on their spectra provide a highly sensitive tool to study the neutral gas-phase ISM of distant galaxies irrespective of galaxy luminosity. Absorption from neutral hydrogen reveals copious quantities of neutral gas in these systems, in the large majority of cases classifying them as damped Lyman- (Ly ) absorbers (DLAs, defined as having ; see Tanvir et al. (2019)), where ionisation corrections are negligible. Combining the neutral hydrogen abundance with the measured abundances of metals from unsaturated, singly-ionised absorption lines from non-refractory elements provides an accurate and largely model-independent measure of the neutral gas metallicity (Savaglio et al., 2003; Savaglio, 2006; Wolfe et al., 2005; Fynbo et al., 2011; Rafelski et al., 2012; Prochaska et al., 2003a, b). Such data have enabled abundances to be measured out to (Kawai et al., 2006; Thöne et al., 2013; Hartoog et al., 2015; Saccardi et al., 2023) and a few dex below what can be probed with emission lines (Péroux & Howk, 2020; Wiseman et al., 2017; Bolmer et al., 2019; De Cia et al., 2013). The combination of absorption and emission line probes can therefore provide a more complete understanding of the chemical enrichment of galaxies, but this first requires a better understanding of the relation between the metallicities measured with these two techniques.
Extensive efforts have been made to identify the emission counterparts to QSO-DLAs, but the often large, projected offsets of tens of kpc between the QSO line of sight and the centre of the galaxy associated with the absorber (or ‘impact parameter’) (e.g Chen et al., 2005a; Rao et al., 2006; Krogager et al., 2012; Rahmani et al., 2016) make it challenging to identify the intervening system in emission (e.g. Fumagalli et al., 2015). Detecting emission counterparts at smaller impact parameters is also complex due to the bright light from the background QSO flooding any emission from a foreground galaxy. Thus despite there now being on the order of a few hundred QSO-DLAs with measured absorption metallicities (Berg et al., 2015; De Cia et al., 2016, 2018), of these, the emission line metallicity (or limits) has only been reported for 20–30 QSO-DLA emission counterparts (Christensen et al., 2014; Rahmani et al., 2016; Weng et al., 2023), most of which are at . The measured emission line metallicities are generally larger than the absorption-based metallicities, although it remains unclear whether this offset is a result of a difference in the phase or in the location of the gas probed. The QSO-DLA towards SBS 1544+5912 has an impact parameter of just 1 kpc (Rahmani et al., 2016), and in this case the emission and absorption line metallicities were consistent within the uncertainties (Schulte-Ladbeck et al., 2004; Schulte-Ladbeck et al., 2005). We note, however, that this QSO-DLA is exceptional, and most other QSO-DLAs with known absorption and emission line metallicites have impact parameters kpc. In order to remove some of the ambiguity, it is therefore important to increase the sample of sightlines that probe neutral material in the more central regions of the absorbing galaxy, which is co-spatial with the galaxy star-forming regions that are observed in emission.
| GRB | E(B-V)Gal | Grating/filter | On-source | Obs. date |
| combination | exposure (s) | (DD-MM-YY) | ||
| 030323 | 0.042 | G140M/F100LP | 4204 | 13-06-23 |
| G235M/F170LP | 1225 | |||
| 050505 | 0.019 | G235M/F170LP | 2101 | 02-11-23 – 23-12-23† |
| G395M/F290LP | 642 | |||
| 050820A⋆ | 0.039 | G140M/F100LP | 5310 | 28-11-22 |
| G235M/F170LP | 905 | |||
| 080804 | 0.014 | G140M/F100LP | 934 | 28-10-22 |
| G235M/F170LP | 525 | |||
| 090323 | 0.021 | G235M/F170LP | 934 | 19-06-23 |
| 100219A | 0.066 | G235M/F170LP | 5952 | 28-11-23 – 20-01-24† |
| G395M/F290LP | 934 | |||
| 120327A | 0.293 | G140M/F100LP | 934 | 07-03-23 |
| G235M/F170LP | 525 | |||
| 120815A | 0.099 | G140M/F100LP | 5952 | 24-08-23 |
| G235M/F170LP | 1517 | |||
| 141109A | 0.032 | G140M/F100LP | 934 | 14-11-23 – 04-01-24† |
| G235M/F170LP | 525 | |||
| 150403A⋆ | 0.047 | G140M/F100LP | 934 | 19-06-23 |
| G235M/F170LP | 642 |
⋆ Observed with the IFS
† Window given for target due to be observed
Long GRBs offer such a probe due to their association to the death of a massive star111The detection of a kilonova associated with the long GRB 211211A and GRB 230307A has shown that not all long GRBs are formed from the core collapse of a massive star (e.g. Troja et al., 2022; Rastinejad et al., 2022; Gompertz et al., 2023; Levan et al., 2023). Nevertheless, the majority of long GRB at that are followed up show supernova (SN) features in their light curves and/or spectra (e.g. Curti et al., 2017). (Galama et al., 1998; Hjorth et al., 2003; Woosley & Bloom, 2006), offering a sightline that, unlike typical QSO-DLAs, pierce through the same star forming regions that dominate emission-line spectra (e.g. Fruchter et al., 2006; Wiersema et al., 2007; Krühler et al., 2017). On average, these sightlines will cross through numerous absorbing clouds within the host galaxy disc, as seen in high resolution afterglow data (e.g. Chen et al., 2005b; D’Elia et al., 2007; Prochaska et al., 2007a; Piranomonte et al., 2008; D’Elia et al., 2009; D’Elia et al., 2011), and as also indicated by the order of magnitude larger H i column density measured on average in GRB spectra compared to QSO-DLAs (Schady, 2017). Furthermore, the closest absorbing clouds have been found to typically lie at a distance of just a few hundred parsec from the GRB (Vreeswijk et al., 2007, 2013; D’Elia et al., 2014) (although see Saccardi et al., 2023), which is far smaller than typical QSO-DLA impact parameters. Any difference between emission and absorption line metallicities in the case of GRB host galaxies would therefore reflect differences in the chemical enrichment of the multi-phase ISM, rather than differences in the metallicity of material far from the galaxy centre.
Prior to the launch of JWST, only the host galaxy of GRB 121024A at (Friis et al., 2015) had a well-measured absorption line metallicity together with sufficient emission line detections to be able to obtain an emission line metallicity. This is due to the need for restframe optical galaxy spectroscopy to capture the emission lines required for the metallicity diagnostic (e.g. ) (Krühler et al., 2015; Palmerio et al., 2019; Graham et al., 2023) as well as time-sensitive rest-frame UV GRB afterglow spectra for deriving the absorption metallicity. Ly absorption can only be detected from the ground for GRBs at , but at such redshifts it becomes challenging to detect the weaker emission lines from the same, generally low-mass host galaxies. In the case of GRB 121024A, the emission line metallicity was larger than the absorption metallicity by 0.2–0.7 dex (Friis et al., 2015; Krühler et al., 2015), depending on the emission-line metallicity diagnostic used. Deriving emission metallicities at higher redshifts () from direct observations of the host galaxies requires near-infrared spectroscopy.
It is only now, with the sensitivity and near-infrared coverage of JWST, that it is possible to obtain sensitive emission-line data at wavelengths out to H for a sample of GRB hosts with well-constrained absorption line metallicities. In this paper, we report results from a cycle-1 JWST NIRSpec program (PI: P. Schady, ID 2344) to measure emission line metallicities for a subset of 10 GRB host galaxies at that have accurately measured ( dex) absorption line metallicities. In section 2 we describe our sample and provide details on our NIRSpec observations, followed by our data analysis in section 3. We present our results in section 4, and in section 5 we discuss the implications of our analysis on the relation between emission and absorption metallicity probes. All uncertainties are given as unless otherwise stated and we assume a standard Lambda cold dark matter () cosmological model with , , and H km s-1 Mpc-1 (Planck Collaboration et al., 2016).
2 JWST GRB host galaxy sample
There are around 30 GRBs with an afterglow absorption line metallicity measured with a statistical uncertainty of better than 0.25 dex (Wiseman et al., 2017; Bolmer et al., 2019; Heintz et al., 2023). From this parent sample we selected those host galaxies with measured UV/optical star-formation rates (SFRs) from UV continuum or emission line fluxes, but without the necessary spectra to measure an emission line metallicity. This left us with a sample of 15 GRB host galaxies. We then further down-selected the sample to only include those GRB host galaxies with an estimated H flux brighter than erg cm-2 s-1 based on the SFR, leaving us with a final sample of 10 long GRB host galaxies. This flux limit was set by our requirement to measure strong emission lines at wavelengths spanning from [O ii]3726,3729 to H with S/N in less than 4 hours (including overheads) according to the JWST exposure time calculator, above which the data volume exceeds the middle threshold set by JWST when using the nrsirs2rapid readout pattern222jwst-docs.stsci.edu/jwst-general-support. Our need for an accurate absorption line metallicity biases our sample against more metal-rich and thus dusty host galaxies that attenuate most of the afterglow, thus reducing the spectrum signal-to-noise (SNR) ratio. In addition, the requirement that our host galaxies were previously detected in emission, either in imaging or spectra, introduces a preference for the brightest, and thus most star-forming galaxies of those with accurate absorption metallicities.
Our GRB host galaxy sample and the details of the JWST/NIRSpec observations are given in Table 1. The need for Ly absorption in the optical afterglow spectrum imposes a hard lower bound on the redshift of for the sample (see section 3.4), which is too distant for any emission from an underlying SN to be detected and thus affect the absorption line analysis. The redshift range spanned by our final sample is –4.7 (Table LABEL:tab:linefluxes), and the absorption line metallicities range from to (Table LABEL:tab:hostprops), corresponding to 0.04 Z⊙ to 2.5 Z⊙.
3 Observations and data analysis
The host galaxies of GRB 050820A and GRB 150403A showed evidence of spatially extended emission in the available imaging data, and NIRSpec observations were therefore performed using the integral field spectrograph (IFS), which has a field of view. For the same observed object, longer exposures are required in IFS mode than with the fixed slit to reach the same integrated line flux sensitivity. In both cases the G140M/F100LP and G235M/F170LP grating and filter combinations were used, corresponding to a spectral resolution of . In the case of GRB 050820A, previous Hubble Space Telescope (HST) imaging data showed the host galaxy consists of at least two components separated by (Chen, 2012), and the galaxy complex was therefore sufficiently compact to be able to perform a two-point nod to cover both components and additionally sample the sky background. For GRB 150403A, pre-imaging data were available with the GRB Optical and Near-infrared Detector (GROND; Greiner et al., 2008) mounted on the 2.2 m Max Planck Institute telescope in La Silla, Chile. From these data the host galaxy appeared extended over ″, and thus a four-point dither was used instead of nodding to avoid any of the galaxy falling out of the ″ NIRSpec field of view during a nod. The reduced and flux calibrated IFS data were downloaded from the Mikulski Archive for Space Telescopes (MAST) Data Discovery Portal333mast.stsci.edu/portal/Mashup/Clients/Mast/Portal.html. The QFitsView444www.mpe.mpg.de/ott/QFitsView software package was used to visualise the cubes and to extract stacked spectra from the regions of interest.
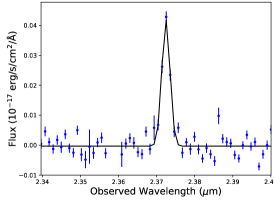
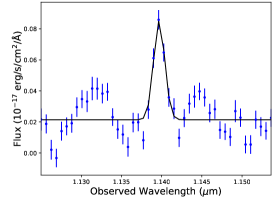
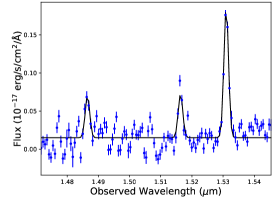
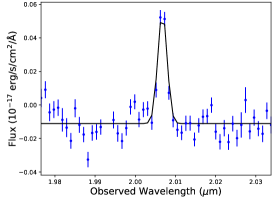
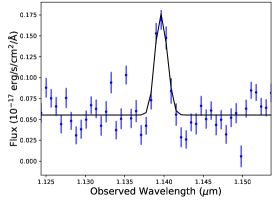
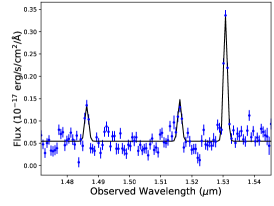
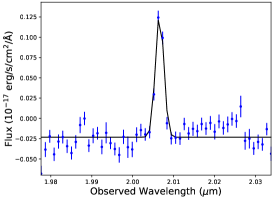
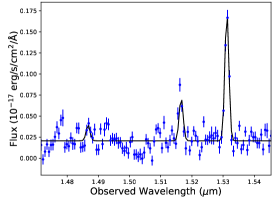
For the remaining eight GRB host galaxies in our sample observed with the NIRSpec S400A fixed slit, a two-point nod pattern was used. The reduced and combined 2D spectra were similarly downloaded from MAST. The galaxies appear compact in the 2D spectra but in some cases they are resolved. The 1D spectra were then extracted manually using the JWST Extract1DStep python function (v1.8.3), applying an extraction region centred on the detectable line emission and with a width 07–09. The physical line width is well-resolved with NIRSpec (resolution ranges from 200 km/s to 800 km/s in the G140M grating, and from 200 to 500 km/s in the G235M grating) and the emission lines in the 1D spectra are generally well fit by a single Gaussian component. The exception is in the [N ii]6549,6584 and H emission lines from the host galaxy of GRB 090323, where there is evidence of additional emission that likely originates from unresolved additional components in velocity space (section 3.3). The current version of Extract1DStep fails to provide a flux uncertainty, which is due to the relevant flat field reference files not having an associated variance array. New flat fields are required to resolve this problem, and for now the recommendation provided on the JWST webpages555jwst-docs.stsci.edu/jwst-calibration-pipeline-caveats is to calculate the flux error by summing in quadrature the contribution from the Poisson noise and read-out noise alone, which are available in the extracted 1D spectral file. We now describe the JWST observations and data analysis process for each of the GRB host galaxies in our sample, beginning with the two targets with IFS observations.
3.1 IFS observations
3.1.1 GRB 050820A
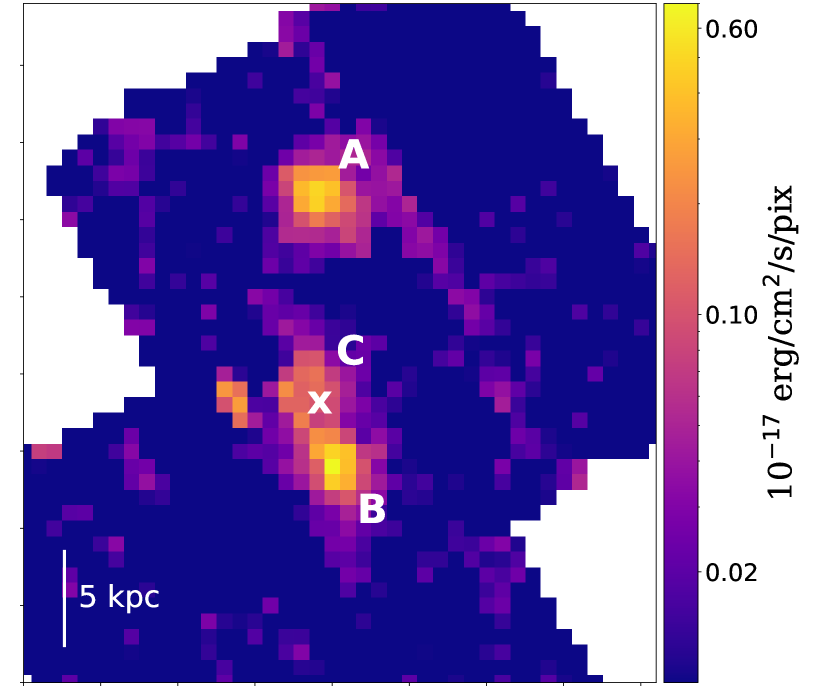
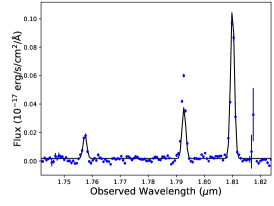
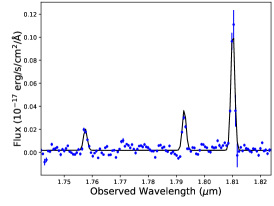
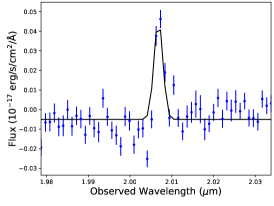
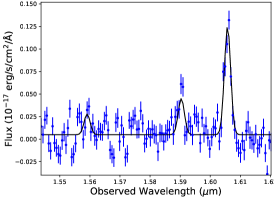
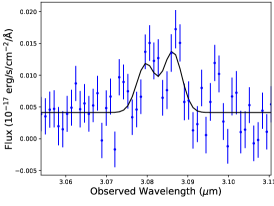
Level 3 data show clear emission from H , H , [O ii]3726,3729 and [O iii]4959,5007 at an observer wavelength consistent with the GRB afterglow absorption redshift (; Ledoux et al., 2005; Prochaska et al., 2007b; Fox et al., 2008) (see Fig. 7). An image of the G140M/F100LP NIRSpec data cube centered at the redshifted [O iii]5007 line is shown in Fig. 1, where a complex galaxy morphology made up of numerous emission components can be seen. Spectroscopic observations of this host galaxy were previously taken using the Folded port InfraRed Echellette (FIRE) spectrograph on the Magellan Baade Telescope, covering the wavelength range 0.8–2.5m with a spectral resolution of km/s (Chen, 2012). In line with the naming convention used in Chen (2012), we refer to the upper, northern component as component A, and the lower, southern component as component B, which are separated by a projected distance of kpc, consistent with the HST observations (Chen, 2012). The GRB projected position was located between components A and B, and is indicated by an ‘X’ in Fig. 1, which lies on a third emission component seen in Fig. 1, which we have labelled C. The absolute astrometry of the JWST image is limited by the JWST pointing accuracy, which is 01, corresponding to a single NIRSpec pixel. Component C is not the brightest region of its host galaxy (see Table LABEL:tab:linefluxes). It is nevertheless one of the brightest regions, consistent with the location within their host galaxies of long GRBs at (Fruchter et al., 2006).
Emission can also be seen to the east of the GRB position, but no corresponding [O iii]4959 or H emission is detected from this region, which leaves the origin of this emission component and its association with the GRB host galaxy unclear. An intervening absorption system was detected imprinted on the GRB afterglow at (Ledoux et al., 2005; Vergani et al., 2009), but no emission lines at the redshift of this intervening system are detected in the NIRSpec data cube.
Spectra of the stacked pixels within each of the A, B and C components were extracted within QFitsView, as well as a spectrum of all emission host galaxy regions combined (see Table LABEL:tab:linefluxes). Component A is the brightest of the three identified host galaxy regions, and components B and C have effectively the same measured line fluxes and velocity dispersion ( km/s after correcting for the intrinsic instrument resolution). Component B has an unidentified emission line at observer wavelength 1.8100 m (given for vacuum), and the bottom half of this component also has excess emission at the location of the [O iii]4959 emission line, causing the [O iii]4959,5007 line doublet ratio to be smaller than 3. The origin of this excess line emission is unclear, and when extracting an emission spectrum for component B, we therefore masked the bottom half of the region, where contamination at 1.7923 m (corresponding to observer frame [O iii]4959 emission at the redshift of the host galaxy) and 1.8100 m were strongest.
Gaussian fits to the H , H and [O iii]4959,5007 doublet give a best-fit redshift of for component A, for component B, and for component C, corresponding to a maximum velocity separation of km/s between the components. If the single emission line feature east of component C is assumed to correspond to [O iii]5007, the best-fit model implies a velocity separation of km/s blueward of components B and C. Although the measured redshifts for components A and B differ from the values reported in Chen (2012) by , the implied radial velocity offset between the two components is consistent. The offset in redshift could by a result of the undersampled line spread function, which can affect the position of the line-peak in narrow emission lines (e.g. Christensen et al., 2023).
3.1.2 GRB 150403A
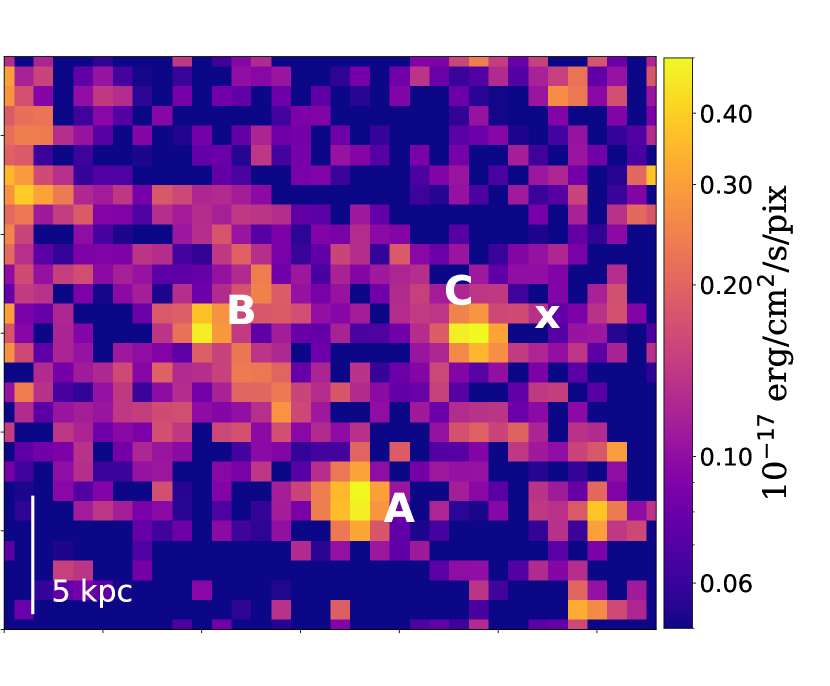
An image taken of the field of GRB 150403A almost six months after the GRB with the GRB Optical/Near-infrared Detector on the MPG 2.2 m telescope in La Silla, Chile (Greiner et al., 2008) showed extended emission at the position of the GRB. This is confirmed with the NIRSpec IFS observations, where line emission from H , H , [O ii]3726,3729 and [O iii]4959,5007 is clearly detected in three regions of the data cube at a redshift consistent with the GRB afterglow (; Pugliese et al., 2015) (see Fig. 8). We have labelled the three brightest emission components A, B and C on an image taken from the NIRSpec G140M/L100LP data, centred on the observer frame [O iii]5007 emission line (Fig. 2). The GRB afterglow position is labelled with an ‘X’ and appears to lie just to the west of component C, and not evidently on a star forming region. However, the astrometry of these data is limited by the combined pointing accuracy of JWST (within 1 pixel) and the accuracy of the acquisition target position. Accurate astrometry was possible in the case of the host galaxy of GRB 050820A because the A and B components were detected in previous HST imaging data, allowing the GRB position to be located accurately. However, for the host galaxy of GRB 150403A, there is no imaging data available that resolves the components shown in Fig. 2, and the astrometry will therefore include the uncertainty in the position of the acquisition target.
Component B has the brightest emission lines, followed by components A and then C. The largest velocity separation is between components B and C, which are offset by km/s, whereas component A lies somewhere between the other two components.
3.2 Fixed slit observations
The remaining eight GRB host galaxies in the sample, for which we had no evidence of extended emission, were all observed with the NIRSpec S400A fixed slit (04 slit width). In most cases this required observations in two grating/filter combinations with the exception of GRB 090323A, which at (Chornock et al., 2009; Savaglio et al., 2012), had all relevant nebular emission lines redshifted into the wavelength range of the F170LP filter.
In three of the five GRB host galaxy candidates that have been observed with the fixed slit666Three remaining targets are due to be observed between November 2023 and January 2024, hydrogen Balmer and oxygen nebular emission lines were detected at observer wavelengths consistent with the corresponding GRB afterglow absorption redshift. In the case of the host galaxy of GRB 090323, emission from [N ii]6549,6584 and [S ii]6717,6731 was also detected as well as the galaxy continuum, consistent with the high absorption-based metallicity (). However, in the case of two targets (GRB 120327A and GRB 120815A), the candidate host galaxies we observed were unfortunately found to be relatively dim foreground stars that were not present in Gaia or other publicly available catalogues.
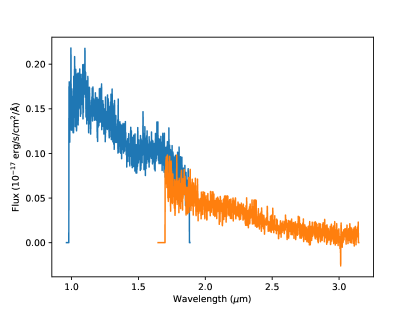
The host galaxy candidate of GRB120327A was identified by D’Elia et al. (2014) at the position of the GRB afterglow with AB magnitude . However, the NIRSpec spectrum of this source does not reveal any emission lines at the expected observer frame wavelength, and instead resembles a black body with a temperature K, suggesting that the source is in fact a foreground star (see Fig. 13, top panel).
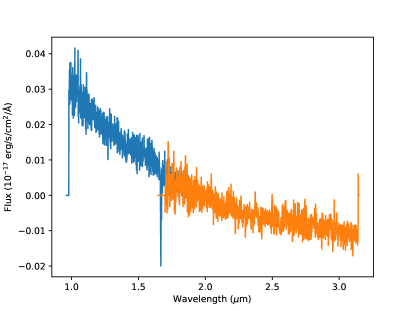
In a late time observation of the field of GRB 120815A taken with the High Acuity Wide field K-band Imager (HAWK-I) a source is detected 11 north-west of the GRB afterglow position, and this was considered to be the host galaxy. However, the NIRSpec data show the detection of two sources spatially offset by 12, neither of which correspond to a galaxy at the redshift of GRB 120815A, at . The spectrum of the trace at the centre of the 2D spectrum resembles the Rayleigh-Jeans tail of a black body spectrum, implying that the targeted source is in fact a foreground star (see Fig. 13, bottom panel). Precise astrometry was performed on the available imaging data of the GRB fields, and the lack of host galaxy detections in the case of GRB 120327A and GRB 120815A was therefore the result of the incorrect target being identified as the host galaxy in our imaging data, rather than due to an error in the positioning of the NIRSpec fixed slit.
The second trace detected in the 2D spectra taken for GRB 120815A shows a bright continuum with strong Balmer and metal emission lines at observer wavelengths consistent with a galaxy at . This galaxy is therefore likely the emission counterpart to a strong intervening absorption line system that was detected in the GRB afterglow spectrum at the same redshift (Krühler et al., 2013). At the [O ii]3726,3729 line doublet lies blueward of the NIRSpec F100LP spectral range. However, H , H and [O iii]4959,5007, as well as [N ii]6549,6584 and [S ii]6717,6731 are detected and the line fluxes were measured as described in section 3.3, and are given in Table LABEL:tab:grb120815A-intervener. Although [O ii]3726,3729 is undetected, we can use the Dopita et al. (2016) N2S2H diagnostic to compute a metallicity, which gives (see section 4.1).
Emission lines from the host galaxy of GRB 120815A were previously detected with X-shooter (Krühler et al., 2015), and the lack of detection in our NIRSpec data is therefore due to a mistake in the target that we selected to observe rather than a lack of sensitivity. The H and H emission lines in the X-shooter data (Krühler et al., 2015) were detected at only , and [O ii]3726,3729 was undetected. Nevertheless, the reported line fluxes are sufficient to be able to measure an emission line metallicity, albeit with large uncertainties (see Table LABEL:tab:hostprops).
3.3 Emission line flux measurements
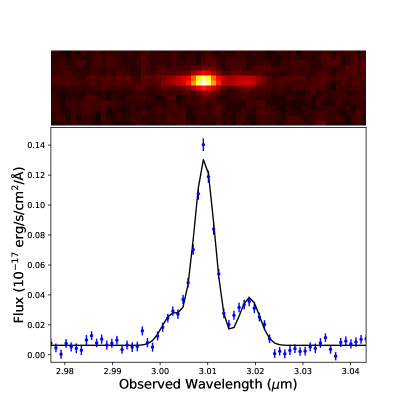
Host galaxy emission lines in the 1D spectra were fit with Gaussian functions, with the velocity width of all lines in a given galaxy tied (corrected for the instrument resolution), and the position of the lines kept at a constant redshift. In the case of [O iii]4959,5007 the line doublet was fixed to have a one-to-three line flux ratio (Osterbrock, 1989). The model was generally a good fit to the data with the exception of the fits to the [N ii]6549,6584 and H lines from the host galaxy of GRB 090323 (see Fig. 11). The best fit Gaussian slightly under predicts the H amplitude, and the fit to [N ii]6584 is too narrow. Furthermore, the best-fit [N ii]6549,6584 doublet line ratio is [N ii]6584/[N ii]6549=1.6, which is far smaller than the expected line ratio of 3 (Storey & Zeippen, 2000). Forcing the line ratio to be 3 results in the fit to [N ii]6549 significantly underestimating the observed emission of this line. The afterglow of GRB 090323 had strong absorption from two systems separated by just km/s, which are proposed to be the signature of two interacting galaxies (Savaglio et al., 2012). It is therefore possible that our NIRSpec spectrum contains the combined emission from two galaxies, which may explain why our single Gaussian fits cannot fully describe the data, although no spatial offset is evident around the H and [N ii]6549,6584 lines in the 2D spectrum (Fig. 12). We therefore tried fitting the lines with a two-component model, but we found that the resolution of the data was not sufficient to be able to constrain the fit. In Table LABEL:tab:linefluxes we therefore report the line fluxes from our single component fits.
Measured line fluxes for all host galaxies were corrected for Milky Way dust extinction along the GRB line of sight using the Schlafly & Finkbeiner (2011) E(B-V) reddening maps and assuming a Cardelli et al. (1989) dust extinction curve with an average total-to-selective dust extinction value . The dust reddening from the GRB host galaxy was calculated from the H /H Balmer decrement assuming an intrinsic ratio H /H = 2.86 (Osterbrock, 1989), which is appropriate for star-forming regions with temperature K and electron densities –100 cm-3. We corrected the line fluxes for host galaxy dust extinction using the average extinction law from the Small Magellanic Clouds (SMC) Pei (1992), which has a total-to-selective extinction . We note that the majority of the host galaxies in the sample had large uncertainties on the host galaxy dust reddening such that only the host galaxy of GRB 090323 had a reddening measured at confidence (). In section 4.2 we investigate the effect of these uncertain dust reddening corrections on our results.
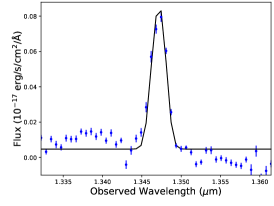
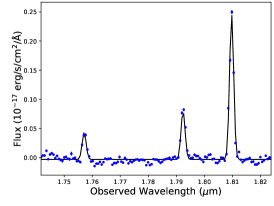
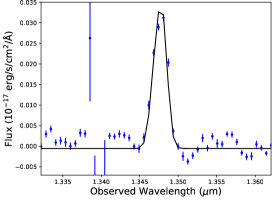
The Milky Way dust-corrected fluxes for all lines detected at a SNR are reported in Table LABEL:tab:linefluxes, and the fits to the lines are shown in the appendix (Figs. 7-11). In Table LABEL:tab:hostprops we give the measured host galaxy dust reddening and the SFR based on the Galactic and host galaxy dust-corrected H luminosity using the Kennicutt (1998) relation adopting a Chabrier (2003) IMF. The errors on the SFR include the uncertainty on the dust reddening correction. The line velocity widths and the absorption and emission line metallicities based on several diagnostics (described in section 4.1) are also given.
For the host galaxies of GRB 080804 and GRB 090323, lower signal to noise emission line flux measurements were already reported by Krühler et al. (2015) from X-shooter data, most of which are consistent at with our NIRSpec measurements. The lack of any H detection from the host galaxy of GRB 090323 in Krühler et al. (2015) is only marginally consistent () with the strong emission line that we measure in the NIRSpec spectra, in contrast to the very good agreement in the [O ii]3726,3729 line flux measurements for this host galaxy. It is therefore possible that the uncertainties in the X-shooter H measurement for the host of GRB 090323 are underestimated.
3.4 Absorption line metallicities
The GRB absorption line metallicities used in this paper were taken from the literature, and the metallicities and corresponding references are reported in Table LABEL:tab:hostprops. Three of the GRBs in the sample were observed with low resolution spectrographs (); either the Focal Reducer and low dispersion Spectrograph 2 (FORS2) mounted on the European Space Observatory (ESO) 8 m Very Large Telescope (VLT) (GRB 030323 and GRB 090323 Vreeswijk et al., 2004; Savaglio et al., 2012), or the Low Resolution Imaging Spectrometer (LRIS) mounted on the Keck I 10 m telescope (GRB 050505). Two GRBs were observed with high resolution echelle spectrographs (); GRB 080804 with the VLT/Ultraviolet and Visual Echelle Spectrograph (UVES) (Thöne et al., 2008; Fynbo et al., 2009), and GRB 050820A with UVES as well as the Keck/Higher Resolution Echelle Spectrometer (HiRES) (Prochaska et al., 2007a). The remaining GRBs in the sample were observed with VLT/X-Shooter () (Selsing et al., 2019).
† Absorption-based metallicity relative to solar and corrected for dust depletion. To convert to units of [M/H], more commonly used in GRB absorption line studies, need to subtract the solar metallicity value 12+log(O/H)=8.69 (Asplund et al., 2009).
References: a Vreeswijk et al. (2004); b Thöne et al. (2008); c Cucchiara et al. (2015); d Bolmer et al. (2019)
In these cases the measured line ratio in question is larger than the maximum value covered by the diagnostics (>0.96 or at ), and the resulting best-fit metallicity thus corresponds to the value at the turn over point between the lower and upper branch (see Fig. 5). The host galaxy of GRB 080804 and region C of the host galaxy of GRB 150403A also have a large value of , but with an uncertainty that lies within the range of values considered in the LMC23 metallicity diagnostic.
For seven GRBs in the sample the absorption line metallicities were determining following the method described in De Cia et al. (2013), where the abundances of numerous singly-ionised metals are fitted simultaneously with a dust depletion model in order to measure a consistent, dust depletion-corrected metallicity (Wiseman et al., 2017; Bolmer et al., 2019). For the remaining three GRBs, a single, non-refractory element was used to determine the absorption metallicity; either sulphur (GRB 030323 and GRB 050505), or zinc (GRB 080804) (Cucchiara et al., 2015). In these cases, dust depletion corrections were applied following the method of De Cia et al. (2018), where the [S/Fe] or [Zn/Fe] relative abundance can be used to determine the level of dust depletion. The Fe ii column density along the line of sight to GRB 080804 is only constrained to lie within the range (C. Ledoux private communication), which corresponds to a dust depletion correction between and . We therefore use the mid-range dust depletion corrected metallicity and propagate through the uncertainty of 0.13 dex on the dust depletion correction to our absorption metallicity accordingly. In the case of GRB 030323 and GRB 050505, where only low resolution spectra were available, the published absorption metallicities should be considered lower limits. We nevertheless give the published metallicities in Table LABEL:tab:hostprops, but will discuss the corresponding uncertainty on the absorption metallicity in section 4.2. Although the optical afterglow spectrum of GRB 090323 was also low resolution, we consider the measured metallicity more robust due to the numerous metal abundances (Zn, S, Si, Cr, Fe) that were used to measure the dust depletion and metallicity, which reduce the effect of saturation in any single line (Wiseman et al., 2017). The uncertainties on the absorption metallicity given in Table LABEL:tab:hostprops correspond to the statistical uncertainty on the metal and H i column densities, and do not include systematic uncertainties, such as from the dust depletion correction.
4 Results
4.1 Emission line metallicities
No emission was detected from the temperature-sensitive [O iii]4363 line in any of the GRB host galaxies in our sample. For the majority of the sample, the upper limit on the [O iii]4363/[O iii]4959,5007 line flux ratio is , corresponding to a limit on the temperature of K. More stringent constraints on the average electron temperature of our GRB host galaxy sample can be placed from a stacked spectrum, resulting in a upper limit on the [O iii]4363 line flux of , and an auroral-to-nebular line flux ratio of , corresponding to a limit on the temperature of K.
In the absence of the detection of temperature-sensitive lines, we therefore need to rely on strong emission line metallicity diagnostics. The majority of these diagnostics are calibrated to galaxies and H ii regions within the local Universe (Kewley & Dopita, 2002; Pettini & Pagel, 2004; Kobulnicky & Kewley, 2004; Maiolino et al., 2008; Andrews & Martini, 2013; Dopita et al., 2016; Pilyugin & Grebel, 2016; Curti et al., 2017), whereas high- galaxies have higher radiation fields and/or ionisation parameters (e.g. Kewley et al., 2013; Steidel et al., 2014), which affects the relation between observed line ratios and gas-phase metallicity. Attempts have been made to calibrate strong emission line diagnostics to the conditions present in distant galaxies, either by using local analogues to high- galaxies (e.g. Bian et al., 2018; Nakajima et al., 2022), or by using recent, small samples of high- galaxy spectra with metallicities measured from the temperature-sensitive [O iii]4363 line detected with JWST (e.g. Hirschmann et al., 2023; Sanders et al., 2023).
The emission line diagnostics that are available for our GRB host galaxy sample are generally limited to those that use hydrogen and oxygen lines, since we do not detect emission from [N ii]6549,6584 or the [S ii]6717,6731 doublet in the majority of our sample. The most common of such line ratios used to trace metallicity are ([O ii]3726,3729/H ), ([O iii]5007/H ) (also referred to as O3), O32 ([O iii]5007/[O ii]3726,3729) and (([O ii]3726,3729 + [O iii]4959,5007)/H ). Given that our galaxy sample is at , we only considered diagnostics that have been calibrated to the conditions present in the high- Universe, either using high redshift galaxy samples, or local analogues. We chose to use the Laseter et al. (2023) (LMC23 from hereon) so-called diagnostic, which is based on a combination of the and line ratios, and the metallicity diagnostics calibrated by Nakajima et al. (2022) (NOX22 from hereon) and Sanders et al. (2023) (SST23 from hereon). NOX22 and SST23 provide diagnostics based on each of the hydrogen and oxygen line ratios listed above, and NOX22 additionally includes the N2 and O3N2 diagnostics. The LMC23 and SST23 diagnostics are calibrated against samples of high- galaxies () with -based metallicities, whereas NOX22 used a combination of local SDSS galaxies and extremely metal-poor galaxies to extend the metallicity range down to far lower metallicities ( dex) than is covered in standard calibration samples (e.g. Curti et al., 2017), making their diagnostics more appropriate for high- galaxies.
The NOX22 calibration sample has a large scatter (up to an order of magnitude) in metallicity for a given or O32 line ratio at the low metallicity end (), which NOX22 find to be dependent on the H equivalent width, EW(H ), whereby galaxies with higher average EW(H ) have a lower but a higher O32 line ratio at a fixed metallicity. We only detect the galaxy continuum in the host galaxy of GRB 090323, and we therefore cannot measure EW(H ) for the majority of our sample. For this reason we do not consider the NOX22 and O32 diagnostics in our analysis. The and NOX22 diagnostics also show an EW(H ) dependence, but it is much weaker than for and O32 ( dex in metallicity at a fixed line ratio). We note that the calibration of the and diagnostics from Maiolino et al. (2008) and NOX22 are very similar (SST23; see their fig. 6), and Patrício et al. (2018) found that these line diagnostics from Maiolino et al. (2008) provided the best agreement (within 0.1 dex) to their measured -based metallicities for a sample of 16 galaxies at with detected oxygen auroral lines. To compute the NOX22 and , we initially use the high EW(H ) calibrations, which NOX22 argue are most appropriate for high- galaxies, but in cases where we measure , we use the EW-averaged calibrations, which are valid up to =8.9.
In the case of the host galaxy of GRB 090323, the [S ii]6717,6731 and [N ii]6549,6584 line doublets were detected and thus the Dopita et al. (2016) (DKS16 from hereon) N2S2H diagnostic could be used, which has the advantage that it is independent of dust reddening, relatively independent of the ionisation parameter, and the authors claim it can be used over the full abundance range encountered at high-. The N2S2H best fit metallicity is , corresponding to [M/H]=, which is within of the measured absorption line metallicity (; Wiseman et al., 2017). In Table LABEL:tab:hostprops we list the computed NOX22 and , the LMC23 , and the DKS16 N2S2H metallicities. In this table we also provide the afterglow absorption metallicities and redshifts, and the emission line redshift and velocity dispersion. The SST23 , , and O32 metallicities are given in Table LABEL:tab:sst23metals.
4.2 Nebular versus neutral gas-phase metallicity
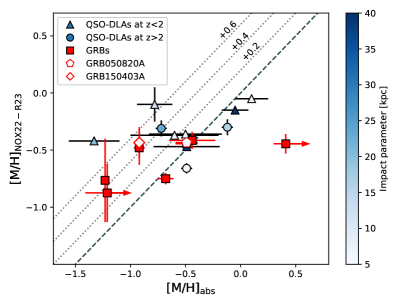
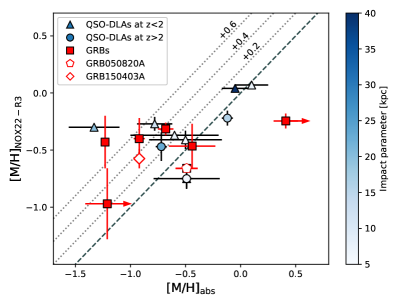
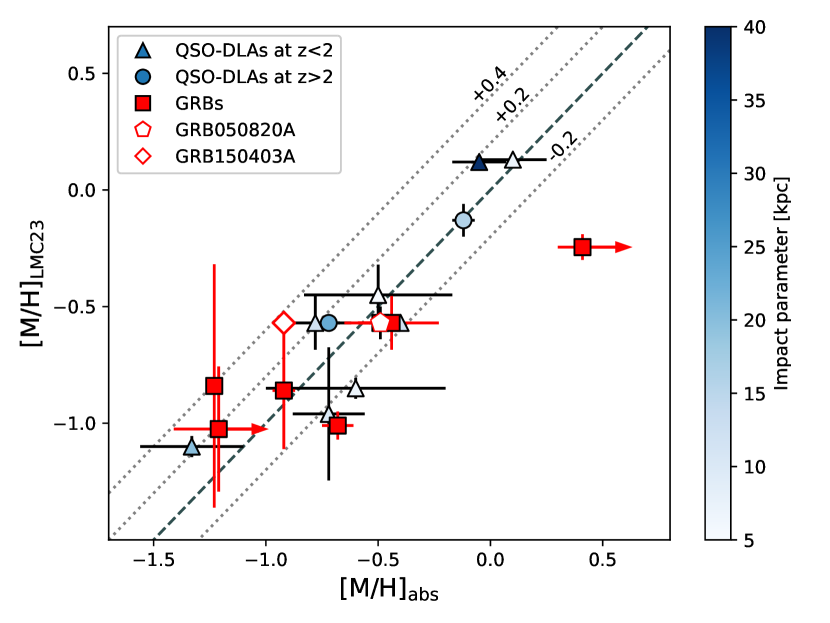
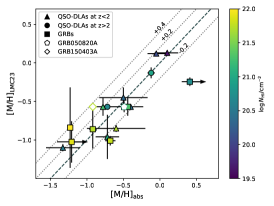
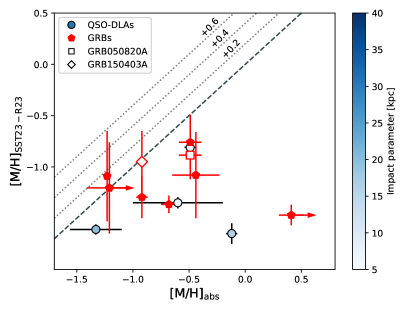
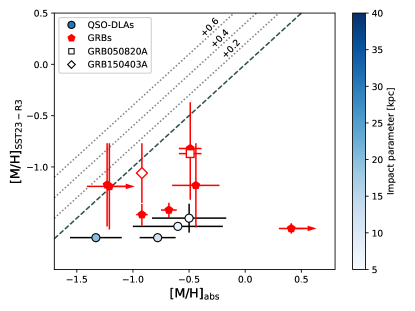
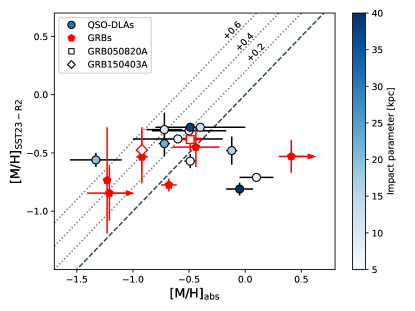
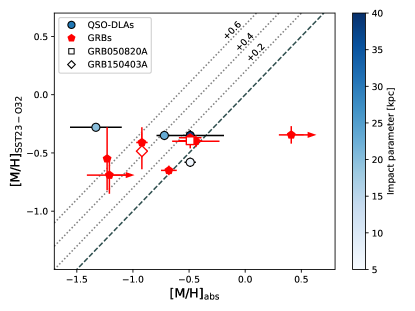
In Fig. 3 we plot the absorption line metallicity against the NOX22 (left) and NOX22 (right) emission line metallicities, and in Fig. 4 we show the absorption against the LMC23 emission metallicity. In both figures, the emission and absorption metallicities are in units of [M/H], assuming a solar metallicity value (Asplund et al., 2009).777, assuming that the relative abundance of oxygen is solar. for our GRB host galaxy sample (red) and for a compilation of QSO-DLAs (shades of blue) from Rahmani et al. (2016) with absorption and emission line metallicities of the intervening galaxy counterpart (see Table LABEL:tab:QSOsample for details on the QSO sample). The QSO-DLA data points are colour-coded by their impact parameter, ranging from kpc, although the association with the emission counterparts at large impact parameters is less secure. The offset from the galaxy centre of our sample of GRB sightlines is generally unknown, although, when measured, they are typically small (e.g. average offset of 1 kpc in sample of 68 GRB host galaxies observed with HST; Blanchard et al., 2016). All GRB data points in Fig. 3 and Fig. 4 are therefore plotted with the same red colour. The sample of plotted QSO-DLA data points is smaller than the sample considered in Rahmani et al. (2016) because we did not consider limits, and we have the additional requirement that H and either [O ii]3726,3729 or [O iii]4959,5007 need to be detected. For the two galaxies observed with the IFS (host galaxies of GRB 050820A and GRB 150403A) we plot the emission line metallicity of the resolved component closest in projection to the GRB afterglow position, which in both cases is component C in Figs. 1 and 2. In the case of GRB 050820A the line ratios of all components are larger than the maximum value covered by the , and diagnostics considered, and the emission line metallicity in all cases is thus the maximum possible metallicity given by the diagnostic. The resolved components considered in the host galaxy of GRB 150403A, on the other hand, do vary in metallicity by up to 0.3 dex. The absorption line metallicity is most consistent with the the emission line metallicity of component C in the case of the NOX22 and diagnostics, but it is most consistent with the metallicity of component B. A more detailed analysis on the resolved spectroscopic properties of these two GRB host galaxies will be presented in follow-up paper.
Aside from the sample of GRB host galaxies observed with NIRSpec, we also include the host galaxies of GRB 120815A and GRB 121024A, which have absorption and emission lines detected from ground-based observations (Krühler et al., 2013; Friis et al., 2015). For those diagnostics that are double branched, such as the NOX22 and , and the LMC23 diagnostic, we use the absorption line metallicity to select between the two solutions. In Fig. 14 we show the results for the four SST23 line ratio diagnostics.
The well-known discrepancy between emission line metallicities (e.g. Kewley & Ellison, 2008; Andrews & Martini, 2013) is evident in Fig. 3 and Fig. 4, with the NOX22 and LMC23 metallicity diagnostics giving notably different results. In the former case, the NOX22 metallicities are generally larger than the absorption metallicities by dex on average (Fig. 3), and this offset is most pronounced at [M/H], where there appears to be a relatively weak relation between the absorption and emission metallicity. The LMC23 metallicities, on the other hand, are more evenly distributed on both sides of the line of equality (Fig. 4), with the LMC23 metallicities generally lying within dex of the absorption metallicities. The standard deviation in the emission line metallicities relative to the line of equality (dashed black line) is 0.4–0.5 dex for the two NOX22 diagnostics, whereas it is 0.25 dex for the LMC23 diagnostic. An outlier to the general distribution of data points is the host galaxy of GRB 090323, where the absorption metallicity is a factor of four larger than the emission line metallicity, and the QSO-DLA J0958+0549, which has a NOX22 emission line metallicity that is an order of magnitude larger than the absorption metallicity. Given the large uncertainty on the host galaxy dust reddening corrections, we repeated the analysis in which we only applied a host galaxy dust correction if dust reddening was detected at more than significance. This only applies to the two most metal-rich absorbers in our sample; the host galaxy of GRB 090323 and the emission counterpart of QSO-DLA JJ0441-4313. We found that the results were only marginally affected, with the resulting distribution of data points having similar offsets and standard deviations as shown in Fig. 3 and 4.
Systematic uncertainties also exist in the absorption line metallicities, primarily from the possible saturation of metal absorption lines in low- and even mid-resolution spectra, and also in the dust depletion corrections. All QSO-DLA absorption line metallicities shown in Fig. 3 and 4 are measured from mid- or high-resolution spectra, and saturation should therefore be less of a problem (Wiseman et al., 2017). However, the absorption metallicities for two of the GRBs plotted are measured from low resolution data, and these metallicities should therefore be considered as conservative lower limits (Prochaska et al., 2006). We have accordingly plotting these data points with right-pointing arrows to indicate this uncertainty on the absorption metallicity, although, as described in section 3.4, we consider the absorption metallicity for GRB 090323 more robust due to the multiple metal lines used to constrain the dust depletion and metallicity.
Dust depletion corrections can be well constrained when multiple metals are used (e.g De Cia et al., 2013, 2016; Wiseman et al., 2017), although De Cia et al. (2018) also found that corrections based on just the [Zn/Fe] and [S/Fe] relative abundance can give very similar results. The systematic uncertainties introduced from the dust corrections to our GRB data points are therefore expected to be minor compared to the other uncertainties from saturation and differences in the emission line metallicity diagnostics.
We do not see any clear dependence in Fig. 3 and 4 on the emission and absorption metallicity offset of the QSO-DLA data points with impact parameter (i.e. colour of data point), as would be expected if QSO-DLAs with large impact parameters probe correspondingly less enriched material. The QSO-DLA with greatest difference between the emission and absorption line metallicity is QSO-DLA J0958+0549, which has an impact parameter of 20 kpc (Rahmani et al., 2016), whereas the QSO-DLA with the largest impact parameter of 50 kpc (J1436-0051) has an emission line metallicity that is within 0.2 dex of the absorption line metallicity in Fig. 3 and Fig. 4. This is consistent with the relatively shallow (but negative) metallicity gradient reported in the literature out to 20–40 kpc (e.g. Chen et al., 2005a; Péroux et al., 2013; Christensen et al., 2014; Rahmani et al., 2016; Rhodin et al., 2018).
The agreement between the absorption and the LMC23 emission line metallicities for the GRB and QSO-DLA sample is quite remarkable given that absorption and emission lines probe different phases of the gas, and the measured metallicities are averaged over different regions of the galaxy; either luminosity-weighted over the whole galaxy in emission, or density-weighted along a single sightline through the galaxy in absorption. The standard deviation of the full GRB and QSO-DLA sample is 0.25 dex, which is comparable (if not slightly better) to the scatter that has been observed between - based and strong line metallicities in recent high- galaxy samples observed with JWST (Laseter et al., 2023; Sanders et al., 2023). Although the NOX22 metallicities are systematically larger than the absorption metallicities, they do appear to show some relation with the absorption line metallicity. However, the uncertainties on what is the most appropriate emission line diagnostic to use clearly dominates over any statistical uncertainty, and limits the conclusions that can be reached on the relation between the metallicity of the neutral gas ISM probed in absorption and that of ionised star-forming regions probed in emission, or on the effect of single sightline versus galaxy-integrated measurements.
4.3 GRB host stellar masses and implied metallicities
Several GRB host galaxies in our sample have stellar masses reported in the literature, which we use to investigate where our GRB host galaxy sample lies on the mass-metallicity relation (MZR) compared to the broader sample of GRB host galaxies. The host galaxies with mass estimates or limits are GRB 030323 (; Laskar et al., 2011), GRB 050820A (; Chen et al., 2009), GRB 080804 (; Perley et al., 2016), GRB 090323 (; McBreen et al., 2010), and GRB 121024A (; Friis et al., 2015). Although the stellar masses are taken from a several different references, the majority are determined from fits to the galaxy spectral energy distribution (SED), which is less sensitive to assumptions made on the SFR history and dust attenuation prescriptions (e.g. Palmerio et al., 2019). The exception is in the case of the host galaxy of GRB 080804, where the stellar mass is based on a single mid-infrared data point, which can over-estimate by dex compared to stellar masses from SED fitting. This stellar mass can therefore be considered an upper limit.
To explore whether our sample of host galaxies lies on the MZR compared to other galaxy populations, we determine the expected host galaxy (emission line) metallicity given the galaxy stellar mass using the best-fit relations from Maiolino et al. (2008) for galaxies at and the relation from Mannucci et al. (2009) at . The emission line metallicity diagnostics used in these papers combined a number of line ratios, but the authors state that the results are dominated by the or diagnostic (Maiolino et al., 2008), which is thus comparable to our analysis. More recently Sanders et al. (2021) measured the MZR for a sample of galaxies at and from the MOSDEF survey (Kriek et al., 2015). However, in their analysis they used the Bian et al. (2018) metallicity diagnostics, which can differ significantly from the NOX22 calibrations that we used (e.g. see and O32 panels in Fig. 5), which will cause there to be a systematic difference in the derived metallicities.
For the four host galaxies in our sample with stellar mass estimates, the Maiolino et al. (2008) and Mannucci et al. (2009) MZRs predict metallicities that are on average dex larger than the and LMC23 metallicities computed in section 4.1, and dex larger than the measured metallicities. The largest discrepancy is in the MZR, and if we only consider those host galaxies at , the predicted and measured metallicities are consistent within 0.05 dex for the LMC23 metallicities, and within 0.1 dex for the NOX22 diagnostics. This is consistent with the good agreement observed between the sample of BAT6 host galaxies and the Maiolino et al. (2008) MZR found in Palmerio et al. (2019). GRB host galaxies have also been found to agree well with the fundamental metallicity relation (FMR) (Mannucci et al., 2011; Palmerio et al., 2019), which adds a SFR-dependency to the MZR (FMR; Mannucci et al., 2010). To check this with our sample of GRB hosts with estimates, we use our H -based SFRs to determine the metallicity predicted by the FMR, but we find that this increases the disagreement between the expected and measured emission line metallicities, with the FMR predicting metallicities that are on average dex larger than we measure using strong emission line diagnostics. The greatest discrepancy is with the host galaxy of GRB 090323, which is the highest redshift host galaxy in our sample (). However, without this host galaxy, the host galaxy emission line metallicities are still dex larger than expected from the FMR. A larger sample of host galaxies and a more consistent approach in measuring is required to investigate further where GRB host galaxies lie in high- MZR and FMR relations.
4.4 Emission line ratios
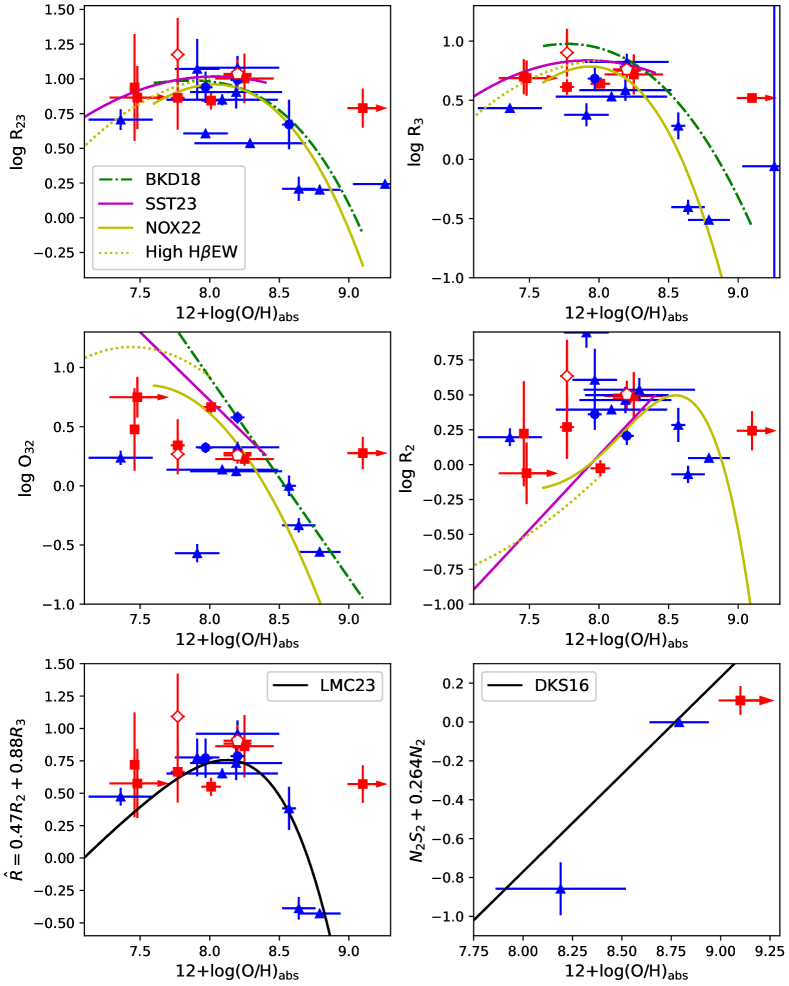
Given that absorption line metallicities are relatively model-independent compared to emission line metallicities, we investigate the relation between common emission line ratios and the GRB afterglow absorption metallicity. In Fig. 5 we plot the absorption line metallicities for our GRB host galaxy sample (red) using the scale against the logarithm of the , , O32 and line ratios in the top two panels. In the bottom two panels we show the LMC23 (left) and the DKS16 N2S2H line ratios against the absorption metallicities. The same sample of QSO-DLAs with emission counterparts plotted in Fig. 3 and 4 are also shown for comparison (blue), as well as best-fit metallicity diagnostics from a number of papers in the top two panels, indicated in the top left figure legend. We show the NOX22 metallicity diagnostics calibrated across the full metallicity range of their sample (yellow solid), as well as the relations for their sample of high H EW galaxies (yellow dotted), which are valid for . The Bian et al. (2018) (BKS; green dot-dashed) and SST23 (solid magenta) relations are generally shifted upwards relative to the NOX22 curves, and the greatest differences are in the O32 diagnostics, where the SST23 and Bian et al. (2018) relations do not turn over at low metallicities. Note that Bian et al. (2018) did not provide an diagnostic calibration.
The data are in general good agreement with the models for the and diagnostics, especially the GRB data points. However, greater offsets are present in the O32 and panels, where the curves predict metallicities that are typically larger than the absorption metallicity for a given O32 or line ratio. Much of the good agreement in the top two panels of Fig. 5 could in part be due to the GRB and QSO-DLA data points lying on the fairly flat portion of the and diagnostics, where the empirical relations between the line ratios and metallicity is fairly weak. As such, an increase in metallicity of 0.3–0.5 dex would shift the GRB data points closer to the O32 and diagnostics while still maintaining a relatively good agreement with the and diagnostics.
There is better agreement between the data points and the LMC23 best-fit relation (bottom left panel; black solid curve) than seen for the , , and O32 diagnostics, as expected given the general agreement between the absorption metallicity and LMC23 emission metallicity shown in Fig. 4. Although, as was the case for the and line ratios, the majority of the data points lie close to the LMC23 diagnostic turn over point. A greater sample of data points with low () and high () absorption line metallicities are therefore required to determine how closely the absorption metallicities and galaxy emission line ratios trace each other.
A clear outlier in the top two rows of panels and in the line ratio is the super-solar metallicity data point corresponding to the afterglow of GRB 090323. However, as seen in the bottom right panel, the combined N2S2H line ratio of this host galaxy is as expected if the absorption metallicity is representative of the nebular gas-phase metallicity. There are two QSO-DLAs with absorption line metallicities that also have detected [N ii]6549,6584 and [S ii]6717,6731 emission lines, which are shown in this figure, and their N2S2H line ratios are also as expected given their absorption line metallicities. This diagnostic has the additional advantage that it is not double branched, and obtaining a larger sample of GRBs and QSO-DLAs to occupy this plot would be of great interest.
5 Discussion
5.1 Emission line diagnostics
We find remarkable agreement between our sample of GRB and QSO-DLA absorption line metallicities and the LMC23 emission line metallicity, with a scatter that is comparable to that seen in high- calibration samples (Laseter et al., 2023; Sanders et al., 2023). This agreement has two important implications for the use of absorption and emission line probes to study the cosmic chemical enrichment. Firstly, it presents the possibility of combining absorption and emission line probes to study the cosmic chemical evolution out to higher redshifts and down to lower mass galaxies than is possible with emission line metallicities alone, even with JWST. Secondly, it suggests that the gas within star forming regions probed in emission, and the interstellar neutral gas probed in absorption have a very similar chemical composition, implying that the multi-phase ISM is well mixed within the galaxy disc. Furthermore, the similar scatter in the GRB and the QSO-DLA samples implies that the neutral gas is chemically homogeneous out to large distances from the galaxy centre, which would require enriched material within star forming regions to be efficiently distributed through outflows into the CGM in agreement with recent semi-analytic models of galaxy evolution (L-Galaxies 2020; Yates et al., 2021).
Although the scatter is larger in the NOX22 results, there is nevertheless an indication that the emission and absorption metallicities still trace each other. This is especially true when using the diagnostic. These results thus still offer the possibility of combining emission and absorption line probes to study the cosmic chemical evolution, as long as the relation between emission and absorption metallicities can be quantified with a larger sample.
The NOX22, SST23 and LMC23 diagnostics, however, all underpredict the metallicity of the host galaxy of GRB 090323, under the assumption that the absorption line metallicity for this GRB is representative of the average galaxy disc metallicity. In contrast, the DKS16 N2S2H diagnostic gives metallicities that are in very good agreement with the absorption metallicities for the three galaxies in our sample with [N ii]6549,6584 and [S ii]6717,6731 line detections (host galaxy of GRB 090323 and galaxy counterparts to the QSO-DLAS J0441-4313 and J1544+5912; see Fig. 5, bottom right panel). The N2S2H diagnostic has also been found to give good agreement with the metallicities of H ii regions predicted by the BPASS (Binary Population and Spectral Synthesis; Stanway et al., 2016; Eldridge et al., 2017; Xiao et al., 2018), and metallicity gradients predicted by the modified L-Galaxies 2000 galaxy evolution model (Yates et al., 2021). The N2S2H diagnostic has the further advantage that it is insensitive to dust extinction and all required lines can be detected with a single filter/grating combination (Dopita et al., 2016). Deeper observations are however necessary to detect the weaker [N ii]6549,6584 and [S ii]6717,6731 line doublets in all but the most metal right galaxies in our sample. It should be possible to further verify the robustness of the N2S2H diagnostic with future, more sensitive JWST observations.
5.2 Comparison with simulations
Several efforts have been made to quantify the relation between single sightline absorption metallicities and galaxy-integrated emission line metallicities using cosmological hydrodynamical simulations (Metha & Trenti, 2020; Metha et al., 2021; Metha & Trenti, 2023; Arabsalmani et al., 2023). These have generally found absorption line metallicities to be lower than emission line metallicities, although the difference is smaller for more metal-rich host galaxies and sightlines. When using the NOX22 and diagnostics we find qualitative agreement with these findings, with the emission metallicities being generally larger than the absorption metallicities, but with increased agreement for higher metallicity absorbers (see Fig. 3). Arabsalmani et al. (2023) used the Evolution and Assembly of GaLaxies and their Environments (EAGLE) simulations (Schaye et al., 2015) to investigate third parameter dependencies on the absorption-emission line metallicity relation. They compared the metallicity of the neutral gas and ionised gas withing star forming regions that intersected individual, simulated sightlines. They found that absorber sightlines with very small impact parameters or offsets from the galaxy centre, thus probing more material within the galaxy disc, had absorption metallicities that were in better agreement with the average metallicity of the galaxy star forming regions (probed by emission lines). To test this, in Fig. 3 and 4 we colour-coded the QSO-DLA data points by impact parameter, but we do not find any dependence on the difference in absorption and emission line metallicities with impact parameter. However, the impact parameters of our QSO-DLA sample are generally large (), whereas the good agreement between absorption and emission line metallicities predicted by the EAGLE simulations is generally for impact parameters where is the radius from the galaxy centre where the average density is 200 times the critical density at the respective redshift. Typical values of in EAGLE are 40–90 kpc, and thus corresponds to 2.0–4.5 kpc. Nevertheless, although we do not know the offset of the GRB position from the host galaxy centre for the majority of our sample, on average we would expect GRBs to probe the very central regions of their host galaxies. However, the GRB data points in Fig 3 and 4 do not appear closer to the line of equality (black dashed) than the distribution of QSO-DLA data points, as expected. There is of course the complication that more massive galaxies will have larger galaxy disks making comparisons between absolute offsets of impact parameters less meaningful. A fairer comparison may thus be to use the impact parameter normalised by the galaxy effective radius, although at the emission counterparts to QSO-DLAs appear to have comparable effective radii to GRB host galaxies (Rhodin et al., 2021; Blanchard et al., 2016).
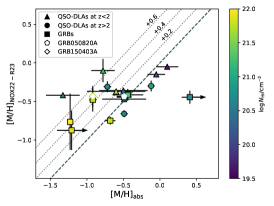
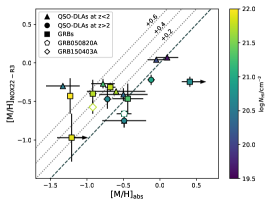
Another measure of how much galaxy material is probed by our GRB and QSO-DLA sightlines is the neutral hydrogen column density, NHI, which is available for all GRBs and QSO-DLAs in our sample by selection. Smaller impact parameters have been found to have larger HI column densities (Chen & Lanzetta, 2003; Chen et al., 2005a; Christensen et al., 2007; Péroux et al., 2016; Krogager et al., 2017; Arabsalmani et al., 2023), which can be understood by the fact that the sightline probes more central, and thus denser regions of the host galaxy. In Fig. 6 we plot the emission against absorption line metallicity for the NOX22 and LMC23 diagnostics, as in Figs. 3 and 4, but now with the data points colour-coded by the neutral hydrogen column density, NHI. There is possibly an indication that data points in the lower left of the plots in Fig. 6 have the largest column densities, and this goes down as we go to larger metallicities, at the top right corner of the plots. However, the relative offsets between the absorption and emission line metallicities do not show any clear dependence with NHI. The results from Arabsalmani et al. (2023) do imply some level of dependency on the relation between absorption and emission metallicities with NHI. However, there is scatter due to the intrinsic inhomogenities that exist in galaxies, and it is therefore possible that we do not see this dependence in our observations due to our small sample size. Nevertheless, by investigating the dependence of the relation between the emission and absorption metallicities with NHI, we can at least include the GRB host galaxy sample (unlike when considering impact parameter). Although the fact that we do not find a strong NHI-dependence is somewhat unsurprising given the anti-correlation between impact parameter and NHI(e.g. Krogager et al., 2020).
The lack of any clear, third-parameter dependency on the relation between absorption and NOX22 emission line metallicities along GRB and QSO-DLA sightlines may also imply that metals within the neutral phase ISM (and possibly also CGM) are poorly mixed, and the scatter observed in Figs. 3 and 6 could thus be indicative of the large intrinsic variation in the regions of the galaxy probed in absorption depending on the line of sight. Sightlines with the same impact parameter and NHI may probe very different regions of the galaxy depending on the galaxy orientation, the stellar mass, and the level of mixing, which in turn is dependent on feedback processes. However, the good agreement between absorption and emission line metallicities when using the diagnostic imply that the metallicity of the ionised and neutral material is relatively homogeneous. The lack of an NHI-dependency in this case would therefore imply that it is necessary to use zoom-in hydrodynamic simulations that include the relevant physics on the formation of molecular clouds and stellar feedback in order to capture the smaller scale inhomogeneities present in star forming regions and the ISM.
It will also be important to increase the samples of QSO-DLA and GRBs with both emission and absorption line metallicites in order to average out the intrinsic scatter that is likely introduced by the pencil-beam sightline offered by GRBs and QSO-DLAs. Knowing the characteristic properties of the GRB host galaxies and QSO-DLA emission counterpart is also important to be able to study the emission-absorption metallicity relation in bins of stellar mass, normalised impact parameter and NHI, for example.
Nevertheless, despite the current small sample size, the good agreement between the LMC23 metallicity (and for a smaller sample also the DKS16 N2S2H metallicity) and the absorption line metallicities implies that GRB and QSO-DLA sightlines trace the average metallicity of a galaxy as typically measured in emission. The implication of this is thus that any presence of metallicity gradients are averaged out along the radial and longitudinal direction in absorption and emission line probes.
6 Conclusions
In this paper we present our first results on the relation between the gas-phase metallicity in star forming regions and in the neutral cold interstellar gas as probed through emission and absorption using the incredible IR sensitivity of NIRSpec. We present the host galaxy spectra for a sample of GRB host galaxies observed with JWST as part of our cycle-1 programme and compare the derived emission line metallicities to the GRB afterglow absorption line metallicities. We find good agreement between the absorption metallicities and the emission metallicities determined with the LMC23 diagnostic ( dex), and the DKS16 N2S2H diagnostic also shows promise, but a larger sample of galaxies with [S ii]6717,6731 detections is required to verify the consistency with the N2S2H diagnostic. Although our results are dependent on the emission line metallicity diagnostic that we use, we find that, when considering only the most reliable emission diagnostics, there is a relation between the two metallicity probes (even if not one-to-one). This opens the possibility of combining both emission and absorption line probes in the future to study the cosmic chemical evolution down to lower mass galaxies than is currently possible through emission line studies alone. At high- GRBs are likely to have small and faint host galaxies that could be significant sources of ionising photons (Salvaterra et al., 2013), but for which spectra cannot be taken even with NIRSpec. The combination of emission and absorption line probes could therefore provide a less biased view of the chemical enrichment of galaxies at high-.
The first results on new strong-line metallicity diagnostics for high- galaxies based on sensitive JWST data have started to be published, but significant progress is still required in the size of the calibration samples currently available, but especially in the range of galaxy properties covered by the calibration samples. A more conclusive analysis on the relation between emission and absorption line metallicities may thus require GRB host galaxies with direct, -based emission line metallicities rather than relying on uncertain strong line diagnostics. In order to detect the temperature-sensitive, weak auroral lines in our sample of GRB host galaxies, of which [O iii] is the strongest, each galaxy would need to be observed for several hours, even with JWST. Nevertheless, the resulting observations would provide possibly the only definitive result on how absorption and emission line metallicities compare, paving a way for both probes to be used in unison, as well as enabling the relation between the ionised and neutral phase gas in the ISM of high- galaxies to be investigated.
Appendix A Intervening galaxy at along GRB 120815A sightline
Appendix B Gaussian fits to spectral lines


Appendix C Stellar spectra of misidentified targets
Appendix D Intervening galaxy at along GRB 120815A sightline
† Absorption-based metallicity relative to solar and corrected for dust depletion. To convert to units of [M/H], more commonly used in GRB absorption line studies, need to subtract the solar metallicity value 12+log(O/H)=8.69 (Asplund et al., 2009).
References: a Chen et al. (2005a); b Fynbo et al. (2013); c Rahmani et al. (2016); d Straka et al. (2016) ; e Schulte-Ladbeck et al. (2004);
f Fynbo et al. (2010); g Kewley et al. (2013); h Bouché et al. (2013)
Appendix E Absorption line versus SST23 emission line metallicities
Acknowledgements
We thank C. Ledoux for sharing the results from their absorption line analysis on the afterglow UVES spectrum of GRB 080804. This research was supported by the Science and Technology Facilities Council consolidated grant, reference ST/X001067/1.
References
- Andrews & Martini (2013) Andrews B. H., Martini P., 2013, ApJ, 765, 140
- Arabsalmani et al. (2023) Arabsalmani M., et al., 2023, ApJ, 952, 67
- Arellano-Córdova et al. (2022) Arellano-Córdova K. Z., et al., 2022, arXiv e-prints, p. arXiv:2208.02562
- Asplund et al. (2009) Asplund M., Grevesse N., Sauval A. J., Scott P., 2009, ARA&A, 47, 481
- Behroozi et al. (2010) Behroozi P. S., Conroy C., Wechsler R. H., 2010, ApJ, 717, 379
- Berg et al. (2015) Berg T. A. M., Ellison S. L., Prochaska J. X., Venn K. A., Dessauges-Zavadsky M., 2015, MNRAS, 452, 4326
- Bian et al. (2018) Bian F., Kewley L. J., Dopita M. A., 2018, ApJ, 859, 175
- Blanchard et al. (2016) Blanchard P. K., Berger E., Fong W.-f., 2016, ApJ, 817, 144
- Bolmer et al. (2019) Bolmer J., et al., 2019, A&A, 623, A43
- Bouché et al. (2013) Bouché N., Murphy M. T., Kacprzak G. G., Péroux C., Contini T., Martin C. L., Dessauges-Zavadsky M., 2013, Science, 341, 50
- Cardelli et al. (1989) Cardelli J. A., Clayton G. C., Mathis J. S., 1989, ApJ, 345, 245
- Chabrier (2003) Chabrier G., 2003, PASP, 115, 763
- Chen (2012) Chen H.-W., 2012, MNRAS, 419, 3039
- Chen & Lanzetta (2003) Chen H.-W., Lanzetta K. M., 2003, ApJ, 597, 706
- Chen et al. (2005a) Chen H.-W., Kennicutt Robert C. J., Rauch M., 2005a, ApJ, 620, 703
- Chen et al. (2005b) Chen H.-W., Prochaska J. X., Bloom J. S., Thompson I. B., 2005b, ApJ, 634, L25
- Chen et al. (2009) Chen H.-W., et al., 2009, ApJ, 691, 152
- Chornock et al. (2009) Chornock R., Perley D. A., Cenko S. B., Bloom J. S., 2009, GRB Coordinates Network, 9028, 1
- Christensen et al. (2007) Christensen L., Wisotzki L., Roth M. M., Sánchez S. F., Kelz A., Jahnke K., 2007, A&A, 468, 587
- Christensen et al. (2012) Christensen L., et al., 2012, MNRAS, 427, 1973
- Christensen et al. (2014) Christensen L., Møller P., Fynbo J. P. U., Zafar T., 2014, MNRAS, 445, 225
- Christensen et al. (2023) Christensen L., et al., 2023, arXiv e-prints, p. arXiv:2309.06470
- Cucchiara et al. (2015) Cucchiara A., Fumagalli M., Rafelski M., Kocevski D., Prochaska J. X., Cooke R. J., Becker G. D., 2015, ApJ, 804, 51
- Curti et al. (2017) Curti M., Cresci G., Mannucci F., Marconi A., Maiolino R., Esposito S., 2017, MNRAS, 465, 1384
- Curti et al. (2022) Curti M., et al., 2022, arXiv e-prints, p. arXiv:2207.12375
- D’Elia et al. (2007) D’Elia V., et al., 2007, A&A, 467, 629
- D’Elia et al. (2009) D’Elia V., et al., 2009, A&A, 503, 437
- D’Elia et al. (2011) D’Elia V., Campana S., Covino S., D’Avanzo P., Piranomonte S., Tagliaferri G., 2011, MNRAS, 418, 680
- D’Elia et al. (2014) D’Elia V., et al., 2014, A&A, 564, A38
- De Cia et al. (2013) De Cia A., Ledoux C., Savaglio S., Schady P., Vreeswijk P. M., 2013, A&A, 560, A88
- De Cia et al. (2016) De Cia A., Ledoux C., Mattsson L., Petitjean P., Srianand R., Gavignaud I., Jenkins E. B., 2016, A&A, 596, A97
- De Cia et al. (2018) De Cia A., Ledoux C., Petitjean P., Savaglio S., 2018, A&A, 611, A76
- Dopita et al. (2016) Dopita M. A., Kewley L. J., Sutherland R. S., Nicholls D. C., 2016, Ap&SS, 361, 61
- Eldridge et al. (2017) Eldridge J. J., Stanway E. R., Xiao L., McClelland L. A. S., Taylor G., Ng M., Greis S. M. L., Bray J. C., 2017, Publ. Astron. Soc. Australia, 34, e058
- Esteban et al. (2009) Esteban C., Bresolin F., Peimbert M., García-Rojas J., Peimbert A., Mesa-Delgado A., 2009, ApJ, 700, 654
- Esteban et al. (2014) Esteban C., García-Rojas J., Carigi L., Peimbert M., Bresolin F., López-Sánchez A. R., Mesa-Delgado A., 2014, MNRAS, 443, 624
- Fox et al. (2008) Fox A. J., Ledoux C., Vreeswijk P. M., Smette A., Jaunsen A. O., 2008, A&A, 491, 189
- Friis et al. (2015) Friis M., et al., 2015, MNRAS, 451, 167
- Fruchter et al. (2006) Fruchter A. S., et al., 2006, Nature, 441, 463
- Fukugita & Peebles (2004) Fukugita M., Peebles P. J. E., 2004, ApJ, 616, 643
- Fumagalli et al. (2015) Fumagalli M., O’Meara J. M., Prochaska J. X., Rafelski M., Kanekar N., 2015, MNRAS, 446, 3178
- Fynbo et al. (2009) Fynbo J. P. U., et al., 2009, ApJS, 185, 526
- Fynbo et al. (2010) Fynbo J. P. U., et al., 2010, MNRAS, 408, 2128
- Fynbo et al. (2011) Fynbo J. P. U., et al., 2011, MNRAS, 413, 2481
- Fynbo et al. (2013) Fynbo J. P. U., et al., 2013, MNRAS, 436, 361
- Galama et al. (1998) Galama T. J., et al., 1998, Nature, 395, 670
- Gompertz et al. (2023) Gompertz B. P., et al., 2023, Nature Astronomy, 7, 67
- Graham et al. (2023) Graham J. F., Schady P., Fruchter A. S., 2023, ApJ, 954, 13
- Greiner et al. (2008) Greiner J., et al., 2008, PASP, 120, 405
- Hartoog et al. (2015) Hartoog O. E., et al., 2015, A&A, 580, A139
- Heintz et al. (2023) Heintz K. E., et al., 2023, arXiv e-prints, p. arXiv:2308.14812
- Hirschmann et al. (2023) Hirschmann M., Charlot S., Somerville R. S., 2023, arXiv e-prints, p. arXiv:2305.03753
- Hjorth et al. (2003) Hjorth J., et al., 2003, Nature, 423, 847
- Kawai et al. (2006) Kawai N., et al., 2006, Nature, 440, 184
- Kennicutt (1998) Kennicutt Jr. R. C., 1998, ARA&A, 36, 189
- Kewley & Dopita (2002) Kewley L. J., Dopita M. A., 2002, ApJS, 142, 35
- Kewley & Ellison (2008) Kewley L. J., Ellison S. L., 2008, ApJ, 681, 1183
- Kewley et al. (2013) Kewley L. J., Dopita M. A., Leitherer C., Davé R., Yuan T., Allen M., Groves B., Sutherland R., 2013, ApJ, 774, 100
- Kobulnicky & Kewley (2004) Kobulnicky H. A., Kewley L. J., 2004, ApJ, 617, 240
- Kriek et al. (2015) Kriek M., et al., 2015, ApJS, 218, 15
- Krogager et al. (2012) Krogager J. K., Fynbo J. P. U., Møller P., Ledoux C., Noterdaeme P., Christensen L., Milvang-Jensen B., Sparre M., 2012, MNRAS, 424, L1
- Krogager et al. (2017) Krogager J. K., Møller P., Fynbo J. P. U., Noterdaeme P., 2017, MNRAS, 469, 2959
- Krogager et al. (2020) Krogager J.-K., Møller P., Christensen L. B., Noterdaeme P., Fynbo J. P. U., Freudling W., 2020, MNRAS, 495, 3014
- Krühler et al. (2013) Krühler T., et al., 2013, A&A, 557, A18
- Krühler et al. (2015) Krühler T., et al., 2015, A&A, 581, A125
- Krühler et al. (2017) Krühler T., Kuncarayakti H., Schady P., Anderson J. P., Galbany L., Gensior J., 2017, A&A, 602, A85
- Laseter et al. (2023) Laseter I. H., et al., 2023, arXiv e-prints, p. arXiv:2306.03120
- Laskar et al. (2011) Laskar T., Berger E., Chary R.-R., 2011, ApJ, 739, 1
- Ledoux et al. (2005) Ledoux C., et al., 2005, GRB Coordinates Network, 3860, 1
- Ledoux et al. (2009) Ledoux C., Vreeswijk P. M., Smette A., Fox A. J., Petitjean P., Ellison S. L., Fynbo J. P. U., Savaglio S., 2009, A&A, 506, 661
- Levan et al. (2023) Levan A., et al., 2023, arXiv e-prints, p. arXiv:2307.02098
- Maiolino et al. (2008) Maiolino R., et al., 2008, A&A, 488, 463
- Mannucci et al. (2009) Mannucci F., et al., 2009, MNRAS, 398, 1915
- Mannucci et al. (2010) Mannucci F., Cresci G., Maiolino R., Marconi A., Gnerucci A., 2010, MNRAS, 408, 2115
- Mannucci et al. (2011) Mannucci F., Salvaterra R., Campisi M. A., 2011, MNRAS, 414, 1263
- McBreen et al. (2010) McBreen S., et al., 2010, A&A, 516, A71
- McGaugh et al. (2010) McGaugh S. S., Schombert J. M., de Blok W. J. G., Zagursky M. J., 2010, ApJ, 708, L14
- Metha & Trenti (2020) Metha B., Trenti M., 2020, MNRAS, 495, 266
- Metha & Trenti (2023) Metha B., Trenti M., 2023, MNRAS, 520, 879
- Metha et al. (2021) Metha B., Cameron A. J., Trenti M., 2021, MNRAS, 504, 5992
- Nakajima et al. (2022) Nakajima K., et al., 2022, ApJS, 262, 3
- Nakajima et al. (2023) Nakajima K., Ouchi M., Isobe Y., Harikane Y., Zhang Y., Ono Y., Umeda H., Oguri M., 2023, arXiv e-prints, p. arXiv:2301.12825
- Osterbrock (1989) Osterbrock D. E., 1989, Annals of the New York Academy of Sciences, 571, 99
- Palmerio et al. (2019) Palmerio J. T., et al., 2019, A&A, 623, A26
- Patrício et al. (2018) Patrício V., Christensen L., Rhodin H., Cañameras R., Lara-López M. A., 2018, MNRAS, 481, 3520
- Peeples et al. (2014) Peeples M. S., Werk J. K., Tumlinson J., Oppenheimer B. D., Prochaska J. X., Katz N., Weinberg D. H., 2014, ApJ, 786, 54
- Pei (1992) Pei Y. C., 1992, ApJ, 395, 130
- Peimbert (1967) Peimbert M., 1967, ApJ, 150, 825
- Peimbert et al. (1993) Peimbert M., Storey P. J., Torres-Peimbert S., 1993, ApJ, 414, 626
- Perley et al. (2016) Perley D. A., et al., 2016, ApJ, 817, 8
- Péroux & Howk (2020) Péroux C., Howk J. C., 2020, ARA&A, 58, 363
- Péroux et al. (2013) Péroux C., Bouché N., Kulkarni V. P., York D. G., 2013, MNRAS, 436, 2650
- Péroux et al. (2016) Péroux C., et al., 2016, MNRAS, 457, 903
- Pettini & Pagel (2004) Pettini M., Pagel B. E. J., 2004, MNRAS, 348, L59
- Pilyugin & Grebel (2016) Pilyugin L. S., Grebel E. K., 2016, MNRAS, 457, 3678
- Piranomonte et al. (2008) Piranomonte S., et al., 2008, A&A, 492, 775
- Planck Collaboration et al. (2016) Planck Collaboration et al., 2016, A&A, 594, A13
- Prochaska et al. (2003a) Prochaska J. X., Gawiser E., Wolfe A. M., Cooke J., Gelino D., 2003a, ApJS, 147, 227
- Prochaska et al. (2003b) Prochaska J. X., Castro S., Djorgovski S. G., 2003b, ApJS, 148, 317
- Prochaska et al. (2006) Prochaska J. X., Chen H.-W., Bloom J. S., 2006, ApJ, 648, 95
- Prochaska et al. (2007a) Prochaska J. X., et al., 2007a, ApJS, 168, 231
- Prochaska et al. (2007b) Prochaska J. X., Chen H.-W., Dessauges-Zavadsky M., Bloom J. S., 2007b, ApJ, 666, 267
- Pugliese et al. (2015) Pugliese V., Xu D., Tanvir N. R., Wiersema K., Fynbo J. P. U., Milvang-Jensen B., D’Elia V., 2015, GRB Coordinates Network, 17672, 1
- Rafelski et al. (2012) Rafelski M., Wolfe A. M., Prochaska J. X., Neeleman M., Mendez A. J., 2012, ApJ, 755, 89
- Rahmani et al. (2016) Rahmani H., et al., 2016, MNRAS, 463, 980
- Rao et al. (2006) Rao S. M., Turnshek D. A., Nestor D. B., 2006, ApJ, 636, 610
- Rastinejad et al. (2022) Rastinejad J. C., et al., 2022, Nature, 612, 223
- Rhoads et al. (2023) Rhoads J. E., et al., 2023, ApJ, 942, L14
- Rhodin et al. (2018) Rhodin N. H. P., Christensen L., Møller P., Zafar T., Fynbo J. P. U., 2018, A&A, 618, A129
- Rhodin et al. (2021) Rhodin N. H. P., Krogager J. K., Christensen L., Valentino F., Heintz K. E., Møller P., Zafar T., Fynbo J. P. U., 2021, MNRAS, 506, 546
- Saccardi et al. (2023) Saccardi A., et al., 2023, A&A, 671, A84
- Salvaterra et al. (2013) Salvaterra R., Maio U., Ciardi B., Campisi M. A., 2013, MNRAS, 429, 2718
- Sanders et al. (2016) Sanders R. L., et al., 2016, ApJ, 825, L23
- Sanders et al. (2021) Sanders R. L., et al., 2021, ApJ, 914, 19
- Sanders et al. (2023) Sanders R. L., Shapley A. E., Topping M. W., Reddy N. A., Brammer G. B., 2023, arXiv e-prints, p. arXiv:2303.08149
- Savaglio (2006) Savaglio S., 2006, New Journal of Physics, 8, 195
- Savaglio et al. (2003) Savaglio S., Fall S. M., Fiore F., 2003, ApJ, 585, 638
- Savaglio et al. (2012) Savaglio S., et al., 2012, MNRAS, 420, 627
- Schady (2017) Schady P., 2017, Royal Society Open Science, 4, 170304
- Schaerer et al. (2022) Schaerer D., Marques-Chaves R., Oesch P., Naidu R., Barrufet L., Izotov Y. I., Guseva N. G., Brammer G., 2022, arXiv e-prints, p. arXiv:2207.10034
- Schaye et al. (2015) Schaye J., et al., 2015, MNRAS, 446, 521
- Schlafly & Finkbeiner (2011) Schlafly E. F., Finkbeiner D. P., 2011, ApJ, 737, 103
- Schulte-Ladbeck et al. (2004) Schulte-Ladbeck R. E., Rao S. M., Drozdovsky I. O., Turnshek D. A., Nestor D. B., Pettini M., 2004, ApJ, 600, 613
- Schulte-Ladbeck et al. (2005) Schulte-Ladbeck R. E., König B., Miller C. J., Hopkins A. M., Drozdovsky I. O., Turnshek D. A., Hopp U., 2005, ApJ, 625, L79
- Selsing et al. (2019) Selsing J., et al., 2019, A&A, 623, A92
- Stanway et al. (2016) Stanway E. R., Eldridge J. J., Becker G. D., 2016, MNRAS, 456, 485
- Steidel et al. (2014) Steidel C. C., et al., 2014, ApJ, 795, 165
- Storey & Zeippen (2000) Storey P. J., Zeippen C. J., 2000, MNRAS, 312, 813
- Straka et al. (2016) Straka L. A., Johnson S., York D. G., Bowen D. V., Florian M., Kulkarni V. P., Lundgren B., Péroux C., 2016, MNRAS, 458, 3760
- Tanvir et al. (2019) Tanvir N. R., et al., 2019, MNRAS, 483, 5380
- Teimoorinia et al. (2021) Teimoorinia H., Jalilkhany M., Scudder J. M., Jensen J., Ellison S. L., 2021, MNRAS, 503, 1082
- Thöne et al. (2008) Thöne C. C., de Ugarte Postigo A., Vreeswijk P. M., Malesani D., Jakobsson P., 2008, GRB Coordinates Network, 8058, 1
- Thöne et al. (2013) Thöne C. C., et al., 2013, MNRAS, 428, 3590
- Troja et al. (2022) Troja E., et al., 2022, Nature, 612, 228
- Trump et al. (2022) Trump J. R., et al., 2022, arXiv e-prints, p. arXiv:2207.12388
- Vergani et al. (2009) Vergani S. D., Petitjean P., Ledoux C., Vreeswijk P., Smette A., Meurs E. J. A., 2009, A&A, 503, 771
- Villar-Martín et al. (2004) Villar-Martín M., Cerviño M., González Delgado R. M., 2004, MNRAS, 355, 1132
- Vreeswijk et al. (2004) Vreeswijk P. M., et al., 2004, A&A, 419, 927
- Vreeswijk et al. (2007) Vreeswijk P. M., et al., 2007, A&A, 468, 83
- Vreeswijk et al. (2013) Vreeswijk P. M., et al., 2013, A&A, 549, A22
- Weng et al. (2023) Weng S., et al., 2023, MNRAS, 519, 931
- Wiersema et al. (2007) Wiersema K., et al., 2007, A&A, 464, 529
- Wiseman et al. (2017) Wiseman P., Schady P., Bolmer J., Krühler T., Yates R. M., Greiner J., Fynbo J. P. U., 2017, A&A, 599, A24
- Wolfe et al. (2005) Wolfe A. M., Gawiser E., Prochaska J. X., 2005, ARA&A, 43, 861
- Woosley & Bloom (2006) Woosley S. E., Bloom J. S., 2006, ARA&A, 44, 507
- Xiao et al. (2018) Xiao L., Stanway E. R., Eldridge J. J., 2018, MNRAS, 477, 904
- Yates et al. (2021) Yates R. M., Henriques B. M. B., Fu J., Kauffmann G., Thomas P. A., Guo Q., White S. D. M., Schady P., 2021, MNRAS,
Affiliations
1 Department of Physics, University of Bath, Claverton Down, Bath BA2 7AY, UK 2 Centre for Astrophysics Research, University of Hertfordshire, Hatfield, AL10 9AB, UK 3 Cosmic Dawn Center (DAWN), Denmark 4 Niels Bohr Institute, University of Copenhagen, Jagtvej 128, 2200 Copenhagen N, Denmark 5 European Southern Observatory, Karl-Schwarzschild Str. 2, 85748 Garching bei München, Germany 6 Department of Astronomy, University of Geneva, Chemin Pegasi 51, 1290 Versoix, Switzerland 7 INAF – Osservatorio di Astrofisica e Scienza dello Spazio, Via Piero Gobetti 93/3, 40129 Bologna, Italy 8 Space Science Data Center (SSDC) - Agenzia Spaziale Italiana (ASI), 00133 Roma, Italy 9 INAF - Osservatorio Astronomico di Roma, Via Frascati 33, 00078 Monte Porzio Catone, Italy 10 Centre for Astrophysics and Cosmology, Science Institute, University of Iceland, Dunhagi 5, 107 Reykjavik, Iceland 11 Department of Physics & Astronomy, University of Utah, Salt Lake City, UT 84112, USA 12 Department of Astrophysics/IMAPP, Radboud University, 6525 AJ Nijmegen, The Netherlands 13 Istituto Nazionale di Astrofisica (INAF) Istituto di Astrofisica Spaziale e Fisica Cosmica, Via Alfonso Corti 12, I-20133, Milano, Italy 14 School of Physics and Astronomy, University of Leicester, University Road, Leicester, LE1 7RH, UK 15 Astronomical Institute, Czech Academy of Sciences, Fričova 298, Ondřejov, Czech Republic 16 GEPI, Observatoire de Paris, Université PSL, CNRS, 5 Place Jules Janssen, 92190 Meudon, France 17 Institut d’Astrophysique de Paris and Sorbonne Université, 98bis Boulevard Arago, 75014, Paris, France 18 Excellence Cluster ORIGINS, Boltzmannstraße 2, 85748 Garching, Germany 19 Ludwig-Maximilians-Universität, Schellingstraße 4, 80799 München, Germany 20 Department of Astronomy & Astrophysics, The University of Chicago, 5640 S Ellis Ave., Chicago, IL 60637, USA 21 Mathematics, Informatics, Physics and Earth Science Department of Messina University, Papardo campus, Via F. S. D’Alcontres 31, 98166, Messina, Italy 22 Space Telescope Science Institute, 3700 San Martin Dr, Baltimore, MD 21218, USA 23 Instituto de Astrofísica de Andalucía. CSIC. Apartado de correos 3004. 18080, Granada, Spain 24 School of Physics and Astronomy, University of Birmingham, Birmingham B15 2TT, UK 25 Institute for Gravitational Wave Astronomy, University of Birmingham, Birmingham B15 2TT, UK 26 Max-Planck-Institut fur extraterrestrische Physik, Giessenbachstrasse 1, D-85748 Garching, Germany 27 Clemson University, Department of Physics and Astronomy, Clemson, SC 29634, USA 28 Astrophysics Research Institute, Liverpool John Moores University, 146 Brownlow Hill, Liverpool L3 5RF, UK 29 Anton Pannekoek Institute for Astronomy, University of Amsterdam, P.O. Box 94249, 1090GE Amsterdam, The Netherlands 30 Physics Department, University of Calabria, 87036 Arcavacata di Rende, CS, Italy 31 INAF, Osservatorio Astronomico di Brera, via E. Bianchi 46, 23807, Merate, Italy 32 The Oskar Klein Centre, Department of Physics, Stockholm University, AlbaNova, SE-106 91 Stockholm, Sweden 33 Artemis, Observatoire de la Côte d’Azur, Université Côte d’Azur, CNRS, 06304 Nice, France 34 School of Physics and Astronomy, University of Southampton, Southampton, SO17 1BJ, UK