The monopole and quadrupole moments of the Epoch of Reionization (EoR) 21-cm bispectrum
Abstract
We study the monopole () and quadrupole () moments of the 21-cm bispectrum (BS) from EoR simulations and present results for squeezed and stretched triangles. Both and are positive at the early stage of EoR where the mean neutral hydrogen (H i) density fraction . The subsequent evolution of and at large and intermediate scales and respectively) is punctuated by two sign changes which mark transitions in the H i distribution. The first sign flip where becomes negative occurs in the intermediate stages of EoR , at large scale first followed by the intermediate scale. This marks the emergence of distinct ionized bubbles in the neutral background. is relatively less affected by this transition, and it mostly remains positive even when becomes negative. The second sign flip, which affects both and , occurs at the late stage of EoR . This marks a transition in the topology of the H i distribution, after which we have distinct H i islands in an ionized background. This causes to become positive. The negative is a definite indication that the H i islands survive only in under-dense regions.
keywords:
cosmology: reionization, diffuse radiation –– simulations - methods: statistical1 Introduction
The Epoch of Reionization (EoR), when the first luminous objects ionized the neutral hydrogen (H i ) gas in the intergalactic medium (IGM), is one of the least understood era in the evolution of our Universe. Observations of the Cosmic Microwave Background (CMB) (e.g. Planck Collaboration et al. 2016), the absorption spectra of quasars (e.g. Becker et al. 2001), and the luminosity function of Lyman- emitters (e.g. Trenti et al. 2010) all indirectly probe the EoR, however, these provide rather limited information about the EoR. Observations of the redshifted H i 21-cm radiation are a very promising probe of the EoR (e.g. Furlanetto et al. 2006). Despite continued efforts using several telescopes, a detection of the EoR 21-cm power spectrum (PS) is still forthcoming. The main impediment for detecting the 21-cm PS comes from foregrounds, which are order of magnitude stronger (Ali et al., 2008). At present, the best upper limits on the EoR 21-cm PS come from the HERA experiment (Abdurashidova et al., 2022). It is anticipated that more sensitive observations with existing instruments and also the forthcoming SKA1-Low (Koopmans et al., 2015) will result in a detection.
Much of the effort to quantify the EoR 21-cm signal has focused on the 21-cm PS. While this completely describes Gaussian fields, an early paper (Bharadwaj & Pandey, 2005) predicts the EoR 21-cm signal to be highly non-Gaussian and also provides predictions for the 21-cm bispectrum (BS), which is the lowest order statistics that captures this non-Gaussianity. The 21-cm BS holds the potential to offer valuable insights into the evolution of the H i distribution during the EoR (Yoshiura et al., 2015; Majumdar et al., 2018, 2020; Hutter et al., 2020), tighten the constraints on EoR models (Watkinson et al., 2022; Tiwari et al., 2022) and probe the IGM physics (Watkinson et al., 2021; Kamran et al., 2021a, b, 2022).
Redshift space distortion (RSD) is an important effect imprinted in the 21-cm signal (Bharadwaj et al., 2001; Bharadwaj & Ali, 2004), causing an anisotropy in the 21-cm PS along the line of sight (LoS) direction. Majumdar et al. (2013) have quantified this anisotropy using the quadrupole moment of the 21-cm PS estimated from semi-numerical simulations of the EoR. Considering the quadrupole to monopole ratio, they show that at large scales this becomes negative when the mean H i density fraction drops to . They propose this as a direct signature of the inside-out reionization scenario. Analytical predictions (eg. Scoccimarro et al. 1999; Bharadwaj et al. 2020) suggest that the anisotropy in the BS can similarly be quantified by decomposing it into angular multipoles using spherical harmonics. In a recent study with the simulated signal, Majumdar et al. (2020) have shown that RSD can change the amplitude of the monopole 21-cm BS by , and can also cause it to flip sign. To the best of our knowledge, previous studies of the 21-cm BS have all been restricted to the monopole moment. In this paper, we present predictions for the quadrupole moment of the EoR 21-cm BS using a large set of statistically independent simulated signal realizations. As the quadrupole moment is entirely due to the line of sight effects, it can potentially measure and quantify the impact of these effects on the non-Gaussian nature of the H i distribution. Here, we study the quadrupole moment due to RSD. Moreover, the quadrupole moment of the BS used in conjunction with the monopole can impose tighter constraints on the EoR model (and its parameters) in comparison to those achievable using the monopole alone.
2 Methodology
We have simulated the EoR 21-cm signal using the semi-numerical code ReionYuga111https://github.com/rajeshmondal18/ReionYuga (Mondal et al., 2021a), whose details have also been presented in Majumdar et al. (2013) and which closely follows the homogeneous reionization scheme of Choudhury et al. (2009). The dark matter only PM N-body simulation considers a comoving volume with a grids and particles each of mass . Dark matter halos were identified as having a minimum mass of (10 particles) using FoF algorithm with linking length grid units. The H i reionization field was calculated on a coarser grids of spacing (comoving). The reionization model has three free parameters namely , , for which we have used the values respectively. Here is the minimum halo mass assumed to host a reionization source (UV luminous galaxy), is a proportionality constant that linearly relates the number of ionizing photons emitted by an ionizing source to the amount of hydrogen contained in the host halo and is the mean free path of the ionizing photons. This choice of simulation parameters corresponds to a model of EoR where reionization starts around and ends around , marking ionization at . The integrated Thomson scattering optical depth computed for our fiducial model is , which is consistent with obtained from CMB measurements (Planck Collaboration et al., 2020). These fiducial simulations have been used in many previous studies (Mondal et al., 2015; Mondal et al., 2017a, b; Majumdar et al., 2018, 2020; Shaw et al., 2019; Pramanick et al., 2023). Varying the model parameters will change the evolution history of the mean neutral hydrogen fraction . However, we do not expect the overall topology of the 21-cm signal at different stages of reionization to change drastically. The reader is referred to Shaw et al. (2020) for a detailed discussion on the effect of varying these parameters. We have generated snapshots of the redshift space 21-cm signal at six different redshifts and . We have run statistically independent realizations of the simulations which provide the mean values and the error bars for the results presented here.
The EoR 21-cm redshift space BS has been decomposed into angular multipoles using spherical harmonics where
| (1) |
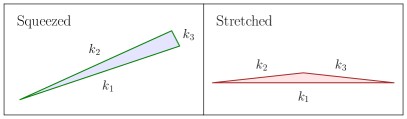
With reference to a triangle , (the largest side) quantifies its size, the two dimensionless parameters with and quantify its shape and the unit vector quantifies its orientation with respect to the LoS (Bharadwaj et al., 2020). Our entire analysis is restricted to the monopole and quadrupole with . Shaw et al. (2021) have recently proposed a fast estimator to quantify the shape dependence of the bispectrum monopole. Here, we have slightly modified this and used it to estimate the binned bispectrum monopole and quadrupole moments for triangles of all possible unique shapes. The monopole (Majumdar et al., 2020; Mondal et al., 2021b; Tiwari et al., 2022) and the quadrupole are both found to have the largest values and the highest statistical significance (signal-to-noise ratio) for linear triangles, which corresponds to the situation where the two largest sides of the triangle are nearly aligned in the same direction and the cosine of the angle between these two sides . Results are presented here only for linear triangles of two specific shapes and which respectively correspond to squeezed triangles and stretched triangles both of which are illustrated in Figure 2.
3 Results
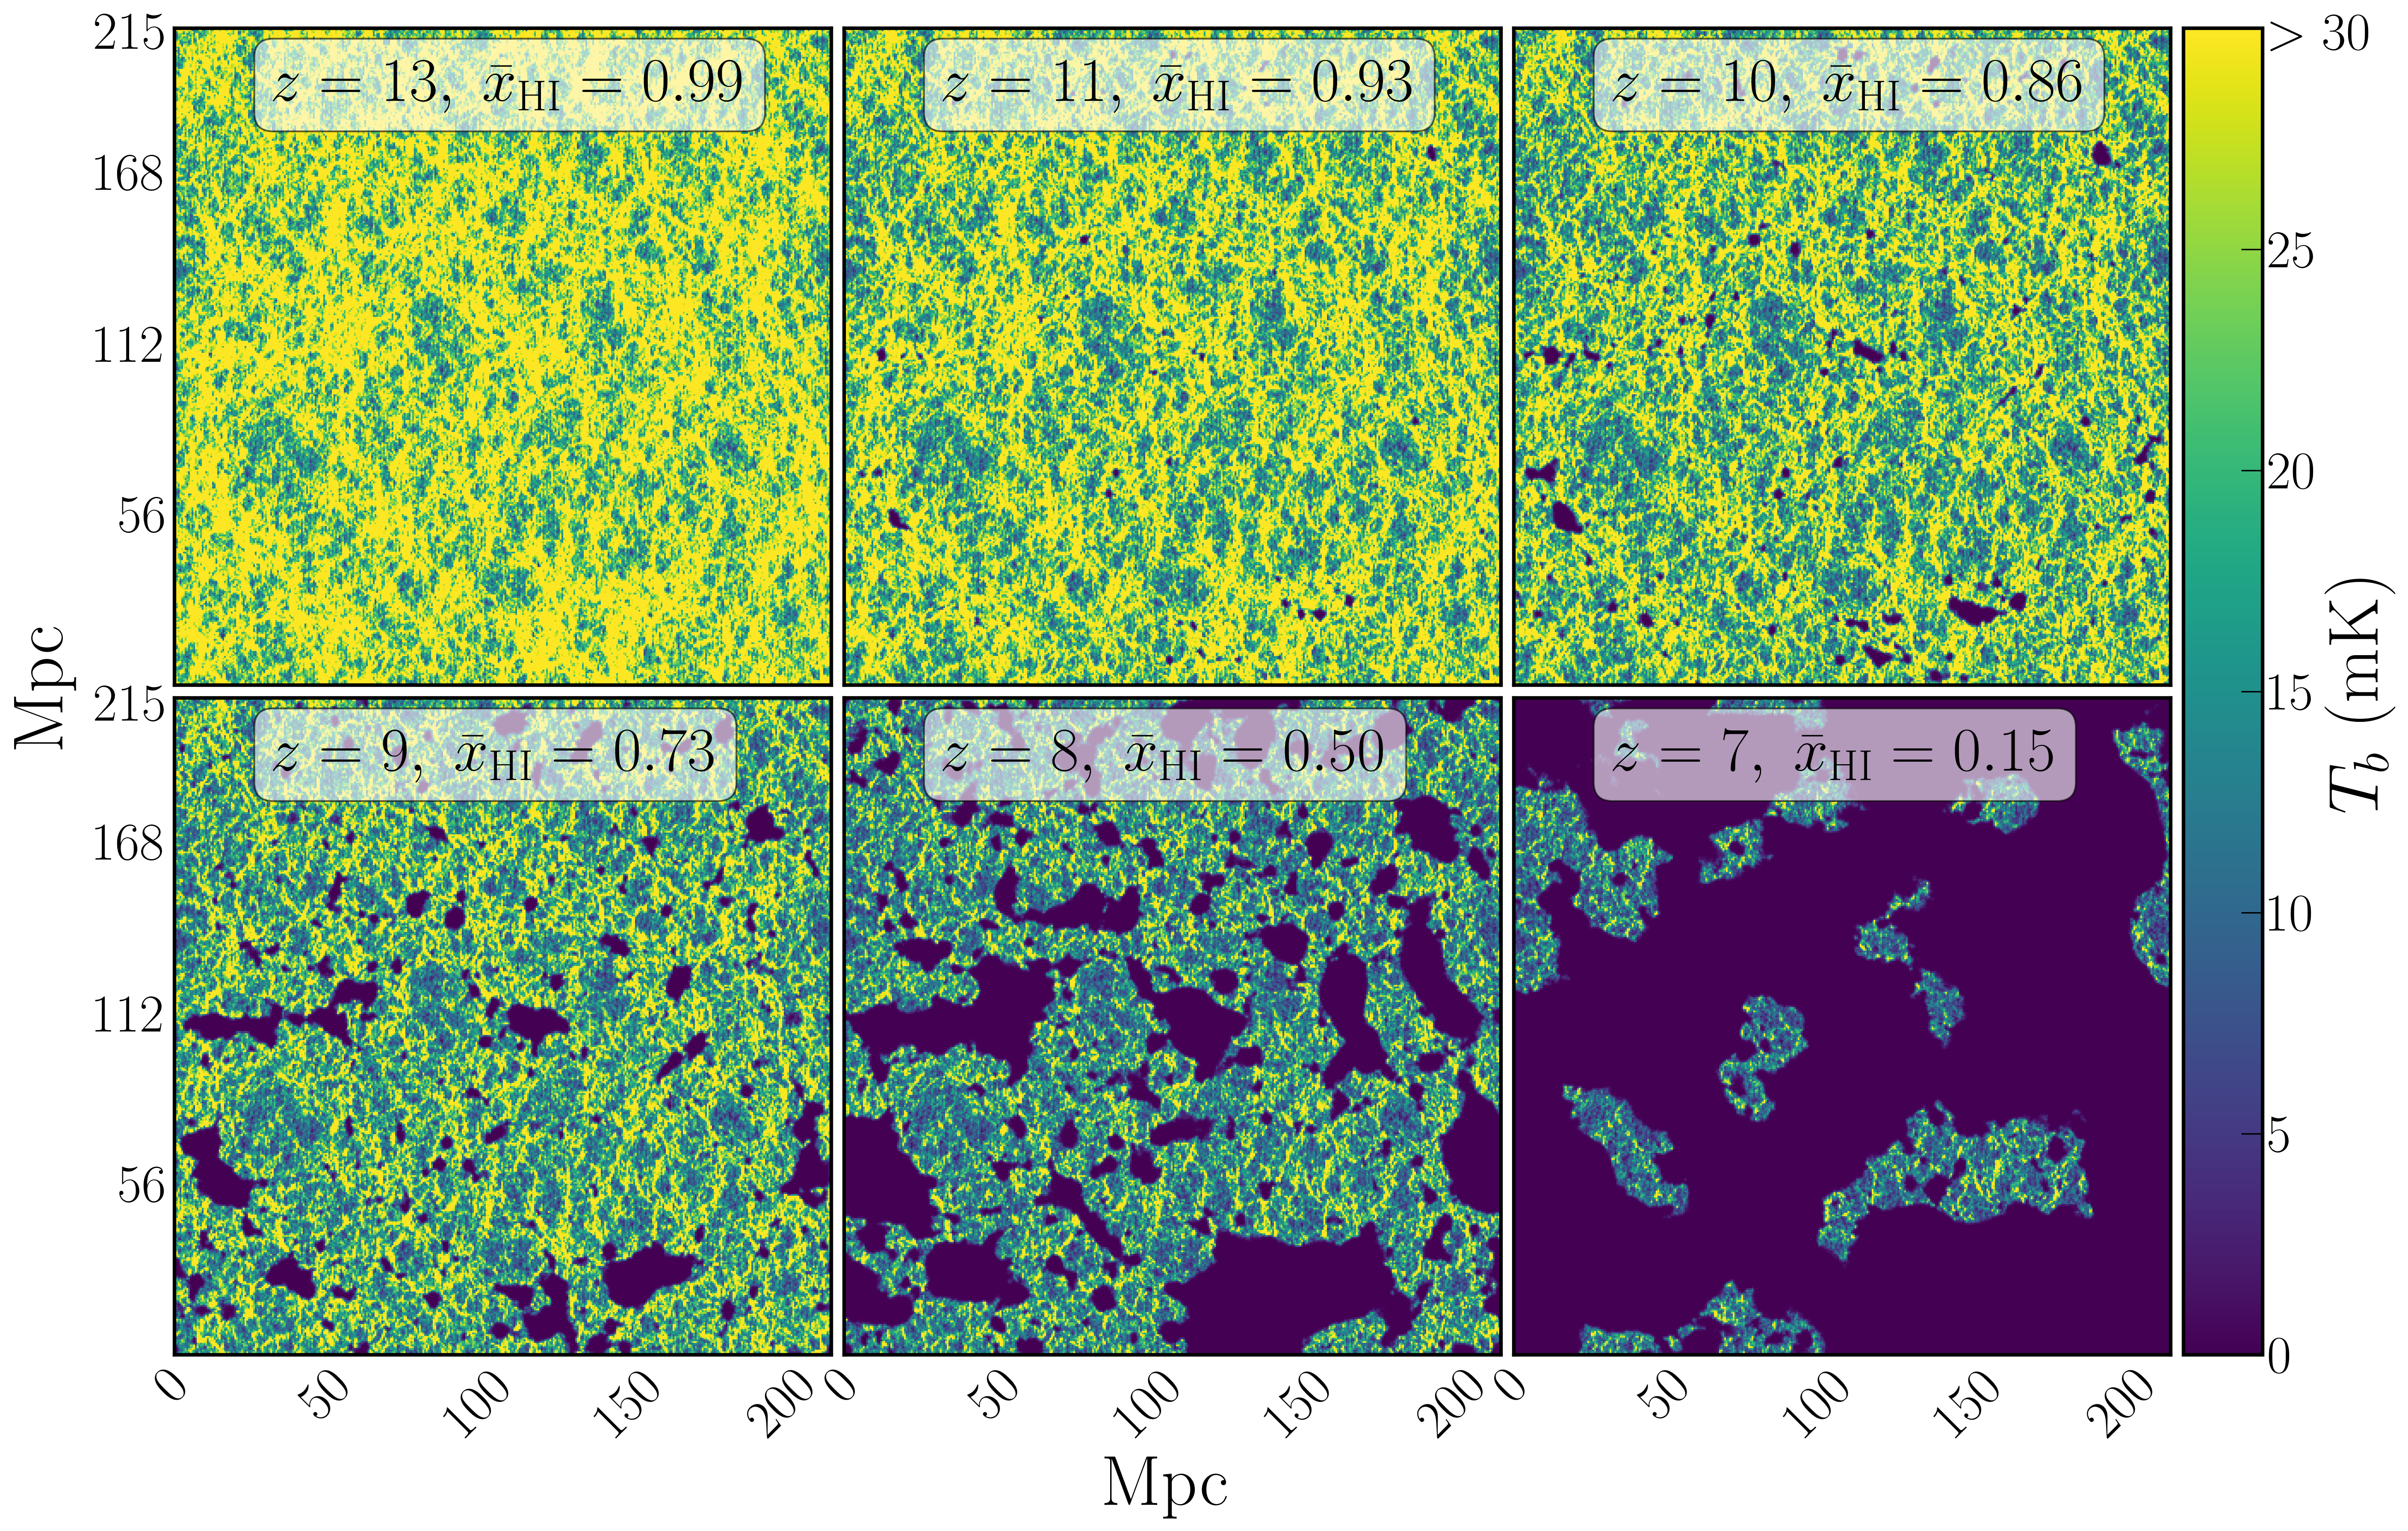
Figure 1 visually depicts the redshift evolution of the 21-cm brightness temperature distribution. At the early stage (), the H i is nearly completely neutral with . There are a few small isolated ionized (H ii ) bubbles that cannot be visually identified. These isolated H ii bubbles grow and merge during the intermediate stages of EoR () where . The mid-stage (), which occurs at , marks a transition in the H i distribution. Subsequently, at the late stage , the bulk of the H i is ionized (), and we are left with isolated H i islands. The emergence of large H ii bubbles during the intermediate and mid stages and H i islands at the late stage makes the EoR 21-cm signal highly non-Gaussian.
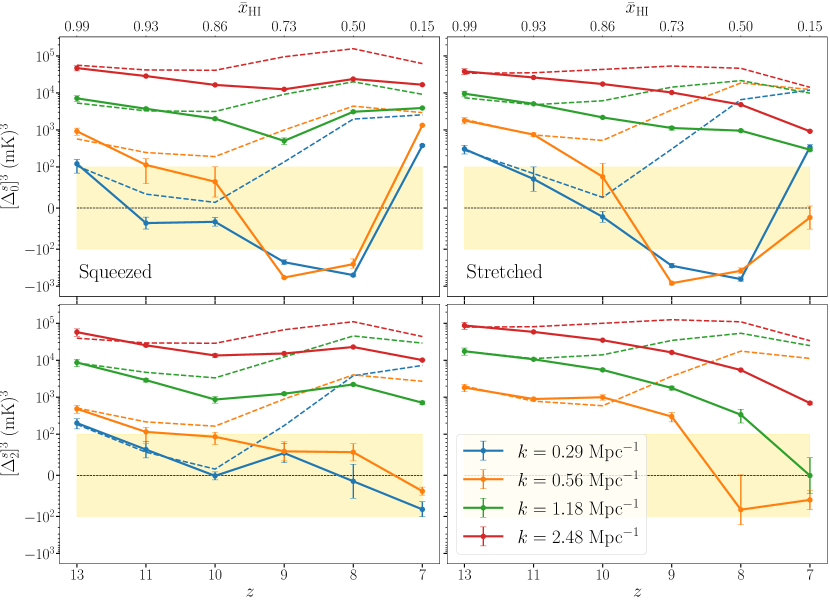
The top row of Figure 3 shows the redshift evolution of (redshift space monopole) which we may interpret as the mean cubed brightness temperature fluctuation, and the lower row shows (redshift space quadrupole), which has been similarly defined using . The left and right columns correspond to squeezed and stretched triangles, respectively. The different curves in each panel correspond to and , which we refer to as large, intermediate, small, and smallest scales, respectively. We have also shown (dashed lines) the predictions from second-order perturbation theory (2PT) using the formulae from Mazumdar et al. (2020) with being the real space 21-cm PS estimated from the simulations as input. The 2PT predictions assume that the H i traces the underlying matter distribution. Due to the limited simulation volume, we do not obtain a statistically significant (SNR ) estimate of for stretched triangles at large scales, and we have not shown this here. Considering the overall behaviour, we see that in most cases, the results for squeezed and stretched triangles are very similar, and we discuss these together.
The early stage of EoR . Here, we see that both and are positive, and the value of the quadrupole is comparable to that of the monopole. In some cases, the quadrupole exceeds the monopole by a factor in the range of to . We further see that at all scales and closely follow the 2PT predictions and respectively. This indicates that it is reasonable to assume that at this stage the H i traces the underlying matter () distribution, whereby and which arise nearly entirely from the non-Gaussianity in the underlying matter distribution. Note that we have also used and as proxies for and respectively at lower redshift. While this is not strictly correct once there is significant reionization, we still expect this to correctly capture some of the salient features. In particular, we see that both and increase by several orders of magnitude as we go from large scale to the smallest scale (increasing ), a behaviour we may also expect to hold at lower . In addition, we also expect both and to scale as as reionization proceeds.
The intermediate and mid stages of EoR . We find that both and deviate from the 2PT predictions during these stages. We attribute these deviations to the emergence of “extra ionization () features" in the H i distribution and use to qualitatively interpret the results for the monopole. We note that this simple model ignores several ‘matter-ionization’ cross-terms. However, earlier studies (Majumdar et al., 2018, 2020) have shown that these cross-terms make a sub-dominant contribution to the monopole, and the two dominant terms considered here provide a reasonable qualitative understanding. As reionization proceeds, in all cases, falls below , and it continues to decline to become negative at large and intermediate scales. The sign-flip to negative values occurs at the large scale first, followed by the intermediate scale, and for both these length-scales and for both squeezed and stretched triangles, has particularly large negative values in the redshift range . For the small and smallest scales, remains positive throughout.
The 21-cm signal during the intermediate and mid stages of EoR may be thought to originate from a distribution of distinct ionized bubbles embedded in a neutral medium (Figure 1). Bharadwaj & Pandey (2005) have calculated the bispectrum for the distribution of non-overlapping ionized spheres in a neutral medium, and this is predicted to be negative. Further, is also predicted to increase as for small , and remain constant or decline rapidly for , where is the typical bubble radius (which varies with ). During these stages where , we also expect to increase as reionization proceeds. These considerations lead to a picture where the negative values of arise due to the emergence of the ionized bubbles whereby at large and mediate scales. As noted earlier, the value of increases with and it exceeds that of at the small and smallest scales where is positive throughout. Several earlier works (Majumdar et al., 2018, 2020; Hutter et al., 2020) have proposed that the sign-flip from positive to negative values seen at large and intermediate scales is a distinct signature of the onset of reionization.
We now consider during the intermediate and mid stages of EoR. Similar to , the values of also deviate from the 2PT predictions, and these deviations mostly increase as reionization proceeds. However, unlike , we cannot use to qualitatively interpret the evolution. It is important to note that arises due to RSD, and is predicted to be zero in the absence of RSD. The peculiar velocities responsible for RSD are sourced by fluctuations in the underlying matter distribution, and a reference to the matter fluctuations is unavoidable for modeling . Here we use to qualitatively interpret the results for the quadrupole. The term encapsulates many possible matter-ionization cross-correlations which arise due to the effect of peculiar velocities on the ionization field. Notable among these is a term which arises from the rearrangement of the ionization field due to the peculiar velocities, a similar term for the matter field also arises in the 2PT predictions (Scoccimarro et al., 1999).
We first consider the large scale for squeezed triangles. Here we see that the value of matches the 2PT prediction at . We also notice that where is negative at . This indicates that at we already have ionized bubbles which cause to become negative and exceed in magnitude. However, this does not appear to have much impact on implying that . At lower , the values of drop below those of and they are also small in comparison to the monopole which is negative.
We next consider the intermediate scales. Here remains positive at and for both squeezed and stretched triangles. For squeezed triangles is below , however the values are quite large with and at and respectively. For stretched triangles, matches and at , whereas slightly exceeds and at . These results seem to indicate that we have and at and , although the reason why slightly exceeds for stretched triangles at is not clear at present. We see that drops sharply and becomes negative at lower redshifts for both squeezed and stretched triangles. In contrast, declines gradually and mostly remain positive in this range. Here, the values of are relatively small in comparison to the monopole, and they are in the range .
Considering the large and intermediate scales together, the monopole exhibits a transition from positive to negative as reionization proceeds. In contrast , the quadrupole mostly remains positive. Although does become negative at for two cases, the error bars are large, and these values are consistent with zero.
For the small and smallest scales, roughly matches the 2PT predictions at and deviates from these as EoR progresses. At these scales the values of remain positive throughout. For squeezed triangles, the ratio has values in the range , with the exception of where it shoots up to for small length scales. For stretched triangles, the ratio has values in the range , with the exception of where it drops to for small length scales. Considering all the length scales together, we note that the values of are larger for stretched triangles in comparison to the squeezed triangles.
We reiterate that the quadrupole moment arises entirely due to RSD, and this is predicted to be zero in the absence of RSD. The 2PT predictions illustrate that RSD has a strong effect on the underlying matter distribution, as the induced is positive and is comparable in magnitude to . In contrast, RSD is expected to have a less pronounced effect on the ionized bubbles. It is possible to estimate this by considering the divergence of the peculiar velocities (in suitable units, eq. (10) of Bharadwaj & Ali 2004), which is comparable to the density contrast in the underlying matter distribution. This will be small in comparison to the H i fluctuations produced by the ionized bubbles, and we expect . This provides a qualitative interpretation for the fact that matches the 2PT predictions at whereas shows considerable deviations from at the same redshift. This further explains why remains positive at large and intermediate scales, in contrast to , which becomes negative. This also leads us to expect that at the small and smallest scales.
The late stage of EoR . Considering the large and intermediate scales, we see that both and flip signs to respectively become positive and negative at this stage. Here the magnitude of is around . At the small and smallest scales, both and remain positive at this stage. Here the magnitude of is comparable to that of at the smallest scale, whereas it is approximately an order of magnitude smaller than at the small scale.
During the late stage of EoR, the 21-cm signal originates from individual H i islands embedded in an ionized background (Figure 1). This is practically a negative image of the H i distribution during the intermediate stages of EoR, where we have individual ionized bubbles in a neutral medium, and we expect to be similar but with an opposite sign. Considering the inside-out reionization scenario implemented here, we expect the over-dense region to be ionized first with the H i islands surviving mainly in the under-dense regions of the underlying matter distribution. Considering a hypothetical situation where the H i islands reside in the over-dense regions, RSD would then produce a positive somewhat similar to . However, the peculiar velocities responsible for the RSD are reversed in the under-dense regions where the H i islands actually reside, and this leads to a negative quadrupole during the late stage of EoR. For the large and intermediate scales, both and are expected to be quite small, and the considerations outlined above for and provide a qualitative interpretation for the positive and negative values of and respectively. The magnitude of and both increase with , and we expect these to dominate at the small and smallest scales where and remain positive throughout EoR.
4 Discussion and Conclusions
We have used independent realizations of the simulated EoR 21-cm signal to obtain statistically reliable estimates for both the monopole and quadrupole moments of the BS, and also the error-bars for these. Results are presented only for squeezed and stretched triangles where the BS is expected to have the largest magnitude. To the best of our knowledge, this is the first study of the quadrupole moment of the EoR 21-cm BS. The quadrupole moment arises entirely due to RSD, and this is predicted to be zero in the absence of RSD.
We first consider the large and intermediate scales ( respectively) which are particularly sensitive to reionization. At the early stage, both and are positive and they match the 2PT predictions indicating that they trace the non-Gaussianity of the underlying matter distribution. The subsequent evolution of and is punctuated by two changes in sign, each of which marks a transition in the H i distribution. The first sign-flip where becomes negative occurs during the intermediate stages of EoR . This sign-flip occurs first at large scales and subsequently at intermediate scales, and it marks the emergence of distinct ionized bubbles embedded in the neutral background. It has been proposed that the negative value of is a distinct signature of the onset of reionization (Majumdar et al., 2018, 2020; Hutter et al., 2020). The ionized bubbles grow and merge as reionization proceeds. This is reflected in the negative values of , which also grows as reionization proceeds, and we find the largest negative values near the mid-stage of EoR . In comparison to , the quadrupole is much less affected by the onset of reionization. In fact, in some cases, continues to match the 2PT predictions even when has become negative. Further, the values of mostly remain positive in contrast to , which becomes negative after the onset of reionization.
As reionization proceeds, the ionized regions merge, and we are left with a distribution of distinct H i islands embedded in an ionized background. The second sign-flip, when both and change signs, marks this change in the topology of the H i distribution at the late stage of EoR . The H i islands are somewhat like a negative image of the ionized bubbles. This causes the sign of to change from negative to positive at the late stage. Here we note a very recent work (Raste et al., 2023)222This appeared on arxiv while the present manuscript was under preparation. which has reported a similar sign-change arising from H i islands at the late stage of EoR. The work presented there consider two different reionization models and a variety of triangle shapes, it is however restricted to the monopole . Considering the quadrupole , we see that this also exhibits a sign-flip and changes from positive to negative at the late stage of EoR. The H i islands are expected to survive only in the under-dense regions of the underlying matter distribution. This causes the peculiar velocities to be anti-correlated with the H i distribution, resulting in a negative . Note that is negative only if the H i islands reside in under-dense regions, and it would be positive if the H i islands were to reside in over-dense regions instead. Hence, unlike which only captures the transition in topology from the emergence of H ii bubbles to H i islands, can potentially distinguish between inside-out and outside-in models of the EoR. We note that the position-dependent power spectrum studied by Giri et al. (2019) is also a useful tool to distinguish between such EoR models.
The present work shows that both and are sensitive to changes in the topology of the H i distribution. Considering simulations which exhibit a reionization history very similar to the present work, Bag et al. (2019) have identified a percolation transition in the H ii distribution at where and barely of the volume is ionized. It is interesting to note that the BS seems to indicate a change in topology (or at least a transition) at a lower , somewhere between and where . The quadrupole moment of the large scale 21-cm PS, however, becomes negative for which is close to the percolation threshold. However, it is not clear if this behaviour of the 21-cm PS is in anyway related to the topology of the H i distribution.
The quadrupole quantifies aspects of the non-Gaussian EoR 21-cm signal that are not captured by the monopole . A joint detection of and would provide a strong confirmation of the non-Gaussian behavior of the EoR 21-cm signal. Furthermore, these two independent statistics used together would substantially enhance our understanding of reionization and impose tighter constraints on EoR model parameters as compared to the situation where we use alone. However, the exploration of EoR model parameter estimation falls outside the scope of this work. It would also be interesting to investigate how and evolve under different EoR models where the topology and evolution of the 21-cm signal differ significantly. We plan to explore this in the future.
In conclusion, we note that complements as a probe of the H i distribution. The value of can be comparable to that of , and it may also exceed it by a factor in the range to – particularly at the small and smallest scales where both and are predicted to be positive throughout EoR. At large and intermediate scales, changes in the signs of and mark transitions in the H i distribution. In particular, we propose that a positive accompanied by a negative are a distinct and definite signature of H i islands residing in under-dense regions at the late stage of reionization.
Acknowledgements
SSG and SP acknowledge the support of the Prime Minister’s Research Fellowship (PMRF). AKS acknowledges support by the Israel Science Foundation (grant no. 255/18). SM acknowledges support from the Science and Engineering Research Board (SERB), Department of Science and Technology, GoI through the Core Research Grant No. CRG/2021/004025. We acknowledge the National Supercomputing Mission (NSM) for providing computing resources of ‘PARAM Shakti’ at IIT Kharagpur, which is implemented by C-DAC and supported by the Ministry of Electronics and Information Technology (MeitY) and Department of Science and Technology (DST), Government of India.
Data availability
The simulated data and the package involved in this work will be shared on reasonable request to the corresponding author.
References
- Abdurashidova et al. (2022) Abdurashidova Z., et al., 2022, ApJ, 925, 221
- Ali et al. (2008) Ali S. S., Bharadwaj S., Chengalur J. N., 2008, MNRAS, 385, 2166
- Bag et al. (2019) Bag S., Mondal R., Sarkar P., Bharadwaj S., Choudhury T. R., Sahni V., 2019, MNRAS, 485, 2235
- Becker et al. (2001) Becker R. H., et al., 2001, AJ, 122, 2850
- Bharadwaj & Ali (2004) Bharadwaj S., Ali S. S., 2004, MNRAS, 352, 142
- Bharadwaj & Pandey (2005) Bharadwaj S., Pandey S. K., 2005, MNRAS, 358, 968
- Bharadwaj et al. (2001) Bharadwaj S., Nath B. B., Sethi S. K., 2001, JoAA, 22, 21
- Bharadwaj et al. (2020) Bharadwaj S., Mazumdar A., Sarkar D., 2020, MNRAS, 493, 594
- Choudhury et al. (2009) Choudhury T. R., Haehnelt M. G., Regan J., 2009, MNRAS, 394, 960
- Furlanetto et al. (2006) Furlanetto S. R., Oh S. P., Briggs F. H., 2006, Phys. Rep., 433, 181
- Giri et al. (2019) Giri S. K., D’Aloisio A., Mellema G., Komatsu E., Ghara R., Majumdar S., 2019, J. Cosmology Astropart. Phys., 2019, 058
- Hutter et al. (2020) Hutter A., Watkinson C. A., Seiler J., Dayal P., Sinha M., Croton D. J., 2020, MNRAS, 492, 653
- Kamran et al. (2021a) Kamran M., Majumdar S., Ghara R., Mellema G., Bharadwaj S., Pritchard J. R., Mondal R., Iliev I. T., 2021a, arXiv e-prints, p. arXiv:2108.08201
- Kamran et al. (2021b) Kamran M., Ghara R., Majumdar S., Mondal R., Mellema G., Bharadwaj S., Pritchard J. R., Iliev I. T., 2021b, MNRAS, 502, 3800
- Kamran et al. (2022) Kamran M., Ghara R., Majumdar S., Mellema G., Bharadwaj S., Pritchard J. R., Mondal R., Iliev I. T., 2022, JCAP, 2022, 001
- Koopmans et al. (2015) Koopmans L., et al., 2015, in Advancing Astrophysics with the Square Kilometre Array (AASKA14). p. 1 (arXiv:1505.07568), doi:10.22323/1.215.0001
- Majumdar et al. (2013) Majumdar S., Bharadwaj S., Choudhury T. R., 2013, MNRAS, 434, 1978
- Majumdar et al. (2018) Majumdar S., Pritchard J. R., Mondal R., Watkinson C. A., Bharadwaj S., Mellema G., 2018, MNRAS, 476, 4007
- Majumdar et al. (2020) Majumdar S., Kamran M., Pritchard J. R., Mondal R., Mazumdar A., Bharadwaj S., Mellema G., 2020, MNRAS, 499, 5090
- Mazumdar et al. (2020) Mazumdar A., Bharadwaj S., Sarkar D., 2020, MNRAS, 498, 3975
- Mondal et al. (2015) Mondal R., Bharadwaj S., Majumdar S., Bera A., Acharyya A., 2015, MNRAS: Letters, 449, L41
- Mondal et al. (2017a) Mondal R., Bharadwaj S., Majumdar S., 2017a, MNRAS, 464, 2992
- Mondal et al. (2017b) Mondal R., Bharadwaj S., Datta K. K., 2017b, MNRAS, 474, 1390
- Mondal et al. (2021a) Mondal R., Bharadwaj S., Majumdar S., 2021a, ReionYuga: Epoch of Reionization neutral Hydrogen field generator, Astrophysics Source Code Library, record ascl:2107.005 (ascl:2107.005)
- Mondal et al. (2021b) Mondal R., Mellema G., Shaw A. K., Kamran M., Majumdar S., 2021b, MNRAS, 508, 3848
- Planck Collaboration et al. (2016) Planck Collaboration et al., 2016, A&A, 596, A108
- Planck Collaboration et al. (2020) Planck Collaboration et al., 2020, A&A, 641, A6
- Pramanick et al. (2023) Pramanick S., Mondal R., Bharadwaj S., 2023, arXiv preprint arXiv:2304.14171
- Raste et al. (2023) Raste J., Kulkarni G., Watkinson C. A., Keating L. C., Haehnelt M. G., 2023, arXiv e-prints, p. arXiv:2308.09744
- Scoccimarro et al. (1999) Scoccimarro R., Couchman H. M. P., Frieman J. A., 1999, Astrophys. J., 517, 531
- Shaw et al. (2019) Shaw A. K., Bharadwaj S., Mondal R., 2019, MNRAS, 487, 4951
- Shaw et al. (2020) Shaw A. K., Bharadwaj S., Mondal R., 2020, MNRAS, 498, 1480
- Shaw et al. (2021) Shaw A. K., Bharadwaj S., Sarkar D., Mazumdar A., Singh S., Majumdar S., 2021, JCAP, 2021, 024
- Tiwari et al. (2022) Tiwari H., Shaw A. K., Majumdar S., Kamran M., Choudhury M., 2022, JCAP, 2022, 045
- Trenti et al. (2010) Trenti M., Stiavelli M., Bouwens R. J., Oesch P., Shull J. M., Illingworth G. D., Bradley L. D., Carollo C. M., 2010, ApJ, 714, L202
- Watkinson et al. (2021) Watkinson C. A., Trott C. M., Hothi I., 2021, MNRAS, 501, 367
- Watkinson et al. (2022) Watkinson C. A., Greig B., Mesinger A., 2022, MNRAS, 510, 3838
- Yoshiura et al. (2015) Yoshiura S., Shimabukuro H., Takahashi K., Momose R., Nakanishi H., Imai H., 2015, MNRAS, 451, 266