Oxygen abundance of Vel from [O iii] 88m Herschel/PACS spectroscopy
Abstract
We present Herschel PACS spectroscopy of the [O iii] 88.4m fine-structure line in the nearby WC8+O binary system Vel to determine its oxygen abundance. The critical density of this line corresponds to several 10 such that it is spatially extended in PACS observations at the 336 pc distance to Vel. Two approaches are used, the first involving a detailed stellar atmosphere analysis of Vel using cmfgen, extending to cm-3 in order to fully sample the line formation region of [O iii] 88.4m. The second approach involves the analytical model introduced by Barlow et al. and revised by Dessart et al., additionally exploiting ISO LWS spectroscopy of [O iii] 51.8m. We obtain higher luminosities for the WR and O components of Vel with respect to De Marco et al., = 5.31 and 5.56, respectively, primarily due to the revised (higher) interferometric distance. We obtain an oxygen mass fraction of = 1.00.3% for an outer wind volume filling factor of = 0.50.25, favouring either standard or slightly reduced Kunz et al. rates for the reaction from comparison with BPASS binary population synthesis models. We also revisit neon and sulphur abundances in the outer wind of Vel from ISO SWS spectroscopy of [S iv] 10.5m, [Ne ii] 12.8m and [Ne iii] 15.5m. The inferred neon abundance = 2.0% is in excellent agreement with BPASS predictions, while the sulphur abundance of = 0.040.01% agrees with the solar abundance, as expected for unprocessed elements.
keywords:
stars: Wolf-Rayet - stars: early-type - stars: massive - stars: abundances - infrared: stars1 Introduction
The majority of oxygen and other -elements in the universe are created in massive stars. Such stars not only achieve requisite temperatures to synthesise heavy elements, but during late evolutionary phases inject immense mechanical energy to mix these fresh ingredients into the interstellar medium (ISM). Wolf-Rayet (WR) stars are the evolved descendants of O-stars which exhibit prodigious mass-loss rates of yr-1 via line-driven winds, and are characterised by strong emission line spectra of nitrogen (WN), carbon (WC) or oxygen (WO), representing a broad evolutionary sequence (Crowther, 2007). Evidence for chemical enrichment of the ISM by WR winds has been observed in the circumstellar nebulae of individual WR stars (Esteban et al., 1992; Stock et al., 2011), and invoked to explain an increased N/O ratio in galaxies displaying WR spectral features (Brinchmann et al., 2008; López-Sánchez & Esteban, 2010).
WC (and WO) stars represent the final evolutionary stages of stars (Meynet & Maeder, 2005). Following a lifetime of extreme mass-loss, these ‘naked’ helium stars offer a unique window into the chemical evolution of massive star cores. Accurate measurement of abundances in such stars stars can therefore provide important constraints on nuclear reaction rates and the efficiency of various internal mixing processes.
The precise amount of oxygen produced in massive stars has long been a contentious issue (Fowler, 1984). The ratio is sensitive to the core density and temperature and duration of Helium burning, but it depends directly on the competition in rates of the and processes. The rate of is reasonably secure (Fynbo et al., 2005), but a significant level of uncertainty remains regarding the rate of (Buchmann & Barnes, 2006). Aadland et al. (2022) have recently discussed implications of varying rates for contemporary evolutionary models of massive stars.
The abundances of helium and carbon in WC atmospheres are well known. Model atmosphere codes such as cmfgen (Hillier & Miller, 1998) and PoWR (Gräfener et al., 2002) have been developed to solve the transfer equation under non-LTE conditions in an expanding, spherically symmetric, clumpy atmosphere. These have been applied to reproduce the plethora of carbon recombination lines in WC near-UV/optical/near-IR spectra, typically revealing by number ( 20-50% by mass) (Crowther et al., 2002; Sander et al., 2012; Aadland et al., 2022).
Despite the prevalence of oxygen lines in WC and particularly WO spectra, the measurement of abundances by spectroscopic modelling has been challenging, since C lines dominate most regions of the UV–optical spectrum, and many O features are highly sensitive to ionisation (Crowther et al., 2002). The O lines most appropriate and commonly used to determine abundances in WC spectra are found in the near-UV (3000–3500Å), and are therefore severely affected by dust extinction in the Galactic plane. Using space-based UV observations of WC and WO stars in the LMC, Aadland et al. (2022) measure oxygen abundances of by number ( 2–9% by mass). Another problem has been the complexity of model atoms required to accurately compute radiative transfer solutions in the winds of WC and WO stars, particularly for late-type WC stars abundant in C+ & C2+. Williams et al. (2015) presented O abundance determinations in WC9 stars, based on cmfgen model atmosphere analyses of optical spectra, obtaining 2-4% by mass).
A more straightforward indicator of elemental abundance is provided by forbidden fine-structure lines which originate at low electron densities, corresponding to very large radii , where is the radius with Rosseland optical depth . The flux in these lines is directly proportional to the fractional abundance () of the emitting ionic species (Barlow et al., 1988). However, this method requires knowledge of the mass-loss properties and ionization structure. This approach has been adapted for clumped winds by Dessart et al. (2000), who use mid-IR ISO SWS spectroscopy of neon and sulphur lines to calculate ionic abundances of these elements in WC stars (see also Morris et al., 2000). The mid-IR Spitzer IRS spectrograph has also been used to study ionic abundances in WN and WC stars (Morris et al., 2004; Crowther et al., 2006).
Fine splitting in the ground state of generates the [OIII]m () forbidden fine-structure line. With a critical density111 is the density at which an energy level is depopulated equally by collisions and spontaneous emission (Osterbrock & Ferland, 2006). of (Rubin, 1989), this line is expected to originate from radii of a few in WC stars. Herschel’s Photoconductor Array Camera and Spectrometer (PACS) permits observation of Galactic WC stars at [OIII]m, from which we aim to provide an independent oxygen abundance.
This paper is focused on [O iii] 88.4m PACS observations of Vel (WR11, HD 68273)222This system is commonly referred to as Vel, but at V=1.83 mag, is significantly brighter than Vel (HD 68243), another early-type binary with V=4.17 mag, so we favour Vel or Vel A for the WR+O system. At an interferometric distance of 336 pc (North et al., 2007; van Leeuwen, 2007), this is comfortably the closest Wolf-Rayet star (Rate & Crowther, 2020). Vel is a WC8+O binary system with a 78.5 day (Niemela & Sahade, 1980), moderately eccentric orbit (North et al., 2007). It has been extensively studied across the electromagnetic spectrum including X-rays (Skinner et al., 2001; Schild et al., 2004), UV (Stecher, 1970; St.-Louis et al., 1993), optical (Schmutz et al., 1997), near-infrared (Aitken et al., 1982), mid-infrared (Barlow et al., 1988; van der Hucht et al., 1996) and mm/radio (Seaquist, 1976; Williams et al., 1990; Chapman et al., 1999). De Marco & Schmutz (1999) and De Marco et al. (2000) have determined dynamical masses for its components of 30 (O) and 9 (WC8), adopting the original Hipparcos distance of 258 pc (Schaerer et al., 1997; de Zeeuw et al., 1999). Its age is 5.51 Myr (Eldridge, 2009) and is located within a self-named stellar cluster within the Vela OB2 association (Jeffries et al., 2009; Jeffries et al., 2017; Franciosini et al., 2018).
In order to determine the oxygen abundance from fine-structure lines, it is necessary to determine the outer WC wind properties. It is firmly established that the inner winds () of hot, luminous stars are clumped, likely as a consequence of intrinsic instability in the line driving mechanism (Owocki & Rybicki, 1984). This explains many observational features unaccounted for by homogeneous wind models, such as the strength of electron scattering wings in WR spectra (Hillier, 1991). For WR stars, consistency with observations has most commonly been found for inner wind clumping with volume filling factor (Morris et al., 2000; Kurosawa et al., 2002). However, the radial extent to which clumping persists and whether the filling factor remains constant is unknown, but there is both theoretical and observational evidence to suggest that it varies with radius.
Runacres & Owocki (2002) performed 1D simulations of a line-driven hot-star wind out to . A highly structured wind is generated, consisting of strong reverse shocks and weaker forward shocks confining high density regions, separated by high-speed rarefied material. They find that collisions of these dense regions allow structure to persist up to the largest radii considered, with the so-called clumping factor () rising to a maximum of around and falling to at and beyond . As an extension to these simulations, Runacres & Owocki (2005) take advantage of the diminishing radiative force beyond to analyse the evolution wind structure out to in a purely hydrodynamical sense. Once again, persistent structure is seen out to the largest radii, characterised by a clumping factor ) between . Sundqvist et al. (2018) extend simulations to 2D, revealing somewhat lower clumping factors.
Variations in wind clumping are also observationally based, by the discrepancy in mass-loss rates derived using diagnostics originating from different depths in a stellar wind. For example, Puls et al. (2006) reveal a factor of two difference between H derived () and radio derived () in O supergiants under the assumption of constant clumping factor, implying a lower clumping factor in the radio emitting region. Najarro et al. (2011) utilised mid-IR spectroscopy of O stars to quantify the radial dependence of clumping, obtaining = 0.17 for Pup (O4 If) at , while Rubio-Díez et al. (2022) favour volume filling factors of = 0.25–0.5 for OB supergiants from far-IR photometry.
In Section 2 we provide details of the observational datasets used. Section 3 details a spectroscopic analysis of Vel including fits to mid- and far-IR fine structure lines of oxygen, neon and sulphur. We summarise the analytical method of Barlow et al. (1988) in Section 4 and apply this to Vel in order to calculate oxygen, neon and sulphur abundances, informed by our spectroscopic analysis. Comparisons between our derived oxygen abundance and evolutionary predictions are provided in Section 5 and brief conclusions are drawn.
2 Observations
2.1 Herschel PACS spectroscopy
Vel was observed with the Photodetector Array Camera and Spectrometer (PACS, Poglitsch et al., 2010) instrument on-board the Herschel Space Telescope on 7 Dec 2012 in spectroscopy mode (P.I. Crowther). PACS images a field of view of , resolved into a grid of 5 spectroscopic pixels, or ‘spaxels’, each spanning 9.4. This field of view is rearranged via an image slicer onto two Ge:Ga detector arrays, providing simultaneous first order (1000–2000) and second order (1500-3000) spectroscopy.
Scans totalling 2 383 s covering 86.2–90.1µm with high spectral sampling density were carried out for Vel. This wavelength range corresponds to kms-1. The 88m line was observed in second order (2500) in chopping/nodding mode with a small chopper throw, and an additional window was simultaneously observed at m in first order. The first (second) order datasets were reduced using Herschel Interactive Processing Environment (HIPE) 10.0.1496 (10.0.1297) and calibration set 45. We apply standard point source corrections (PSC) to the central spaxel in both instances, but prefer the integral over the central 9 spaxels for the second order dataset (excluding PSC correction) as discussed below.
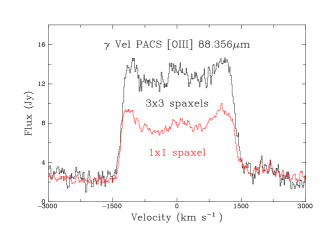
For our adopted distance of 336 pc to Vel, the spaxel scale of PACS corresponds to 3000 AU. The critical density of 88m occurs at a radius of ( 2000 AU) for (Section 3). Therefore, the physical scale of the emitting region, may be resolvable by PACS for Vel. Indeed, in Figure 1 we show the PACS scan, revealing 88.4m line emission extending beyond the central spaxel, confirming the physical extension of the emitting region as spaxels, i.e, 4500 AU. The total [O iii] 88.4m line flux is erg s-1 cm-2, accounting for the 15% absolute flux calibration uncertainties of PACS333https://www.cosmos.esa.int/documents/12133/996891/PACS+Explanatory+Supplement. It also displays a measurable continuum flux, both adjacent to [O iii] in second order (2.40.6 Jy) and at m in first order (1.50.3 Jy). As anticipated, no spectral features are detected in first order. Roche et al. (2012) have previously spatially resolved the outer wind of Vel from ground-based mid-IR observations of [S iv] and [Ne ii] fine structure lines.
Forbidden fine-structure lines provide the most direct means of measuring terminal wind velocities in WR stars, as they originate entirely from the asymptotically flowing region of the stellar wind (Barlow et al., 1988). Since the line is optically thin, it is expected to have a flat-topped and rectangular profile. [O iii] 88.4m exhibits structure within the flat-topped profile, although this is reminiscent of [Ne iii] 15.5m observations of Vel from ISO-SWS (Dessart et al., 2000). The full width of the emission line should therefore correspond to twice . However, in reality, the line profile will be modified by the instrumental profile, making emission lines slightly non-rectangular. We adopt the Full Width at Zero Intensity (FWZI) as twice . We obtain = 150020 km s-1 from [O iii] 88.36m, in good agreement with previous fine-structure (Barlow et al., 1988), near-IR (Eenens & Williams, 1994) and UV (Prinja et al., 1990) velocities of 1520 km s-1, 1450 km s-1 and 1460 km s-1, respectively, the latter obtained from the blue absorption edge of the UV P Cygni Civ 1550Å profile.

2.2 Archival UV/optical spectroscopy
Extensive archival UV/optical spectroscopy of Vel exists, including Copernicus (Johnson, 1978), IUE (St.-Louis et al., 1993) and ESO 0.5m HEROS (Schmutz et al., 1997). Copernicus far-UV and near-UV spectroscopy covers 946–3175 at a resolution of 0.2–0.4Å, while high resolution IUE spectroscopy with the SWP and LWR cameras cover 1150–3300Å. We have utilised calibrated IUE observations at phase 0.5 (St.-Louis et al., 1993), plus far-UV Copernicus U2 spectroscopy from March 1977, although no official flux calibration exists for the latter. The H i column density towards Vel is i) = 19.8 cm-2 according to Bohlin (1975) and York & Rogerson (1976).
In the optical, Aller & Faulkner (1964) discuss the optical morphology of Vel. We use phase-averaged ESO 0.5m HEROS spectroscopy covering 0.35–0.55m and 0.58–0.86m (Schmutz et al., 1997; De Marco & Schmutz, 1999). Since these were not flux calibrated, we utilise relative intensities of optical emission lines from Aller & Faulkner (1964) to produce a relatively calibrated optical spectrum for the 0.4–0.55m HEROS dataset, which is put on an absolute scale via narrow band magnitudes =1.42 and =1.70 (De Marco et al., 2000). Violet and red HEROS dataset is anchored to the composite continua of the O+WC8 model. We prefer narrow-band filter optical magnitudes to standard broad-band photometry (Johnson et al., 1966) owing to emission line contamination of the latter. Since HEROS coverage excludes the C iii 5696 and C iv 5808 classification lines, we note = 1.4 according to Aller & Faulkner (1964).
Since Vel is a binary system, we adopt a flux ratio of (O)/(WC8) = 3.61 following De Marco et al. (2000), i.e. (WC8) –(O) = +1.39 mag. Using our adopted distance modulus (7.63 mag) and extinction of EB-V = 0.09 mag imply a systemic absolute magnitude of = –6.24 mag, with (O) = –5.97 mag and (WC8) = –4.58 mag. The relative contribution of its constituents will vary with wavelength, with O to WR continuum light ratios of 3.7 at 0.5m and 1.0 at 2.0m (De Marco & Schmutz, 1999).
2.3 Archival IR spectroscopy
Barnes et al. (1974) and Aitken et al. (1982) present near-IR spectroscopy of Vel, supplemented by He i 1.083m spectroscopy from ESO’s New Technology Telescope (NTT)+EMMI (De Marco et al., 2000). IR photometry between 1–13m is obtained from average measurements by Williams et al. (1990), supplemented by bands 3–4 from WISE (Wright et al., 2010). ISO SWS (de Graauw et al., 1996) mid-IR spectroscopy covering 2.4–27.5m ( = 820–1700) includes a mix of inner wind and fine-structure lines and has been discussed by van der Hucht et al. (1996). ISO LWS (Clegg et al., 1996) far-IR spectroscopy (PI M.J. Barlow) obtained from the ISO archive444http://iso.esac.esa.int/ida/, cover 43–197m. Vel suffers from low S/N in the long wavelength SWS (30–45m) and short wavelength LWS (43–90m) channels of ISO. Nevertheless we have been able to use the average fluxed spectra of back and forth scans to identify several fine structure lines [O iii] 51.81m, 88.36m and [C ii] 157.7m, as shown in Fig. 2.
The ISO [Oiii] spectrum of Vel is very noisy, posing a problem for the measurement of line flux as the continuum level is difficult to determine. We measure the flux of this line in two ways; firstly using the FLUX command from the Starlink spectroscopic package dipso (Howarth et al., 2004) between the expected velocity limits after subtraction of a by-eye estimate of the continuum, and secondly by fitting a Gaussian profile to the line using dipso’s Emission Line Fitting (ELF) suite, after subtraction of a (2nd order) polynomial fit to the continuum. Although the emission line is expected to be flat-topped and highly non-Gaussian, this structure is lost in the noise, permitting us to employ Gaussian fitting as an approximation. From the FLUX method, multiple measurements give an average [O iii] 51.81m line flux of , and the Gaussian fit gives a compatible . We adopt a line flux of , incorporating 10% flux calibration uncertainties for ‘medium’ point sources (García-Lario, 2000).
The 84–93m region is covered by the first order of LW1 detector of ISO LWS, as well as second order of the SW5 detector. The standard data product adopts the higher resolution SW5 spectrum, but LW1 has significantly higher sensitivity permitting [O iii] 88.36m to be detected (Fig. 2). The integrated flux measured using dipso’s ELF package is , 20% higher than the Herschel PACS measurement. We favour the latter in our analysis owing to its improved S/N and order of magnitude improved spectral resolution. Finally, [C ii] 157.68m is prominent in the long wavelength LWS channel. This line has a flux of , although it is spectrally unresolved since its FWHM matches the ISO-LWS grating resolution of 260, so does not arise in the stellar wind (its critical density is cm-3).
3 Spectroscopic analysis
The detailed spectral analysis of the O and WC components in Vel by De Marco & Schmutz (1999) and De Marco et al. (2000) form the basis of our study. We utilise the non-LTE line-blanketed model atmosphere code cmfgen (Hillier & Miller, 1998) which solves the radiative transfer equation in the co-moving frame, subject to statistical and radiative equilibrium, assuming an expanding, spherically-symmetric, homogenous or clumped, time independent atmosphere. Line blanketing is treated correctly in the transfer problem except that a ‘super level’ approach is used, involving the combining of levels with similar energies and properties into a single super level.
| Star | log() | |||||||||||||||||||
|---|---|---|---|---|---|---|---|---|---|---|---|---|---|---|---|---|---|---|---|---|
| kK | kK | cm s-2 | km s-1 | yr-1 | mag | % | % | % | % | % | % | % | ||||||||
| WC8 | 90 | 47.5 | 1.9 | 4.85 | 5.31 | 1420 | 4.5 | 0.1 | 0.5 | 0.5 | –4.6 | 0 | 67 | 30 | 0 | 1.1 | 1.7 | 0.04 | 0.1 | |
| O7.5 III | 35.1 | 35.0 | 16.2 | 3.47 | 5.56 | 2500 | 2.0 | — 1.0 — | –6.0 | 70 | 28 | 0.3 | 0.1 | 1 | 0.2 | 0.04 | 0.1 | |||
3.1 O star
For the O star component of Vel we include the following elements: H, He, C, N, O, Ne, Na, Mg, Al, Si, P, S, Ca, Fe, Ni, with standard Milky Way abundances. We adjust the physical parameters obtained by De Marco & Schmutz (1999) to the modern distance of 336 pc, but otherwise do not attempt to revise its solution, since our focus is on the outer wind of the WC star. Nevertheless, we note that the composite WC+O HEROS spectroscopy favours a high rotation rate of 350 km s-1 for the O star from comparison with He i 4471 (Schmutz et al., 1997, their fig. 5), somewhat higher than the previous estimate of 220 km s-1 (Baade et al., 1990). High rotation velocities are expected for the mass gainer in a post-mass transfer system (de Mink et al., 2013). We use a hydrostatic solution at depth, together with a standard = 1 law for the wind, and adopt a smooth wind (the IR energy distribution of Vel is dominated by the WC component). The outer boundary of the O star model is set at 200 , corresponding to cm-3 and = 9500 K. Physical and wind properties are summarised in Table 1.
3.2 WC8 star
For the WC component of Vel we include the following elements: He, C, O, Ne, Si, S, Ar, Ca, Fe, Ni. Intermediate mass elements (Ar, Ca) are included since they have a strong influence on the extreme UV blanketing (complementing Fe, Ni) which affects the strength of key optical diagnostics including C iii 5696, such that higher temperatures are necessary to reproduce optical diagnostic lines (C iii 5696, C iv 5801-12) with respect to previous studies (De Marco et al., 2000).
For the velocity law, we use a hydrostatic solution at depth, together with a standard = 1 for the outer wind. We adopt a turbulent velocity of 100 km s-1, requiring = 1420 km s-1 in order to reproduce the mid-IR fine structure lines. The emerging consensus is that clumping persists to large radii (at least ) in a line-driven wind, characterised by a clumping (volume filling) factor which disperses to a minimum of () according to Runacres & Owocki (2005); Rubio-Díez et al. (2022). Consequently we adopt a non-standard radially dependent volume filling factor of the form
adopting = 0.1, = 200 km s-1, = 100 km s-1 and = 0.5 to ensure that the volume filling factor is 0.1 for the inner wind, and 0.5 in the extreme outer wind where the [O iii] fine structure line originates in Vel.
To investigate the physical conditions found in the [O iii] 88.4m formation region of Vel, we computed a cmfgen model atmosphere which extends to , i.e. spanning , requiring a significantly larger number of depth points (111) with respect to standard calculations (50) which extend to several hundred radii. The large outer boundary necessitates adiabatic cooling, with densities closely approximating those of the ambient interstellar medium. In order to mitigate against vanishingly small populations of high ionization stages in the outer wind, we include X-rays. We consider the impact of on elemental abundances in Section. 4.1.
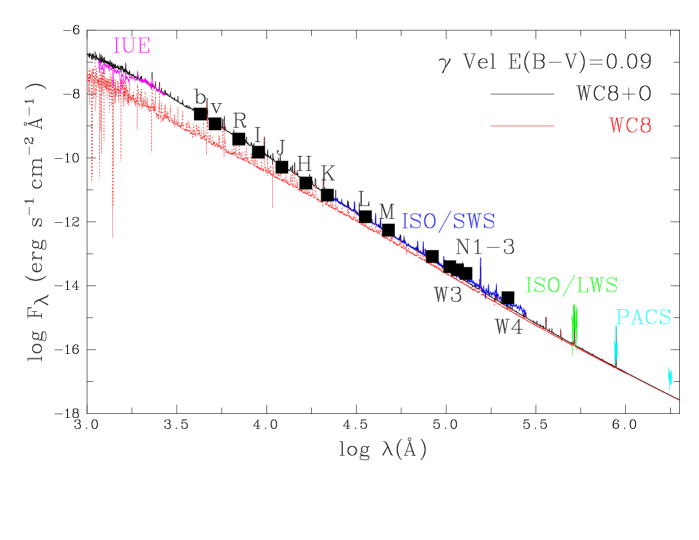
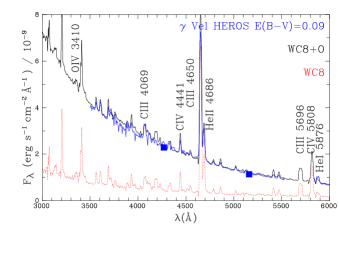
We have undertaken an analysis of the WC8 component of Vel, updated from De Marco et al. (2000) which was based on the He i 5876, 10830, He,ii 4686, 5411 and C iii 6727–73, C iv 5411 diagnostics, but adjust our solution to the revised (higher) distance. The dereddened spectral energy distribution of Vel from IUE, ISO SWS+LWS and Herschel PACS is compared to the theoretical WC8+O model for our adopted light ratio in Fig. 3. The WC8+O model reproduces observations well up to 10m, but thereafter falls below spectrophotometric data.
Our spectroscopic luminosity, = 5.3 infers a mass of (Schaerer & Maeder, 1992) somewhat higher than the dynamically determined value of 9.00.6 from North et al. (2007), inferring = 5.180.05. We support the previous determination of C/He = 0.15 by number, based on He ii 5411 and C iv 5471, and consider the carbon-to-helium ratio to be relatively secure, i.e. . C/O = 5 by number was adopted by De Marco et al. (2000) since a determination of oxygen was not possible from weak/blended optical lines. Our revised physical and wind properties are derived based on the optical C iii-iv diagnostics, primarily C iii 4647–51, 5696, 6727–73, 8500, plus C iv 4441, 5471, 5801–12, 7724 plus He ii 4686. Low ionization lines including C ii 6578–83, 7231–37 and He i 5876 are somewhat underpredicted, as is He i 1.083m with respect to NTT-EMMI spectroscopy of De Marco et al. (2000).
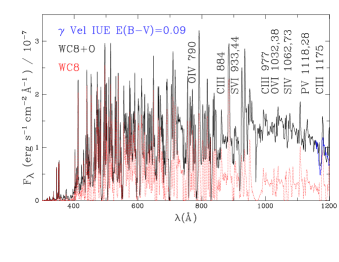
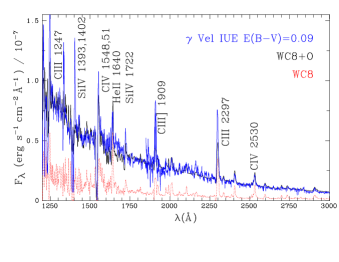
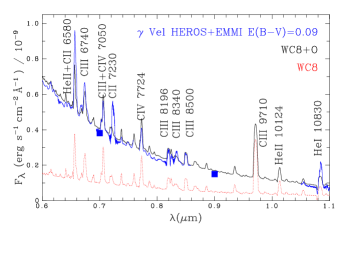
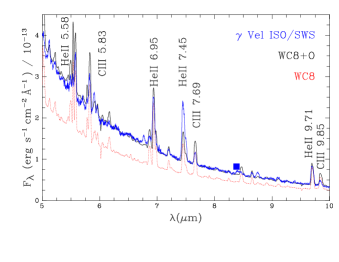
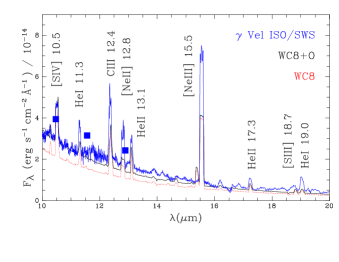
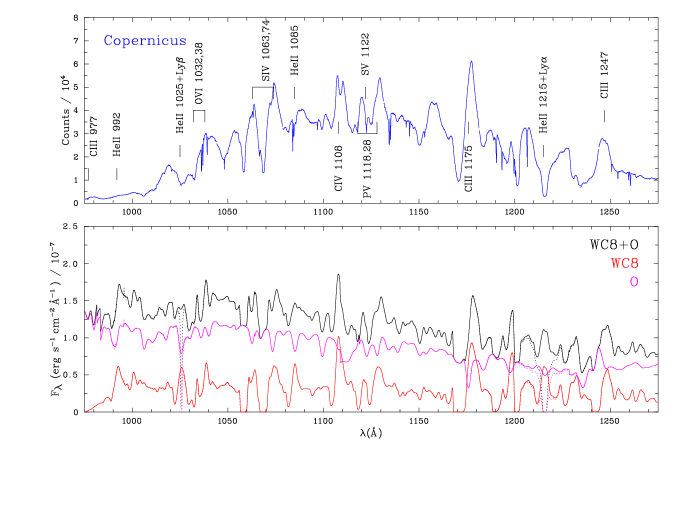
We present a comparison between our updated WC8 model and spectroscopic observations in Fig. 4, including the combined WC8+O7.5 III synthetic spectrum, using parameters for the O star companion updated from De Marco & Schmutz (1999) to reflect the revised distance. We include a comparison with 975-1275 Copernicus U2 spectroscopy from March 1977 in the Appendix (Fig. 10). In the ultraviolet, the overall spectral energy distribution is well reproduced – iron blanketing in the O star produces the broad dip between 1500–1700Å. Some of the prominent lines in the UV are matched satisfactorily (e.g. Si iv 1722) with respect to Copernicus and IUE spectroscopy, although others are poorly reproduced (C iii] 1909, C iii 2297) noting the complex orbital phase dependence of UV resonance lines (St.-Louis et al., 1993).
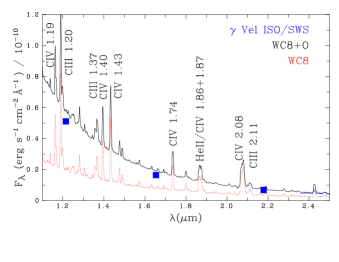
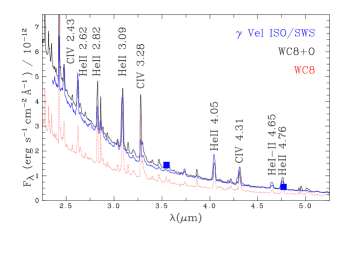
The predicted near-IR spectrum of Vel compares qualitatively well with published near-IR spectroscopy, including C iii 0.97m, C iv 2.08m (Barnes et al., 1974; Aitken et al., 1982). The synthetic spectrum provides a reasonable match to C iv lines within the 2.4–5m ISO-SWS range, although strong He ii lines at 4.05m (10–8) and 4.65m (14–10) are underpredicted. Beyond 5m, the overall emission line spectrum is rather too weak with respect to ISO-SWS observations, especially for He ii 7.45m (6–5), C iii 12.4m (14–13), and He ii 19.4m (16-14). Overall, the C iii-iv spectrum of Vel is reproduced significantly better than De Marco et al. (2000), albeit with He i less satisfactory.
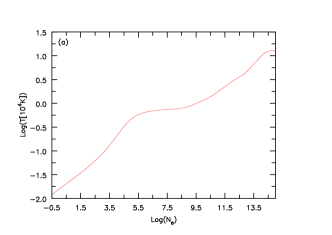
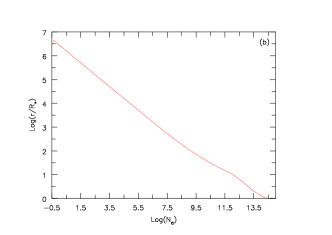
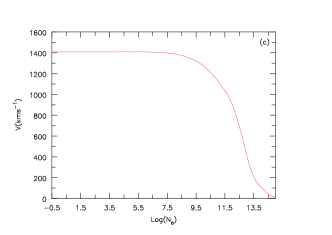
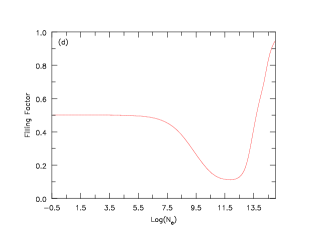
We show the resulting wind properties as a function of electron density in Figure 5. Optical emission lines form within the dense inner wind (), where the temperature is several K (Hillier, 1989; Hillier & Miller, 1999). Strong metal line cooling leads to a relatively low wind temperature of = 7 000 K for intermediate densities (), corresponding to . In the extreme outer wind beyond , and K. Fig. 5 also shows the wind velocity and volume filling factor of this model, the latter corresponding to =0.1 for the optical lines and =0.5 for the IR fine structure lines.
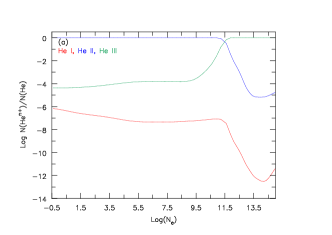
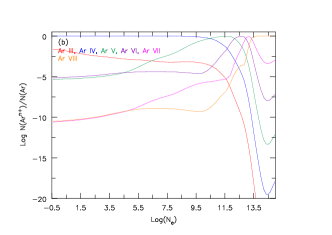
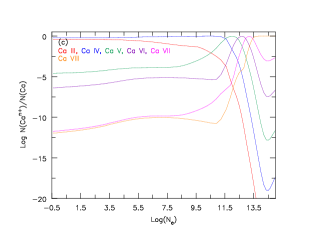
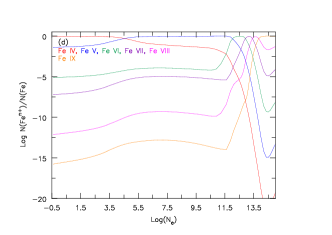
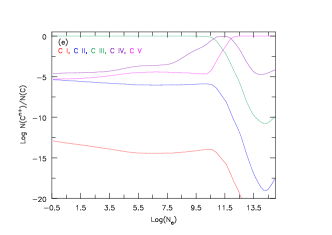
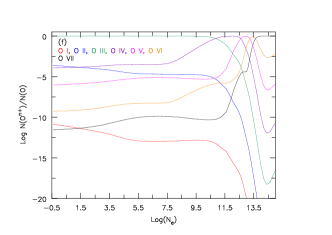
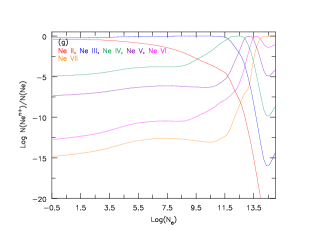
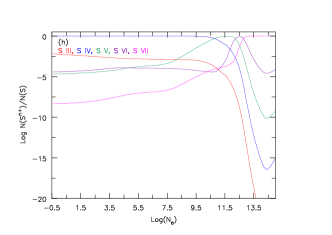
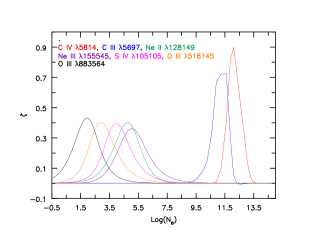
The density dependence of ionisation for carbon, oxygen, neon and sulphur, as predicted by this cmfgen model for the WC8 star, is shown in Figure 5. C2+, O2+, S+3+ and Ne2+ are predicted to be the dominant ionisation stages of carbon, oxygen, sulphur and neon in the outer wind at , corresponding to the fine-structure line forming regions of neon and sulphur, with O2+ predicted to remain the dominant ion of oxygen in the extreme outer wind, where [O iii] fine structure lines originate, as illustrated in Fig. 6. Additional elements are presented in the Appendix (Fig. 11). He+ remains the dominant ion of helium for all densities below , while the dominant ions of argon and calcium in the outer wind are Ar3+ and Ca3+, with iron transitioning from Fe4+ to Fe3+ at .
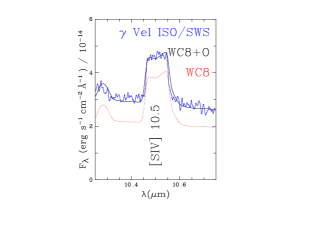
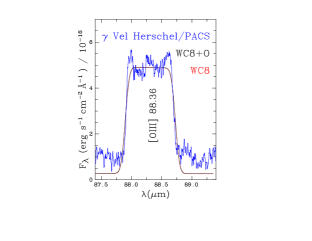
Fig. 7 reveals satisfactory fits to [S iv] 10.5m and [O iii] 88.4m for mass fractions of 0.04%, 1.0%, respectively, plus both [Ne ii] 12.8m and [Ne iii] 15.5m for an adopted mass fraction of 1.7%. Consequently, we can be confident with the inferred oxygen, neon and sulphur abundances (for our adopted wind clumping). [Ne ii], [Ne iii] and [O iii] fine structure lines show central subpeaks together with additional peaks at 1000 km s-1. This structure contrasts with flat topped predictions from cmfgen in Fig. 7.
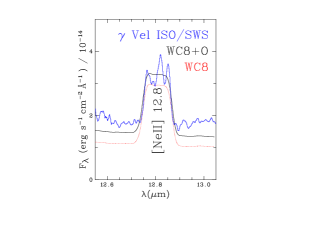
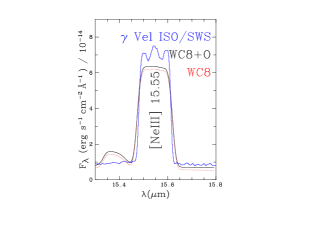
The origin for this structure may be linked with the binary nature of Vel, specifically the colliding wind region between the WC8 and O star components. The wind momentum of the WC8 component exceeds the O star by a factor of 30, so the O star wind will be strongly confined. Nevertheless the post-shock region of the colliding winds may contribute to the observed emission. Recent James Webb Space Telescope (JWST) MIRI imaging of the long period WC7+O binary system WR 140 reveal nested rings of dust emission (Lau et al., 2022), suggesting that a relic of its colliding winds persist to large radii. Curiously, subpeak structure is not apparent for [S iv] in Vel, but would be expected from its overlapping line formation region to [Ne ii-iii] (recall Fig. 6). Subpeaks are observed in [O iii] for other binary and single WC stars (Crowther, priv. comm.), so the origin of sub-peak structures remains uncertain.
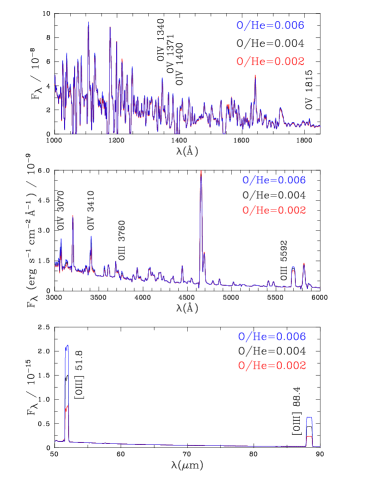
Fig. 8 compares three synthetic WC8 models in the ultraviolet, visual and far-IR with O/He = 0.002, 0.004, 0.006 by number. These illustrate the clear correlation between oxygen abundance and [O iii] 52m, 88m strength in contrast to the few oxygen lines in the UV/optical. We will revisit our inferred abundances in Sect. 4, but favour an oxygen abundance of 1% by mass for Vel from our cmfgen analysis, which is compared to evolutionary predictions in Sect. 5.
4 Vel abundances from fine structure lines
4.1 Oxygen
We are able to independently calculate the fractional ionic abundance of O2+ from the [O iii]m fine structure line following the approach of Barlow et al. (1988), modified by Dessart et al. (2000) to incorporate wind clumping. This method was originally devised to measure ionic neon abundances in Vel, and involves the [O iii] line flux (from Section 2) and adopted wind properties (informed from Section 3).
| Transition | ||||||
|---|---|---|---|---|---|---|
| m | (s-1) | 1 000K | 8 000 K | |||
| 51.814 | 5 | 3 | 1.12 | 3.5 | ||
| 88.356 | 3 | 1 | 0.52 | 2.7 |
The following abundance determination is applicable to an emission line formed by electronic transition between two fine-structure energy levels ( and ), occurring in the asymptotic region of a clumpy stellar wind, where material is on average flowing at a velocity following a density distribution. If a flux is observed in the fine structure line of a star residing at a distance , the total power emitted by the star in this line is
| (1) |
where is the energy of a transition with probability () of occurrence, is the density of ions in the upper level, and is the volume filling factor in the [O iii] line-forming region. The incorporation of this clumping factor is a modification to the original method of Barlow et al. (1988).
The density of ions in the upper level can alternatively be expressed as
| (2) |
where is the species ion density, of which a fraction is in the upper level. Following Dessart et al. (2000) we use values of calculated by solving the equations of statistical equilibrium for the O2+ ion, using the equib code (Howarth et al., 2016), at electron densities over the range to , and electron temperatures = 1 000 to 10 000 K, for the collisional and radiative atomic data presented in Table 2.
Knowledge of the mass-loss rate and terminal wind speed become important when determining . These properties are combined in the mass-loss parameter (Barlow et al., 1988, equation 8) so that
| (3) |
where is the fraction of all ions that are species (i.e., , the desired result). Combining equations 1 and 3, the filling factor cancels and we are left with
| (4) |
At this point we follow Dessart et al. (2000) by integrating over electron density, , removing the dependency of on A (and hence ) and filling factor.
| ID | Flux | Instrument | Ref | /He | |||
|---|---|---|---|---|---|---|---|
| m | erg s-1 cm-2 | K | 10-4 | 10-4 | |||
| 10.5 | [S iv] | 151 | ISO SWS | a | 2 000 | ||
| 12.8 | [Ne ii] | 181 | ISO SWS | a | 5 000 | ||
| 15.5 | [Ne iii] | 821 | ISO SWS | a | 5 000 | ||
| 51.8 | [O iii] | 81 | ISO LWS | b | 1 000 | ||
| 88.4 | [O iii] | 3.40.5 | Herschel PACS | b | 1 000 |
a: Dessart et al. (2000); b: this work
Converting the integral in equation 4 to one over and re-arranging for the fractional ionic abundance, one obtains
| (5) |
where
| (6) |
Equation 5 is ultimately what we use to calculate ) which is presented in Table 3, with the relevant atomic data used for their calculation given in Table 2, adopting = 1 000 K. , corresponds to = or = 1.0% by mass, assuming O2+ is the dominant ion in the line forming region of [O iii]m ().
The primary parameter affecting in Vel is wind clumping, which as discussed in Section 3, is assumed to persist in the extreme outer winds of WC stars with a volume filling factor . To quantify the effect of this uncertainty, we evaluate at the extremes of this range, with mass-loss rates fixed at the values derived using .
An alternative line is available, namely [O iii]m from ISO-LWS (Fig. 2). This line has a critical density an order of magnitude higher than [O iii] 88.4m (recall Table 2) as illustrated in Fig. 6. If the ionic state of oxygen were to substantially change in the extreme outer wind one would derive different values of using [Oiii] and [O iii], even though this is not predicted from our cmfgen model (Fig. 5). We derive = from [O iii] 51.81m. This corresponds to = or = % by mass, and is in reasonable agreement with that obtained from the Herschel PACS observations (Table 3), despite the low quality of the ISO/LWS spectroscopy.
Fine-structure lines of different ionisation stages of the same atomic species provide the best probes of ionisation structure. Unfortunately the ground state configuration of does not provide a suitable transition, whereas the extent of may be probed using [O iv] (). This line has a critical density of , so would be formed interior to both [O iii] lines considered thus far. This line is not detected in ISO SWS spectroscopy of Vel (van der Hucht et al., 1996), or indeed Spitzer IRS scans of other late WC stars (Crowther, priv comm), suggesting that contributes negligibly to the outer wind of Vel. Overall, fine structure lines of oxygen support the predicted outer wind structure of Vel presented in Figure 5.
4.2 Neon and sulphur
We now consider fine-structure lines of other elements, namely neon ([Ne ii] 12.8m, [Ne iii] 15.5m) and sulphur ([S iv] 10.5m) from ISO-SWS (van der Hucht et al., 1996; Dessart et al., 2000). [S iii] 18.7m is blended with C iii 18.8m (16–15) and He i 18.6m (3d 3D - 3P∘) so its detection is tentative. [Ne iii] 36.0m lies in the low sensitivity band 4 of ISO’s SWS instrument (de Graauw et al., 1996), so is not measurable. One would expect 0.04 at = 5 000 K and cm-3 from equib (Howarth et al., 2016), i.e. erg s-1 cm-2. There is no evidence for either [Ar ii] 6.98m or [Ar iii] 8.99m in ISO-SWS spectroscopy of Vel, as expected from the predicted cmfgen ionization balance structure of argon which suggests Ar3+ is the dominant ion in the outer wind (Fig. 11). Ignace et al. (2001) discuss [Ca iv] 3.21m for a sample of WR stars including Vel. However, it is clear that C iii 3.20m (14–11) dominates the observed feature (their fig. 1) in the case of Vel.
Using the method introduced above, together with atomic data from Dessart et al. (2000) (their Table 9), we use these S and Ne line flux measurements to reassess the fractional abundances of the respective ionic species in Vel. These are included in Table 3 and provide an independent insight into the empirical ionisation balance in the outer wind versus predictions (Fig. 6) in which [Ne ii] 12.8m and [Ne iii] 15.5m form at 5,000 K) and [S iv] 10.5m forms at 2,000 K).
For neon, the dominant fine structure line is [Ne iii] 15.5m, from which or % by mass ( 5,000 K is adopted), consistent with expectations for the products of the CNO cycle being converted to 22Ne. A neon abundance 25% larger is obtained by including Ne+ from [Ne ii] 12.8m, corresponding to %, in close agreement with our cmfgen modelling result of = 1.7%. Recall from Fig. 5 that Ne+ is (narrowly) the secondary ion of neon within its outer wind.
The inferred sulphur abundance is S/He = by number or 0.040.01% from [S iv] 10.5m, in good agreement with the cmfgen modelling ( 2 000 K is adopted for its line forming region). Our value is in close agreement with the solar value of (S/H) + 12 = 7.160.11 (Magg et al., 2022), which equates to % by mass, as expected for an unprocessed element. In principle it could be somewhat higher if there is a non-negligible contribution from S2+. Figure 5 includes the predicted ionization structure of the WC8 outer wind of sulphur, revealing that the dominant ionization stage of sulphur is predicted to be S3+, so one would expect [S iv] 10.5m to be dominant over [S iii] 18.7m, as is observed.
| Study | De Marco et al. | This work | ||
|---|---|---|---|---|
| Distance (pc) | 258 | 336 | ||
| /kK | 57 | 90 | ||
| 5.0 | 5.31 | |||
| 3.2 | 1.9 | |||
| –5.0 | –4.84 | |||
| (km s-1) | 1550 | 150020 | ||
| (ph s-1) | 48.81 | 49.09 | ||
| (ph s-1) | 47.76 | 48.12 | ||
| C/He () | 0.15 | (28%) | 0.150.02 | (303%) |
| O/He () | 0.03a | (8%a) | (1.0%) | |
| Ne/He () | ‡0.003 | (‡1%) | (%) | |
| S/He () | (‡0.03%) | (0.040.01%) | ||
:O/C=0.2 by number adopted; : Dessart et al. (2000)
5 Discussion and conclusions
Vel is a well known binary system, with a period of 78.5 days (Niemela & Sahade, 1980) and eccentricity of 0.33 (North et al., 2007), from which component masses of 28.51.1 (O7.5 III) and 9.00.6 (WC8) have been established. Binary interaction is capable of drastically altering the evolution of a massive star via mass and angular momentum exchange. It is likely that the WC8 component of Vel has undergone Case B mass-transfer with its O-star companion (Eldridge, 2009), indicating a deviation from single-star evolution. We compare our physical and wind properties of the WC8 component of Vel with previous results of De Marco et al. (2000) in Table 5. Revised values follow from a combination of the modern interferometric distance to Vel, improved treatment of line blanketing – De Marco et al. (2000) solely considered Ca and Fe amongst intermediate and heavy elements – and the availability of fine structure observations of oxygen courtesy of Herschel.
We have directly measured the oxygen abundance within the wind of Vel from far-IR fine structure lines of [O iii] using two complementary approaches, detailed spectroscopic analysis with the cmfgen model atmosphere code ( 1.1%), and following the analytic method devised by Barlow et al. (1988) and updated by Dessart et al. (2000) (0.3%), Oxygen is overwhelmingly in the form of O2+ in the outer wind of Vel. Uncertain nuclear burning rates may be constrained by these quantities, as the balance between carbon and oxygen in massive stars is solely determined by the competition of and processes, the latter of which remains uncertain (Buchmann & Barnes, 2006).
| Rates | |||||||
|---|---|---|---|---|---|---|---|
| Myr | % | % | % | % | |||
| 5.58 | 9.1 | 5.21 | 64.9 | 29.2 | 3.5 | 1.9 | Angulo et al. (1999) |
| 5.57 | 9.2 | 5.23 | 66.4 | 29.9 | 1.3 | 1.9 | Kunz et al. (2002) |
| 5.57 | 9.2 | 5.23 | 66.6 | 30.0 | 1.0 | 1.9 | Kunz et al. (2002) 0.75 |
| 5.31 | 67 | 30 | 1.0 | 2.0 |
The importance of the reaction rate in determining nucleosynthetic yields has been investigated by Imbriani et al. (2001), who model the evolution a star using historical cross sections for this reaction (Caughlan et al., 1985; Caughlan & Fowler, 1988). They find that a doubling of the reaction rate in this case halves the carbon mass fraction at the end of helium burning, corresponding to a higher O/C ratio in the star as a whole. These authors conclude that the higher of their two considered reaction rates provides better agreement with the solar abundance pattern, in agreement with the earlier work of Weaver & Woosley (1993). It is these studies that have motivated the choice of reaction rates used in many contemporary models of stellar evolution.
However, this preference for a higher reaction rate is at odds with the oxygen abundances presented here. A similar issue has been noted by Aadland et al. (2022) for LMC WO stars. They provided predictions from the Geneva evolutionary model based on the NACRE reaction rates and NACRE rates divided by a factor of 3 (their fig. 18), which suppress the production of oxygen with respect to carbon. Aadland et al. (2022) also present BPASS models using Kunz et al. (2002) rates plus these rates scaled by 0.75, quantitatively in better agreement with our results.
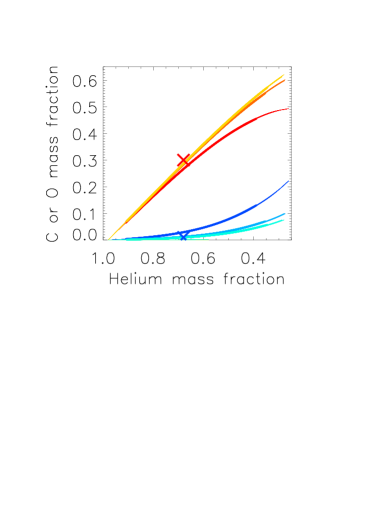
In Figure 9 we show C and O mass fractions versus He for BPASS v2.4 binary evolution models (Eldridge et al., 2017) tailored for Vel. These involve a 35–40 M⊙ primary, = 0.5–0.9 and log /days) = 1–2 at solar metallicity (Eldridge, 2009). reaction rates are from NACRE (Angulo et al., 1999), Kunz et al. (2002) and the latter scaled by 0.75 (Aadland et al., 2022). Table 5 provides a summary of predictions for different reaction rates for a 35 primary once =0.45 (by mass) at the stellar surface. The dynamical mass of the WC8 component from North et al. (2007) is well matched for this combination of initial parameters. Our spectroscopic luminosity is a little higher, favouring a slightly higher initial (current) mass, implying a lower system age (5 Myr).
From Fig. 9 and Table 5 it is apparent that either the standard or scaled Kunz et al. (2002) reaction rates are favoured by our results for Vel, although it is not possible to exclude modest revisions in view of uncertainties in volume filling factors. Predicted neon abundances are also in excellent agreement with our empirical results from mid-IR fine structure lines ( = %), as anticipated for CNO nuclei processed into 14N during H burning, subsequently converted to 22Ne via the reaction. The inferred sulphur abundance from mid-IR fine-structure diagnostics ( = 0.040.01%) is in excellent agreement with the solar value (Magg et al., 2022).
In conclusion, we have presented successful modelling of IR fine structure lines of Vel with cmfgen, together with the complementary approach of Barlow et al. (1988) and Dessart et al. (2000), suggesting oxygen and neon determinations from similar analyses of other WC (and WO) stars is realistic based on archival Herschel-PACS and Spitzer-IRAC spectroscopy, plus potentially JWST-MIRI spectroscopy of sources too faint for previous IR missions.
Acknowledgements
Thanks to Chris Rosslowe who performed initial measurements of Herschel PACS spectroscopy of WC and WO stars. Thanks to Jan J Eldridge for providing bespoke Binary Population and Spectral Synthesis (BPASS) models (v2.4) appropriate for Vel. See Eldridge et al. (2017, v2.1), Stanway & Eldridge (2018, v2.2) and Byrne et al. (2022, v2.3) for a description of previous BPASS versions. Thanks to Alex Fullerton for converting archival Copernicus spectroscopy of Vel into a user friendly format. Comments from the anonymous referee helped to improve the manuscript. PAC and JMB are supported by the Science and Technology Facilities Council research grant ST/V000853/1 (PI. V. Dhillon). JDH acknowledges support from STScI theory grant HST-AR-16131.001-A. PR thanks the European Space Agency (ESA) and the Belgian Federal Science Policy Office (BELSPO) or their support in the framework of the PRODEX Programme.
For the purpose of open access, the author has applied a Creative Commons Attribution (CC BY) license to any Author Accepted Manuscript version arising.
Data Availability
The Herschel PACS spectrum will be provided on request, while the CMFGEN model of the WC8 star will be made available at https://sites.pitt.edu/ hillier/web/CMFGEN.htm
References
- Aadland et al. (2022) Aadland E., Massey P., Hillier D. J., Morrell N. I., Neugent K. F., Eldridge J. J., 2022, ApJ, 931, 157
- Aitken et al. (1982) Aitken D. K., Roche P. F., Allen D. A., 1982, MNRAS, 200, 69P
- Aller & Faulkner (1964) Aller L. H., Faulkner D. J., 1964, ApJ, 140, 167
- Angulo et al. (1999) Angulo C., et al., 1999, Nuclear Phys. A, 656, 3
- Baade et al. (1990) Baade D., Schmutz W., van Kerkwijk M., 1990, A&A, 240, 105
- Barlow et al. (1988) Barlow M. J., Roche P. F., Aitken D. K., 1988, MNRAS, 232, 821
- Barnes et al. (1974) Barnes T. G., Lambert D. L., Potter A. E., 1974, ApJ, 187, 73
- Bohlin (1975) Bohlin R. C., 1975, ApJ, 200, 402
- Brinchmann et al. (2008) Brinchmann J., Kunth D., Durret F., 2008, A&A, 485, 657
- Buchmann & Barnes (2006) Buchmann L. R., Barnes C. A., 2006, Nuclear Phys. A, 777, 254
- Byrne et al. (2022) Byrne C. M., Stanway E. R., Eldridge J. J., McSwiney L., Townsend O. T., 2022, MNRAS, 512, 5329
- Caughlan & Fowler (1988) Caughlan G. R., Fowler W. A., 1988, Atomic Data and Nuclear Data Tables, 40, 283
- Caughlan et al. (1985) Caughlan G. R., Fowler W. A., Harris M. J., Zimmerman B. A., 1985, Atomic Data and Nuclear Data Tables, 32, 197
- Chapman et al. (1999) Chapman J. M., Leitherer C., Koribalski B., Bouter R., Storey M., 1999, ApJ, 518, 890
- Clegg et al. (1996) Clegg P. E., et al., 1996, A&A, 315, L38
- Crowther (2007) Crowther P. A., 2007, ARA&A, 45, 177
- Crowther et al. (2002) Crowther P. A., Dessart L., Hillier D. J., Abbott J. B., Fullerton A. W., 2002, A&A, 392, 653
- Crowther et al. (2006) Crowther P. A., Hadfield L. J., Clark J. S., Negueruela I., Vacca W. D., 2006, MNRAS, 372, 1407
- de Graauw et al. (1996) de Graauw T., et al., 1996, A&A, 315, L49
- De Marco & Schmutz (1999) De Marco O., Schmutz W., 1999, A&A, 345, 163
- De Marco et al. (2000) De Marco O., Schmutz W., Crowther P. A., Hillier D. J., Dessart L., de Koter A., Schweickhardt J., 2000, A&A, 358, 187
- de Mink et al. (2013) de Mink S. E., Langer N., Izzard R. G., Sana H., de Koter A., 2013, ApJ, 764, 166
- de Zeeuw et al. (1999) de Zeeuw P. T., Hoogerwerf R., de Bruijne J. H. J., Brown A. G. A., Blaauw A., 1999, AJ, 117, 354
- Dessart et al. (2000) Dessart L., Crowther P. A., Hillier D. J., Willis A. J., Morris P. W., van der Hucht K. A., 2000, MNRAS, 315, 407
- Eenens & Williams (1994) Eenens P. R. J., Williams P. M., 1994, MNRAS, 269, 1082
- Eldridge (2009) Eldridge J. J., 2009, MNRAS, 400, L20
- Eldridge et al. (2017) Eldridge J. J., Stanway E. R., Xiao L., McClelland L. A. S., Taylor G., Ng M., Greis S. M. L., Bray J. C., 2017, Publ. Astron. Soc. Australia, 34, e058
- Esteban et al. (1992) Esteban C., Vilchez J. M., Smith L. J., Clegg R. E. S., 1992, A&A, 259, 629
- Fowler (1984) Fowler W. A., 1984, Science, 226, 922
- Franciosini et al. (2018) Franciosini E., Sacco G. G., Jeffries R. D., Damiani F., Roccatagliata V., Fedele D., Randich S., 2018, A&A, 616, L12
- Fynbo et al. (2005) Fynbo H. O. U., et al., 2005, Nature, 433, 136
- García-Lario (2000) García-Lario P., 2000, in Salama A., Kessler M. F., Leech K., Schulz B., eds, ESA Special Publication Vol. 456, ISO Beyond the Peaks: The 2nd ISO Workshop on Analytical Spectroscopy. p. 267
- Gräfener et al. (2002) Gräfener G., Koesterke L., Hamann W.-R., 2002, A&A, 387, 244
- Hillier (1989) Hillier D. J., 1989, ApJ, 347, 392
- Hillier (1991) Hillier D. J., 1991, A&A, 247, 455
- Hillier & Miller (1998) Hillier D. J., Miller D. L., 1998, ApJ, 496, 407
- Hillier & Miller (1999) Hillier D. J., Miller D. L., 1999, ApJ, 519, 354
- Howarth et al. (2004) Howarth I. D., Murray J., Mills D., Berry D. S., 2004, Starlink User Note, 50
- Howarth et al. (2016) Howarth I. D., Adams S., Clegg R. E. S., Ruffle D. P., Liu X. W., Pritchet C. J., Ercolano B., 2016, EQUIB: Atomic level populations and line emissivities calculator, Astrophysics Source Code Library, record ascl:1603.005 (ascl:1603.005)
- Ignace et al. (2001) Ignace R., Cassinelli J. P., Quigley M., Babler B., 2001, ApJ, 558, 771
- Imbriani et al. (2001) Imbriani G., Limongi M., Gialanella L., Terrasi F., Straniero O., Chieffi A., 2001, ApJ, 558, 903
- Jeffries et al. (2009) Jeffries R. D., Naylor T., Walter F. M., Pozzo M. P., Devey C. R., 2009, MNRAS, 393, 538
- Jeffries et al. (2017) Jeffries R. D., et al., 2017, MNRAS, 464, 1456
- Johnson (1978) Johnson H. M., 1978, ApJS, 36, 217
- Johnson et al. (1966) Johnson H. L., Mitchell R. I., Iriarte B., Wisniewski W. Z., 1966, Communications of the Lunar and Planetary Laboratory, 4, 99
- Kunz et al. (2002) Kunz R., Fey M., Jaeger M., Mayer A., Hammer J. W., Staudt G., Harissopulos S., Paradellis T., 2002, ApJ, 567, 643
- Kurosawa et al. (2002) Kurosawa R., Hillier D. J., Pittard J. M., 2002, A&A, 388, 957
- Lau et al. (2022) Lau R. M., et al., 2022, Nature Astronomy, 6, 1308
- López-Sánchez & Esteban (2010) López-Sánchez Á. R., Esteban C., 2010, A&A, 517, A85
- Magg et al. (2022) Magg E., et al., 2022, A&A, 661, A140
- McLaughlin & Bell (2000) McLaughlin B. M., Bell K. L., 2000, Journal of Physics B Atomic Molecular Physics, 33, 597
- Meynet & Maeder (2005) Meynet G., Maeder A., 2005, A&A, 429, 581
- Morris et al. (2000) Morris P. W., van der Hucht K. A., Crowther P. A., Hillier D. J., Dessart L., Williams P. M., Willis A. J., 2000, A&A, 353, 624
- Morris et al. (2004) Morris P. W., Crowther P. A., Houck J. R., 2004, ApJS, 154, 413
- Najarro et al. (2011) Najarro F., Hanson M. M., Puls J., 2011, A&A, 535, A32
- Niemela & Sahade (1980) Niemela V. S., Sahade J., 1980, ApJ, 238, 244
- North et al. (2007) North J. R., Tuthill P. G., Tango W. J., Davis J., 2007, MNRAS, 377, 415
- Nussbaumer & Storey (1981) Nussbaumer H., Storey P. J., 1981, A&A, 99, 177
- Osterbrock & Ferland (2006) Osterbrock D. E., Ferland G. J., 2006, Astrophysics of Gaseous Nebulae and Active Galactic Nuclei, Sausilito, California: University Science Books
- Owocki & Rybicki (1984) Owocki S. P., Rybicki G. B., 1984, ApJ, 284, 337
- Poglitsch et al. (2010) Poglitsch A., et al., 2010, A&A, 518, L2
- Prinja et al. (1990) Prinja R. K., Barlow M. J., Howarth I. D., 1990, ApJ, 361, 607
- Puls et al. (2006) Puls J., Markova N., Scuderi S., Stanghellini C., Taranova O. G., Burnley A. W., Howarth I. D., 2006, A&A, 454, 625
- Rate & Crowther (2020) Rate G., Crowther P. A., 2020, MNRAS, 493, 1512
- Roche et al. (2012) Roche P. F., Colling M. D., Barlow M. J., 2012, MNRAS, 427, 581
- Rubin (1989) Rubin R. H., 1989, ApJS, 69, 897
- Rubio-Díez et al. (2022) Rubio-Díez M. M., Sundqvist J. O., Najarro F., Traficante A., Puls J., Calzoletti L., Figer D., 2022, A&A, 658, A61
- Runacres & Owocki (2002) Runacres M. C., Owocki S. P., 2002, A&A, 381, 1015
- Runacres & Owocki (2005) Runacres M. C., Owocki S. P., 2005, A&A, 429, 323
- Sander et al. (2012) Sander A., Hamann W.-R., Todt H., 2012, A&A, 540, A144
- Schaerer & Maeder (1992) Schaerer D., Maeder A., 1992, A&A, 263, 129
- Schaerer et al. (1997) Schaerer D., Schmutz W., Grenon M., 1997, ApJ, 484, L153
- Schild et al. (2004) Schild H., et al., 2004, A&A, 422, 177
- Schmutz et al. (1997) Schmutz W., et al., 1997, A&A, 328, 219
- Seaquist (1976) Seaquist E. R., 1976, ApJ, 203, L35
- Skinner et al. (2001) Skinner S. L., Güdel M., Schmutz W., Stevens I. R., 2001, ApJ, 558, L113
- St.-Louis et al. (1993) St.-Louis N., Willis A. J., Stevens I. R., 1993, ApJ, 415, 298
- Stanway & Eldridge (2018) Stanway E. R., Eldridge J. J., 2018, MNRAS, 479, 75
- Stecher (1970) Stecher T. P., 1970, ApJ, 159, 543
- Stock et al. (2011) Stock D. J., Barlow M. J., Wesson R., 2011, MNRAS, 418, 2532
- Storey et al. (2014) Storey P. J., Sochi T., Badnell N. R., 2014, MNRAS, 441, 3028
- Sundqvist et al. (2018) Sundqvist J. O., Owocki S. P., Puls J., 2018, A&A, 611, A17
- Tayal (2000) Tayal S. S., 2000, ApJ, 530, 1091
- van Leeuwen (2007) van Leeuwen F., 2007, A&A, 474, 653
- van der Hucht et al. (1996) van der Hucht K. A., et al., 1996, A&A, 315, L193
- Weaver & Woosley (1993) Weaver T. A., Woosley S. E., 1993, PhR, 227, 65
- Williams et al. (1990) Williams P. M., van der Hucht K. A., Sandell G., The P. S., 1990, MNRAS, 244, 101
- Williams et al. (2015) Williams P. M., Crowther P. A., van der Hucht K. A., 2015, MNRAS, 449, 1834
- Wright et al. (2010) Wright E. L., et al., 2010, AJ, 140, 1868
- York & Rogerson (1976) York D. G., Rogerson J. B. J., 1976, ApJ, 203, 378
Appendix A Far-UV spectroscopy of Vel
Appendix B Vel ionization structure