Newly Formed Dust within the Circumstellar Environment of SNIa-CSM 2018evt
Dust associated with various stellar sources in galaxies at all cosmic epochs remains a controversial topic, particularly whether supernovae (SNe) play an important role in dust production. We report evidence of dust formation in the cold, dense shell behind the ejecta-circumstellar medium (CSM) interaction in the Type Ia-CSM SN 2018evt three years after the explosion, characterized by a rise in the mid-infrared (MIR) emission accompanied by an accelerated decline in the optical radiation of the SN. Such a dust-formation picture is also corroborated by the concurrent evolution of the profiles of the H emission line. Our model suggests enhanced CSM dust concentration at increasing distances from the SN as compared to what can be expected from the density profile of the mass loss from a steady stellar wind. By the time of the last MIR observations at day 1041, a total amount of M⊙ of new dust has been formed by SN 2018evt, making SN 2018evt one of the most prolific dust factories among SNe with evidence of dust formation. The unprecedented witness of the intense production procedure of dust may shed light on the perceptions of dust formation in cosmic history.
1 Main
1.1 Introduction
The content and species of dust grains that are associated with stellar sources in galaxies at all cosmic epochs remain a controversial topic, particularly whether supernovae play an important role in dust production. Moreover, they may even carve dust-hostile environments [1, 2], considering ambient grains in any outflow of stellar wind of the SN progenitor may become immediately sublimated and destroyed by the energetic radiation pulse produced by the SN explosion [3, 4]. To date, freshly-formed dust has been observed in a handful of core-collapse (CC) SNe, both in the ejecta in-situ [5, 6, 7, 8] and its interaction zone with CSM (e.g., [5, 9, 10]). No clear observational evidence thus far shows any major formation process of dust grains in the thermonuclear runaway of 1 M⊙ carbon/oxygen white dwarfs (C/O WDs; [11, 12]).
SNe Ia are generally thought to result from thermonuclear explosions of a white dwarf in a binary system. A rare subclass of SNe Ia is denoted as SN Ia-CSM, which is thought to be an exploding WD surrounded by a substantial amount of CSM [13]. The spectra of such events near peak luminosity are characterized by narrow Balmer emission lines superimposed together with relatively shallow Fe-group and intermediate-mass elements. SN 2002ic was the first reported case of SNIa-CSM that revealed large amounts of CSM seen as a strong hydrogen emission [14, 15, 16, 17]. A number of additional SNIa-CSM have been discovered and studied in detail in the past years, which include SNe 2005gj, PTF11kx, 2012ca, 2013dn, 2015cp, and a recent sample of ZTF SNe ( see [18] and references therein).
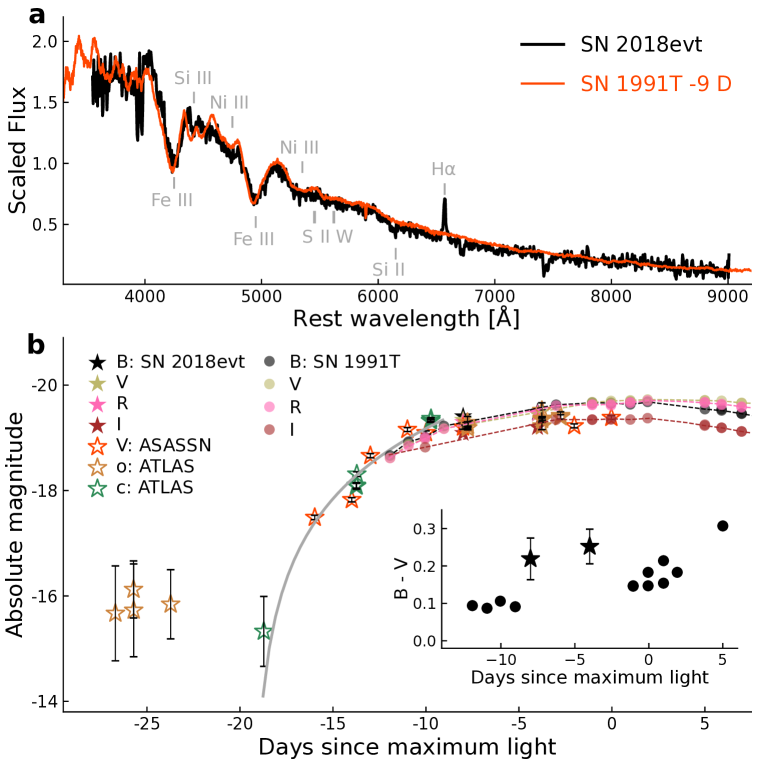
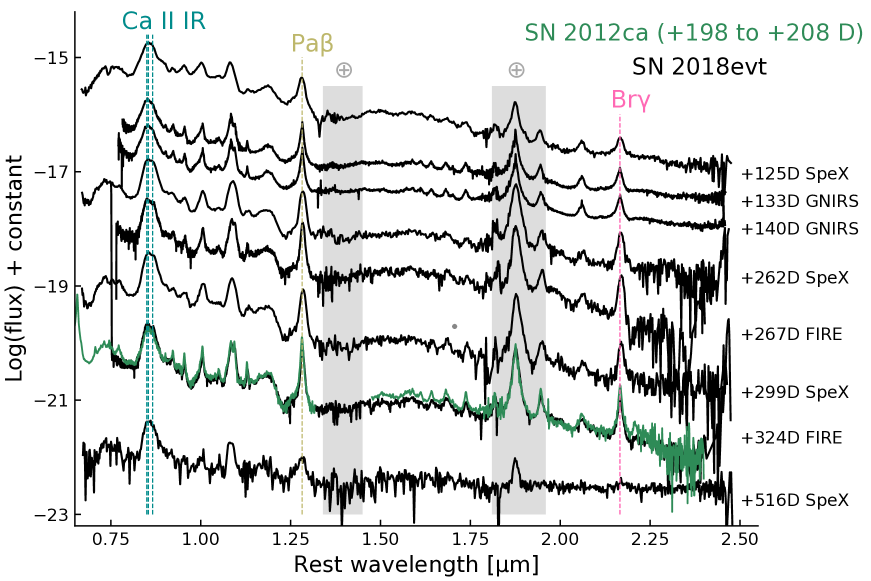
SN 2018evt (ASASSN-18ro [19]) is an SNIa-CSM found in the spiral galaxy MCG-01-35-011 at redshift z = 0.02523 [20]. SN 2018evt shares some common optical spectral features as typical Type Ia SN 1991T-like SNe as shown in Extended Data Figure 1 a. They are characterized by the strong Fe III 4404 & 5129 absorptions, visible Si III 4564, weak S II W and Si II 6355 and lacking absorption features of Ca II H & K and Ca II IR triplet before maximum optical light [21, 22]. The early-phase light curves of SN 2018evt are comparable to those of SN 1991T as shown in Extended Data Figure 1 b. The power-law fit of the earliest light curve of SN 2018evt ( days) suggests a rise time days, which is consistent with that of SN 1991T/1999aa-like events [23]. The inset of Extended Data Figure 1 b shows the early-phase color curve, which is also in general agreement with that of SN 1991T after correcting the host reddening of 0.32 mag, which has been estimated from the equivalent width of the Na I D lines [20]. The presence of the H line makes it an SNIa-CSM similar to SN 2002ic. The entire spectral sequence of SN 2018evt directly resembles other well-observed SNe Ia-CSM events such as PTF11kx and SN 2002ic (see Extended Data Figure 2). The NIR spectrum of SN 2018evt at days after the maximum is similar to that of another SNIa-CSM candidate SN 2012ca with data at a comparable epoch (Extended Data Figure 3).
1.2 Results
1.2.1 Observations
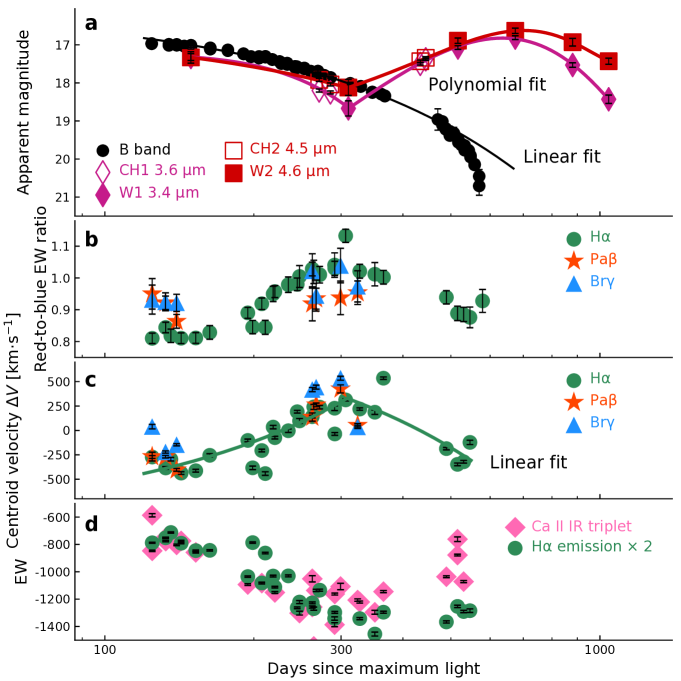
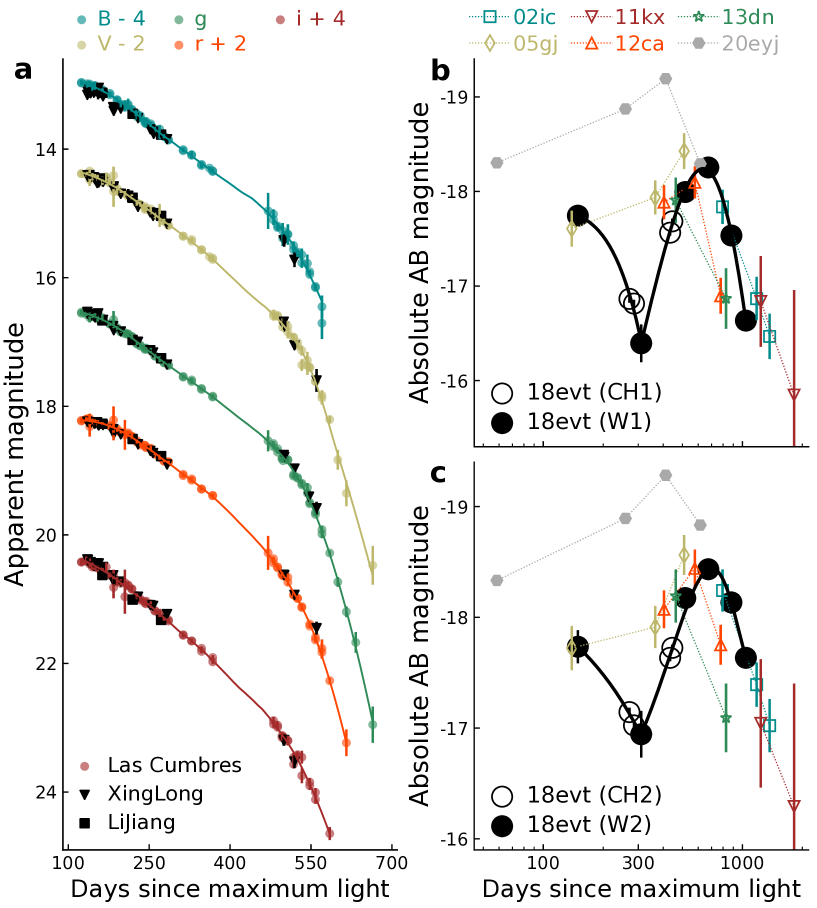
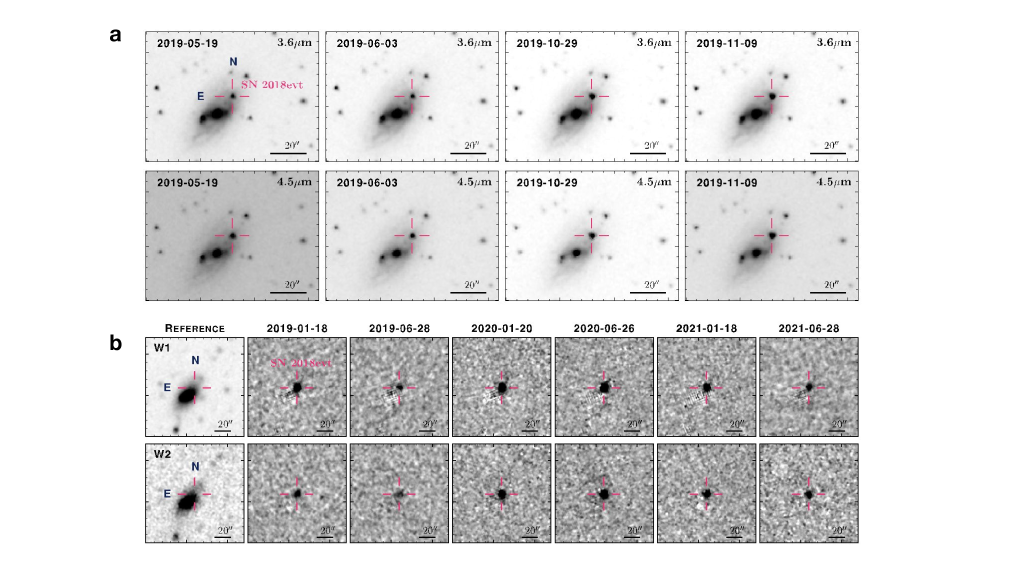
SN 2018evt shows the characteristic spectral features of a Type Ia-CSM SN at early times together with Balmer emission lines (Extended Data Figure 1) and the typical long-duration optical/IR light curves at late phases (Extended Data Figure 4), indicating a continuous interaction between the expanding ejecta and a radially-extending CSM. We observed SN 2018evt with the Spitzer [24] InfraRed Array Camera (IRAC) at 3.6 m () and 4.5 m () [25] in the year 2019 (Extended Data Figure 5 a and Extended Data Table 1). Meanwhile, the area of the SN location was scanned by the NEOWISE (near-Earth object the Wide-field Infrared Survey Explorer) reactivation mission [26] at 3.4 m () and 4.6 m () from 2019 to 2021 [26] (Extended Data Figure 5 b and Extended Data Table 1). The MIR fluxes of SN 2018evt exhibit an initial decline from to days relative to the estimated –band maximum at MJD 58352, however, it is followed by an unprecedented re-brightening until the SN reached its peak luminosity in both and bands at around day (Figure 1 a). This behavior is not only distinct from the steadily-fading light curves in optical bandpasses but also has not been seen in any previous SNe Ia-CSM in similar MIR filters (see Figure 1 and Extended Data Figure 4 b, c); it is, however, likely that this is due to the lack of adequate time coverage of the observations of the latter.
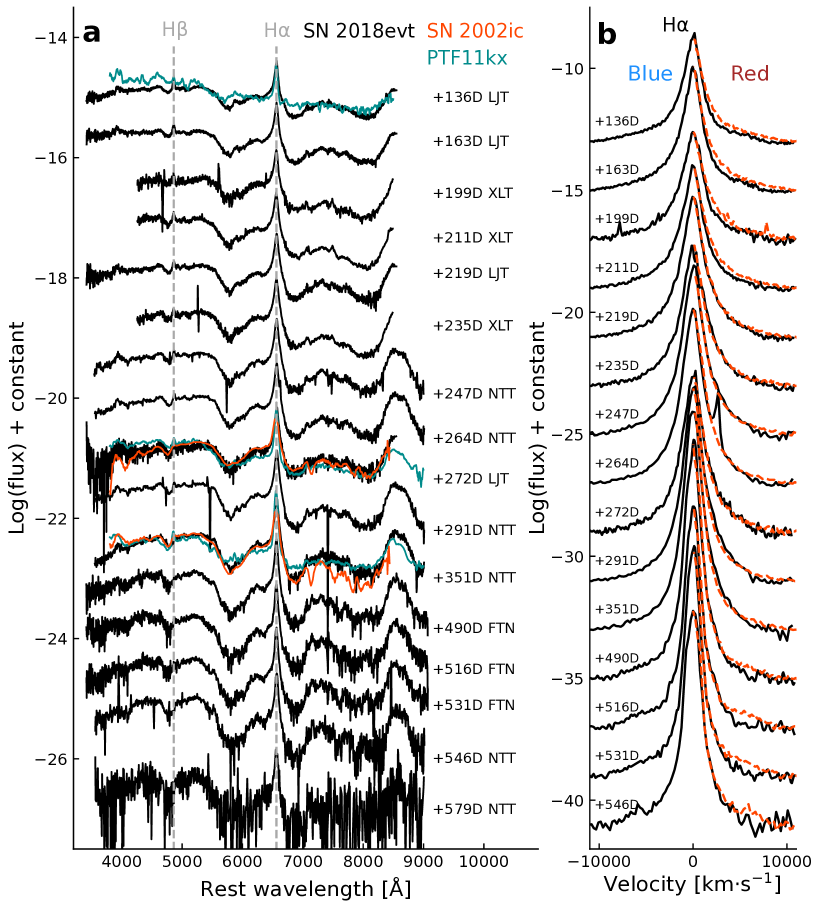
The optical spectral sequence of SN 2018evt spans days to and also reveals conspicuous temporal evolution of the asymmetric characteristic H profile. We measure the equivalent width (EW) separately for the red and the blue wings of the H (shown in Extended Data Figure 2, Extended Data Table 2 and [20]), Pa, and Br profiles (see in Extended Data Figure 3, and Extended Data Table 2). The ratios of red-to-blue wing flux increase steadily from day to 310 but turn over and decrease afterward (Figure 1 b), in pace with the MIR flux evolution. Meanwhile, the flux-weighted centroid velocity of the H line (see Methods 1 on analysis of the spectroscopic behaviors of SN 2018evt for details) evolves steadily from the blue-shifted side ( km s-1) to the red-shifted side ( km s-1) before day , and thereafter moves gradually back to the blue side ( km s-1) (see, Figure 1 c). In addition, the evolution of the EW of the Ca II NIR triplet also exhibits a fall and rise, in concert with the evolution of the MIR flux and the H line profile (see, e.g., Figure 1 d).
1.2.2 Model
The slowly declining luminosity in the optical and NIR (Figure 1 and Extended Data Figure 4) and the broad, long-lived H line (as shown in [20] and Extended Data Figures 2, 6) dominating the late-time spectra of SN 2018evt, both indicate a substantial amount of late-time emission would arise from kinetic energy from the ejecta-CSM interaction converted to radiation [27]. Such an additional energy source leads to a much slower luminosity decline (Figure 1 a) as powered by the 56CoFe decay, i.e., 0.97 mag 100 day-1. In such a context, a cold, dense shell (CDS) develops during the ejecta-CSM interaction, with the CDS being located at a region between the shocked CSM and the shocked ejecta [28, 29]. This is the region where the SN ejecta and the CSM mix produce suitable conditions that allow the condensation of dust grains on short timescales [30, 31, 32].
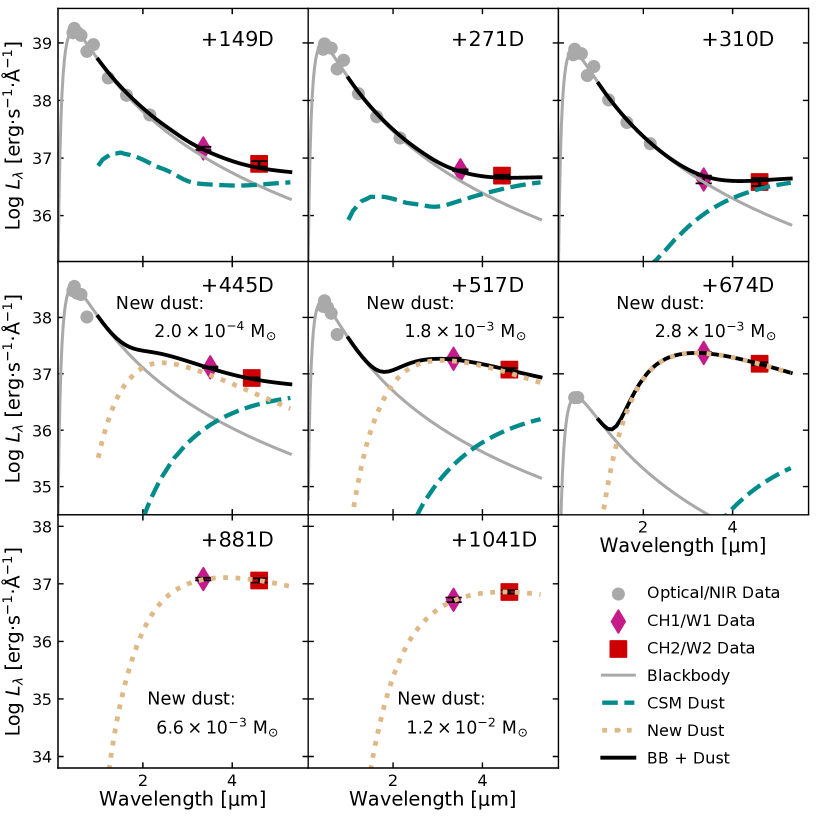
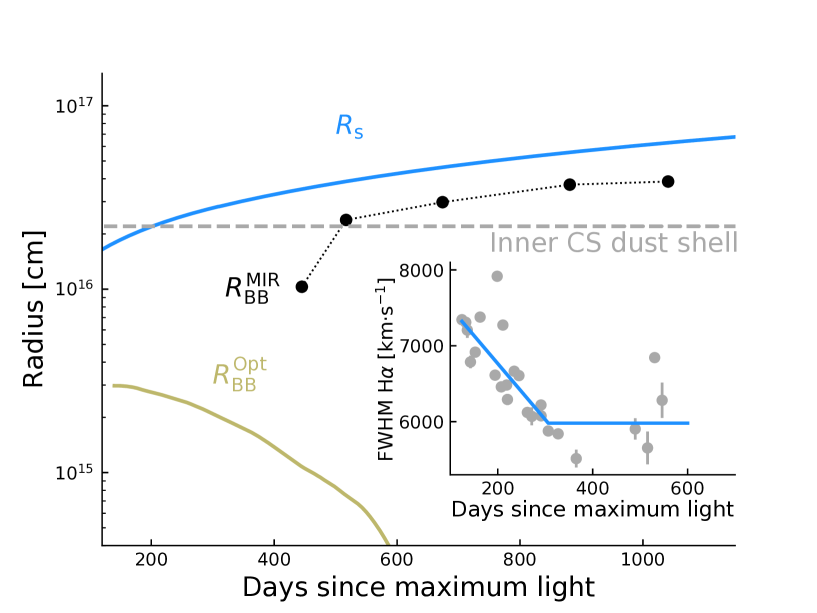
Blackbody fitting of the Spectral Energy Distribution (SED) of SN 2018evt over the optical-to-NIR wavelength range suggests a broad temperature range of around 6400 K to 7000 K during our observations. As shown in Figure 2, the MIR flux excess is obvious and becomes progressively more dominant over time as the optical emission decreases. The MIR flux excess can be attributed to the thermal emission from dust at temperatures of 100-1000 K [33, 31]. The photospheric radius estimated from the blackbody fitting is shown in Figure 3. After day , decreases continuously with time (Figure 3). This indicates a progressive deviation of the blackbody photosphere from the expanding CDS (e.g., Figure 7 of [34]), allowing the CDS to cool to a lower temperature.
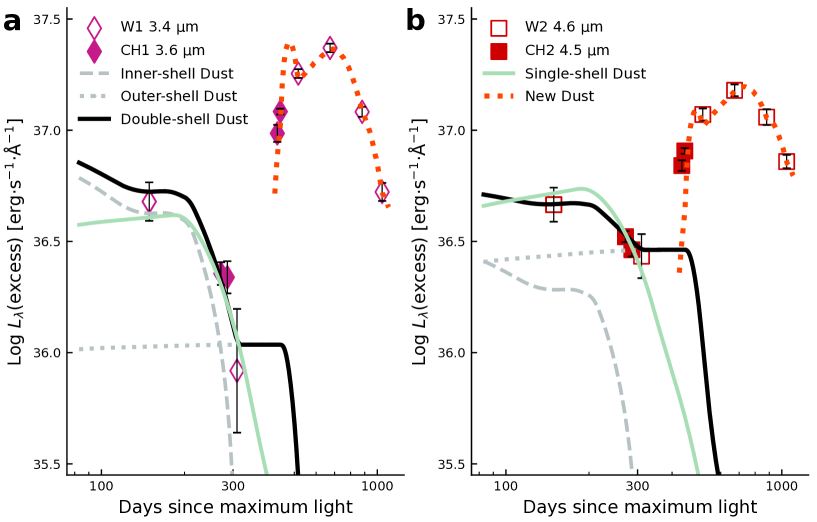
We explore various radial profiles of pre-existing CSM that may account for the time-variant excess of MIR flux due to the thermal emission of dust. An initial decrease before day could be attributed to a single-shell IR echo or a prominent process of dust sublimation as the forward shock runs through. The subsequent brightening after day would suggest that newly formed dust accounts for the later MIR emission, in either the post-shock regions of the CSM or the cooling ejecta. Assuming CSM dust density follows a power-law distribution , the plausible fit to the time-variant MIR flux excesses before day (Figure 4) by searching among a grid of parameters requires a power-law index . Other free parameters include the total optical depth and the inner and outer radius of the CSM shell (see Methods 2). The shallower radial density profile () implies a rather enhanced dust content at larger distances from the progenitor star.
In the case of the steady dust mass loss , a plausible fit can also be achieved by introducing two shells of pre-existing CSM dust before day , namely the double-shell model. As the forward shock propagates outwards, grain sublimation only progressively takes place within the inner shell at a distance of cm, while the emitting dust grains in the outer shell, which is located at cm from the SN remain unaffected early on (See Figures 3, and 5). Because of the lack of early-time spectral coverage, we adopt an initial shock velocity 10000 km s-1 before day based on the value estimated for SN 2002ic [16, 35]. As evidenced by the decreasing FWHM width of the H profile (see inset of Figure 3), the forward shock expands into the inner shell of the CSM and decelerates. The progressive destruction of the inner shell dust grains leads to a continuously decreased emission in the MIR (Figure 4). After 310 days, the forward shock supersedes the outer bound of the inner shell and enters a relatively low-density zone between the two CSM shells. The MIR emission becomes increasingly dominated by the relatively constant thermal emission from the outer shell. Our modeling suggests a rather massive outer shell of M⊙ of dust and an inner shell of M⊙ of dust, corresponding to two episodes of elevated dust mass-loss of M⊙ yr-1 and M⊙ yr-1, respectively (see Methods 2).
Akin to the single-shell model, our double-shell model also suggests enhanced dust concentration at larger distances from the SN as compared to what can be expected from the density profile of the mass loss from a steady stellar wind. The dust distribution inferred from the MIR flux excesses before day can be modeled in terms of a double-shell which assumes a sudden change of the density profile of the dust or a single-shell model with a flatter radial profile, see Figure 4.
Both the single-shell and double-shell models are compatible with the MIR flux excesses at day , but they can not fit the MIR flux excesses at day . After day , the rebrightening of SN 2018evt in the MIR demands significant contribution by additional emission sources, which can be well-attributed to the emergence of warm dust in regions behind the forward shock. As shown in Figure 3, the blackbody radius of the newly-formed dust content fitted to the SED after day 310, increases monotonically and remains within the shock radius .
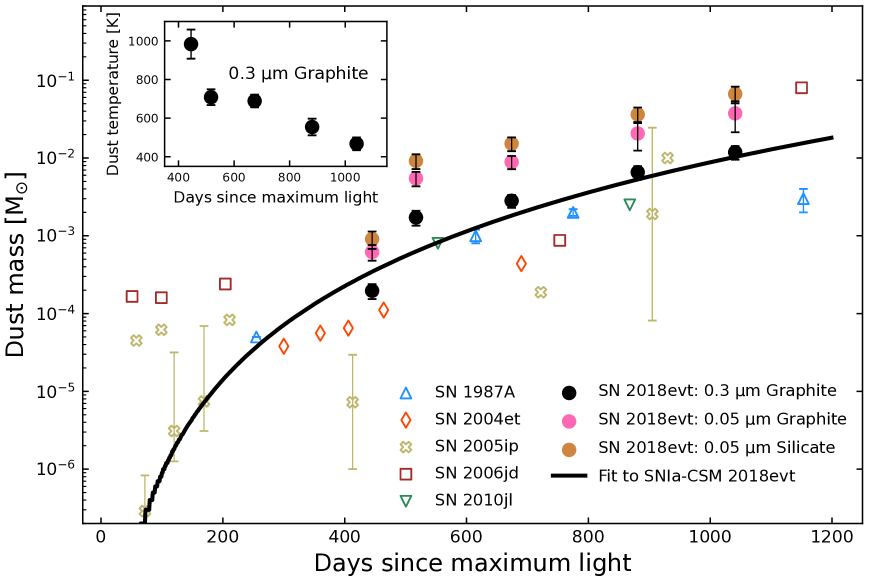
The inferred mass of the newly-formed dust increases over time follows a relation and reaches M⊙ by the time of our last observations at day +1041 (see Figure 6 and Extended Data Table 1). The errors of the dust mass and temperatures are deduced using the Monte Carlo method via propagation of optical-to-NIR photometric errors into blackbody fits and the MIR photometric errors into the flux excess calculations. The dust sublimation time scale is extremely sensitive to the temperature close to the binding energy of the dust particles [36]. Dust survival close to the shock is possible if the dust distribution is patchy or in an opaque disk in which the self-shielding of the dust particles is important [37]. Our double-shell model assumes that a substantial amount of dust may survive the initial UV/optical emission of the SN explosion out to the inferred inner CS dust shell radius of cm, as shown in Figure 3.
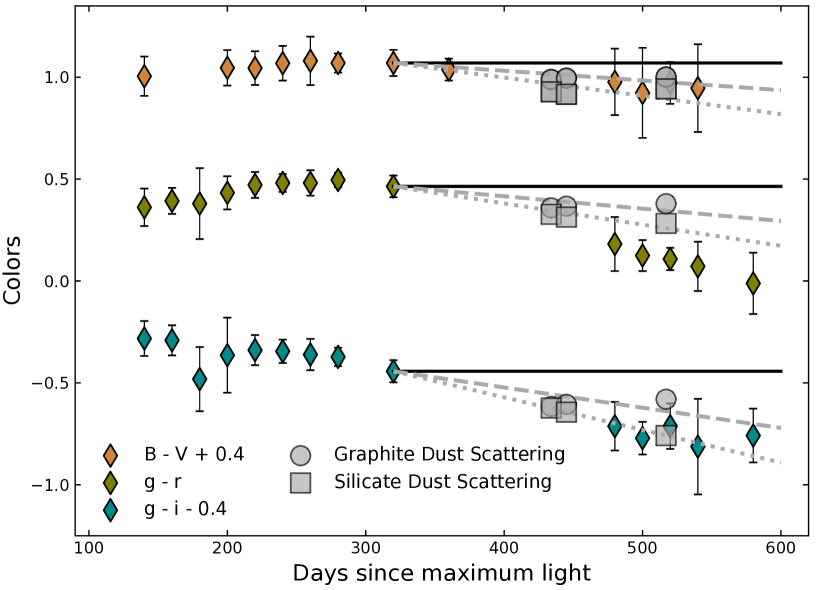
Moreover, our model with dust formation is also consistent with the time evolution of the observed colors in the optical. The colors can be modeled by including the absorption and scattering effects of the newly-formed dust (Extended Data Figure 7). The increasing amount of dust after day may contribute to the apparent blueward evolution of the , , and colors. An increasing amount of scattered light is expected with more dust which leads to an excess flux in the and bands, as shown in Extended Data Figure 7. At even later epochs after day , the SN also exhibits an accelerated fading in optical bandpasses, which is compatible with a change from the optically thin to optically thick regimes of the newly formed dust. Such a transition is similar to the dust-formation process observed in the ejecta of SN 1987A [38].
1.3 Discussion
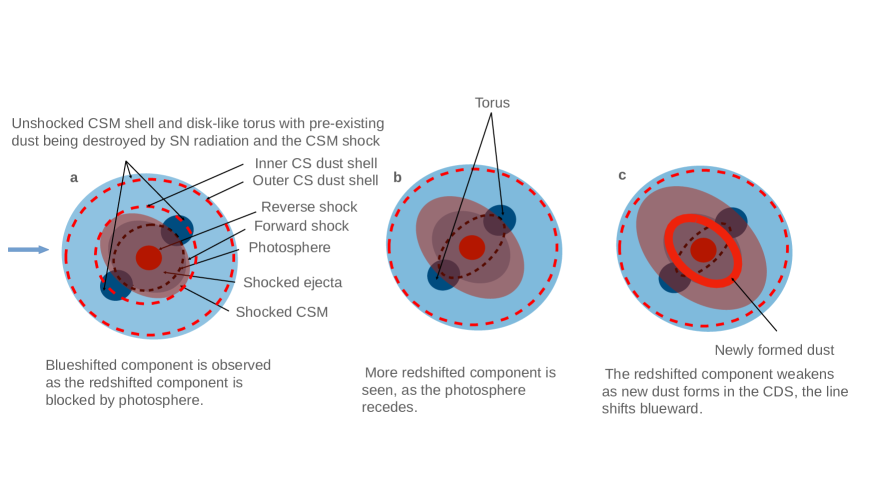
The H emission is powered by the interaction between the ejecta and the CSM [14, 15]. A thorough investigation of the time series of spectroscopy and spectropolarimetry within the first year of the SN explosion suggests a procedure that the SN ejecta expands into a dense torus of disk-like CSM [20]. Such a configuration is in good agreement with the picture depicted by the spectroscopic and MIR flux evolutions span days to . The SN ejecta running into a highly asymmetric disk-like CSM leads to a high-density torus inclined at an angle toward the observer. The early blueshift of the H emission line is explained if the redshifted side of the shocked CSM is blocked by the photosphere, as shown schematically in Figure 5. The redward shifts of the H emission line (i.e., from days to ; see Figure 1) are caused by the receding photosphere as the photosphere shrinks, as proposed for the CSM configuration in PTF11iqb [39] (their Figures 10 and 12). After day , warm dust grains start to coagulate in the CDS and gradually block the receding side of the H line again, resulting in a blueward shift of the line profiles (Figure 5 c). After day , the color of SN 2018evt becomes redder over time (see Figure 1 a), indicating a decrease in the temperature and the MIR emission of the newly-formed dust.
The presence of a highly asymmetric ejecta-CSM interaction zone is also supported by detailed spectropolarimetry of SN 2018evt which shows a wavelength-independent degree of polarization with non-evolving position angles that is characteristic of electron/dust scattering from a highly axisymmetric configuration [15, 40, 20]. Despite assuming spherical symmetry, both the single-shell and double-shell distribution of the CSM dust shell provides a satisfactory description of the SED evolution of SN 2018evt spans days 149 to 310, in particular, the time-variant excess in MIR. By incorporating the geometric information obtained from spectropolarimetry [20], the ejecta-CSM interaction process of SN 2018evt before day is illustrated by the schematic sketches (a) and (b) presented in Figure 5. In our double-shell model, the dust in the CS wind at the radius cm may be distributed in a disk or torus instead. The destruction and formation of the dust would manifest qualitatively similar trends in the temporal evolution of the MIR excess.
The CSM masses derived from optical and optical-to-MIR luminosities in shock interaction regions are (see Methods 3 on the progenitor’s mass loss for details; [20]), corresponding to mass loss rates of . Such CSM masses estimated from the kinetic-to-radiation energy process across the shock front appears to be larger compared to the amount of dust within the inner CSM shell ( M⊙) that contributes most of the MIR excess before day 310 (Figure 4). Thus a very low dust-to-gas mass ratio within the inner shell at a relatively smaller distance ( cm) can be inferred, which may likely be caused by the prompt destruction of a substantial amount of grains in the inner shell by energetic particles from the SN [3]. On the contrary, a gas-to-dust mass ratio on the order of 100 can be inferred in the more massive ( M⊙) and distant ( cm) outer shell, which is consistent with what is anticipated in the interstellar medium [41]. This probably means that the dust in the outer shell is much less affected by both the radiation field of the SN and the energetic particles from the shock interaction between the ejecta and the inner shell. Similar results as the outer shell can be derived by comparing the above CSM masses and the dust mass ( M⊙) located at cm in the single-shell model.
The mass loss of the progenitor before the explosion is in favor of either a thermonuclear explosion from a WD asymptotic giant branch (AGB) star system [14, 42], or a core-degenerate system in which a WD merges with the core of a massive AGB star that triggers a thermonuclear explosion at the end of a common envelope phase or shortly after [43]. The mass loss is also consistent with a WD main sequence systems for the common envelope wind (CEW) model [44, 45]. The progenitor systems are consistent with the measurements of the wind velocity km s-1from the absorption minimum of the narrow P-Cygni profiles of H line (Extended Data Figure 6 and that in [20]. Compared with the density profile of the dust mass loss from a steady stellar wind , a flatter radial profile inferred in the single-shell model indicates enhanced dust concentration at increasing distances from the SN. The double-shell model also points to the same result that a higher dust mass-loss rate () of mass ejections is measured within the distant outer shell ( cm) and a lower dust mass-loss rate () is measured within the close inner shell ( cm). Both the single-shell and double-shell models suggest enhanced dust presence at larger distances from the progenitor star. This shallower radial density structure would result from a variable mass loss, which is likely to happen in the entire AGB evolution [46].
The re-brightening in the MIR after day can be modeled as a result of the formation of a substantial amount of warmer dust at late phases (see Figures 1, 2, and 4), distributed in a prolate shell vertical to the CSM disk (Figure 5). It also provides a natural explanation of the red-to-blue emission-wing ratio of H due to uneven extinction by the newly-formed dust (Figure 1). This behavior is also observed for the Ca II NIR triplet which can be similarly explained. The rapid weakening of the Ca II NIR triplet may also indicate the depletion of calcium by dust formation. The proposed process of dust formation is corroborated by the time-evolution of the EW of the Ca II NIR triplet emission lines, which exhibits an increase after day 310 (see, e.g., Figure 1 d).
Figure 6 shows the temporal evolution of the mass of the newly formed dust of SNIa-CSM 2018evt in our model, compared with other CC SNe. The estimated dust mass is highly dependent on the species and the size distribution of the dust grains. For graphite with a size of m the dust mass grows rapidly following a power law of index 4 with the time after the explosion and reaches M⊙ at the last epoch of the MIR observations at day (Figure 6). For graphite or silicate of m, the dust mass is about three or five times higher than the value derived for the m graphite dust (Extended Data Table 1), respectively. The temperature of the newly-formed dust is presented in the inset of Figure 5. A monotonically decreasing temperature from 1000 K to 500 K between day and day 1041 is likely to be mostly affected by the expansion cooling of the CDS region between the forward and the reverse shocks. It may also be regulated by various heating mechanisms, including radiative heating from the SN shock, collisional heating with the ambient warm gas, and the energy exchange between the gas and dust [30]. As the SN ejecta expands and the dust-forming region in the CDS cools, dust grains may continue to coagulate. Depending on the duration of the time scale that the ejecta expands into the CSM, even orders of magnitude higher dust content may be produced during such a procedure. A significant fraction of the unburned carbon in the ejecta, if not all, can be locked in the newly formed dust. As progressively deeper layers of the ejecta move into the CDS, we may also expect a massive amount of iron and silicate dust to form in such an environment. JWST can probe the signatures of such dust in the coming years. The estimated mass () and the blackbody emission radii of the newly formed dust masses are consistent with that seen in CC SNe at similar phases ( see Figures 6, 3, and [30]), suggesting a rapid and efficient mechanism for dust production in these SNe.
Finally, we remark that 1% of Core-collapse SNe occur in elliptical galaxies in the local universe [47], dust production in thermonuclear explosion SNe Ia would be a major channel of dust enrichment in early-type galaxies. SN Ia may also contribute to the dust budget in spiral galaxies [48]. SN 2002ic was the first SNIa-CSM ever discovered and has a dwarf elliptical host [14]. The weak H of the host galaxy of SN 2018evt would also imply an overall less active star formation [49]. Even though SNIa-CSM is a rare sub-class of thermonuclear SN, the unprecedented witness of such an intense production procedure of dust grains may shed light on the perceptions of dust formation in cosmic history (see Methods 4).
Methods
1 Observations
Early-phase observations of SN 2018evt
The early-phase observations of SN 2018evt were conducted with the dual-channel optical/NIR camera ANDICam on the Cerro Tololo Inter-American Observatory (CTIO) 1.3-meter telescope. Two epochs of band photometry were obtained on 2018-08-13 and 2018-08-17 before the SN was too close to the Sun.
ANDICam has an optical field of view (FOV) of ( pixel-1) and a NIR FOV of ( pixel-1).
The extraction of the NIR-band photometry was not successful due to the lack of bright stars for astrometric calibration to combine the dithered images. The point-spread function (PSF) photometry was performed on the optical images using PSFEx [50] following the detailed prescriptions described by [51].
The PSF photometry was calibrated to the standard Pan-STARRS catalog [52, 53] of the brightest field star at (R.A., Decl.) = (,) (J2000) with of mag, mag, mag, mag, and mag.
The and band photometry of this field star has been converted to the standard Johnson system [54] following the transforming equations provided by [55, 56, 57].
The early optical light curves of SN 2018evt are shown in Extended Data Figure 1 b. We also retrieve early-time photometry of SN 2018evt using the ATLAS
[58, 59] forced photometry service in and bands, and the All-Sky Automated Survey for Supernovae (ASAS-SN [60, 61]) sky patrol interface.
The background flux of the ASAS-SN data of SN 2018evt has been estimated by the pre-explosion median flux recorded with the same aperture as used for the SN photometry, based on a total of 266 visits.
Both ATLAS and ASAS-SN photometry are also shown in Extended Data Figure 1 b.
Spitzer Observations
SN 2018evt was observed (PI: Sijie Chen) with the Spitzer [24] Infrared Array Camera (IRAC) at 3.6 m () and 4.5 m () [25] at days , , , and . We utilized the level 2 post-BCD (Basic Calibrated Data) images from the Spitzer Heritage Archive (SHA), which were reduced by the Spitzer pipeline and resampled onto pixels. Source detection and aperture photometry were performed on the images in Extended Data Figure 5 a without host subtraction using SExtractor [62]. We remark that flux difference is less than or similar to for the Spitzer/IRAC photometry with and without template subtraction in [31], which is well within the photometry uncertainty. We applied aperture corrections following the IRAC Data Handbook. The level 2 post-BCD images have been calibrated in an absolute surface-brightness unit of MJy/sr, which can be transformed into units of uJy/pixel2 by a conversion factor of 8.4616 for the angular resolution of our IRAC images pixels. The flux was converted to AB magnitude according to the definition , where is in units of Jy [63]. The AB magnitudes of SN 2018evt in and bands are listed in Extended Data Table 1.
NEOWISE observations
SN 2018evt field was also observed by the NEOWISE reactivation mission in (m) and (4.6m) bands since late 2013 as an extension of the WISE ALL-Sky Survey [64, 65]. Using the online version of the NEOWISE Image Co-addition with Optional Resolution Enhancement (ICORE) [66, 67], we retrieve the coadded NEOWISE images that centered at SN 2018evt, with a FOV of , and resampled to a pixel size of . Given that SN 2018evt exploded in August 2018, we take the coadded image from January 2017 to January 2018 as the reference image for background subtraction, and generate the difference images for every single visit coadded image using the Saccadic Fast Fourier Transformation (SFFT) [68]. Extended Data Figure 5 b shows the NEOWISE reference and difference images at the position centered on SN 2018evt. The time series of the differenced images clearly show the significant variations in the brightness of SN 2018evt. The signal was significant in January 2019. After a noticeable dimming in the next six months, a dramatic rebrightening is followed in 2020.
Aperture photometry was performed on the difference images using SExtractor [62] and calibrated to the profile-fit magnitudes in Vega system released in the ALLWISE Source Catalog. The photometric errors were measured on the corresponding variance images and corrected by a factor of 2.75, which gives the ratio of the input to output pixel scale (Section 13 of [67]). Such estimated photometric error for each visit will be used if it is larger than the photon noise from direct photometry on the differenced images. The Vega magnitude of SN 2018evt was transformed into AB magnitude according to the magnitude offsets between the two magnitude systems [69]. The AB magnitudes of SN 2018evt in and bands are listed in Extended Data Table 1. The MIR-band light curves of SN 2018evt are shown in Extended Data Figure 4 b, c, together with other SNeIa-CSM, including SNe 2002ic, 2005gj [35], PTF11kx [70], 2012ca [71], 2013dn [31, 72], and 2020eyj [73].
Optical Photometry at Las Cumbres Observatory
Extensive photometry spanning 124 to 664 days was obtained with the Sinistro cameras on the Las Cumbres Observatory of the 1-m telescope, a global network for SN observations. Images were bias subtracted and flat-field corrected using the BANZAI automatic pipeline. The background template was then subtracted from the pre-processed images adopting the SFFT algorithm [68]. Finally, Point Spread Function (PSF) photometry has been performed on differenced images using ALLFRAME [74]. We remark that the light curves of SN 2018evt before day were achieved without subtracting any background template and reported in [20]. Comparisons between their direct photometry and our template-subtracted photometry obtained at similar phases suggest a good agreement. In particular, the systematic magnitude differences in yield , , , , and , respectively.
Templates for our band exposures were directly obtained using Panoramic Survey Telescope and Rapid Response System (Pan-STARRS) cutout images for bands. and band templates were constructed using Pan-STARRS images, with the formula , . The parameter has been achieved by minimizing the global residual flux computed based on all field stars, which produces the cleanest subtraction. Thus the best coefficients obtained are for , for , respectively.
Zero-point calibration was conducted using local field stars by calculating clipped median of the differences between instrumental magnitudes and standard Pan-STARRS Catalog [52, 53] for and AAVSO (American Association of Variable Star Observers) Photometric All-Sky Survey (APASS) data release 9 (DR9) catalog [75] for BV (using only stars with magnitude within 10-18 mag and photometric errors mag). The band light curves of SN 2018evt are shown in Extended Data Figure 4 a.
Optical Photometry with XLST & LJT
Optical photometric observations of SN 2018evt were also conducted with the 60/90-cm XingLong Schmidt telescope (XLST) of National Astronomical Observatories of China (NAOC) under a long-term Tsinghua University-NAOC Transient Survey (TNTS) [76], and the Yunnan Faint Object Spectrograph and Camera (YFOSC) [77] mounted on the 2.4-m LiJiang telescope (LJT) at the Yunnan Astronomical Observatories.
SN2018evt was observed in the imaging mode of YFOSC.
Images obtained by the XLST and LJT were processed using an automatic custom pipeline based on the Image Reduction and Analysis Facility (IRAF).
The pipeline reduction follows standard procedures including bias and flat-field corrections, astrometric registration, template subtraction, PSF photometry.
The photometry is also shown in Extended Data Figure 4 a.
Optical Spectroscopy
We also obtained 17 optical spectra of SN 2018evt. A log of the spectroscopic observations is presented in Extended Data Table 2. Six spectra were taken with the 3.6-m ESO Faint Object Spectrograph and Camera v.2 (EFOSC2) [78] mounted on New Technology Telescope (NTT) at La Silla Observatory during the extended-Public ESO Spectroscopic Survey for Transient Objects (ePESSTO) [79]. The observations were carried out under ESO programs 199.D-0143 (PI: Smartt) and 1103.D-0328, 106.216C ( PI: Inserra). Four spectra were taken with the YFOSC/LJT in the long-slit spectroscopic mode, and three were taken with the Beijing Faint Object Spectrograph and Camera (BFOSC) [80] mounted on the 2.16-m Xinglong telescope (XLT). One spectrum was obtained with the Wide Field Spectrograph (WiFeS) mounted on the ANU (Australian National University) 2.3-m telescope at the Siding Spring Observatory [81]. Three additional spectra obtained at days 490, 516, and 531 were acquired with the Folded Low Order whYte-pupil Double-dispersed Spectrograph (FLOYDS [82]) mounted on the 2.0-m telescope at Las Cumbres Observatory(Extended Data Table 2). The twin robotic FLOYDS spectrographs are mounted on the Faulkes Telescope South (FTS) at Siding Spring Observatory and on the Faulkes Telescope North (FTN) at Haleakala. Apart from the three late-time spectra mentioned above, another 12 spectra (Extended Data Table 2) were obtained with the same telescope spanning from days to days [20] and were also included in this paper to measure the H line profile (e.g., red-to-blue emission-wing ratio and flux-weighted centroid velocity ). The photometry of SN 2018evt obtained with the global network of 1-m telescopes and the 12 epochs FLOYDS spectroscopy before day 365 have been published in [20], which focuses on the early ejecta-CSM interaction and the spectropolarimetric properties of SN 2018evt.
All optical spectra were reduced using standard IRAF routines. Flux calibration of the spectra was carried out using spectrophotometric standard stars observed at similar airmass on the same night. The spectra were further corrected for atmospheric extinction using the extinction curves of local observatories.
NIR Spectroscopy
This paper includes eight NIR spectra (see Extended Data Figure 3 and Extended Data Table 2). Four NIR spectra were obtained with the Medium-Resolution 0.8-5.5 Micron Spectrograph and Imager on the 3.0-m NASA Infrared Telescope Facility (IRTF) on Mauna Kea, named SpeX [83]. Two NIR spectra were acquired with the Folded port InfraRed Echellette (FIRE) spectrograph [84] on the 6.5-m Magellan Baade telescope. Another two spectra were obtained with the Gemini near-infrared spectrograph (GNIRS) [85] on the 8.2-m Gemini North telescope. The SpeX, FIRE, and GNIRS spectra were reduced with the IDL codes, Spextool [86], firehose [84], and the XDGNIRS pipeline [87, 88], respectively.
Analysis of the spectroscopic behaviors of SN 2018evt
All spectra were corrected for the redshift of the host galaxy [20], and the extinction from the Milky Way mag [89]. Three spectra lines were normalized with a pseudo-continuum by linear fitting to the spectra ranges [6250, 6350] Å and [6700, 6800] Å for H, [12200, 12500] Å and [13200, 13500] Å for Pa, [21100, 21400] Å and [21900, 22200] Å for Br. Thus H, Pa, and Br are located at [6350, 6700] Å, [12500, 13200] Å, and [21400, 21900] Å, respectively. All spectra were scaled to match the photometry in the optical bandpasses at corresponding phases and further used to measure the H luminosity (Extended Data Table 2) and EW (Figure 1 d). For each flux spectrum, following an approach similar to the analysis of [20], we fit a double-component Gaussian function to the H profile to decompose it into a broad and an intermediate component. We found that the center of the intermediate Gaussian component, which has a typical FWHM width of 2000 km s-1, shows only moderate shift over time until the last epoch of spectroscopy at day . Such behavior is in overall good agreement with the analysis based on the spectra obtained before day by [20]. The determination of the center of the intermediate Gaussian component also allows us to compare the blue and red wings of several major emission lines. In particular, we present the red-to-blue EW ratios measured between the red and the blue wings for H, Pa, and Br features in Figure 1 b. Note that the determination of the center of the Pa and the Br lines was carried out based on a single-component Gaussian fit due to the relatively low S/N. The EW ratios for the H and the Pa lines were computed over a velocity range of 8000 to 8000 km s-1. A narrower velocity range of 3500 to 3500 km s-1 was used for the measurement of the Br profile.
After correcting for the redshift of the host galaxy, we define the flux-weighted centroid velocity as , where gives the speed of light, represents the rest wavelength of the line center, i.e., =6563Å. The flux-weighted peak wavelength, , is calculated as , where denotes the wavelength of any spectral element over the emission profile. Such a quantity literary weights each spectral element by their flux , thus providing a more robust trace of the bulk velocity of the line-emitting zone. Figure 1 c shows the derived for the H, Pa, and Br lines for SN 2018evt. In Figure 1, the uncertainties of EW ratio and centroid velocity were calculated through the Monte Carlo method, assuming that all spectra have 10% flux uncertainty.
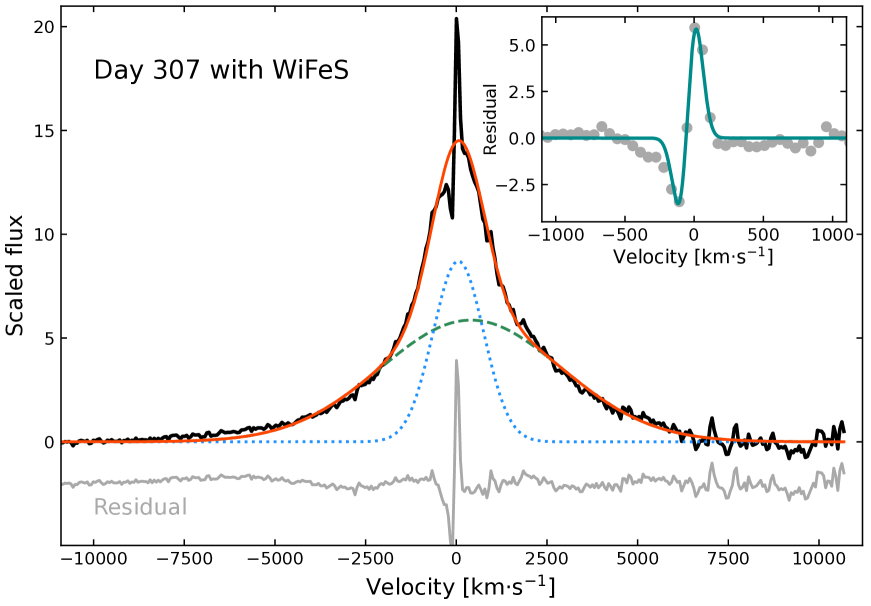
The day 307 WiFeS [81] spectrum obtained with a higher spectral resolution (R3000) presents a well-resolved narrow H P Cygni profile (see Extended Data Figure 6). A two-component Gaussian fitting process suggests that the FWHM widths of the broad and the intermediate components are 587732 km s-1 and 164312 km s-1, respectively. After subtracting the broad and the intermediate components from the day 307 WiFeS spectrum, we fit the residual spectrum with two separate Gaussian functions to better separate the narrow absorption and emission components of the P Cygni profile. We inferred a redshift by assuming the narrow emission component peaks at the rest wavelength of H (see inset of Extended Data Figure 6). The wind velocity, which is measured from the blue-shifted absorption minimum, gives km s-1. Our measurements are consistent with those reported by [20] within the uncertainties, for example, and km s-1. The redshift values derived in both studies are also consistent with those reported to the NASA/IPAC Extragalactic Database (NED) [90, 91]. Therefore, we used and km s-1 [20] throughout the paper due to the smaller uncertainty.
2 Blackbody fit and dust sublimation
The Effective blackbody temperatures and radii were estimated by fitting a black body (BB) curve to a time series of SED constructed from the optical () and/or NIR () light curves of SN 2018evt. Optical photometry was obtained by the global network of the 1-m telescope at Las Cumbres Observatory, and NIR photometry was taken from [20]. The latter spans days 141 to 314, and was obtained with the Gamma-Ray burst Optical/Near-Infrared Detector (GROND) [92] mounted on the 2.2-m MPG/ESO telescope, operated at the La Silla Observatory in Chile. All SED were constructed after correcting for the mag Galactic extinction [89]. We adopt a distance of 103.3 Mpc for SN 2018evt following the rationale provided in [20]. Owing to the lack of early-time data before day 141, we adopt the optical and NIR light curves of the well-sampled Type Ia-CSM SN 2005gj [93] to generate the SED of SN 2018evt during the missing phases, and thereafter to calculate the MIR emission of CSM dust through the absorption and re-emission processes. Such an approximation is validated by the high similarity in pre-peak and around day 140 spectra, light curve shapes, and absolute brightness in optical and NIR bandpasses between SNe 2018evt and 2005gj. In detail, SNe 2018evt and 2005gj are both Type Ia-CSM objects (see Extended Data Figure 1 and Figure 7 in [94]). They share similar blackbody temperature and radius at day 140 based on their multiband photometry, as shown in Figure 3, and Table 8 of [93]. Also, the peak fluxes of SN 2005gj are comparable with that of SN 1991T (Figure 7 of [93]), whose early-phase spectrum and light curves match well with SN 2018evt [95] as shown in Extended Data Figure 1 (see [96, 97, 98, 99] for SN 1991T).
For SNe whose late-time emission is mostly dominated by strong ejecta-CSM interaction, their effective is expected to coincide with the radius of a thin CDS [100, 28] located between the shocked CSM and the shocked ejecta. The of SN 2006gy reaches its maximum value at day 115 (see Figure 7 of [34]), while the expansion of its CDS continues as indicated by a rather constant FWHM width of the H, which traces the expansion velocity of the CDS. Similar behavior is also seen in the Type IIn SN 2006tf (see Table 3 and Figure 15 of [101]). Therefore, we suggest the black-body-fitted does not trace the emitting radius of the CDS . The latter can be represented by introducing a dilution factor , which cannot exceed unity and decreases over time [102]. The true emitting radius of the CDS is given by = [101, 102].
Figure 3 shows the of SN 2018evt through blackbody fit to the optical-to-NIR photometry. At day , we measure cm. After day , is decreasing in Figure 3, indicating that has departed from the corresponding blackbody radius at day (). We approximately adopted the cm as the lower limit of the expanding CDS radius at day .
For SN ejecta whose radial density profile follows an inverse power law distribution, , the shock radius is given by the equation (1) of [103]:
| (1) |
In the literature, the shock velocity is often approximated by the velocity corresponding to the FWHM width of the H emission line [104, 105, 106]. Assuming a typical shock velocity of 5000 - 10000 km s-1[16, 107, 108], which is consistent with the H velocity width measured during our spectroscopic observing campaign on SN 2018evt between days 125 and 546, see inset of Figure 3. By adopting a 8.5 ejecta density profile estimated for SN 2002ic [17], we estimate a forward shock radius cm at day 310.
This shock radius is less than the dust evaporation radii of cm for silicate or graphite dust [103] assuming the SN luminosity to be , which falls in between the maximum for SN 2018evt () and the peak luminosity of SN 2005gj ( in Table 8 of [93]). This suggests that the pre-existing CSM dust in the single-shell model at cm and in the outer shell of our double-shell model at a distance cm are unlikely to be sublimated by the SN radiation as the dust temperature at cm can only be heated up to a temperature of about 970 K, which is lower than the evaporation temperature of 1500 K for silicate and 1900 K for graphite [103, 10, 109]. The shock radius is comparable to the inner radius of the inner CSM dust shell in our double-shell model ( cm), indicating the dust grains within the inner CSM shell are likely to be destroyed by the forward shock, if they survived the initial pulse of the electromagnetic radiation of the SN explosion due to a patchy dust distribution or in an opaque disk [37].
MIR flux excess
The MIR flux excess compared to the best-fit black-body SED for different epochs of observations is shown in Figure 2. Two-epochs of MIR observations were acquired with Spitzer (m) and (m) at days and . The MIR observations at days and were not presented as they are nearly identical to the results for days +271 and +445 observations respectively (see Extended Data Figure 4, and Extended Data Table 1). Six more epochs of observations were acquired with NEOWISE (m) and (m) at days , , , , , and .
MIR emission excess typically suggests the presence of warm dust. The MIR filters used to observe SN 2018evt provide a rather complete wavelength coverage of observations spanning the peak of the thermal spectral energy distribution from dust with temperature spanning K [33, 110]. The MIR emission excess has been explained by the formation of new dust grains in a handful of CC SNe, both in the ejecta in-situ [5, 6, 7, 8] and in the interactions between the ejecta and the CSM (e.g., [5, 9, 10]). Alternatively, MIR emission excess could originate from the thermal infrared radiation emitted by dust particles that were present in a CSM before the SN event. Such primordial dust grains may have formed in the expanding matter blown from the red giant stars or AGB stars [14, 111]. In addition to the thermal radiation of the pre-existing CSM grains, our models also include the emission from any newly-formed dust to account for the extreme MIR rebrightening of SN 2018evt after day 310.
Modeling to the emissions of SN 2018evt: a model with one or two primordial CSM shells and new dust formed in the CDS region
Dust particles in the CSM absorb some of the UV-optical photons radiated during the explosion of the SN and its ejecta interaction with the CSM and re-emit the flux in the IR bands, producing an IR echo [112, 113, 114, 115, 116, 117]. Such an IR echo can be used to constrain the CSM dust properties around the SN such as their distribution, mass, and composition. IR echo models for spherically symmetric CSM shells have been developed to account for the thermal emission from pre-existing CSM dust, which provides a plausible explanation for the late-time excess in the observed IR light curves Type Ia [118, 117, 119] and Type II SNe [112, 116]. The time evolution of the IR echo is related to the ultraviolet and optical light curves of the SNe.
At any given time, a distant observer will see the IR echo located within an ellipsoid, with the SN and the observer lying at its two foci. Such an ellipsoid traces an iso-travel-time surface of the light emitted by the SN, which expands over time. The position of any point within the ellipsoid can be expressed as (, ), where denotes the distance from the point to the SN, and represents the scattering angle. For dust particles of radius located at , and an SN located at a distance from the observer, the total flux emitted by the IR echo at time gives
| (2) |
where and are the radii of the inner and outer dust shell, respectively, is the number density of the dust particles, the Plank function at frequency is determined by the dust temperature ,
which can be estimated from the SN luminosity.
denotes the absorption and emission efficiency of the dust grains.
The light curve of the emitting IR echo from dust distributed in a shell shows a plateau lasting for a period of 2 (where is light speed) and followed by a decline for a period of time that is related to the radial extent of the shell.
Such behavior is similar to that reported for SN 2005ip [9] and several other SNe that show strong ejecta-CSM interaction (e.g., [112, 116, 117, 109]).
Assuming the CSM dust density around SN 2018evt follows an inverse power-law distribution , the MIR flux emitted by the CSM dust within a single shell can be derived from equation (2).
The single-shell model is assumed to be spherically symmetric and described by four parameters namely inner and outer radii of the shell , , the optical depth in band , and the power-law index . We initially set in the range of 50 ld 150 ld (ld for the light day), in order to make sure the thermal radiation of the CSM dust declines between 100 and 300 days. We run the single-shell model in tens of thousands of grid points based on the four parameters (, , , ) and obtain a group parameter ( 0.07, 100 ld, 80 ld, 1.15) to well fit the data (see the green lines in Figure 4), where . A flatter radial profile of the CSM dust density was inferred from the single-shell model due to the smaller , compared with the value for the steady-wind mass loss of the progenitor system (). This suggests an increased dust concentration at increasing distances from the SN as compared to what can be expected from the density profile of the mass loss from a steady stellar wind. The mass of the CSM dust within the single shell is derived to be .
In the case of the steady-wind mass loss , a plausible fit can also be achieved by introducing two shells of pre-existing CSM dust before day . The inner shell predicted by our double-shell model was caught by the forward shock at day 200 (see, e.g., Figure 3). Dust grains within the inner shell are thus gradually destroyed as the shock runs. The expansion velocity of the shock was assumed to be 10000 km s-1 due to the lack of observations before day 120, followed by a continuous deceleration as traced by the FWHM width of the broad H as shown by the inset of Figure 3. Before day , the outer shell of the CSM, which emerges at cm, remains unaffected by the forward shock. Our double-shell CSM model also provides a satisfactory fit to the monotonically decreasing MIR flux curves before day . The SED fits to the and MIRband photometry are illustrated in Figure 2. The IR echo light curves of the two shells are shown in Figure 4. The best-fit parameters are (, , )=(0.07, 8.5 ld, 2.2 ld) for the inner shell and (0.17, 230 ld, 30 ld) for the outer shell. The total optical depth of the pre-existing dust shells in band is , corresponding to a band extinction of mag. We also remark that such an integrated extinction is consistent with the value estimated from the Na I D lines [20]. By assuming the CSM shells were built up by multiple epochs of pre-explosion eruptions, the derived dust mass-loss rates of the mass ejections that form the inner and outer dust shells are and , yielding total dust masses of and , respectively.
However, newly-formed dust is required to explain the substantial elevation of the MIR flux excess at day . The fit results of the MIR excess of SN 2018evt are also shown as red-dotted curves in Figure 4. Our fit result is achieved by assuming the newly-formed dust is composed of graphite grains of radius m. In Figure 6, we also present the mass of the newly-formed dust as a function of time for m graphite and silicate grains. Dust masses estimated for other well-sampled SNe that exhibit ejecta-CSM interactions are also presented for comparison, including the Type IIP SNe 2004et (diamonds) [120] and 1987A (blue upward triangles) [121, 122, 123], and IIn SNe 2005ip (crosses) [124, 125], 2006jd (squares) [125], and 2010jl (green downward triangles) [126, 10]. As shown in Figure 6, the amount of dust formed by SN 2018evt is equivalent to those formed in CC SNe.
We also remark that at day , the MIR flux excess measured in band 2 (CH2 or W2) is higher than or comparable to that in band 1 (CH1 or W1), indicating a higher dust emission efficiency towards longer wavelengths. This manner is compatible with the large (m) graphite dust particles in the primordial CSM shells suggested by our single-shell and double-shell models to the time-evolution of the MIR excess at day 310.
The m graphite dust model provides satisfactory fits to both the MIR photometry in bands 1 and 2 at day (see Figures 2 and 4). The indicated best-fitting radius of the newly-formed dust grains also falls within the 0.01 to 1 m range of the typical size of the graphite dust grains (e.g., [110, 109]). However, the species of the newly-formed dust grains may still not be inferred based on our observations as no spectral signatures of CO overtone bands at 2.3-2.5 m were seen from our NIR spectra shown in Extended Data Figure 3, see also SN 2017eaw [127]. Additionally, we are not aware of any observation of SN 2018evt conducted at 9 m, which may discriminate the silicate and graphite dust models [113, 110]. Therefore, we also present the results computed for m silicate and graphite dust grains in Figure 6 and Extended Data Table 1.
3 The progenitor’s mass loss
Before the SN explosion, the progenitor mass-loss rate can be associated with the bolometric luminosity via a factor , which denotes the kinetic-to-radiation energy conversion efficiency. Assuming a steady stellar wind CSM (s=2 in [29]), the bolometric luminosity can be written as:
| (3) |
where represents the kinetic energy of the thin shocked shell. The efficiency factor is often assumed between 0.1 and 0.5 [110, 29, 128, 129]. We adopted and km s-1, the latter is consistent with the typical FWHM velocity of the intermediate H component measured over our spectroscopic campaign on SN 2018evt. The wind velocity blown from the progenitor was taken from the P-Cygni feature reported in [20], km s-1. A similar velocity was only observed in the unshocked CSM of PTF11kx [130] ( 65 km s-1), an SN 1999aa-like SN, which exhibits multiple CSM components but displays no signature of the ejecta-CSM interactions based on the early-time observations [130, 131].
A sudden decrease in the optical light curves of SN 2018evt can be seen at day 530, indicating the formation of new dust grains in the CDS (e.g., Figure 1 and Extended Data Figure 4). Following the prescription in [20], we approximate the optical bolometric luminosity () of SN 2018evt by integrating its SED at day 530 over the optical wavelength range (38709000 Å). The day 530 SED was obtained by warping the day 264 flux spectrum to match the band photometry at day 530. Therefore, the estimated erg s-1 at day yields a mass loss rate of
| (4) |
The mass of shocked CSM around SN 2018evt can be estimated by multiplying the mass-loss rate to the duration of the shock propagation () as approximated by the phase of the measurement days, which can be expressed as
| (5) |
At such late phases of SN 2018evt, the dominant radiation source in the IR can be well attributed to the thermal emission of newly-formed dust (see Figure 2). Thanks to the MIR observations at day 517, a phase comparable to , we estimate the optical-to-MIR pseudo-bolometric luminosity of SN 2018evt by integrating the SED over a wavelength range of 3870 Å–5 m (see Figure 2). The computed erg s-1 at day indicates a mass-loss rate 0.09 M⊙ yr-1. Therefore, the corresponding mass of the shocked CSM can be estimated to be 4.5 M⊙.
At day , adopting a shock velocity 6000 km s-1 estimated by the FWHM width of the broad H component (see [20] and Figure 3), and an optical bolometric luminosity erg s-1, following Equations (4) and (5), the corresponding mass-loss rate and the mass of the shocked CSM yield 0.001 M⊙ yr-1 and 0.2 M⊙, respectively. If we include the emission in the MIR by adopting erg s-1, the corresponding and can be estimated to be 0.003 yr-1 and 0.5 , respectively.
In the literature, the luminosity of H line serves as a good indicator of the bolometric luminosity as has found to be proportional to [132, 104, 105, 133, 106]. can be expressed as
| (6) |
where denotes the efficiency of the conversion of the dissipated kinetic energy into Hα luminosity in the shock wave. For SN 2018evt at day , we measured (Extended Data Table 2). Thus we can get
| (7) |
4 The dust contributions of host galaxies by SNIa-CSM events
The far-infrared (FIR) observations of the elliptical/lenticular (E/S0) galaxies by the Herschel Space Observatory suggest that the typical dust mass of such galaxies spans 104 to 107 M⊙ [134, 135]. While average dust mass found in all types of galaxies in the local universe gives 105.21±0.09 M⊙. Many dwarf elliptical galaxies exhibit dust masses less than 105 M⊙ [136].
Based on our optical-to-MIR observing campaign on SN 2018evt extended to day , we suggest that a total amount of 0.01 M⊙ newly-formed dust formed in the post-shocked region of the CDS. As the SN ejecta cools, more cold dust can be expected to form as illustrated in Figure 6. We remark that the M⊙ new dust formed in SN 2018evt is estimated only for warm dust based on the 3.6 and 4.5 m observations by NEOWISE and . If we assume it estimates the typical mass of the warm dust formed in SNe Ia, the total mass of the newly-formed dust could be higher by a factor of 10 if the bulk of the dust cools below 30 K. The studies based on the observations of the Infrared Astronomical Satellite (IRAS) suggest 90% of the dust in galaxies was missed by IRAS as IRAS or is sensitive to warm dust [137].
Depending on the detailed physical conditions, the timescale of the grain destruction could be as long as a few Gyr based on the revised self-consistent models on dust destruction efficiency of SNe [138], and other cases [139]. Moreover, the rate of SN Ia per unit mass decreases as the stellar mass of the galaxy increases (e.g., Figure 5 in [140]). In particular, SN Ia rates of and M year-1 are estimated for galaxy stellar masses of 109 and 1011 M, respectively. Assuming 0.1 M⊙ of cold dust ( K) is produced per SNIa, SNe Ia can produce on the order of - M⊙ of dust for typical elliptical galaxies. Given the uncertainties in dust mass in ellipticals ( to M⊙), SNe Ia can be responsible for % of all the dust in elliptical galaxies. Considering that the SNIa-CSM rate is about 0.02 - 0.2% of all SNe Ia [18], the dust from SNeIa-CSM may be proportionally lower than the above estimate for SNe Ia and can not be the dominant source of dust in elliptical galaxies. We note that the effect of galaxy merging is also a dust source in E/S0 galaxies as E/S0 galaxies can capture younger galaxies together with their dust. The captured dust is usually distributed in a thin disk, but dust is also present in a diffuse environment (e.g., [141]). SNIa-CSM contribution may also explain the diffuse dust.
Figures and Extended Data
Extended Data Table 1 The MIR AB magnitudes of SN 2018evt, and the parameters describe the newly-formed dust. The and magnitudes were measured from the images taken by the Infrared Array Camera (without host subtraction) and the host-subtracted and magnitudes were measured from the observations by the NEOWISE reactivation mission. The presented parameters are deduced for m, and m graphite and silicate dust grains.
| m Graphite | m Graphite | m Silicate | ||||||||
| UT Date | MJD | Phase | Temperature | Dust mass | Temperature | Dust mass | Temperature | Dust mass | ||
| (yy-mm-dd) | (day) | (mag) | (mag) | (K) | (M⊙) | (K) | (M⊙) | (K) | (M⊙) | |
| 2019-05-19 | 58622.91 | |||||||||
| 2019-06-03 | 58637.50 | |||||||||
| 2019-10-29 | 58785.62 | |||||||||
| 2019-11-09 | 58796.79 | |||||||||
| UT Date | MJD | Phase | ||||||||
| (yy-mm-dd) | (day) | (mag) | (mag) | |||||||
| 2019-01-18 | 58501.21 | |||||||||
| 2019-06-28 | 58662.37 | |||||||||
| 2020-01-20 | 58868.60 | |||||||||
| 2020-06-26 | 59026.36 | |||||||||
| 2021-01-18 | 59232.70 | |||||||||
| 2021-06-28 | 59393.48 | |||||||||
Extended Data Table 2: Log of the optical and NIR spectroscopic observations of SN 2018evt. The measured H luminosity and the equivalent width of the Ca II NIR triplet are also listed.
a * marks the spectra that are already published in [95, 20].
b Days since band maximum on MJD 58352 / 2018 August 22.
c Uncertainty is derived and assumed that all spectra have 10% flux uncertainty. Note that the distance is not included. Only the Milky Way extinction is corrected with mag, .
| UT Datea | MJD | Phaseb | Resolution | Range | Instrument/Telescope | Exposure time | Airmass | log | |
| (yy-mm-dd) | (day) | (Å) | (Å) | (s) | (log(erg s-1)) | (Å) | |||
| 2018-08-12* | 58343.00 | 15.8 | 3650-9200 | EFOSC2/NTT | 300 | 1.42 | … | … | |
| 2018-12-24* | 58476.64 | 124.64 | 15.0 | 3500-10000 | FLOYDS/2.0-m FTN | 1800 | 1.49 | ||
| 2019-01-01* | 58484.70 | 132.70 | 15.0 | 3500-10000 | FLOYDS/2.0-m FTS | 1600 | 2.09 | ||
| 2019-01-04 | 58487.94 | 135.94 | 25.0 | 3400-9100 | YFOSC/LJT | 1350 | 1.38 | … | |
| 2019-01-11* | 58494.58 | 142.58 | 15.0 | 3500-10000 | FLOYDS/2.0-m FTN | 1600 | 1.56 | ||
| 2019-01-21* | 58504.64 | 152.64 | 15.0 | 3500-10000 | FLOYDS/2.0-m FTN | 1600 | 1.18 | ||
| 2019-01-31 | 58514.89 | 162.89 | 25.0 | 3400-9100 | YFOSC/LJT | 1350 | 1.29 | … | |
| 2019-03-04* | 58546.43 | 194.43 | 15.0 | 3500-10000 | FLOYDS/2.0-m FTN | 1800 | 1.62 | ||
| 2019-02-08 | 58550.75 | 198.75 | 15.0 | 4000-9000 | BFOSC/XLT | 3300 | 1.92 | … | |
| 2019-03-17* | 58559.49 | 207.48 | 15.0 | 3500-9250 | FLOYDS/2.0-m FTN | 1800 | 1.18 | ||
| 2019-02-20 | 58562.75 | 210.75 | 15.0 | 4000-9000 | BFOSC/XLT | 3600 | 2.46 | … | |
| 2019-03-28 | 58570.73 | 218.73 | 25.0 | 3400-9100 | YFOSC/LJT | 1500 | 1.31 | … | |
| 2019-03-30* | 58572.49 | 220.49 | 15.0 | 3500-10000 | FLOYDS/2.0-m FTN | 1800 | 1.17 | ||
| 2019-04-13 | 58586.75 | 234.75 | 15.0 | 4000-9000 | BFOSC/XLT | 2700 | 1.63 | … | |
| 2019-04-23* | 58596.66 | 244.66 | 15.0 | 3500-10000 | FLOYDS/2.0-m FTS | 2700 | 1.31 | … | |
| 2019-04-26 | 58599.30 | 247.30 | 15.8 | 3650-9200 | EFOSC/NTT | 1500 | 1.51 | ||
| 2019-05-11* | 58614.39 | 262.39 | 15.0 | 3500-10000 | FLOYDS/2.0-m FTN | 2699 | 1.19 | ||
| 2019-05-13 | 58616.22 | 264.22 | 15.8 | 3650-9200 | EFOSC/NTT | 1499 | 1.28 | ||
| 2019-05-20 | 58623.69 | 271.69 | 25.0 | 3400-9100 | YFOSC/LJT | 2000 | 1.34 | … | |
| 2019-06-09 | 58643.14 | 291.14 | 15.8 | 3650-9200 | EFOSC/NTT | 1800 | 1.24 | ||
| 2019-06-09* | 58643.37 | 291.37 | 15.0 | 3500-10000 | FLOYDS/2.0-m FTN | 2700 | 1.40 | ||
| 2019-06-24 | 58658.50 | 306.50 | … | 3000-9500 | WiFes/ANU | 1200 | … | … | |
| 2019-07-15* | 58679.25 | 327.25 | 15.0 | 3500-10000 | FLOYDS/2.0-m FTN | 3600 | 1.36 | ||
| 2019-08-08 | 58703.04 | 351.04 | 15.8 | 3650-9200 | EFOSC/NTT | 2699 | 1.88 | ||
| 2019-08-22* | 58717.37 | 365.37 | 15.0 | 3800-10000 | FLOYDS/2.0-m FTN | 3600 | 1.76 | ||
| 2019-12-24 | 58841.62 | 489.62 | 15.0 | 3500-10000 | FLOYDS/2.0-m FTN | 3600 | 1.54 | ||
| 2020-01-19 | 58867.57 | 515.57 | 15.0 | 3500-10000 | FLOYDS/2.0-m FTN | 3600 | 1.42 | ||
| 2020-02-03 | 58882.54 | 530.54 | 15.0 | 3500-10000 | FLOYDS/2.0-m FTN | 3600 | 1.34 | ||
| 2020-02-19 | 58898.29 | 546.29 | 15.8 | 3650-9200 | EFOSC/NTT | 2700 | 1.12 | … | |
| 2020-03-23 | 58931.31 | 579.32 | 15.8 | 3650-9200 | EFOSC2/NTT | 2700 | 1.12 | … | |
| 2018-12-24 | 58476.65 | 7000-25000 | SpeX/IRTF | 1.45 | … | ||||
| 2019-01-01 | 58484.56 | 8000-25000 | GNIRS/Gemini North | 1.69 | … | ||||
| 2019-01-08 | 58491.63 | 8000-25000 | GNIRS/Gemini North | 1.28 | … | ||||
| 2019-05-11 | 58614.40 | 7000-25000 | SpeX/IRTF | 1.17 | … | ||||
| 2019-05-16 | 58619.22 | 7800-25000 | FIRE/Magellan Baade | 126.812 | 1.26 | … | |||
| 2019-06-17 | 58651.30 | 7000-25000 | SpeX/IRTF | 1.17 | … | ||||
| 2019-07-12 | 58676.03 | 7800-25000 | FIRE/Magellan Baade | 126.88 | 1.13 | … | |||
| 2020-01-19 | 58867.64 | 7000-25000 | SpeX/IRTF | 1.18 | … |
Appendix A Data availability
The data that support the findings of this study are openly available in Science Data Bank at https://www.doi.org/10.57760/sciencedb.07968[142] or http://resolve.pid21.cn/31253.11.sciencedb.07968. The global network photometry at Las Cumbres Observatory is also available in the figshare repository https://doi.org/10.6084/m9.figshare.21543558. All spectra will also be made publicly available via Weizmann Interactive Supernova Data Repository. ATLAS [58, 59] forced photometry service is available at https://fallingstar-data.com/forcedphot/queue/. All-Sky Automated Survey for Supernovae (ASAS-SN [60, 61]) sky patrol interface is available at https://asas-sn.osu.edu/. Spitzer Heritage Archive (SHA) is available at http://irsa.ipac.caltech.edu/applications/Spitzer/SHA/. NEOWISE coadded images and ALLWISE source Catalog are available at https://irsa.ipac.caltech.edu/applications/ICORE/, and https://irsa.ipac.caltech.edu/cgi-bin/Gator/nph-scan?submit=Select&projshort=WISE. Pan-STARRS database [52] is available at https://catalogs.mast.stsci.edu/panstarrs.
Appendix B Code Availability
SFFT [68] package used for image subtraction are publicly available at https://github.com/thomasvrussell/sfft. IRAF soft used for spectra reduction is available at http://iraf.net/. BANZAI automatic pipeline used for image reductions at Las Cumbres Observatory is available at https://lco.global/documentation/data/BANZAIpipeline/. SExtractor [62] and PSFEx [50] softwares used for photometry are available at https://www.astromatic.net/software/sextractor/, and https://www.astromatic.net/software/psfex/.
Appendix C Acknowledgements
This work is sponsored (in part) by the Chinese Academy of Sciences (CAS), through a grant to the CAS South America Center for Astronomy (CASSACA) in Santiago, Chile. L.F.W. acknowledges support from National Science Foundation under grant No.-AST1817099. M.H. acknowledges support from the National Natural Science Foundation of China (grant no. 12321003), the Major Science and Technology Project of Qinghai Province (2019-ZJ-A10) and the Jiangsu Funding Program for Excellent Postdoctoral Talent. L.H. acknowledges support from Jiangsu Funding Program for Excellent Postdoctoral Talent and China Postdoctoral Science Foundation (Grant No. 2022M723372). Y.Y. appreciates the generous financial support provided to the supernova group at U.C. Berkeley (PI: Alexei V. Filippenko) by Gary and Cynthia Bengier, Clark and Sharon Winslow, Sanford Robertson, and numerous other donors. T.W.C. acknowledges the Yushan Young Fellow Program by the Ministry of Education, Taiwan for the financial support. X.W. acknowledges support from the National Natural Science Foundation of China under grants No. 11633002 and 11761141001. J.B., D.H., D.A.H., C.M., C.P., and E.P.G. from the GSP team at Las Cumbres Observatory are supported by NSF grants AST-1911225 and AST-1911151. P.H., E.Y.H., C.A., N.M., M.M.P., M.Sh., and M.D.S. from CSP-II group have been funded by the NSF under grants AST-1613426, AST-1613455, and AST-16133472. J.C.W. is supported in part by NSF grant 1813825, by a DOE grant to the Wooten Center for Astrophysical Plasma Properties (WCAPP; PI Don Winget), and by grant G09-20065C from the Chandra Observatory. L.G. acknowledges financial support from the Spanish Ministerio de Ciencia e Innovación (MCIN), the Agencia Estatal de Investigación (AEI) 10.13039/501100011033, and the European Social Fund (ESF) ”Investing in your future” under the 2019 Ramón y Cajal program RYC2019-027683-I and the PID2020-115253GA-I00 HOSTFLOWS project, from Centro Superior de Investigaciones Científicas (CSIC) under the PIE project 20215AT016, and the program Unidad de Excelencia María de Maeztu CEX2020-001058-M. Research by D.J.S. is supported by NSF grants AST-1821967, 1821987, 1813708, 1813466, 1908972, and by the Heising-Simons Foundation under grant #2020-1864. G.P. acknowledges support from the Millennium Science Initiative ICN12_009. M.Sh. is a visiting astronomer at the Infrared Telescope Facility, which is operated by the University of Hawaii under contract NNH14CK55B with the National Aeronautics and Space Administration. T.E.M.B. acknowledges financial support from the Spanish Ministerio de Ciencia e Innovación (MCIN), the Agencia Estatal de Investigación (AEI) 10.13039/501100011033 under the PID2020-115253GA-I00 HOSTFLOWS project, from Centro Superior de Investigaciones Científicas (CSIC) under the PIE project 20215AT016 and the I-LINK 2021 LINKA20409, and the program Unidad de Excelencia María de Maeztu CEX2020-001058-M. M.N. is supported by the European Research Council (ERC) under the European Union’s Horizon 2020 research and innovation programme (grant agreement No. 948381) and by a Fellowship from the Alan Turing Institute. M.G. is supported by the EU Horizon 2020 research and innovation programme under grant agreement No 101004719. A.M.G. acknowledges financial support by the European Union under the 2014-2020 ERDF Operational Programme and by the Department of Economic Transformation, Industry, Knowledge, and Universities of the Regional Government of Andalusia through the FEDER-UCA18-107404 grant. M.D.S. is funded in part by the Independent Research Fund Denmark (IRFD, grant number 10.46540/2032-00022B ). S.Y. is supported by the National Natural Science Foundation of China under Grant No. 12303046.
This work makes use of observations from the Las Cumbres Observatory global telescope network.
This publication makes use of data products from the Near-Earth Object Wide-field Infrared Survey Explorer (NEOWISE), which is a joint project of the Jet Propulsion Laboratory/California Institute of Technology and the University of Arizona. NEOWISE is funded by the National Aeronautics and Space Administration.
Based on observations obtained at the Gemini Observatory under programs GN-2018B-Q-136 (PI: Sand). Gemini is operated by the Association of Universities for Research in Astronomy, Inc., under a cooperative agreement with the NSF on behalf of the Gemini partnership: the NSF (United States), the National Research Council (Canada), CONICYT (Chile), Ministerio de Ciencia, Tecnología e Innovación Productiva (Argentina), and Ministério da Ciência, Tecnologia e Inovação (Brazil). The data were processed using the Gemini IRAF package. We thank the queue service observers and technical support staff at Gemini Observatory for their assistance.
Based on observations collected at the European Organisation for Astronomical Research in the Southern Hemisphere, Chile, as part of ePESSTO and ePESSTO+ (the advanced Public ESO Spectroscopic Survey for Transient Objects Survey). ePESSTO observation was obtained under ESO program ID 199.D-0143 (PI: Smartt). ePESSTO+ observations were obtained under ESO programs ID 1103.D-0328 and 106.216C (PI: Inserra).
We have made use of the data with Magellan Baade/FIRE through CNTAC proposal IDs: CN2019B-8, CN2020B-23, (PI: Wang).
We have also made use of the NASA/IPAC Extragalactic Database (NED) which is operated by the Jet Propulsion
Laboratory, California Institute of Technology, under contract with the National Aeronautics and Space Administration.
Author contributions
L.Z.W. and L.F.W. wrote the manuscript. L.Z.W. planned the FIRE observations, reduced the NEOWISE and Spitzer images, compiled the whole dataset, and led the photometric, spectroscopic, and physical analysis. M.H. conducted the SED modeling of the data and contributed to the photometric data analysis. L.F.W. initiated the project and contributed to physical interpretation. Y.Y. read the manuscript very carefully, offered very helpful comments to polish the paper, and also contributed to physical interpretation. J.Y. carried out the subtraction of the image through SFFT and reduced images from the global network. H.G. provided helpful comments on the dust in SNe. S.C. obtained the Spitzer images. L.H. helped with the subtraction of the NEOWISE image through SFFT. G.P. and L.Y. helped with the FIRE observations. C.C. helped with the calibration of the Spitzer images. D. B., P.H., and J.C.W. provided very helpful comments that improved the paper. J.B., D.H., D.A.H., C.M., C.P., and E.P.G. from GSP group provided the extensive -band photometry and FLOYDS spectra. P.H., E.Y.H., C.A., N.M., M.M.P., M.Sh., and M.D.S. from CSP group provided FIRE and SpeX spectra. D.J.S. provided the GNIRS spectra. T.W.C, L.G., J.P.A., M.G., C.I., A.M.G., T.E.M.B., M.N., J.P.G., M.S., S.S., S.Y., and D.R.Y. from ePESSTO group provided NTT spectra. J.M., X.W., H.L., H.S., and X.Z. provided TNTS photometry and spectra. J.Z. provided LJT photometry and spectra. S.A.U. provided a WiFeS spectrum.
Competing interests
The authors declare no competing interests.
References
- [1] Morgan, H. L. & Edmunds, M. G. Dust formation in early galaxies. Mon. Not. R. Astron. Soc. 343, 427–442 (2003).
- [2] Matsuura, M. et al. The global gas and dust budget of the Large Magellanic Cloud: AGB stars and supernovae, and the impact on the ISM evolution. Mon. Not. R. Astron. Soc. 396, 918–934 (2009).
- [3] Hoflich, P., Khokhlov, A. & Wheeler, C. Type IA supernovae: Pulsating delayed detonation models, IR light curves, and the formation of molecules. In Haas, M. R., Davidson, J. A. & Erickson, E. F. (eds.) From Gas to Stars to Dust, vol. 73 of Astronomical Society of the Pacific Conference Series (1995).
- [4] Ferrara, A. & Peroux, C. Late-time cosmic evolution of dust: solving the puzzle. Mon. Not. R. Astron. Soc. 503, 4537–4543 (2021).
- [5] Rho, J. et al. Freshly Formed Dust in the Cassiopeia A Supernova Remnant as Revealed by the Spitzer Space Telescope. Astrophys. J. 673, 271–282 (2008).
- [6] Barlow, M. J. et al. A Herschel PACS and SPIRE study of the dust content of the Cassiopeia A supernova remnant. Astron. Astrophys. 518, L138 (2010).
- [7] Matsuura, M. et al. Herschel Detects a Massive Dust Reservoir in Supernova 1987A. Science 333, 1258 (2011).
- [8] Gomez, H. L. et al. A Cool Dust Factory in the Crab Nebula: A Herschel Study of the Filaments. Astrophys. J. 760, 96 (2012).
- [9] Smith, N. et al. Coronal Lines and Dust Formation in SN 2005ip: Not the Brightest, but the Hottest Type IIn Supernova. Astrophys. J. 695, 1334–1350 (2009).
- [10] Gall, C. et al. Rapid formation of large dust grains in the luminous supernova 2010jl. Nature 511, 326–329 (2014).
- [11] Gerardy, C. L. et al. Signatures of Delayed Detonation, Asymmetry, and Electron Capture in the Mid-Infrared Spectra of Supernovae 2003hv and 2005df. Astrophys. J. 661, 995–1012 (2007).
- [12] Gomez, H. L. et al. Dust in historical Galactic Type Ia supernova remnants with Herschel. Mon. Not. R. Astron. Soc. 420, 3557–3573 (2012).
- [13] Silverman, J. M. et al. Type Ia Supernovae Strongly Interacting with Their Circumstellar Medium. Astrophys. J. Suppl. 207, 3 (2013).
- [14] Hamuy, M. et al. An asymptotic-giant-branch star in the progenitor system of a type Ia supernova. Nature 424, 651–654 (2003).
- [15] Wang, L. et al. On the Hydrogen Emission from the Type Ia Supernova SN 2002ic. Astrophys. J. 604, L53–L56 (2004).
- [16] Deng, J. et al. Subaru Spectroscopy of the Interacting Type Ia Supernova SN 2002ic: Evidence of a Hydrogen-rich, Asymmetric Circumstellar Medium. Astrophys. J. 605, L37–L40 (2004).
- [17] Wood-Vasey, W. M., Wang, L. & Aldering, G. Photometry of SN 2002ic and Implications for the Progenitor Mass-Loss History. Astrophys. J. 616, 339–345 (2004).
- [18] Sharma, Y. et al. A Systematic Study of Ia-CSM Supernovae from the ZTF Bright Transient Survey. Astrophys. J. 948, 52 (2023).
- [19] Nicholls, B. & Dong, S. ASAS-SN Transient Discovery Report for 2018-08-11. Transient Name Server Discovery Report 2018-1144, 1 (2018).
- [20] Yang, Y. et al. The interaction of supernova 2018evt with a substantial amount of circumstellar matter - An SN 1997cy-like event. Mon. Not. R. Astron. Soc. 519, 1618–1647 (2023).
- [21] Ruiz-Lapuente, P. et al. Modeling the Iron-dominated Spectra of the Type IA Supernova SN 1991T at Premaximum. Astrophys. J. 387, L33 (1992).
- [22] Jeffery, D. J. et al. Analysis of the Photospheric Epoch Spectra of Type IA Supernovae SN 1990N and SN 1991T. Astrophys. J. 397, 304 (1992).
- [23] Ganeshalingam, M., Li, W. & Filippenko, A. V. The rise-time distribution of nearby Type Ia supernovae. Mon. Not. R. Astron. Soc. 416, 2607–2622 (2011).
- [24] Werner, M. W. et al. The Spitzer Space Telescope Mission. Astrophys. J. Suppl. 154, 1–9 (2004).
- [25] Fazio, G. G. et al. The Infrared Array Camera (IRAC) for the Spitzer Space Telescope. Astrophys. J. Suppl. 154, 10–17 (2004).
- [26] Mainzer, A. et al. Initial Performance of the NEOWISE Reactivation Mission. Astrophys. J. 792, 30 (2014).
- [27] Kotak, R., Meikle, W. P. S., Adamson, A. & Leggett, S. K. On the nature of the circumstellar medium of the remarkable Type Ia/IIn supernova SN 2002ic. Mon. Not. R. Astron. Soc. 354, L13–L17 (2004).
- [28] Chugai, N. N., Chevalier, R. A. & Lundqvist, P. Circumstellar interaction of the type Ia supernova 2002ic. Mon. Not. R. Astron. Soc. 355, 627–637 (2004).
- [29] Moriya, T. J. et al. An analytic bolometric light curve model of interaction-powered supernovae and its application to Type IIn supernovae. Mon. Not. R. Astron. Soc. 435, 1520–1535 (2013).
- [30] Sarangi, A., Dwek, E. & Arendt, R. G. Delayed Shock-induced Dust Formation in the Dense Circumstellar Shell Surrounding the Type IIn Supernova SN 2010jl. Astrophys. J. 859, 66 (2018).
- [31] Szalai, T., Zsíros, S., Fox, O. D., Pejcha, O. & Müller, T. A Comprehensive Analysis of Spitzer Supernovae. Astrophys. J. Suppl. 241, 38 (2019).
- [32] Sarangi, A. & Slavin, J. D. Dust Production in a Thin Dense Shell in Supernovae with Early Circumstellar Interactions. Astrophys. J. 933, 89 (2022).
- [33] Fox, O. D. et al. Disentangling the Origin and Heating Mechanism of Supernova Dust: Late-time Spitzer Spectroscopy of the Type IIn SN 2005ip. Astrophys. J. 725, 1768–1778 (2010).
- [34] Smith, N., Chornock, R., Silverman, J. M., Filippenko, A. V. & Foley, R. J. Spectral Evolution of the Extraordinary Type IIn Supernova 2006gy. Astrophys. J. 709, 856–883 (2010).
- [35] Fox, O. D. & Filippenko, A. V. The Late-time Rebrightening of Type Ia SN 2005gj in the Mid-infrared. Astrophys. J. 772, L6 (2013).
- [36] Wang, L. & Wheeler, J. C. Polarization of SN 1987A Revisited. Astrophys. J. 462, L27 (1996).
- [37] Wang, L. Dust around Type Ia Supernovae. Astrophys. J. 635, L33–L36 (2005).
- [38] Lucy, L. B., Danziger, I. J., Gouiffes, C. & Bouchet, P. Dust Condensation in the Ejecta of SN 1987 A. In Tenorio-Tagle, G., Moles, M. & Melnick, J. (eds.) IAU Colloq. 120: Structure and Dynamics of the Interstellar Medium, vol. 350, 164 (Springer-Verlag Berlin Heidelberg New York, 1989).
- [39] Smith, N. et al. PTF11iqb: cool supergiant mass-loss that bridges the gap between Type IIn and normal supernovae. Mon. Not. R. Astron. Soc. 449, 1876–1896 (2015).
- [40] Wang, L. & Wheeler, J. C. Spectropolarimetry of supernovae. Annual Review of Astronomy and Astrophysics 46, 433–474 (2008). URL https://doi.org/10.1146/annurev.astro.46.060407.145139. https://doi.org/10.1146/annurev.astro.46.060407.145139.
- [41] Tricco, T. S., Price, D. J. & Laibe, G. Is the dust-to-gas ratio constant in molecular clouds? Mon. Not. R. Astron. Soc. 471, L52–L56 (2017).
- [42] Inserra, C. et al. On Type IIn/Ia-CSM supernovae as exemplified by SN 2012ca*. Mon. Not. R. Astron. Soc. 459, 2721–2740 (2016).
- [43] Soker, N., Kashi, A., García-Berro, E., Torres, S. & Camacho, J. Explaining the Type Ia supernova PTF 11kx with a violent prompt merger scenario. Mon. Not. R. Astron. Soc. 431, 1541–1546 (2013).
- [44] Meng, X. & Podsiadlowski, P. A common-envelope wind model for Type Ia supernovae - I. Binary evolution and birth rate. Mon. Not. R. Astron. Soc. 469, 4763–4787 (2017).
- [45] Meng, X. & Podsiadlowski, P. Do SN 2002cx-like and SN Ia-CSM Objects Share the Same Origin? Astrophys. J. 861, 127 (2018).
- [46] Höfner, S. & Olofsson, H. Mass loss of stars on the asymptotic giant branch. Mechanisms, models and measurements. Astron. Astrophys. Rev. 26, 1 (2018).
- [47] Irani, I. et al. Less Than 1% of Core-collapse Supernovae in the Local Universe Occur in Elliptical Galaxies. Astrophys. J. 927, 10 (2022).
- [48] Pipino, A. et al. The chemical evolution of elliptical galaxies with stellar and QSO dust production. Astron. Astrophys. 525, A61 (2011).
- [49] Jones, D. H. et al. The 6dF Galaxy Survey: final redshift release (DR3) and southern large-scale structures. Mon. Not. R. Astron. Soc. 399, 683–698 (2009).
- [50] Bertin, E. Automatic Astrometric and Photometric Calibration with SCAMP. In Gabriel, C., Arviset, C., Ponz, D. & Enrique, S. (eds.) Astronomical Data Analysis Software and Systems XV, vol. 351 of Astronomical Society of the Pacific Conference Series, 112 (2006).
- [51] Wang, L. et al. Optical and Near-infrared Observations of the Nearby SN Ia 2017cbv. Astrophys. J. 904, 14 (2020).
- [52] Tonry, J. L. et al. The Pan-STARRS1 Photometric System. Astrophys. J. 750, 99 (2012).
- [53] Chambers, K. C. et al. The Pan-STARRS1 Surveys. ArXiv e-prints (2016).
- [54] Johnson, H. L. Astronomical Measurements in the Infrared. Annu. Rev. Astron. Astrophys. 4, 193 (1966).
- [55] Jester, S. et al. The Sloan Digital Sky Survey View of the Palomar-Green Bright Quasar Survey. Astron. J. 130, 873–895 (2005).
- [56] Jordi, K., Grebel, E. K. & Ammon, K. Empirical color transformations between SDSS photometry and other photometric systems. Astron. Astrophys. 460, 339–347 (2006).
- [57] Lupton, R. H. et al. Dissecting the Milky Way with SDSS - I: Stellar Overdensities. In American Astronomical Society Meeting Abstracts, vol. 207 of American Astronomical Society Meeting Abstracts, 133.08 (2005).
- [58] Tonry, J. L. et al. ATLAS: A High-cadence All-sky Survey System. Publ. Astron. Soc. Pac. 130, 064505 (2018).
- [59] Smith, K. W. et al. Design and Operation of the ATLAS Transient Science Server. Publ. Astron. Soc. Pac. 132, 085002 (2020).
- [60] Shappee, B. et al. All Sky Automated Survey for SuperNovae (ASAS-SN or ”Assassin”). In American Astronomical Society Meeting Abstracts #223, vol. 223 of American Astronomical Society Meeting Abstracts, 236.03 (2014).
- [61] Kochanek, C. S. et al. The All-Sky Automated Survey for Supernovae (ASAS-SN) Light Curve Server v1.0. Publ. Astron. Soc. Pac. 129, 104502 (2017).
- [62] Bertin, E. & Arnouts, S. SExtractor: Software for source extraction. Astron. Astrophys. Suppl. Ser. 117, 393–404 (1996).
- [63] Fukugita, M. et al. The Sloan Digital Sky Survey Photometric System. Astron. J. 111, 1748 (1996).
- [64] Wright, E. L. et al. The Wide-field Infrared Survey Explorer (WISE): Mission Description and Initial On-orbit Performance. Astron. J. 140, 1868–1881 (2010).
- [65] Mainzer, A. et al. Initial Performance of the NEOWISE Reactivation Mission. Astrophys. J. 792, 30 (2014).
- [66] Masci, F. J. & Fowler, J. W. AWAIC: A WISE Astronomical Image Co-adder. In Bohlender, D. A., Durand, D. & Dowler, P. (eds.) Astronomical Data Analysis Software and Systems XVIII, vol. 411 of Astronomical Society of the Pacific Conference Series, 67 (2009).
- [67] Masci, F. ICORE: Image Co-addition with Optional Resolution Enhancement. arXiv e-prints arXiv:1301.2718 (2013).
- [68] Hu, L., Wang, L., Chen, X. & Yang, J. Image Subtraction in Fourier Space. Astrophys. J. 936, 157 (2022).
- [69] Jarrett, T. H. et al. The Spitzer-WISE Survey of the Ecliptic Poles. Astrophys. J. 735, 112 (2011).
- [70] Graham, M. L. et al. Nebular-phase spectra of nearby Type Ia Supernovae. Mon. Not. R. Astron. Soc. 472, 3437–3454 (2017).
- [71] Inserra, C. et al. SN2012ca: a stripped envelope core-collapse SN interacting with dense circumstellar medium. Mon. Not. R. Astron. Soc. 437, L51–L55 (2014).
- [72] Szalai, T. et al. Spitzer’s Last Look at Extragalactic Explosions: Long-term Evolution of Interacting Supernovae. Astrophys. J. 919, 17 (2021).
- [73] Kool, E. C. et al. A radio-detected type Ia supernova with helium-rich circumstellar material. Nature 617, 477–482 (2023).
- [74] Stetson, P. B. The Center of the Core-Cusp Globular Cluster M15: CFHT and HST Observations, ALLFRAME Reductions. Publ. Astron. Soc. Pac. 106, 250 (1994).
- [75] Henden, A. A. et al. VizieR Online Data Catalog: AAVSO Photometric All Sky Survey (APASS) DR9 (Henden+, 2016). VizieR Online Data Catalog II/336 (2016).
- [76] Zhang, T.-M. et al. The THU-NAOC transient survey: the performance and results from the first year. Research in Astronomy and Astrophysics 15, 215–224 (2015).
- [77] Zhang, J.-J. et al. Optical and Ultraviolet Observations of the Narrow-lined Type Ia SN 2012fr in NGC 1365. Astron. J. 148, 1 (2014).
- [78] Buzzoni, B. et al. The ESO Faint Object Spectrograph and Camera / EFOSC. The Messenger 38, 9 (1984).
- [79] Smartt, S. J. et al. PESSTO: survey description and products from the first data release by the Public ESO Spectroscopic Survey of Transient Objects. Astron. Astrophys. 579, A40 (2015).
- [80] Fan, Z. et al. The Xinglong 2.16-m Telescope: Current Instruments and Scientific Projects. Publ. Astron. Soc. Pac. 128, 115005 (2016).
- [81] Dopita, M. et al. The Wide Field Spectrograph (WiFeS). Astrophys. Space Sci. 310, 255–268 (2007).
- [82] Sand, D. J., Brown, T., Haynes, R. & Dubberley, M. Floyds: A Robotic Spectrograph for the Faulkes Telescopes. In American Astronomical Society Meeting Abstracts #218, vol. 218 of American Astronomical Society Meeting Abstracts, 132.03 (2011).
- [83] Rayner, J. T. et al. SpeX: A Medium-Resolution 0.8-5.5 Micron Spectrograph and Imager for the NASA Infrared Telescope Facility. Publ. Astron. Soc. Pac. 115, 362–382 (2003).
- [84] Simcoe, R. A. et al. FIRE: A Facility Class Near-Infrared Echelle Spectrometer for the Magellan Telescopes. Publ. Astron. Soc. Pac. 125, 270 (2013).
- [85] Elias, J. H. et al. Design of the Gemini near-infrared spectrograph. In McLean, I. S. & Iye, M. (eds.) Society of Photo-Optical Instrumentation Engineers (SPIE) Conference Series, vol. 6269 of Society of Photo-Optical Instrumentation Engineers (SPIE) Conference Series, 62694C (2006).
- [86] Cushing, M. C., Vacca, W. D. & Rayner, J. T. Spextool: A Spectral Extraction Package for SpeX, a 0.8-5.5 Micron Cross-Dispersed Spectrograph. Publ. Astron. Soc. Pac. 116, 362–376 (2004).
- [87] Hsiao, E. Y. et al. Strong near-infrared carbon in the Type Ia supernova iPTF13ebh. Astron. Astrophys. 578, A9 (2015).
- [88] Hsiao, E. Y. et al. Carnegie Supernova Project-II: The Near-infrared Spectroscopy Program. Publ. Astron. Soc. Pac. 131, 014002 (2019).
- [89] Schlafly, E. F. & Finkbeiner, D. P. Measuring Reddening with Sloan Digital Sky Survey Stellar Spectra and Recalibrating SFD. Astrophys. J. 737, 103 (2011).
- [90] da Costa, L. N. et al. The Southern Sky Redshift Survey. Astron. J. 116, 1–7 (1998).
- [91] Theureau, G. et al. Kinematics of the local universe . XII. 21-cm line measurements of 586 galaxies with the new Nançay receiver. Astron. Astrophys. 430, 373–383 (2005).
- [92] Greiner, J. et al. GROND—a 7-Channel Imager. Publ. Astron. Soc. Pac. 120, 405 (2008).
- [93] Prieto, J. L. et al. A Study of the Type Ia/IIn Supernova 2005gj from X-ray to the Infrared: Paper I. arXiv e-prints arXiv:0706.4088 (2007).
- [94] Aldering, G. et al. Nearby supernova factory observations of SN 2005gj: Another type ia supernova in a massive circumstellar envelope. The Astrophysical Journal 650, 510–527 (2006). URL https://doi.org/10.1086\%2F507020.
- [95] Stein, R., Callis, E., Kostrzewa-rutkowska, Z., Fraser, M. & Yaron, O. ePESSTO Transient Classification Report for 2018-08-13. Transient Name Server Classification Report 2018-1168, 1 (2018).
- [96] Filippenko, A. V. et al. The Peculiar Type IA SN 1991T: Detonation of a White Dwarf? Astrophys. J. 384, L15 (1992).
- [97] Mazzali, P. A., Danziger, I. J. & Turatto, M. A study of the properties of the peculiar SN IA 1991T through models of its evolving early-time spectrum. Astron. Astrophys. 297, 509 (1995).
- [98] Lira, P. et al. Optical Light Curves of the Type IA Supernovae SN 1990N and SN 1991T. Astron. J. 115, 234–246 (1998).
- [99] Phillips, M. M. et al. The Absolute Magnitudes of 1991T-like Supernovae. Astrophys. J. 938, 47 (2022).
- [100] Chugai, N. N. Broad emission lines from the opaque electron-scattering environment of SN 1998S. Mon. Not. R. Astron. Soc. 326, 1448–1454 (2001).
- [101] Smith, N. et al. SN 2006tf: Precursor Eruptions and the Optically Thick Regime of Extremely Luminous Type IIn Supernovae. Astrophys. J. 686, 467–484 (2008).
- [102] Smith, N., Chornock, R., Silverman, J. M., Filippenko, A. V. & Foley, R. J. Spectral Evolution of the Extraordinary Type IIn Supernova 2006gy. Astrophys. J. 709, 856–883 (2010).
- [103] Fransson, C. et al. High-density Circumstellar Interaction in the Luminous Type IIn SN 2010jl: The First 1100 Days. Astrophys. J. 797, 118 (2014).
- [104] Kiewe, M. et al. Caltech Core-Collapse Project (CCCP) Observations of Type IIn Supernovae: Typical Properties and Implications for Their Progenitor Stars. Astrophys. J. 744, 10 (2012).
- [105] Taddia, F. et al. Carnegie Supernova Project: Observations of Type IIn supernovae. Astron. Astrophys. 555, A10 (2013).
- [106] Kokubo, M. et al. A Long-duration Luminous Type IIn Supernova KISS15s: Strong Recombination Lines from the Inhomogeneous Ejecta-CSM Interaction Region and Hot Dust Emission from Newly Formed Dust. Astrophys. J. 872, 135 (2019).
- [107] Chugai, N. N. Explaining the unusual line profiles of SN 2006gy. Mon. Not. R. Astron. Soc. 464, 4415–4419 (2017).
- [108] Chugai, N. N. Type IIn SN 2010jl: probing dusty line-emitting shell. Mon. Not. R. Astron. Soc. 481, 3643–3650 (2018).
- [109] Dwek, E. et al. The Infrared Echo of SN2010jl and Its Implications for Shock Breakout Characteristics. Astrophys. J. 917, 84 (2021).
- [110] Fox, O. D. et al. A Spitzer Survey for Dust in Type IIn Supernovae. Astrophys. J. 741, 7 (2011).
- [111] Smith, N. Mass Loss: Its Effect on the Evolution and Fate of High-Mass Stars. Annu. Rev. Astron. Astrophys. 52, 487–528 (2014).
- [112] Dwek, E. The infrared echo of a type II supernova with a circumstellar dust shell : applications to SN 1979c and SN 1980k. Astrophys. J. 274, 175–183 (1983).
- [113] Draine, B. T. & Lee, H. M. Optical Properties of Interstellar Graphite and Silicate Grains. Astrophys. J. 285, 89 (1984).
- [114] Laor, A. & Draine, B. T. Spectroscopic Constraints on the Properties of Dust in Active Galactic Nuclei. Astrophys. J. 402, 441 (1993).
- [115] Weingartner, J. C. & Draine, B. T. Dust Grain-Size Distributions and Extinction in the Milky Way, Large Magellanic Cloud, and Small Magellanic Cloud. Astrophys. J. 548, 296–309 (2001).
- [116] Dwek, E. The infrared echo of type II supernovae with circumstellar dust shells. II. A probe into the presupernova evolution of the progenitor star. Astrophys. J. 297, 719–723 (1985).
- [117] Maeda, K., Nozawa, T., Nagao, T. & Motohara, K. Constraining the amount of circumstellar matter and dust around Type Ia supernovae through near-infrared echoes. Mon. Not. R. Astron. Soc. 452, 3281–3292 (2015).
- [118] Wang, X. et al. The Detection of a Light Echo from the Type Ia Supernova 2006X in M100. Astrophys. J. 677, 1060–1068 (2008).
- [119] Wang, X. et al. The Cold and Dusty Circumstellar Matter around Fast-expanding Type Ia Supernovae. Astrophys. J. 882, 120 (2019).
- [120] Fabbri, J. et al. The effects of dust on the optical and infrared evolution of SN 2004et. Mon. Not. R. Astron. Soc. 418, 1285–1307 (2011).
- [121] Spyromilio, J., Meikle, W. P. S., Learner, R. C. M. & Allen, D. A. Carbon monoxide in supernova 1987A. Nature 334, 327–329 (1988).
- [122] Ercolano, B., Barlow, M. J. & Sugerman, B. E. K. Dust yields in clumpy supernova shells: SN 1987A revisited. Mon. Not. R. Astron. Soc. 375, 753–763 (2007).
- [123] Bevan, A. & Barlow, M. J. Modelling supernova line profile asymmetries to determine ejecta dust masses: SN 1987A from days 714 to 3604. Mon. Not. R. Astron. Soc. 456, 1269–1293 (2016).
- [124] Bevan, A. et al. A decade of ejecta dust formation in the Type IIn SN 2005ip. Mon. Not. R. Astron. Soc. 485, 5192–5206 (2019).
- [125] Stritzinger, M. et al. Multi-wavelength Observations of the Enduring Type IIn Supernovae 2005ip and 2006jd. Astrophys. J. 756, 173 (2012).
- [126] Maeda, K. et al. Properties of Newly Formed Dust Grains in the Luminous Type IIn Supernova 2010jl. Astrophys. J. 776, 5 (2013).
- [127] Rho, J. et al. Near-infrared Spectroscopy of Supernova 2017eaw in 2017: Carbon Monoxide and Dust Formation in a Type II-P Supernova. Astrophys. J. 864, L20 (2018).
- [128] Moriya, T. J. et al. Mass-loss histories of Type IIn supernova progenitors within decades before their explosion. Mon. Not. R. Astron. Soc. 439, 2917–2926 (2014).
- [129] Ofek, E. O. et al. SN 2010jl: Optical to Hard X-Ray Observations Reveal an Explosion Embedded in a Ten Solar Mass Cocoon. Astrophys. J. 781, 42 (2014).
- [130] Dilday, B. et al. PTF 11kx: A Type Ia Supernova with a Symbiotic Nova Progenitor. Science 337, 942 (2012).
- [131] Silverman, J. M. et al. Late-time Spectral Observations of the Strongly Interacting Type Ia Supernova PTF11kx. Astrophys. J. 772, 125 (2013).
- [132] Salamanca, I. et al. The circumstellar medium of the peculiar supernova SN1997ab. Mon. Not. R. Astron. Soc. 300, L17–L21 (1998).
- [133] de Jaeger, T. et al. SN 2011A: A Low-luminosity Interacting Transient with a Double Plateau and Strong Sodium Absorption. Astrophys. J. 807, 63 (2015).
- [134] Smith, M. W. L. et al. The Herschel Reference Survey: Dust in Early-type Galaxies and across the Hubble Sequence. Astrophys. J. 748, 123 (2012).
- [135] Finkelman, I., Brosch, N., Funes, J. G., Kniazev, A. Y. & Väisänen, P. Ionized gas in E/S0 galaxies with dust lanes. Mon. Not. R. Astron. Soc. 407, 2475–2500 (2010).
- [136] De Looze, I. et al. The Herschel Virgo Cluster Survey . VII. Dust in cluster dwarf elliptical galaxies. Astron. Astrophys. 518, L54 (2010).
- [137] Devereux, N. A. & Young, J. S. The Gas/Dust Ratio in Spiral Galaxies. Astrophys. J. 359, 42 (1990).
- [138] Priestley, F. D. et al. Revisiting the dust destruction efficiency of supernovae. Mon. Not. R. Astron. Soc. 500, 2543–2553 (2021).
- [139] De Looze, I. et al. The dust mass in Cassiopeia A from a spatially resolved Herschel analysis. Mon. Not. R. Astron. Soc. 465, 3309–3342 (2017).
- [140] Graur, O., Bianco, F. B. & Modjaz, M. A unified explanation for the supernova rate-galaxy mass dependence based on supernovae detected in Sloan galaxy spectra. Mon. Not. R. Astron. Soc. 450, 905–925 (2015).
- [141] Goudfrooij, P. The distribution of dust and gas in elliptical galaxies. In Block, D. L. & Greenberg, J. M. (eds.) New Extragalactic Perspectives in the New South Africa, vol. 209 of Astrophysics and Space Science Library, 400 (1996).
- [142] Wang, L. et al. Newly Formed Dust within the Circumstellar Environment of SNIa-CSM 2018evt. URL https://doi.org/10.57760/sciencedb.07968.