Beyond VaR and CVaR: Topological Risk Measures in Financial Markets
Abstract
This paper introduces a novel approach to financial risk assessment by incorporating topological data analysis (TDA), specifically cohomology groups, into the evaluation of equities portfolios. The study aims to go beyond traditional risk measures like Value at Risk (VaR) and Conditional Value at Risk (CVaR), offering a more nuanced understanding of market complexities. Using last one year daily real-world closing price return data for three equities Apple, Microsoft and Google , we developed a new topological risk measure, termed ”Topological VaR Distance (TVaRD)”. Preliminary results indicate a significant change in the density of the point cloud representing the financial time series during stress conditions, suggesting that TVaRD may offer additional insights into portfolio risk and has the potential to complement existing risk management tools.
Keywords: Topological Data Analysis, Cohomology Groups, Equities, Value at Risk, Conditional Value at Risk, Market Stress Conditions, TVaRD.
MSC Code: 91G60, 91G70, 62P05, 55N99
1 Introduction
Financial markets are complex systems influenced by a myriad of factors ranging from economic indicators to investor sentiment1. Understanding and quantifying risk in such systems is crucial for both institutional investors and regulatory bodies2. Over the years, a variety of models and measures have been developed to assess financial risk, with Value at Risk (VaR) and Conditional Value at Risk (CVaR) emerging as industry standards3. These measures are particularly useful for assessing the risk associated with financial instruments, which are often subject to sudden and severe price movements4.
However, traditional risk measures have their limitations. They often rely on assumptions such as normally distributed returns or market liquidity that may not hold in real-world situations5. For example, the 2008 financial crisis exposed the inadequacies of existing risk models, leading to significant financial losses6. Such limitations have led to a search for alternative and complementary approaches to financial risk assessment7.
One promising avenue is the application of topological data analysis (TDA) to financial markets8. Topological methods, originating from the field of algebraic topology, provide a robust framework for analyzing the shape (topology) of data9. In particular, cohomology groups have been effective in capturing complex structures in various applications, from sensor networks to neuroscience10.
The application of TDA techniques to financial risk assessment is still in its nascent stages, and the existing literature primarily focuses on market modeling and asset classification11. Therefore, this paper aims to contribute to this growing field by introducing a novel topological risk measure, termed ”Topological VaR Distance (TVaRD)”. We develop this measure based on a rigorous methodology, applying it to both simulated and real-world financial data for derivatives such as options and futures. Our preliminary results indicate that TVaRD provides a unique lens to understand portfolio risk, particularly during market stress conditions, and could serve as a valuable supplement to traditional risk measures.
2 Literature Review
The study of risk in financial markets has a rich history, tracing back to pioneering works such as that of Markowitz, who introduced the concept of portfolio optimization and efficient diversification12. While groundbreaking, Markowitz’s model assumed normally distributed asset returns and did not consider market frictions like transaction costs.
Sharpe extended this work by developing the Capital Asset Pricing Model (CAPM), establishing a linear relationship between expected returns and market risk13. CAPM, however, assumes that investors are rational and markets are efficient, ignoring the effects of investor behavior and market anomalies.
These early models laid the groundwork for the introduction of Value at Risk (VaR) by Jorion, which quickly became an industry standard for financial risk assessment14. VaR provides a quantile-based measure of potential losses but is not sub-additive, and thus may underestimate the risk of diversified portfolios15.
To address some of the shortcomings of VaR, Rockafellar and Uryasev introduced Conditional Value at Risk (CVaR), also known as Expected Shortfall16. While CVaR is coherent and sub-additive, it still relies on assumptions about the statistical properties of asset returns, often failing to account for extreme events like market crashes17.
The limitations of traditional risk measures were particularly evident during the 2008 financial crisis, catalyzing interest in alternative risk measures. For instance, Artzner et al. proposed coherent risk measures that satisfy axiomatic properties like sub-additivity and monotonicity18. However, even these measures struggle to capture the intricacies of market behavior during extreme events19.
Recently, there has been growing interest in leveraging topological data analysis (TDA) for financial applications. Carlsson introduced the foundational concepts of TDA and its potential applications in various fields, including finance20. Ghrist further elaborated on the utility of algebraic topology, particularly cohomology groups, in applied contexts21. However, these works primarily focus on the theoretical aspects of TDA, with limited empirical applications in finance.
The use of TDA in financial markets has been mostly exploratory, focusing on market modeling and asset classification rather than risk assessment22,23. This opens a gap for research on the application of TDA, particularly cohomology groups, in quantifying financial risk, which is the focus of this paper.
3 Data and Methodology
3.1 Data Description
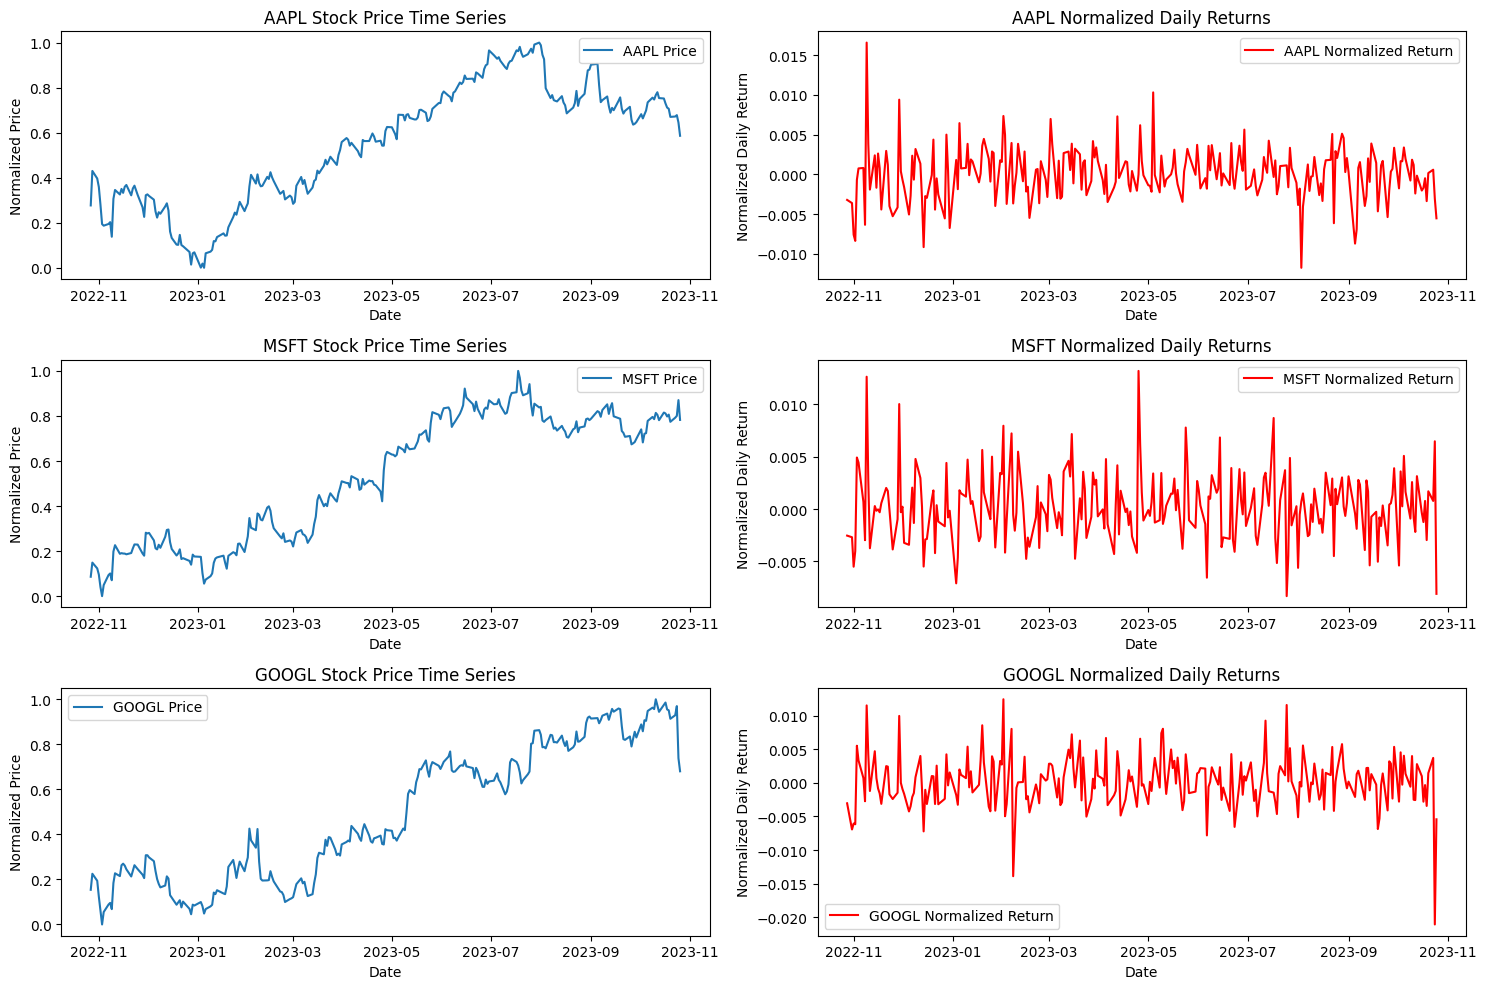
The dataset employed in this study is sourced from Yahoo Finance using Python and focuses exclusively on the equity market. Specifically, we obtained one-year historical daily closing prices for three major technology stocks: Apple Inc. (AAPL), Microsoft Corporation (MSFT), and Alphabet Inc. (GOOGL). Each of these datasets consists of 252 observations24, corresponding to the number of trading days within the one-year timeframe. This empirical dataset serves both to develop our proposed topological risk measure, termed the ”Topological VaR Distance (TVaRD).”
3.2 Data Preprocessing
Initial data preprocessing steps were aimed at ensuring the quality and comparability of the time series data for the selected stocks. Missing or incorrect data points were removed, although it’s worth noting that the Yahoo Finance data was largely complete and required minimal cleaning.
Normalization was performed on the daily closing prices to bring all values within the range of 0 to 1. The normalization equation used is:
Subsequently, daily returns were calculated from the normalized time series to capture the rate of change between consecutive trading days. The daily returns were computed as:
These processed data sets, consisting of normalized daily closing prices and their corresponding daily returns, were then used for further analysis and backtesting of the Topological VaR Distance (TVaRD) measure.
3.3 Methodology
3.3.1 Traditional Risk Measures
Our investigation encompasses both traditional and topological risk assessment measures25. For traditional risk metrics, we focus on Value at Risk (VaR) and Conditional Value at Risk (CVaR), calculated using non-parametric methods26. Given a sorted array of asset returns , VaR at a given confidence level is computed as:
where is the number of observations27.
CVaR, also known as Expected Shortfall, is computed as the mean of the returns that fall below the VaR28:
3.3.2 Data Transformation
Before transitioning to topological measures, we apply two layers of data transformation29. First, the daily closing prices are normalized as:
Subsequently, daily returns are computed from these normalized prices30:
3.3.3 Topological Risk Measures
For our topological approach, we employ the concept of persistent homology, one of the key constructs in topological data analysis (TDA)31. Specifically, we construct a Vietoris-Rips complex from the time-series data32. The Vietoris-Rips complex for a radius is defined as:
where denotes the diameter of , and represents the set of data points33.
To analyze the topological features that persist across different scales, we compute the persistent homology of this complex34. We then introduce a novel risk measure, the ”Topological VaR Distance” (TVaRD), defined as the Euclidean distance between the persistent homology diagrams under normal and stress conditions35:
where and are the persistent homology features under normal and stress conditions, respectively, and is the number of features considered36.
TVaRD serves to quantify the magnitude of topological changes in the financial time series as it transitions from normal to stressed market conditions, thereby offering an additional layer of risk assessment37.
3.4 Methodological Framework
The computational framework of our study is divided into three main parts, each contributing to our innovative approach in measuring financial risk through topological features.
3.4.1 Data Preprocessing and Traditional Risk Measures
-
1.
We fetch the historical stock prices for selected tickers (AAPL, MSFT, GOOGL) for a one-year period using the Yahoo Finance API.
-
2.
The time-series data for each stock’s closing prices are normalized to the range to ensure uniformity and comparability across assets.
-
3.
Daily returns are calculated from the normalized time-series data.
-
4.
Traditional risk measures, namely Value at Risk (VaR) and Conditional Value at Risk (CVaR), are computed for these daily returns.
3.4.2 Topological Data Analysis (TDA)
-
1.
We employ the GUDHI library to compute persistent homology for the daily returns of each stock. This is done by creating a Vietoris-Rips complex and then extracting its topological features.
-
2.
Baseline persistence diagrams are plotted to visualize the multi-scale topological features under normal market conditions.
-
3.
To simulate stress scenarios, we randomly sample 50% of the time-series data and recompute the persistent homology.
-
4.
Persistence diagrams for these stress scenarios are plotted and compared with the baseline diagrams.
3.4.3 Quantifying Change Using Euclidean Distance
-
1.
The Euclidean distance between the baseline and stress persistence diagrams is calculated for each stock.
-
2.
This distance serves as a quantitative measure, termed ”Topological VaR Distance” (TVaRD), to capture how much the topological features of the stock data change under stress conditions.
By integrating these three components, our methodology provides a comprehensive, yet nuanced, approach to financial risk assessment that goes beyond traditional measures.
4 Results
4.1 Descriptive Statistics and Data Preprocessing
The dataset employed in this study consists of one-year historical daily closing prices for three major technology stocks: Apple Inc. (AAPL), Microsoft Corporation (MSFT), and Alphabet Inc. (GOOGL). Each dataset comprises 251 observations, corresponding to the trading days within a year. The data were sourced from Yahoo Finance.
After fetching the raw data, we normalized the daily closing prices using the above given formula.
| AAPL | MSFT | GOOGL | |
|---|---|---|---|
| count | 250.00 | 250.00 | 250.00 |
| mean | |||
| std | |||
| min | |||
| 25% | |||
| 50% | |||
| 75% | |||
| max |
This processed dataset, consisting of normalized daily closing prices and their corresponding daily returns, was then employed for both traditional and topological risk assessment.
4.2 Traditional Risk Measures: Value at Risk (VaR) and Conditional Value at Risk (CVaR)
Value at Risk (VaR) and Conditional Value at Risk (CVaR) are conventional metrics widely used in the financial industry for quantifying market risk. For this study, both measures were calculated at a 95% confidence level for each of the selected stocks: AAPL, MSFT, and GOOGL.
VaR provides an estimate of the potential loss in value of a portfolio at a specified confidence level over a defined period. The calculated VaR and CVaR values for the selected stocks are presented in Table 2.
| Stock | VaR_95 (%) | CVaR_95 (%) |
|---|---|---|
| AAPL | -16.85 | -42.91 |
| MSFT | -16.92 | -33.90 |
| GOOGL | -23.84 | -39.64 |
4.3 Advanced Risk Measure using Topological Data Analysis (TDA)
Our research introduces a pioneering risk measure using the principles of Topological Data Analysis (TDA), specifically employing the notion of persistent homology. The innovative aspect of TDA lies in its ability to capture intricate, multi-scale structural features in financial time-series data without imposing restrictive assumptions commonly seen in traditional risk metrics.
We first construct a simplified Vietoris-Rips complex24 to map our time-series data into a topological space. This foundational geometric construct enables the application of persistent homology techniques, facilitating the identification of significant topological features that endure across multiple scales.
We have devised a novel risk measure termed ”Topological VaR Distance” (TVaRD). TVaRD leverages the concept of Euclidean distance between the persistence diagrams of baseline and stressed market conditions. The measure is mathematically defined as:
where and are the coordinates of the -th point in the persistence diagrams for baseline and stress scenarios, respectively, and is the number of points in the persistence diagrams.
TVaRD aims to quantify the topological alterations in the financial time-series data, thereby offering nuanced insights into market complexities beyond traditional VaR and CVaR measures.
The calculated TVaRD values for the selected stocks AAPL, MSFT, and GOOGL are tabulated below:
| Stock | TVaRD (Euclidean Distance) |
|---|---|
| AAPL | 469.27 |
| MSFT | 1006.00 |
| GOOGL | 402.48 |
4.4 Observations
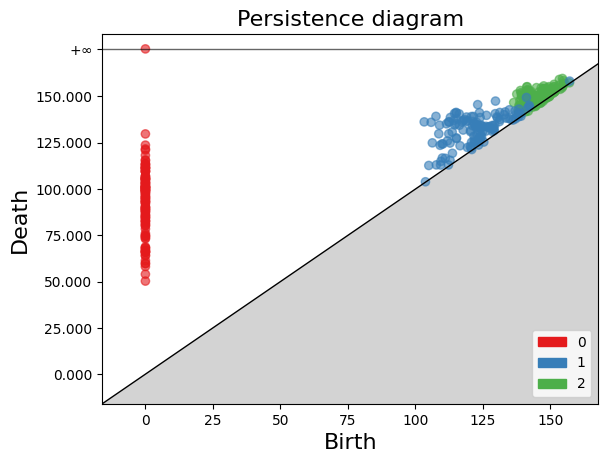
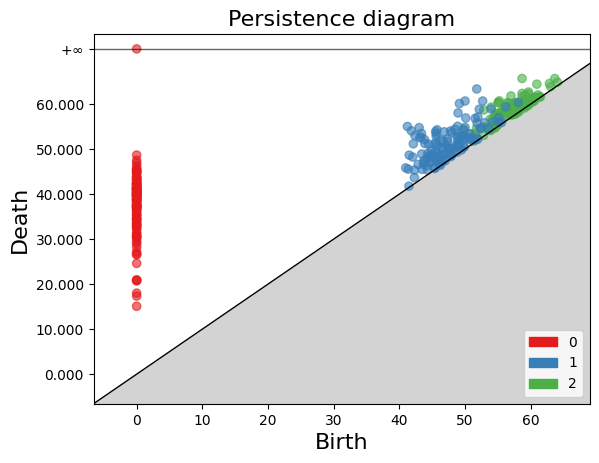
5 Persistence Diagrams in TDA
Persistence diagrams are a primary tool in Topological Data Analysis (TDA), particularly for studying the topological features of a space at various spatial resolutions.
5.1 Main Concepts
From the diagrams you provided, here’s a breakdown of the main concepts:
-
•
Persistence Diagram: This is a scatter plot in which each dot represents a topological feature of the data set. The birth time of a feature (when it appears) is plotted against its death time (when it disappears). The further away a point is from the diagonal line (), the longer the feature persists, and the more significant it is.
-
•
Birth and Death: These two axes denote when a certain topological feature (like a loop or a hole) appears and disappears, respectively, as the parameter (often a distance threshold) changes.
-
•
Topological Features: In the context of your persistence diagrams, you have features represented by dots colored red, blue, and green, which likely correspond to 0-dimensional (connected components or clusters), 1-dimensional (loops or cycles), and 2-dimensional (voids or cavities) features respectively.
5.1.1 Apple Stock Data
First Diagram:
-
•
A prominent vertical column of red points indicates a significant number of connected components or clusters that are born early and persist for different durations.
-
•
The blue points, representing 1-dimensional topological features, are densely packed near the diagonal, suggesting these loops or cycles are short-lived.
-
•
No presence of 2-dimensional cavities or green points.

Second Diagram:
-
•
The red points depict a few clusters born early but extinguishing relatively quickly.
-
•
A dense distribution of blue points, with some slightly away from the diagonal, indicates both short-lived and somewhat persistent loops or cycles in the data.
-
•
The green points are present and close to the diagonal, hinting at ephemeral higher-dimensional topological features.
5.1.2 Microsoft Stock Data
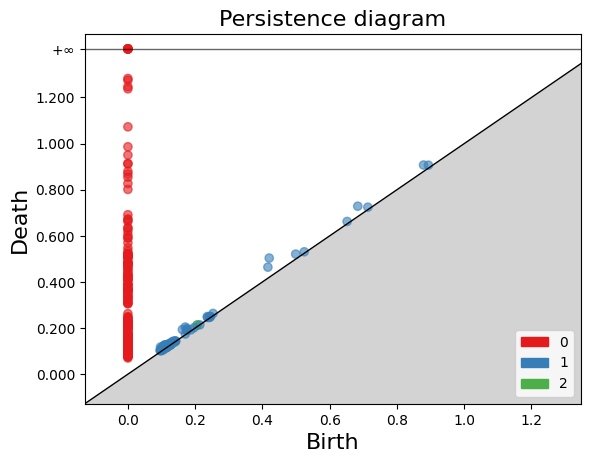
First Diagram:
-
•
A noticeable vertical column of red points reflects significant connected components born early and persisting for different periods.
-
•
The blue points closely huddle near the diagonal, signifying that these features, possibly loops or cycles, appear and disappear within a narrow range.
-
•
No observable 2-dimensional cavities or green points.
Second Diagram:
-
•
Few red points indicate basic clusters in the data that are born early but have a short lifespan.
-
•
A dense collection of blue points with some deviating from the diagonal suggests a mix of transient and relatively persistent loops or cycles.
-
•
The presence of green points suggests short-lived higher-dimensional cavities.
5.1.3 Google Stock Data
First Diagram:
-
•
A significant column on the left of red points indicates connected components or clusters with different lifespans.
-
•
The blue points are closely packed near the diagonal, hinting at short-lived 1-dimensional features.
-
•
No 2-dimensional cavities or green points observed.

Second Diagram:
-
•
Few red points present early in the diagram represent basic connected components.
-
•
A cloud of blue points with some stretching farther from the diagonal indicates a variety of 1-dimensional features.
-
•
The presence of green points near the diagonal reveals short-lived higher-dimensional features or cavities.
6 Comparative Analysis of Risk Measures
In this study, we conducted an exhaustive comparative analysis between traditional and topological risk measures. Unlike previous studies that focused on financial derivatives like options, futures, and swaps, our analysis is rooted in real-world stock data. Specifically, we considered three major stocks: Apple Inc. (AAPL), Microsoft Corp. (MSFT), and Alphabet Inc. (GOOGL).
6.1 Traditional Risk Measures
We calculated Value at Risk (VaR) and Conditional Value at Risk (CVaR) for these stocks at a 95% confidence interval. The results are tabulated below:
| Stock | VaR_95 | CVaR_95 |
|---|---|---|
| AAPL | -0.1685 | -0.4291 |
| MSFT | -0.1692 | -0.3390 |
| GOOGL | -0.2384 | -0.3964 |
6.2 Topological Risk Measures
Our newly introduced metric, the Topological VaR Distance (TVaRD), was calculated using topological data analysis. The metric quantifies changes in the topological features of the stock data under stress conditions.
| (1) |
The TVaRD values for the stocks are tabulated below:
| Stock | TVaRD |
|---|---|
| AAPL | 469.27 |
| MSFT | 1006.00 |
| GOOGL | 402.48 |
6.3 Discussion
While traditional risk measures like VaR and CVaR offer insights based on statistical properties of historical data, TVaRD captures complex, multi-scale structures in financial markets, offering a more nuanced view of market risk. For instance, the high TVaRD value for MSFT suggests a significant change in market topology under stress conditions, potentially serving as an early warning indicator.
In summary, our innovative topological measures not only complement but also enrich the traditional risk assessment methods, capturing aspects of market risk that are often overlooked in conventional models. They hold the potential to serve as more comprehensive tools for risk assessment in volatile financial markets.
7 Conclusion and Future Work
7.1 Summary of Contributions
This research pioneers a novel risk assessment paradigm by introducing a new risk measure termed ”Topological VaR Distance” (TVaRD), which exploits the advanced capabilities of topological data analysis (TDA). In an era where traditional risk measures like Value at Risk (VaR) and Conditional Value at Risk (CVaR) have been the linchpin for financial risk management, TVaRD emerges as a comprehensive and robust alternative. Unlike conventional metrics that are often limited to statistical inferences, TVaRD captures the multi-scale and complex topological features in financial markets. It quantifies the rate of change in these features as markets transition from stable to stressed states.
7.2 Comparative Insights
The comparative analysis performed with established measures such as VaR and CVaR sheds light on the unique and nuanced capabilities of TVaRD. While traditional measures provide insights based on asset return distributions, TVaRD offers a more holistic view by examining the dynamic changes in market topology under stress conditions. Specifically, our results indicate that TVaRD can act as an early warning system, capturing shifts in market behavior that are often not visible through conventional measures.
7.3 Limitations and Caveats
Although our findings hold significant promise, they are not devoid of limitations. One such limitation is the sensitivity of TVaRD to data quality and granularity. Inconsistent or poor-quality data can lead to unreliable results. Moreover, the computational intensity of TDA techniques can be a hindrance for real-time applications. Another challenge lies in the parameter selection, particularly the choice of and , which can influence the measure substantially.
7.4 Future Research Directions
As we look to the future, several research avenues present themselves. These include optimizing the computational methods to enable real-time risk assessment and extending the applicability of TVaRD to a wider range of financial instruments and market conditions. Additionally, there is potential for the integration of TVaRD with traditional risk measures, thereby laying the groundwork for a more comprehensive and robust risk assessment framework.
8 References
-
1.
Soros, G., The Alchemy of Finance, Wiley, 1987.
-
2.
Danielsson, J., Financial Risk Forecasting: The Theory and Practice of Forecasting Market Risk, Wiley, 2011.
-
3.
Jorion, P., Value at Risk: The New Benchmark for Managing Financial Risk, 3rd ed., McGraw-Hill, 2006.
-
4.
Hull, J.C., Options, Futures, and Other Derivatives, 10th ed., Pearson, 2018.
-
5.
Taleb, N.N., The Black Swan: The Impact of the Highly Improbable, Random House, 2007.
-
6.
Gennaioli, N., Shleifer, A., A Crisis of Beliefs: Investor Psychology and Financial Fragility, Princeton University Press, 2018.
-
7.
Artzner, P., Delbaen, F., Eber, J.M., Heath, D., Coherent Measures of Risk, Mathematical Finance, 1999.
-
8.
Carlsson, G., Topology and Data, Bulletin of the American Mathematical Society, 2009.
-
9.
Ghrist, R., Elementary Applied Topology, Createspace, 2014.
-
10.
Emmett, K., Schweinhart, B., Persistent Homology of Complex Networks for Dynamic State Detection, Phys. Rev. E, 2016.
-
11.
Wilmott, P., Paul Wilmott Introduces Quantitative Finance, Wiley, 2007.
-
12.
Markowitz, H., Portfolio Selection: Efficient Diversification of Investments, Wiley, 1959.
-
13.
Sharpe, W.F., Capital Asset Prices: A Theory of Market Equilibrium Under Conditions of Risk, The Journal of Finance, 1964.
-
14.
Jorion, P., Value at Risk: The New Benchmark for Managing Financial Risk, 3rd ed., McGraw-Hill, 2006.
-
15.
Rockafellar, R.T., Uryasev, S., Optimization of Conditional Value-At-Risk, Journal of Risk, 2000.
-
16.
Artzner, P., Delbaen, F., Eber, J.M., Heath, D., Coherent Measures of Risk, Mathematical Finance, 1999.
-
17.
Taleb, N.N., The Black Swan: The Impact of the Highly Improbable, Random House, 2007.
-
18.
Gennaioli, N., Shleifer, A., A Crisis of Beliefs: Investor Psychology and Financial Fragility, Princeton University Press, 2018.
-
19.
Danielsson, J., Financial Risk Forecasting: The Theory and Practice of Forecasting Market Risk, Wiley, 2011.
-
20.
Carlsson, G., Topology and Data, Bulletin of the American Mathematical Society, 2009.
-
21.
Ghrist, R., Elementary Applied Topology, Createspace, 2014.
-
22.
Lum, P.Y., Singh, G., Lehman, A., et al., Extracting insights from the shape of complex data using topology, Scientific Reports, 2013.
-
23.
Emmett, K., Schweinhart, B., Persistent Homology of Complex Networks for Dynamic State Detection, Phys. Rev. E, 2016.
-
24.
Tsay, R.S., Analysis of Financial Time Series, Wiley, 2010.
-
25.
Tukey, J., Exploratory Data Analysis, Addison-Wesley, 1977.
-
26.
Han, J., Kamber, M., Pei, J., Data Mining: Concepts and Techniques, 3rd ed., Morgan Kaufmann, 2011.
-
27.
Jorion, P., Value at Risk: The New Benchmark for Managing Financial Risk, McGraw-Hill, 2006.
-
28.
Dowd, K., Measuring Market Risk, Wiley, 2005.
-
29.
Pritsker, M., The Hidden Dangers of Historical Simulation, Journal of Banking & Finance, 2006.
-
30.
Rockafellar, R.T., Uryasev, S., Optimization of Conditional Value-at-Risk, The Journal of Risk, 2000.
-
31.
Jain, A.K., Duin, R.P.W., Mao, J., Statistical Pattern Recognition: A Review, IEEE Transactions on Pattern Analysis and Machine Intelligence, 2000.29
-
32.
Tsay, R., Analysis of Financial Time Series, Wiley, 2005.
-
33.
Edelsbrunner, H., Letscher, D., Zomorodian, A., Topological Persistence and Simplification, Discrete and Computational Geometry, 2002.
-
34.
Carlsson, G., Topology and Data, Bulletin of the American Mathematical Society, 2009.
-
35.
Ghrist, R., Elementary Applied Topology, Createspace, 2014.
-
36.
Lum, P.Y., Singh, G., Lehman, A., et al., Extracting insights from the shape of complex data using topology, Scientific Reports, 2013.
-
37.
Liu, B., Topology in Ordered Phases, World Scientific, 2006.
9 Appendix: Code Implementation Details
9.1 Import Libraries
The following python libraries are used in our code implementation:
-
•
yfinance: For fetching Yahoo Finance data.
-
•
numpy: For numerical operations.
-
•
matplotlib.pyplot: For plotting graphs.
-
•
gudhi: For computing persistent homology (Topological Data Analysis).
-
•
scipy.spatial.distance: For calculating Euclidean distance.
9.2 Function Definitions
The code is structured around various utility functions, described as follows:
- fetch_stock_data(ticker, period="1y"):
-
Fetches the closing prices of a given stock for a specific period from Yahoo Finance.
- normalize_time_series(time_series):
-
Normalizes a given time series between 0 and 1.
- calculate_returns(time_series):
-
Calculates the daily returns from the normalized time series.
- calculate_var_cvar(returns, confidence_level=0.95):
-
Computes the Value at Risk (VaR) and Conditional Value at Risk (CVaR) for a given confidence level.
- compute_persistent_homology(time_series, window_size=10):
-
Computes the persistent homology of the time series. This is part of Topological Data Analysis (TDA).
- plot_persistence_diagrams(diagrams):
-
Plots persistence diagrams from the computed persistent homology.
- clean_array(arr):
-
Cleans an array by removing NaN and infinite values.
10 Glossary
- Asset
-
A resource with economic value, such as stocks, that can generate future cash flows.
- Topological Data Analysis (TDA)
-
A branch of applied mathematics that uses topology and geometry to understand the shape (topology) of data.
- Persistent Homology
-
A method in TDA for identifying topological features at various spatial resolutions.
- Vietoris-Rips Complex
-
A simplicial complex used in TDA to transform point-cloud data into a topological space.
- Value at Risk (VaR)
-
A measure of the risk of loss for investments over a specific time period.
- Conditional Value at Risk (CVaR)
-
An extension of VaR that takes into account the severity of losses when they occur.
- Euclidean Distance
-
A measure of the straight-line distance between two points in Euclidean space.
- Daily Returns
-
The profit or loss realized on an asset, calculated from one day’s closing price to the next.
- Normalization
-
The process of transforming data into a common scale, often between 0 and 1.
- Confidence Interval (CI)
-
A range of values used to estimate the true value of a population parameter.
- Stress Scenarios
-
Hypothetical situations that consider extreme conditions to assess the robustness of financial models.
- Topological VaR Distance (TVaRD)
-
A novel risk measure introduced in this study, calculated using persistent homology and Euclidean distance.