Computational Approaches for Modeling Power Consumption on an
Underwater Flapping Fin Propulsion System
Abstract
The last few decades have led to the rise of research focused on propulsion and control systems for bio-inspired unmanned underwater vehicles (UUVs), which provide more maneuverable alternatives to traditional UUVs in underwater missions. Propulsive efficiency is of utmost importance for flapping-fin UUVs in order to extend their range and endurance for essential operations. To optimize for different gait performance metrics, we develop a non-dimensional figure of merit (FOM), derived from measures of propulsive efficiency, that is able to evaluate different fin designs and kinematics, and allow for comparison with other bio-inspired platforms. We create and train computational models using experimental data, and use these models to predict thrust and power under different fin operating states, providing efficiency profiles. We then use the developed FOM to analyze optimal gaits and compare the performance between different fin materials. These comparisons provide a better understanding of how fin materials affect our thrust generation and propulsive efficiency, allowing us to inform control systems and weight for efficiency on an inverse gait-selector model.
Introduction
Unmanned underwater vehicles (UUVs) have a variety of industrial and research applications including exploration, mapping, and minesweeping. Historically, these operations have primarily been conducted with propeller-driven UUVs. Because propeller-driven UUVs lack maneuverability and subsequently resistance to turbulence, their operational domain is limited to relatively quiescent and deeper waters. Marine animals offer promising solutions to expanding the envelope of UUV operations because they swim with high propulsive efficiency and have high maneuverability in water (Masud, La Mantia, and Dabnichki 2022; Eloy 2012; Taylor, Nudds, and Thomas 2003; Rohr and Fish 2004; Rohr et al. 1998; Triantafyllou, Triantafyllou, and Yue 2000; Nedelcu et al. 2018), which motivates replication of their fins and other appendages in robotic designs (Techet 2008). As such, recent decades have seen the rise of research in bio-inspired propulsion systems to fill the operational gap in littoral waters and create systems with greater agility and maneuverability compared to traditional propeller-based systems. Fin designs inspired by a variety of animals have been studied, including dolphins (Rohr et al. 1998; Rohr and Fish 2004), penguins (Masud, La Mantia, and Dabnichki 2022), and snakes. Among these, fish-inspired fins have driven the majority of research due to the agility these species exhibit, outperforming capabilities of traditional propulsion-based systems (Tangorra et al. 2007; Lauder and Madden 2006; Mignano et al. 2019; Nedelcu et al. 2018).
Designing, optimizing, and replicating marine flapping fin motion with bio-inspired fins requires testing of different parameters. Previous studies have examined and tested the effects that different parameters such as material properties, kinematics or fin gaits, and fin shape have on a flapping fin’s thrust output to better replicate and understand fish hydrodynamic performance (Sampath et al. 2020; Geder et al. 2013; Mignano et al. 2019; Yun, Kim, and Kim 2015; Nguyen, Lee, and Ahn 2016; Geder et al. 2017). We identify and aim to resolve the following gaps in literature:
-
1.
Prior studies have placed emphasis on studying the effects of designs and gaits have on the thrust and lift forces (Sampath et al. 2020; Geder et al. 2013; Mignano et al. 2019; Yun, Kim, and Kim 2015; Nguyen, Lee, and Ahn 2016; Geder et al. 2017). Less research has been conducted on the effects designs and flapping gaits have on power consumption and UUV efficiency.
-
2.
Previous research on power has utilized CFD simulations to study hydrodynamic power (Palmisano et al. 2013), but this is ineffective for control system integration that requires taking into account power loss of integrated actuators.
Analyzing practical power draw and building models will allow us to create better design and gait recommendations while considering propulsive efficiency and integrating power onto a model-driven control system. This allows a control system to have different gait settings, such as a toggle-able setting optimizing for force output or gait efficiency, drastically increasing the possible mission duration for size-constrained littoral UUVs.
We explore the prediction of actuator power consumption and integration of these predictions into a control system for a set of fins on a UUV. Propeller-based systems have often been preferred due to both their repair-ability and efficiency (Palmisano et al. 2013). While flapping fin systems may not exceed propellers in propulsive efficiency, it is essential for a prototype UUV to optimize for efficiency in thrust generation to ensure feasibility in a range of naval missions. Optimizing for efficiency is complex; previous research demonstrates that multiple variables affect thrust generation and efficiency in tandem fin configurations including flow speed and fin phase (Mignano et al. 2019), as well as other stroke kinematics. Due to the popularity of bio-inspired fish fins, there have been many propulsors already created (Tangorra et al. 2007), but few have developed the models necessary to use the fins on platforms or offer a dimensionless metric that can be used to compare the efficiency of different designs between different UUV control systems. We generate a dimensionless figure of merit (FOM) that can be used for creating a comparative to other designs and control systems and optimizing power efficiency.
To generate a FOM, we develop forward models with mathematical and machine learning approaches that use static and dynamic information about the fin design and kinematics on the control system to output a low-power, time-efficient, and accurate prediction of power consumption. Combined with another integrated model for determining thrust (Lee et al. 2022), the model can take in a desired thrust or location to find the most power-efficient fin kinematics to accomplish its goal.
We use the validated thrust and power model to output kinematics interpolations across the entire possible gait space, allowing us to analyze FOM trends and develop a forward FOM model that can predict the efficiency of a certain gait. We generate a FOM that accomplishes the following objectives:
-
1.
Adaptability: the FOM forward model can function even if physical properties (actuator, fin design) are switched by simply retraining the model
-
2.
Practicality: the FOM can accurately model and account for an actuator’s power loss
-
3.
Flexibility: the FOM can optimize for different outputs or forces by simply feeding in a different model
Materials and Methods
The research objectives guiding this study are to identify the most important parameters that affect flapping fin power consumption and efficiency to develop a forward model of propulsive efficiency for practical comparison and analysis.
Parameters and Outputs
There is one fin design parameter in this study, material flexibility, and there are three fin materials in total (Table 1). There are also four kinematics parameters that define a singular gait, including stroke phase offset, stroke amplitude, pitch amplitude, and flapping frequency (Table 2).
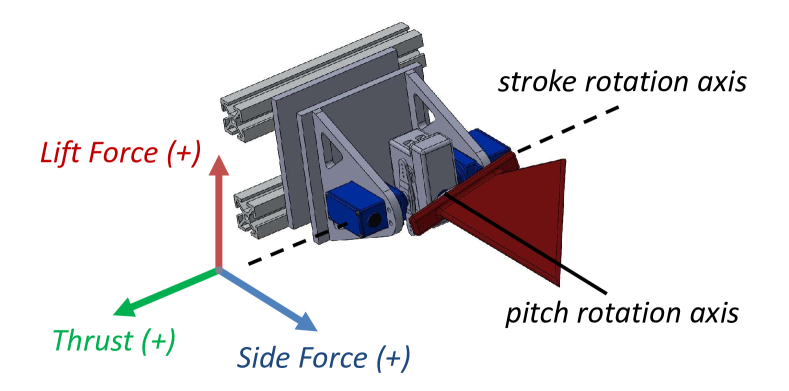
We collect experimental data on forces, current draw and voltage for the different fin gaits, which we use to develop our forward models for force and power. This information is laid out in Table 3, and force vectors are defined in Figure 1.
| Material | Young’s Modulus |
| Rigid Nylon | 1 GPa |
| PDMS 1:10 | 850 kPa |
| PDMS 1:20 | 310 kPa |
| Parameter | Symbol | Description |
| Static Kinematics | ||
| Frequency (Hz) | Number of flap cycles per second | |
| Stroke Pitch Offset () | Phase offset of the pitch cycle to the stroke cycle, calculated as th of one cycle | |
| Stroke Amplitude () | Maximum stroke angle over one flap cycle | |
| Pitch Amplitude () | Maximum pitch angle over one flap cycle | |
| Dynamic Kinematics | ||
| Stroke Angle () | Time history of stroke angle | |
| Pitch Angle () | Time history of pitch angle | |
| Parameter | Symbol | Description |
| XYZ Forces | ||
| Thrust (N) | Force generated along stroke axis | |
| Lift (N) | Force generated perpendicular to both | |
| Side Force (N) | Force generated along pitch axis | |
| Power Consumption | ||
| Stroke Current (A) | Time history of current draw for the stroke actuator | |
| Pitch Current (A) | Time history of current draw for the pitch actuator | |
| Voltage () | Voltage of both actuators | |
Data Collection
The parameter space for the kinematics variables is large, but we constrain the tests to parameter values that are physically achievable, given an operating frequency. At higher frequencies, the fins are physically unable to reach certain stroke and pitch amplitudes. Equation 1 defines our range of achievable strokes and pitches with respect to frequency:
| (1) |
With this equation, we collected data that covers the entire scope of the achievable kinematics range at each frequency. In total, 864 unique gaits listed in Table 4 were tested for each design. For each fin gait, 10 flap cycles were run, and 5 of the middle cycles were used for analysis to account for discrepancies when the actuator started and ended the cycle motions. Data was collected in a zero velocity flow condition, which previous research has demonstrated is important for low-speed maneuvering to station-keep and offset buoyancy (Geder et al. 2021).
| Parameter | Symbol |
| Stroke Amplitude () | |
| Pitch Amplitude () | |
| Frequency (Hz) | |
| Stroke Pitch Offset () | |
| Voltage () | Constant at |
Experimental Setup
Data was collected on the experimental setup shown in Figures 2 and 3. As prior research has demonstrated that tandem fin configurations have minimal effects on thrust output and power consumption, we only run single-fin tests to gather data.
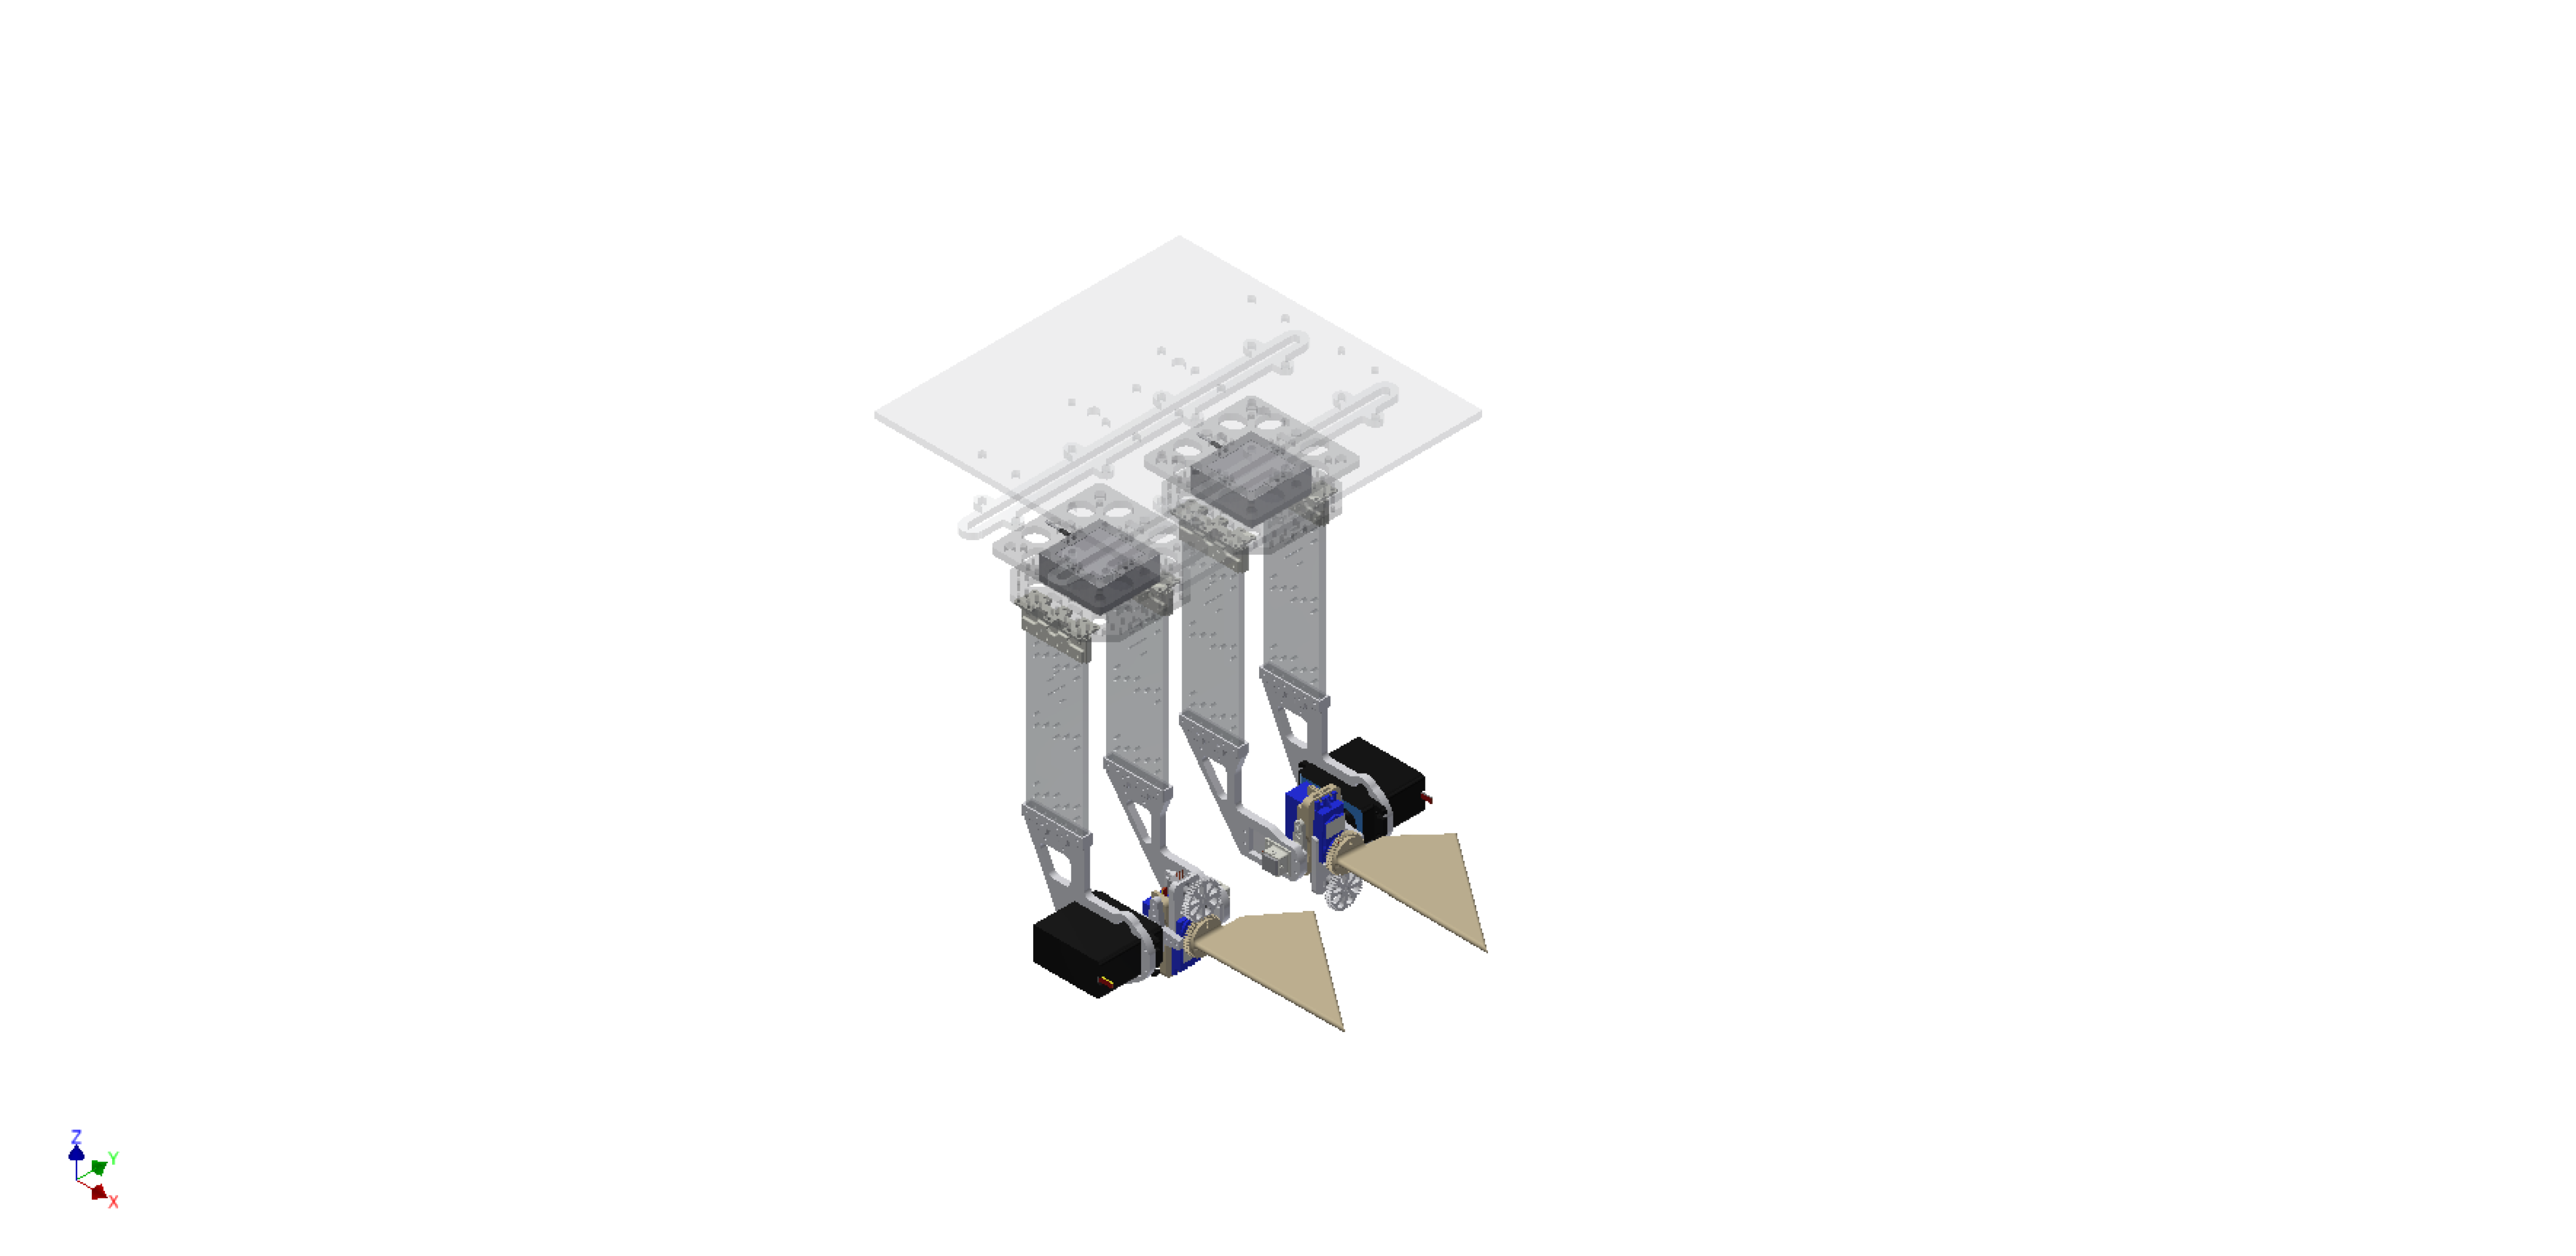
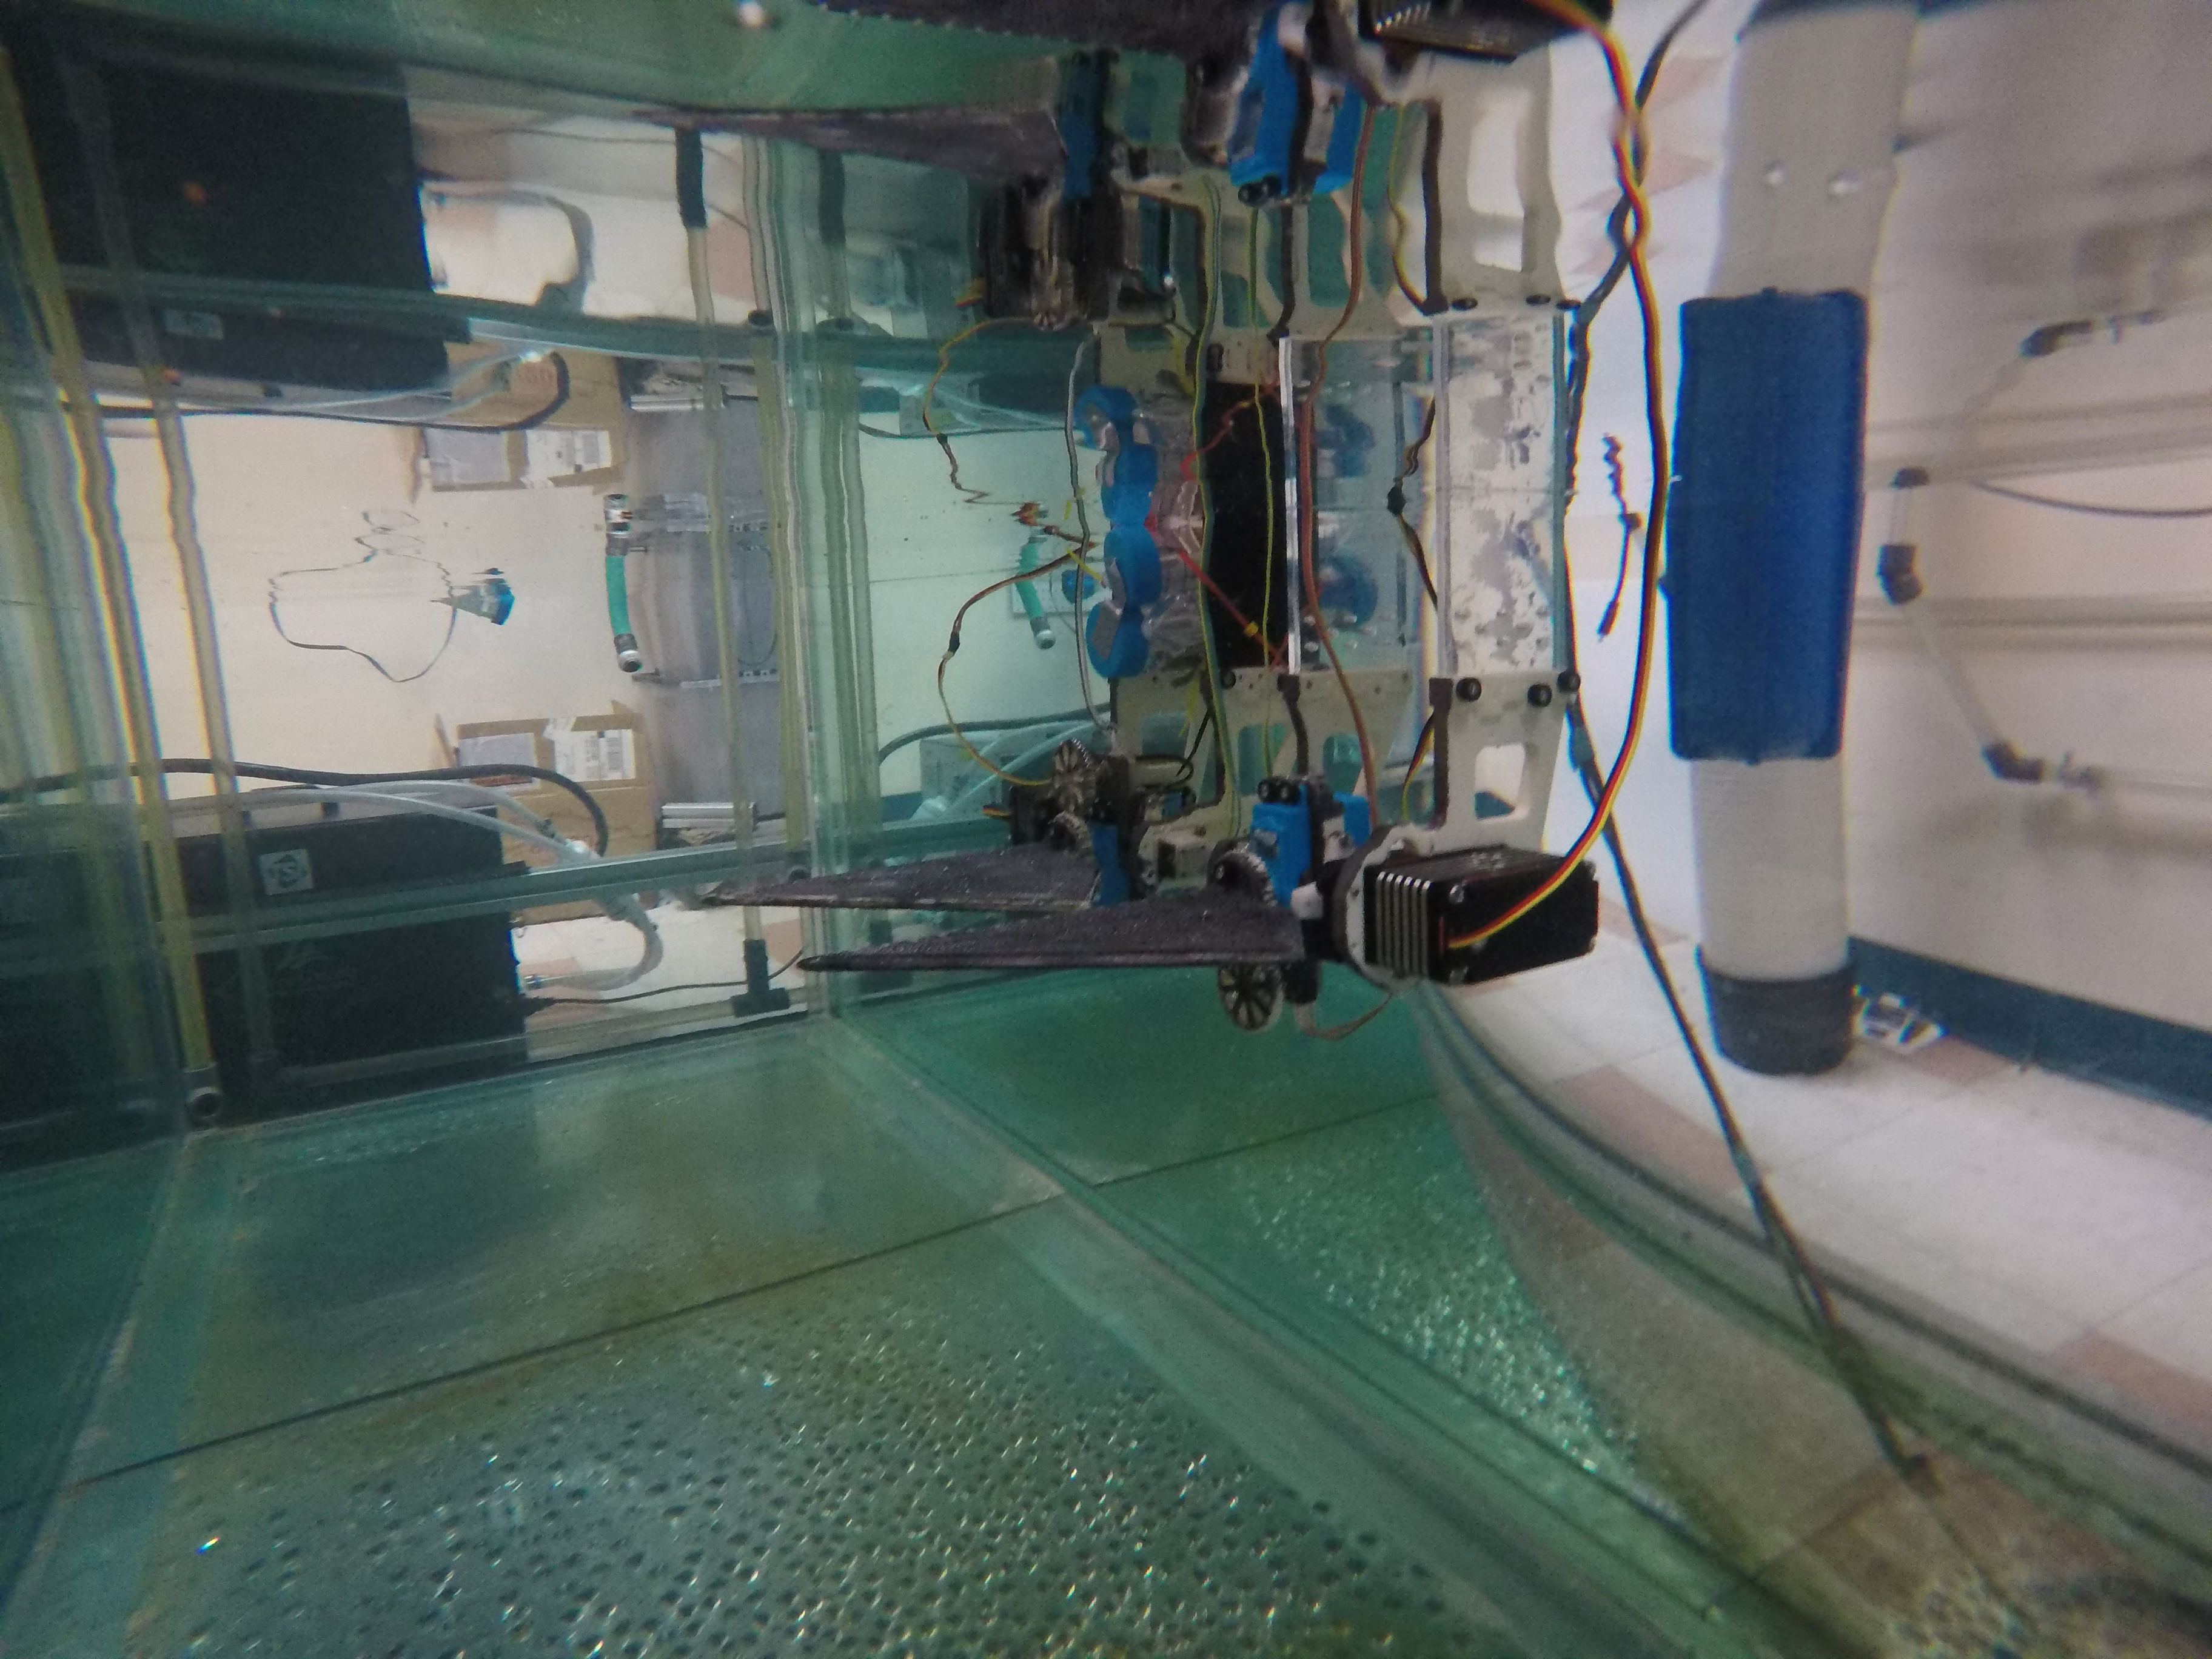
The control platform was mounted in a 2.41 x 0.76 x 0.76m (length, width, height) glass tank. A microcontroller controlled the fin actuators to collect data on the programmed gait combinations as laid out in Tables 2 and 4. Potentiometers (TT Electronics P260) measure the stroke and pitch angles over time, while load cells (Interface 3A60A) measure the generated forces (Geder et al. 2021).
Model
Objectives
Developing a forward model that inputs gait information and outputs a thrust or power prediction allows for a wider range that we can interpolate results from our figure of merit. Additionally, a fast enough model can allow for future integration onto the control system to take in power or the FOM as a metric in an inverse model. These objectives guided the selection and development of our model:
-
1.
Completion of a baseline model that can accurately take in kinematics data (frequency, stroke amplitude, pitch amplitude, and offset) to output predicted power
-
2.
Capability to take in static information such as material and flexibility to use different models to maximize accuracy and usefulness of integrated model
-
3.
Run-time speed of 100 forward passes per second at minimum
First, the model takes in design-related parameters such as material, design, rigidity, and tandem fin spacing to procure the most optimal model. Since the fins installed are static and will not be replaced during missions, this allows the model to only load what is relevant to the mission without wasting excess computational power. Second, the loaded model will take in more dynamic and changing kinematics-related information such as frequency, stroke angle, pitch angle, angle offset, and tandem phasing.
Model Results
We examined five approaches to model power; two were polynomial models and three utilized ML approaches.
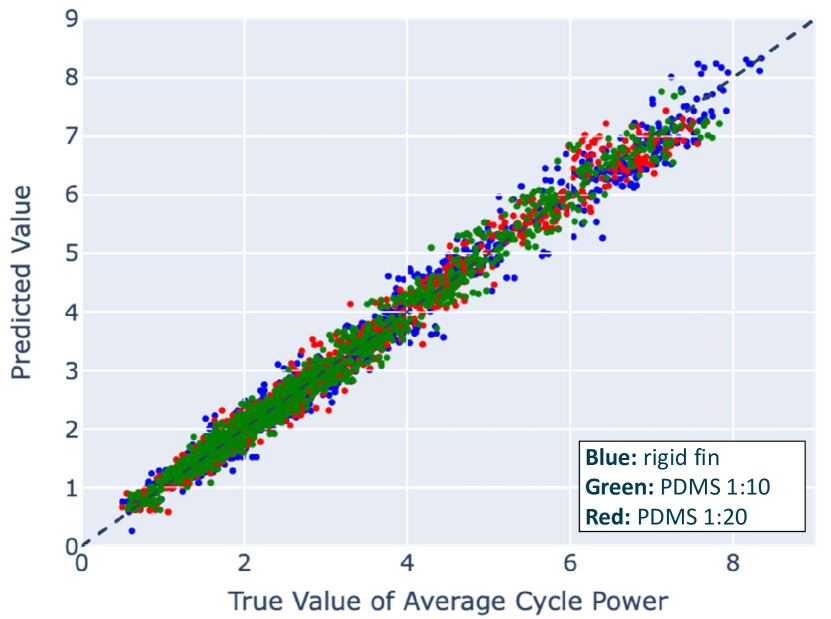
Our baseline model, the linear model, performed the fastest with an average error across all 3 data sets of 0.3891 W. As the true value and predicted values appeared to have an exponential relationship in the linear model, we tested a quartic polynomial which produced better results (Figure 4) with an average error of 0.1815 W. Out of the three data sets, the PDMS 1:10 fins fit the best to the quartic regression.
Utilizing a Convolutional Neural Network (CNN) as a baseline ML approach, we see an increase in accuracy with an average error of only 0.0907 W while still being able to operate at a speed fast enough for model integration.
While the first three models were implemented and other approaches such as a Multi Layer Perceptron Regression were considered, we ultimately chose to use a time-series model for modeling thrust and power to understand patterns present throughout a gait. As such, we used a Long Short-Term Memory model (LSTM) similar to the thrust LSTM from previous literature (Lee et al. 2022) that is able to substantially decrease the average error between interpolated data and create a time series of power consumption during one flap cycle. Most importantly for our purposes, the LSTM can accurately interpolate between gaps of data, which is useful for our FOM analysis.
When trained on all experimental gaits, the thrust LSTM reached an average error of 0.0083 N and the power LSTM reached an average error of 0.0408 W. The most visible shortfall of the power LSTM model is its inability to grasp the time history of power consumption at certain gaits. At both extremes of gaits with lower amplitudes or higher amplitudes, the power history of each cycle can be vastly different, leaving the model unable to fully understand the time history. For the purpose of interpolating the power consumption across a gait, this is not a setback.
Out of all five power models, the LSTM has the best performance but is also the most time-consuming. Table 5 highlights the results and relative time performances for a forward model.
| Model | Averaged Error (W) | Runtime |
| Linear Polynomial | 0.3891 | Low |
| Quartic Polynomial | 0.1815 | Low |
| MLP | 0.1229 | Medium |
| CNN | 0.0907 | Medium |
| LSTM | 0.0072 | High |
Generating Models
With the LSTM having the most accurate interpolations, we train each LSTM model to 1000 epochs for modeling both power and thrust predictions. For the thrust model, we utilize a previously developed model on the rigid fin data set (Lee et al. 2022) and tune it to produce optimal results on the PDMS 1:10 and 1:20 data sets. The statistics for the LSTM models produced are found in Table 6.
| Interpolations | Rigid | PDMS 1:10 | PDMS 1:20 |
| Power (W) | 0.0236 | 0.072 | 0.0268 |
| Thrust (N) | 0.0002 | 0.0186 | 0.0041 |
Figure of Merit
Objectives
We create a dimensionless FOM that takes in a gait or flap cycle along with relevant design information and outputs a metric that rates the efficiency of force generation.
Development
A baseline FOM simply computing the force in question over the power would provide a relative metric that can be used to compare gaits assuming the same flow speed, displayed in Equation 3. For integration purposes, this would be suitable and could return as the pure value or a percentage compared to the highest recorded gait efficiency for a loaded design.
| (3) |
While this FOM has units, we can convert it to a dimensionless parameter by multiplying by a velocity. Since all tests were conducted in a constant, static flow, this FOM velocity term can be set to 1 m/s, as shown in Equation 4, effectively cancelling the velocity term for relative efficiency comparisons between our tests.
| (4) |
To make our FOM dimensionless for all future flow conditions, we can iterate off a previous FOM to develop a universal FOM that implements the flow speed by calculating the tip velocity, as shown in Equations 5 and 6.
| (5) |
| (6) |
This FOM is easily able to adapt to different objectives. Because we collect data for all force axes and the individual stroke and pitch actuators, we are able to create new deviations of Equation 5 to compare an individual fin efficiency or how efficient a gait is for a specific force axis (Equation 7). The FOM can also be used to isolate how efficiency changes when changing individual actuators (Equation 8), and optimize for different objectives in future integration. Examples are listed below:
= Thrust, = Lift, = Side Force
| (7) |
= Power consumed by stroke actuator
= Power consumed by pitch actuator
| (8) |
Results
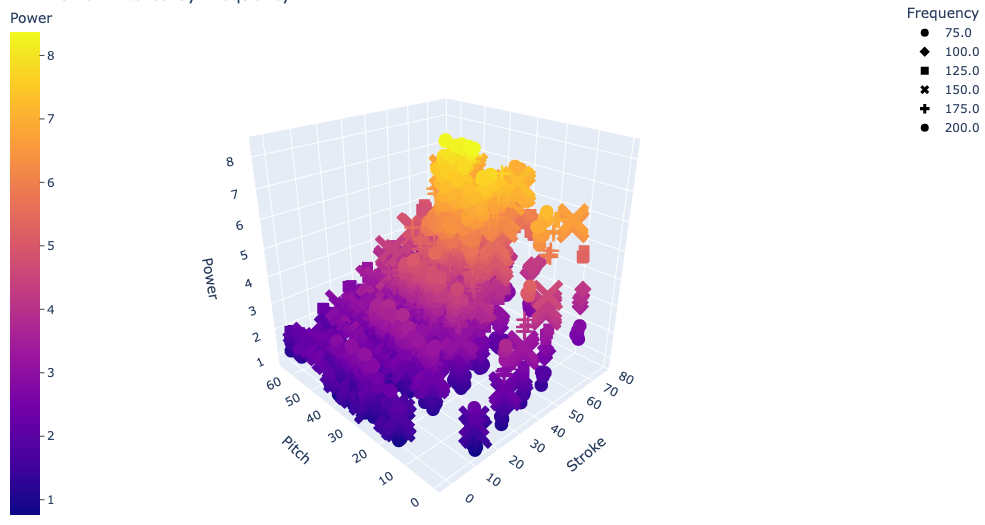
We used our generated LSTM models to generate predictions at points interpolated between training data. In total, we generated interpolations within the constraints given by our collected data. We interpolated data for every stroke and pitch combination from 0 to 55 degrees with 1 degree increments, frequency from 0.75Hz to 2Hz with 0.125Hz increments, and SPO from -22.5 to 45 degrees with 5.625 degree increments. In total, 435,600 interpolations were calculated for each data set. A sample of the rigid fin data space is shown in Figure 5. The interpolations filled gaps of data.
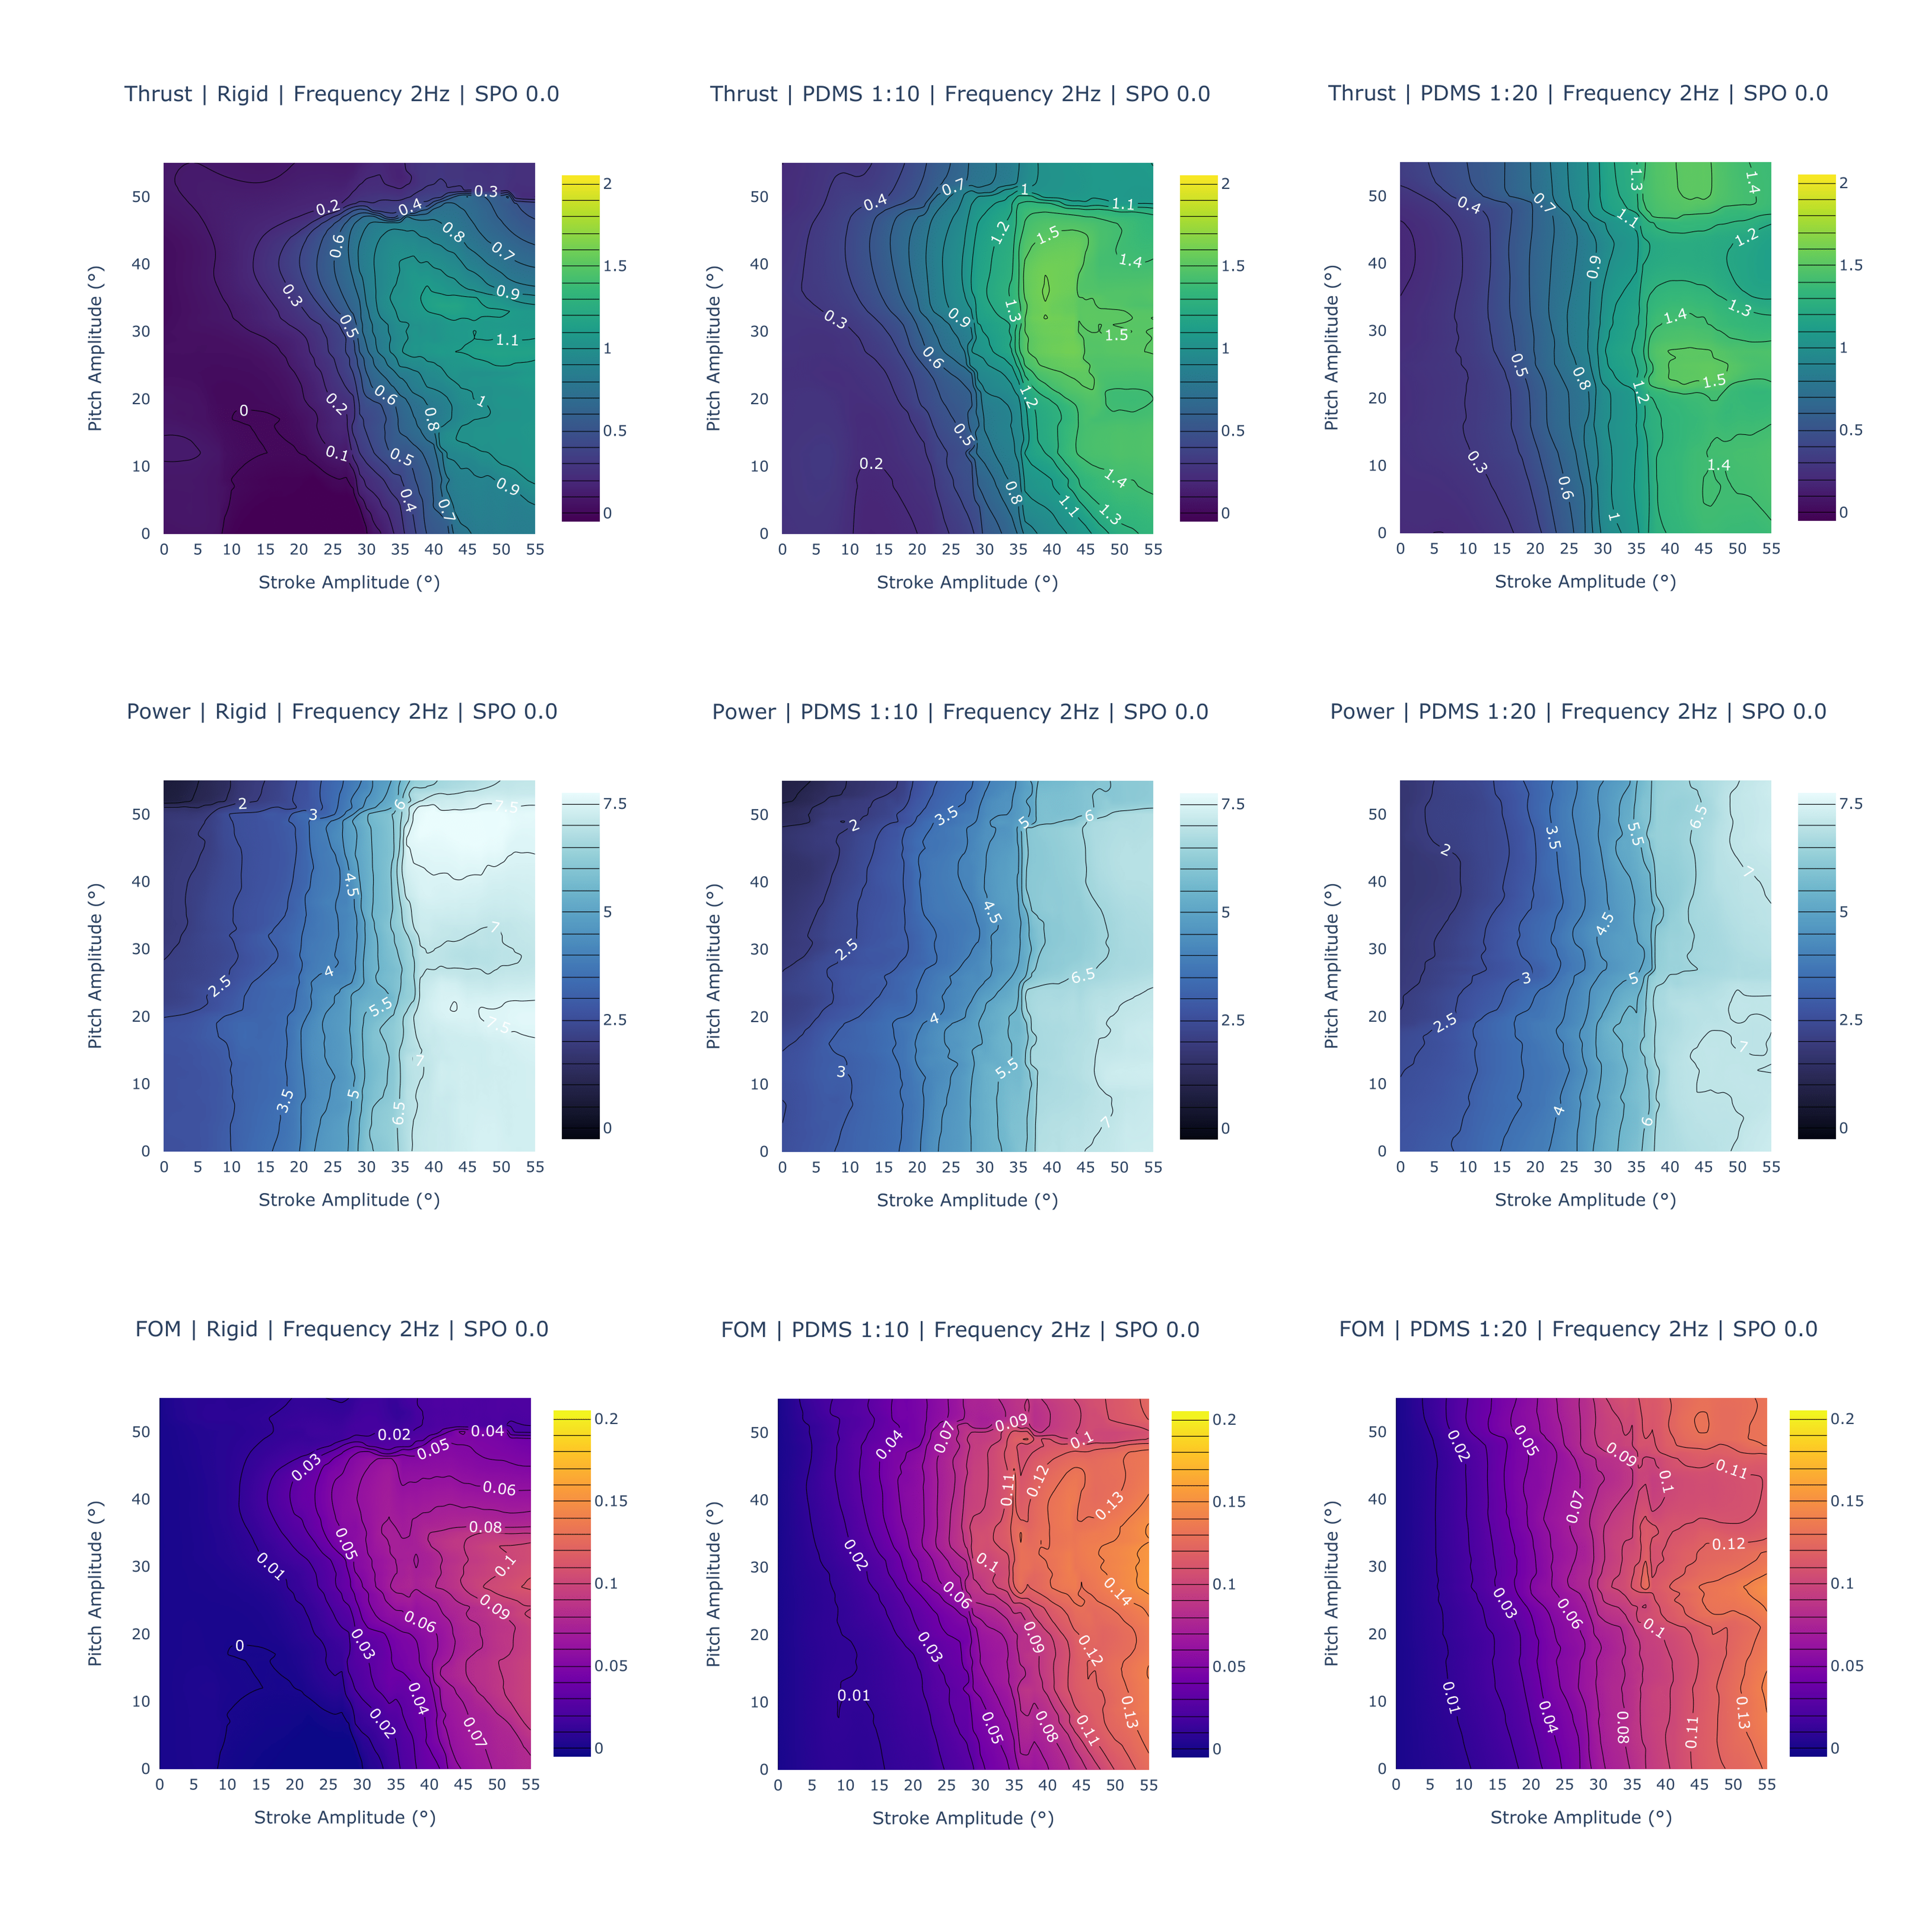
To gain a better understanding of how our Figure of Merit correlates to the thrust force and power consumption, we created a grid of contours for one gait, shown in Figure 6. Here, the stroke and pitch range for a frequency of 2 Hz and Stroke-Pitch Offset of 0∘ is depicted. The grid contains columns with the three material data sets and each row graphs part of the figure of merit equation: FOM, thrust, and power in that order.
Beginning with the thrust, a few trends are immediately apparent. First, the fin design that can generate the largest force is the PDMS 1:10 design, generating a maximum force of around 1.6 N at a 40∘ stroke amplitude and 30-40∘ pitch amplitude. Both other designs trail behind, with the PDMS 1:20 fin being able to generate a thrust of 1.5 N and the rigid fin only managing up to 1.1 N. The PDMS 1:10 fin also has more gaits at higher levels. An observation of the contour reveals that there are more combinations of stroke and pitch that produce higher thrusts when compared to the PDMS 1:20 fin. An analysis of all gaits including other SPO and frequency confirms these findings. The PDMS 1:10 fin’s maximum thrust is 2.1 N, while the PDMS 1:20 fin produces a maximum force of 1.6 N and the rigid fin produces a maximum force of 1.2 N. The PDMS 1:10 fin has the highest average thrust generation, followed by the PDMS 1:20 fin.
Power consumption goes in the reverse order. The design that requires the highest wattage is the rigid fin design, requiring 7.6 W for any gait with a stroke amplitude of more than 40∘. The PDMS 1:10 and PDMS 1:20 fins are similar, with a maximum power consumption of 7.1 W in this contour. However, at cases above 40∘ stroke and 30∘ pitch, the PDMS 1:10 fin observes lower wattage consumed at the same gait combination. The PDMS 1:20 fin appears to depend less on the pitch amplitude, with power more dependent on the stroke amplitude. These observations are verified when looking at all gaits. While the PDMS fins have a maximum wattage of around 7.5 W, it occurs at much fewer gaits than with the rigid data set.
Another interesting trend is visible when comparing the FOM and thrust charts, which appear almost identical with only a few differences in their trends. The explanation becomes evident when looking at the contours for power, which have a near-linear trend across stroke amplitude. While pitch amplitude does affect both the PDMS 1:10 and 1:20 designs, the stroke amplitude has the most recognizable and significant effect. Future work will include generating additional figures to verify that this trend exists across all frequencies and stroke-pitch offsets.
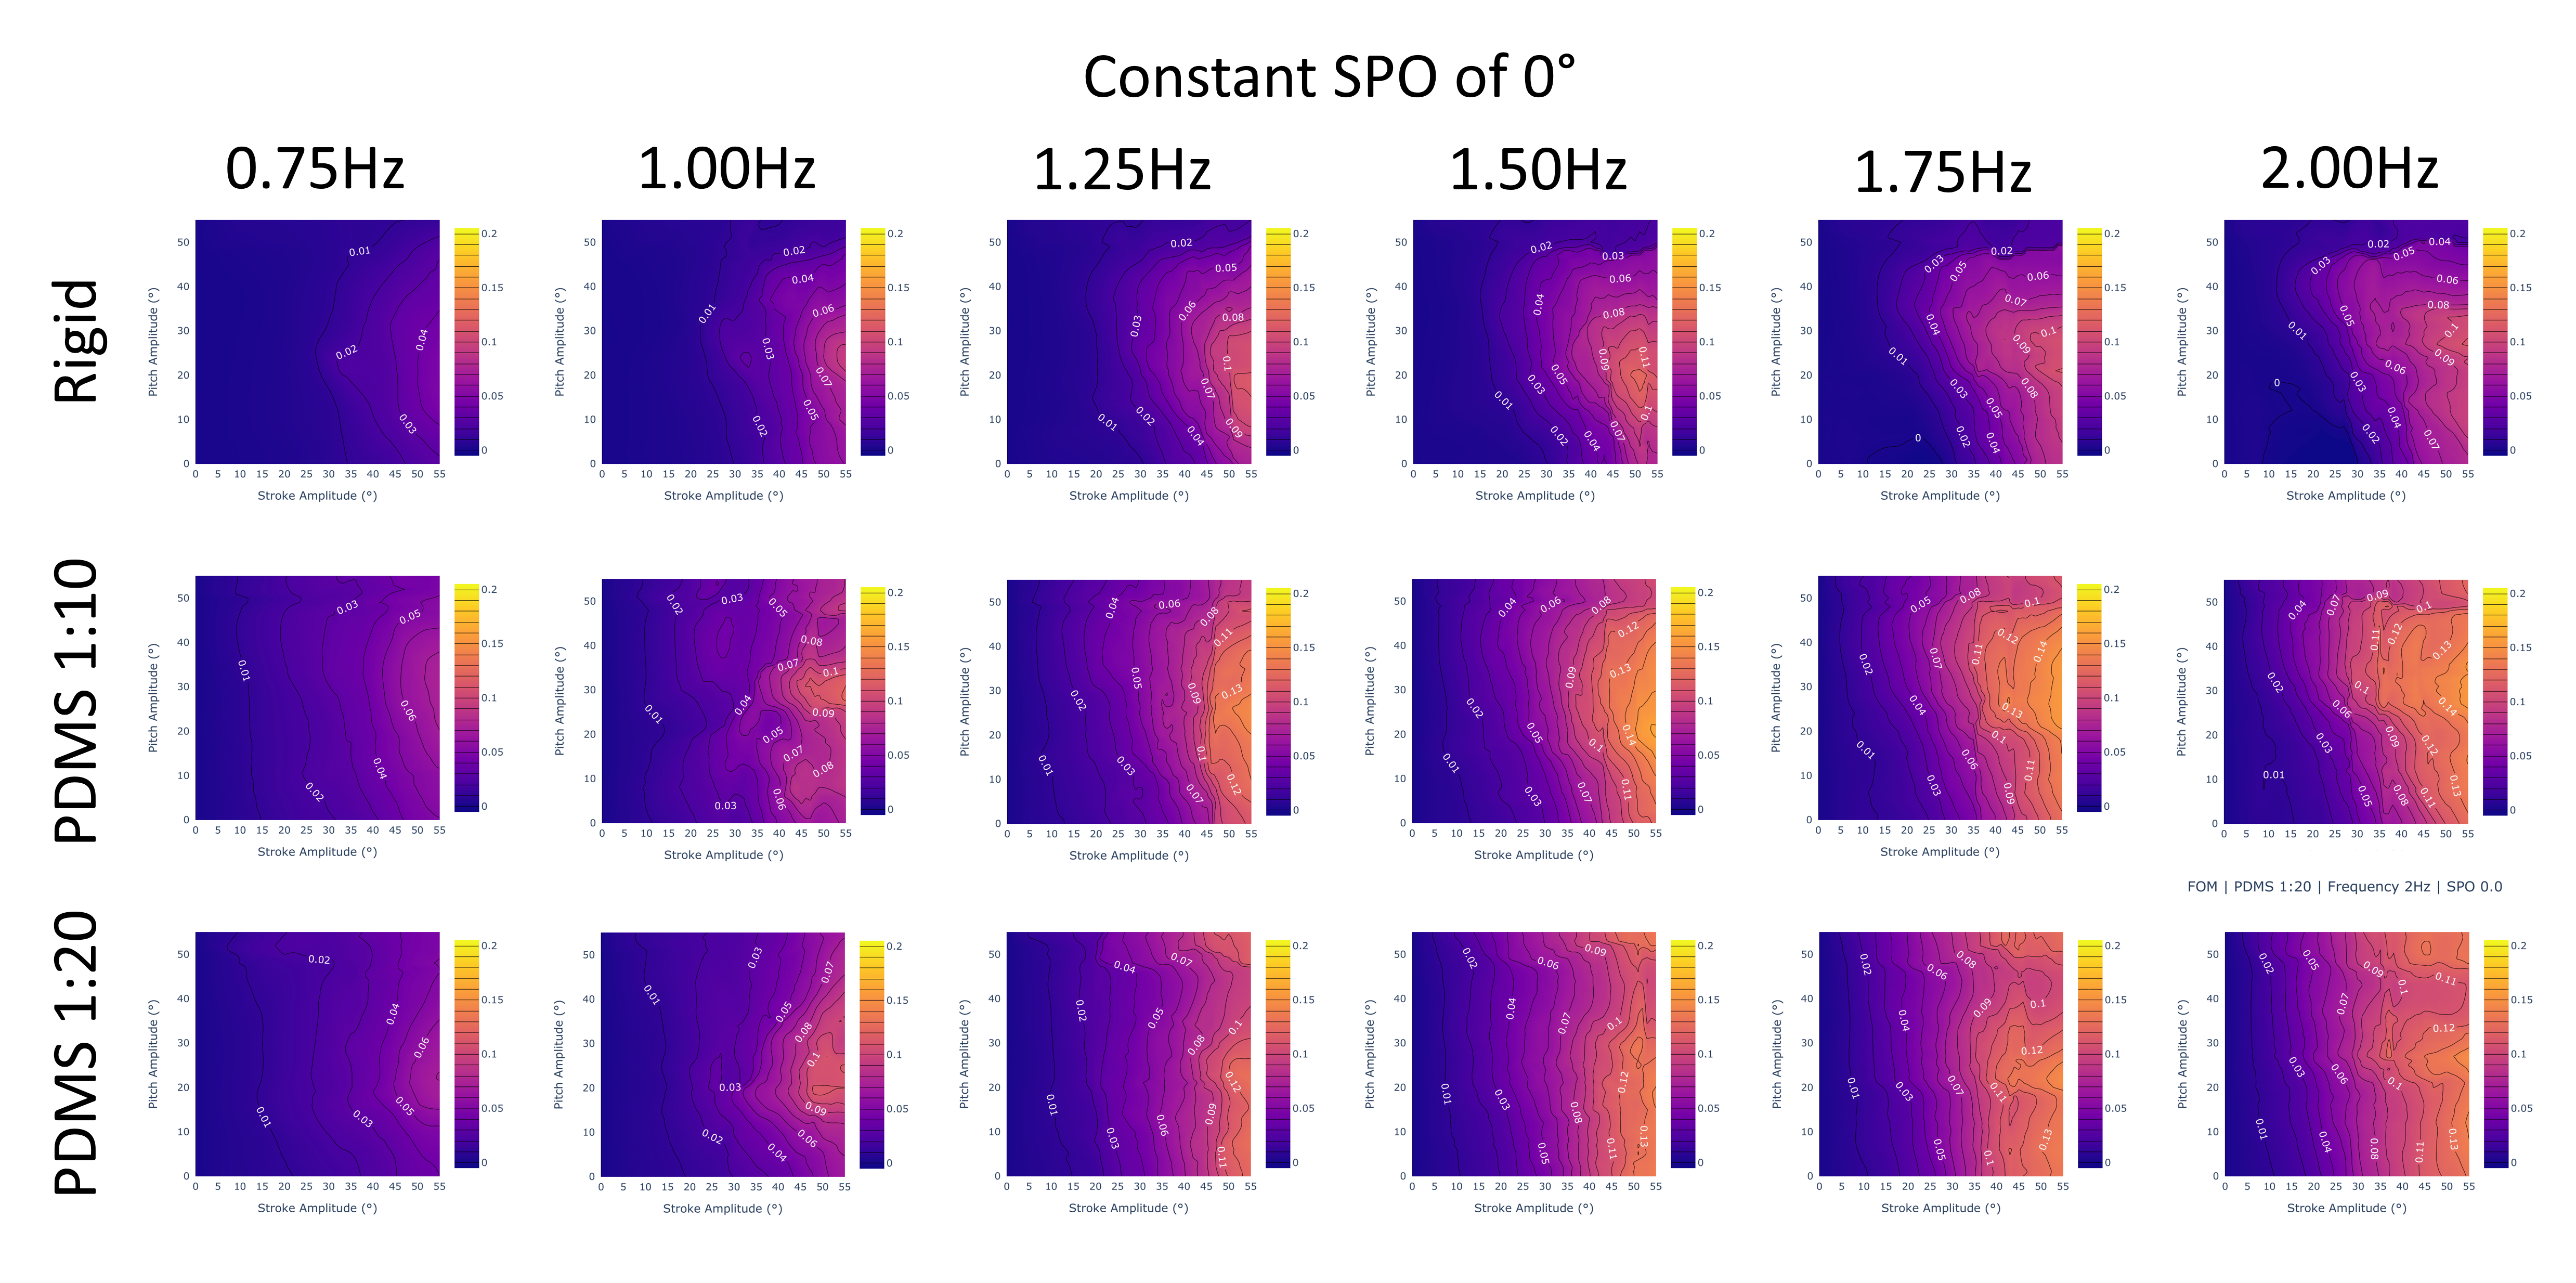
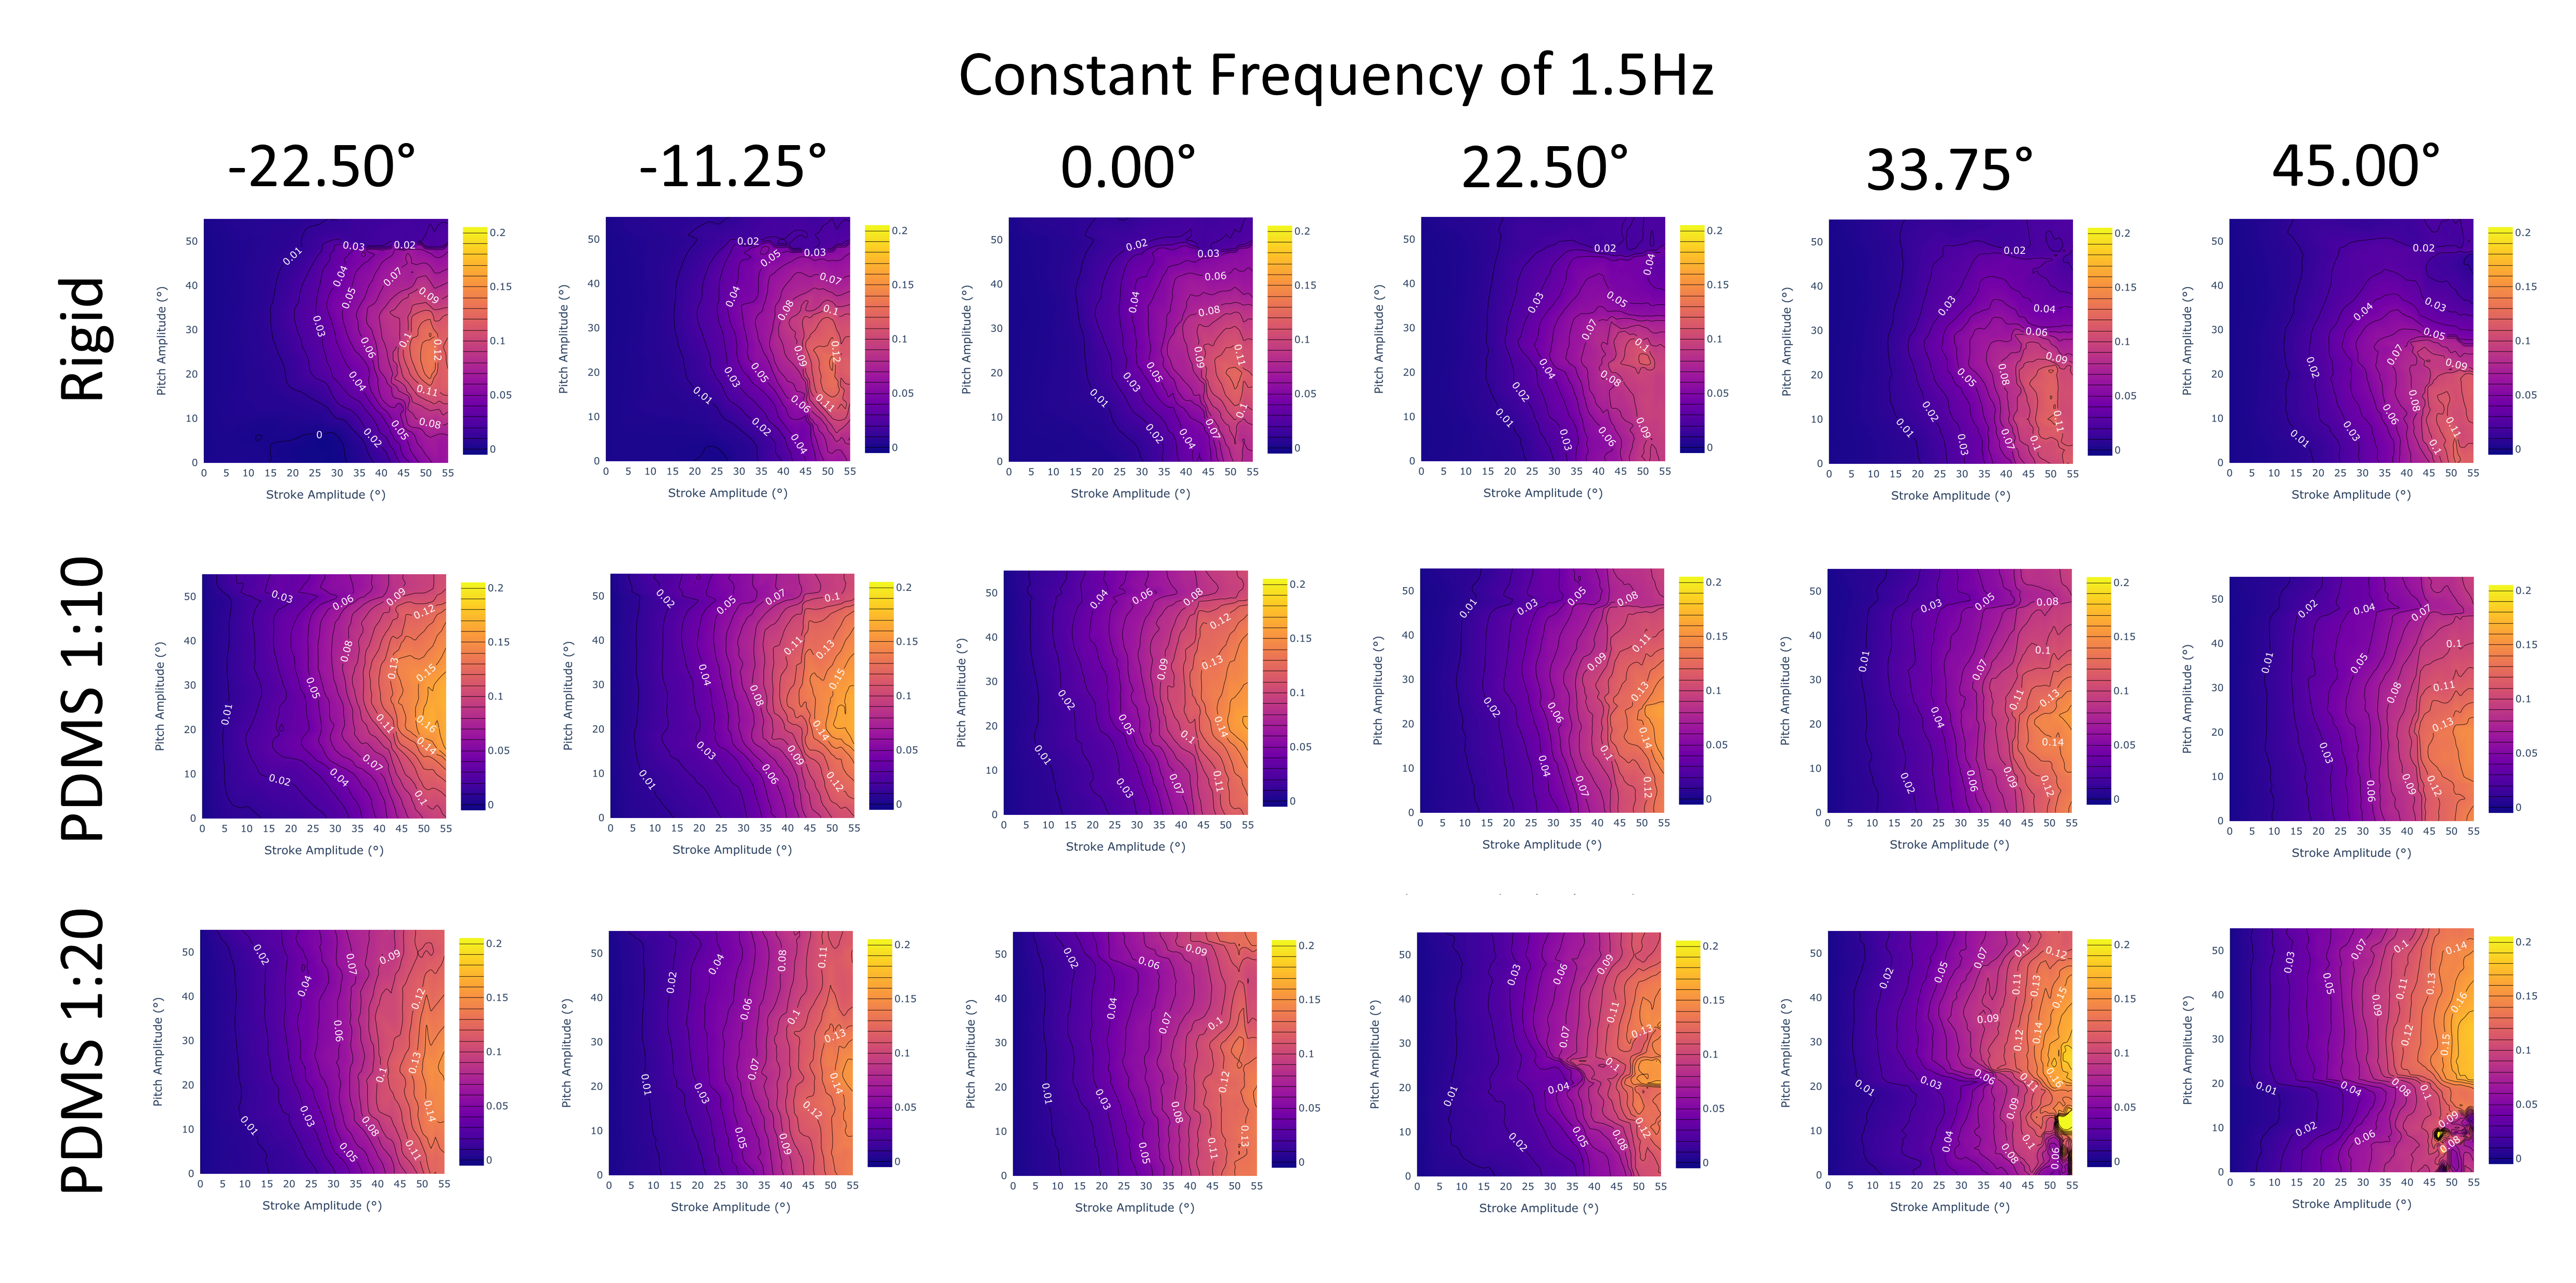
This analysis allows us to conclude that the PDMS 1:10 fin design is the most efficient out of all 3 designs, with the highest thrust generation and efficiency. Following in second is the PDMS 1:20 fin, which has the second largest thrust generation and efficiency. These trends are confirmed across the ranges of stroke and pitch (Figure 6) as well as frequency (Figure 7) and SPO (Figure 8). This suggests that the most efficient design that is able to generate the largest thrust may lie between the two, and is something of interest for future exploration.
From Figure 7, we observe that across the entire range of frequencies, the PDMS 1:10 outperforms both the rigid and PDMS 1:20 fin designs. Additionally, we observe that regardless of fin design, increasing the frequency will improve the FOM metric.
From Figure 8, we observe that across the entire range of stroke-pitch offset, the PDMS 1:10 outperforms both the rigid and PDMS 1:20 fin designs. Additionally, we observe that regardless of fin design, a more negative offset will slightly improve the FOM metric, although the difference is very marginal. At high SPO, the PDMS 1:20 fin design appears to diverge from the expected trends at 22.5 ∘ or higher and invites future exploration. In the future, revisiting the model’s training data for high SPO will likely resolve the issue.
We conclude the following from the data interpolated:
-
1.
The best performing fin design is PDMS 1:10, followed by PDMS 1:20. Both consume similar amounts of power, but PDMS 1:10 fins produce a higher thrust. The rigid fin consumes more power and produces less thrust.
-
2.
The most optimal fin design likely lies in between the PDMS 1:10 and 1:20 fins.
-
3.
The most efficient gait will occur at a high stroke (40-55), centered pitch (20-35), high frequency (2Hz) and low SPO (-22.5∘).
Conclusion and Future Work
We use a forward-passing LSTM model to generate kinematic interpolations and for fin gaits with the goal of integration onto a control system to optimize for the efficiency of gaits and provide a better understanding of material designs and their relation to efficiency.
We evaluate four different models for thrust and power to interpolate between experimental data with high accuracy: the linear model, quartic polynomial model, Convolutional Neural Network, and Long-Short-Term Memory model. All four evaluated models accomplish all three criterion we laid out. They are able to:
-
•
Complete a baseline model that inputs gait parameters to output either thrust or power with minimal error
-
•
Retrain on different designs and maintain a similar or better accuracy
-
•
Run at a speed and size suitable for integration onto a control system (100 computations per second)
Out of all four models, we find that the LSTM model is able to produce the most accurate results on both the full data set and when we remove specific gaits to create interpolations.
Using the generated interpolations, we develop a dimensionless Figure of Merit that is able to compare our fin efficiency to other flapping systems and evaluate the efficiency of gaits onboard our control system.
With the FOM, we conclude that both PDMS materials are more efficient than the rigid fin, with the PDMS 1:10 fin generating the maximum thrust with the lowest power consumption. There were observable trends consistent across all materials, with a higher frequency, stroke amplitude, and negative Stroke-Pitch-Offset all contributing to a greater efficiency. The most efficient gait was concluded to be for the PDMS 1:10 data set with a -22.5∘ Stroke-Pitch-Offset and frequency of 2 Hz. This understanding will allow us to both design fins that generate a higher thrust and maintain the highest power efficiency, and tune an inverse search model to search gaits it knows to be power-efficient or optimal.
In the future, we aim to integrate the inverse search model with the FOM as a weighting onto the control system to generate the most efficient or powerful gaits. Before this integration is complete, we will combine both the thrust and power LSTM models to decrease the model’s compute time on the control system. Additionally, we will further verify our FOM by introducing physical bounds on the thrust/power values a model can predict and conducting additional tests with non-zero flow speeds. Introducing disturbances and turbulence into the water ahead of time will aid in evaluation of model efficiency prediction accuracy for dynamic environments similar to those the UUV will swim in.
References
- Eloy (2012) Eloy, C. 2012. Optimal Strouhal number for swimming animals. Journal of Fluids and Structures, 30: 205–218.
- Geder et al. (2017) Geder, J.; Ramamurti, R.; Pruessner, M.; and Viswanath, K. 2017. Underwater Thrust Performance of Tandem Flapping Fins: Effects of Stroke Phasing and Fin Spacing. In OCEANS 2017 - Anchorage, 1–7.
- Geder et al. (2013) Geder, J. D.; Ramamurti, R.; Pruessner, M.; and Palmisano, J. 2013. Maneuvering performance of a four-fin bio-inspired UUV. In 2013 OCEANS - San Diego, 1–7. ISSN: 0197-7385.
- Geder et al. (2021) Geder, J. D.; Ramamurti, R.; Sampath, K.; Pruessner, M.; and Viswanath, K. 2021. Fluid-Structure Modeling and the Effects of Passively Deforming Fins in Flapping Propulsion Systems. In OCEANS 2021: San Diego – Porto, 1–9. ISSN: 0197-7385.
- Lauder and Madden (2006) Lauder, G. V.; and Madden, P. G. A. 2006. Learning from fish: Kinematics and experimental hydrodynamics for roboticists. International Journal of Automation and Computing, 3(4): 325–335.
- Lee et al. (2022) Lee, J.; Viswanath, K.; Geder, J.; Sharma, A.; Pruessner, M.; and Zhou, B. 2022. Data-Driven Machine Learning Models for a Multi-Objective Flapping Fin Unmanned Underwater Vehicle Control System.
- Masud, La Mantia, and Dabnichki (2022) Masud, M. H.; La Mantia, M.; and Dabnichki, P. 2022. Estimate of Strouhal and Reynolds numbers for swimming penguins. Journal of Avian Biology, 2022(2): e02886. _eprint: https://onlinelibrary.wiley.com/doi/pdf/10.1111/jav.02886.
- Mignano et al. (2019) Mignano, A. P.; Kadapa, S.; Tangorra, J. L.; and Lauder, G. V. 2019. Passing the Wake: Using Multiple Fins to Shape Forces for Swimming. Biomimetics, 4(1): 23. Number: 1 Publisher: Multidisciplinary Digital Publishing Institute.
- Nedelcu et al. (2018) Nedelcu, A.-T.; Faităr, C.; Stan, L.-C.; and Buzbuchi, N. 2018. Underwater Vehicle CFD Analyses and Reusable Energy Inspired by Biomimetic Approach. preprint, ENGINEERING.
- Nguyen, Lee, and Ahn (2016) Nguyen, P. L.; Lee, B. R.; and Ahn, K. K. 2016. Thrust and swimming speed analysis of fish robot with non-uniform flexible tail. Journal of Bionic Engineering, 13(1): 73–83.
- Palmisano et al. (2013) Palmisano, J. S.; Geder, J. D.; Pruessner, M. D.; and Ramamurti, R. 2013. Power and Thrust Comparison of Bio-mimetic Pectoral Fins with Traditional Propeller-based Thrusters. In 18th International Symposium on Unmanned Untethered Submersible Technology, 8.
- Rohr and Fish (2004) Rohr, J. J.; and Fish, F. E. 2004. Strouhal numbers and optimization of swimming by odontocete cetaceans. Journal of Experimental Biology, 207(10): 1633–1642.
- Rohr et al. (1998) Rohr, J. J.; Hendricks, E. W.; Quiqley, L.; Fish, F. E.; and Gilpatrick, J. W. 1998. Observations of Dolphin Swimming Speed and Strouhal Number.:. Technical report, Defense Technical Information Center, Fort Belvoir, VA.
- Sampath et al. (2020) Sampath, K.; Geder, J. D.; Ramamurti, R.; Pruessner, M. D.; and Koehler, R. 2020. Hydrodynamics of tandem flapping pectoral fins with varying stroke phase offsets. Physical Review Fluids, 5(9): 094101. Publisher: American Physical Society.
- Tangorra et al. (2007) Tangorra, J. L.; Davidson, S. N.; Hunter, I. W.; Madden, P. G. A.; Lauder, G. V.; Dong, H.; Bozkurttas, M.; and Mittal, R. 2007. The Development of a Biologically Inspired Propulsor for Unmanned Underwater Vehicles. IEEE Journal of Oceanic Engineering, 32(3): 533–550.
- Taylor, Nudds, and Thomas (2003) Taylor, G. K.; Nudds, R. L.; and Thomas, A. L. R. 2003. Flying and swimming animals cruise at a Strouhal number tuned for high power efficiency. Nature, 425(6959): 707–711.
- Techet (2008) Techet, A. H. 2008. Propulsive performance of biologically inspired flapping foils at high Reynolds numbers. Journal of Experimental Biology, 211(2): 274–279.
- Triantafyllou, Triantafyllou, and Yue (2000) Triantafyllou, M. S.; Triantafyllou, G. S.; and Yue, D. K. P. 2000. Hydrodynamics of Fishlike Swimming. Annual Review of Fluid Mechanics, 32(1): 33–53.
- Yun, Kim, and Kim (2015) Yun, D.; Kim, K.-S.; and Kim, S. 2015. Thrust characteristic of a caudal fin with spanwise variable phase. Ocean Engineering, 104: 344–348.