Observation and quantification of pseudogap in unitary Fermi gases
The nature of pseudogap lies at the heart of strongly-interacting superconductivity and superfluidity. With known pairing interactions, unitary Fermi gases provide an ideal testbed to verify whether a pseudogap can arise from many-body pairing. Here we report the observation of the long-sought pair-fluctuation-driven pseudogap in homogeneous unitary Fermi gases of lithium-6 atoms, by precisely measuring the spectral function through momentum-resolved microwave spectroscopy without the serious effects of final-state effect. We find a large pseudogap above the superfluid transition. The inverse pair lifetime exhibits a thermally-activated exponential behavior, uncovering the microscopic virtual pair breaking and recombination mechanism. The obtained large, -independent single-particle scattering rate is comparable with that set by the Planckian limit. Our findings quantitatively characterize the pseudogap in strongly-interacting Fermi gases, highlighting the role of preformed pairing as a precursor to superfluidity.
Introduction
The understanding of the pseudogap phase, a very abnormal “normal” state of cuprate superconductors, is widely believed to be the key to unlocking the mysterious microscopic mechanism of high- superconductivity (?, ?). Intuitively, the pseudogap, manifested as a gap in the normal-state single-particle energy spectrum, would arise from strong pair fluctuations, as a precursor of coherent pair condensation beyond the standard Bardeen-Cooper-Schrieffer (BCS) theory (?). However, in cuprate superconductors, the confirmation of such a simple scenario is hindered by some competing quantum orders, such as the d-density wave (?), the pair-density wave (?) and the stripe phase (?), particularly in the underdoped region (?, ?).
Unitary Fermi gases, featuring a diverging -wave scattering length (?), provide an ideal platform and quantum simulator (?) for observing the long-sought pair-fluctuation-driven pseudogap (?), due to their unprecedented controllability and purity (?, ?, ?). To this end, radio-frequency (rf) spectroscopy (?, ?, ?) was developed to probe the pairing of fermions; particularly, with momentum resolution, the single-particle spectral function (?, ?, ?) was measured. Unfortunately, the experimental resolution was insufficient to resolve the two expected quasiparticle branches. Instead, only a very broad spectral response was observed, with the dispersion exhibiting a back-bending behavior at wavenumber larger than the Fermi wavenumber (?, ?). This back-bending behavior was attributed to a BCS-like quasiparticle dispersion, providing primitive indication of a pseudogap (?). However, there has been an on-going debate regarding this interpretation (?, ?, ?), since the back-bending at could occur in any short-range interacting Fermi systems (?) and the observed spectra have also been argued to be interpretable by a Fermi-liquid description (?, ?, ?).
In this work, we prepare a homogeneous unitary Fermi gas of 6Li atoms in a cylindrical box trap (?, ?, ?, ?), and develop a novel momentum-resolved microwave spectroscopy to probe the fermion spectral function . On the one hand, the box trap eliminates the trap inhomogeneity which prohibited the extraction of a homogeneous spectral function in previous experiments. On the other hand, the microwave spectroscopy removes the complications associated with the final-state interactions (?, ?) in the widely adopted rf spectroscopy (?, ?), particularly for 6Li atoms, such as spectral shift and broadening. Here the final atoms in the high-lying hyperfine level are essentially free from interactions with the initial atoms in the many-body system. Although the microwave transition is sensitive to magnetic field variations, we can achieve an ultrahigh stability of the magnetic field and thus realize this unique microwave transition with high energy-resolution
We simultaneously observe the two BCS-like quasiparticle branches in the spectral function, both below and above the superfluid transition temperature , which is a direct manifestation of pairing. The obtained large above unambiguously reveals the existence of a pair-fluctuation-driven pseudogap, where is the pairing (pseudo)gap and is the Fermi energy. The pseudogap persists up to the highest temperature () that we have achieved, indicating a sizable pseudogap window in the unitary Fermi gas. Furthermore, by analyzing the energy distribution curve (EDC) in , a thermally activated exponential dependence of the inverse pair lifetime is revealed, with an activation energy of , where is the low- pairing gap. This underlies the mechanism that the pair lifetime is dominated by a virtual pair breaking and recombination process. The single-particle scattering rate reaches the universal Planckian limit (?, ?, ?) of near , where and are the Boltzmann and reduced Planck constants, respectively. Our result settles the long-standing debates on the existence of a pseudogap in unitary Fermi gases, which provides crucial information in establishing a proper theory of strongly-interacting Fermi superfluid, and supports pairing as a possible origin of the pseudogap in high-Tc superconductors, within the framework of preformed-pair superconductivity.
Experimental scheme and setup
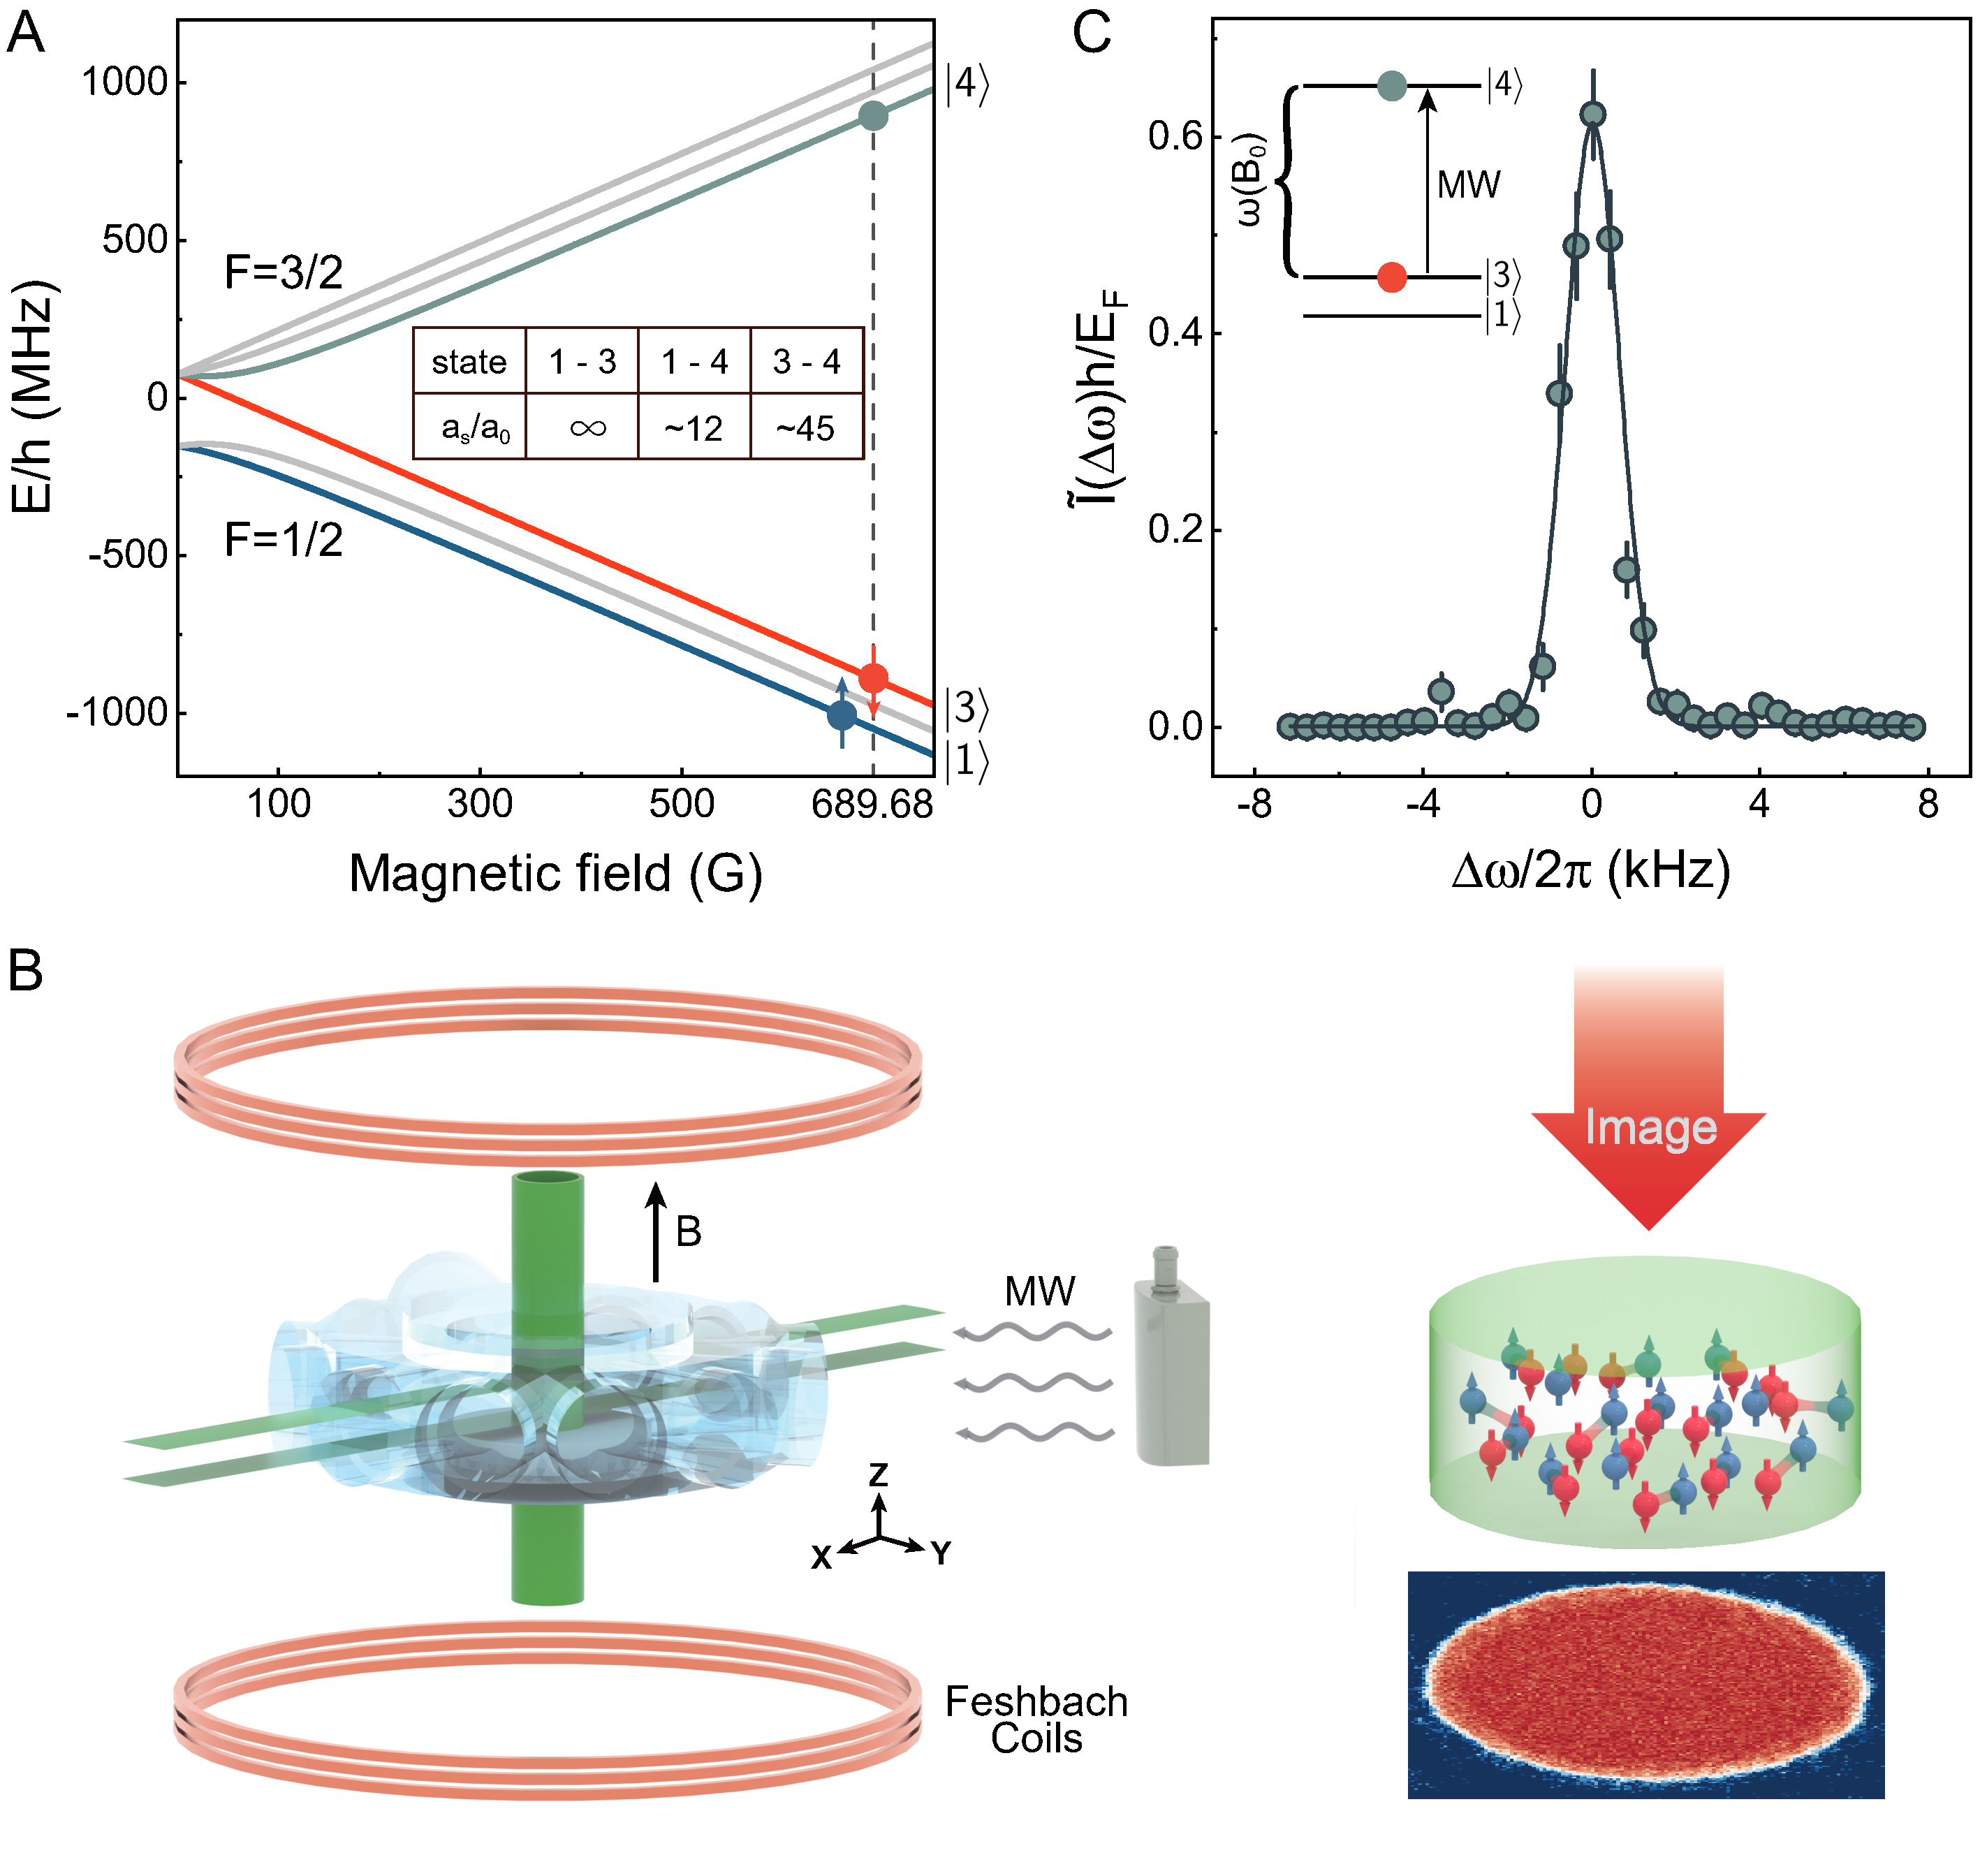
The experimental procedure of creating a homogeneous unitary Fermi gas at a given temperature follows our previous work (?), except for two main distinctions. First, 6Li atoms are equally prepared in the two hyperfine levels and at the magnetic field G, where inter-spin interactions are resonant and unitarily limited (?). Second, a cylindrical box trap with a diameter of 84 m and a height of 41 m is formed by a hollow cylinder and two sheets of repulsive 532 nm laser beams, as depicted in Fig. 1B. After the initial state preparation, approximately atoms at are confined in the cylindrical box trap (?), where is the Fermi temperature. We then adiabatically lower the potential depth in 0.6 s and hold the box trap for an additional 0.5 s to reach thermal equilibrium. For a homogeneous unitary Fermi gas at (e.g., see the in-situ image in Fig. 1B), the realized density is , yielding a large kHz. Here, is the atomic mass and . To determine the temperature at a given final depth, we measure the energy through Bragg spectroscopy in the long-wavelength limit (?) and compare it with the known equation of state (EoS) (?, ?). As an independent validation of our EoS thermometry, the pair momentum distribution is also measured through the combination of an interaction quench to the molecular side of the Feshbach resonance and a matter-wave focusing technique (?, ?), which unambiguously reveals the onset of pair condensation at (see Fig. S1).
In our momentum-resolved microwave spectroscopy, atoms in level are transferred to an initially unoccupied hyperfine level by using a Gaussian-shaped microwave pulse with an intensity of at the time interval . Here, is the maximal coupling strength of the pulse, characterized by a peak Rabi frequency of approximately kHz, s is the pulse duration, and s represents the half width of the pulse. We then immediately turn off the box trap, let the gas expand ballistically in the residual magnetic curvature for 5 ms, and finally measure the density distribution of atoms in level using absorption imaging with a high signal-to-noise ratio (SNR) and a high spatial resolution (?). We determine the transferred atom number as a function of the microwave frequency offset , where is the absolute microwave frequency and MHz corresponds to the Zeeman energy splitting between the and hyperfine levels at G. According to Fermi’s golden rule, within the linear response, is proportional to , where is the initial atom number in level (?). Thus, we define a dimensionless microwave spectrum , which is normalized in accordance with .
The use of the hyperfine level as the final state brings two key advantages due to the negligible -wave scattering lengths and (see the inset table of Fig. 1A): (i) the final-state interaction can be neglected, i.e., ; and (ii) the isotropic momentum information carried by the outcoupled atoms in level can be accurately extracted through ballistic expansion. More specifically, we perform an inverse Abel transform (?) on the measured to reconstruct the full density distribution (see Fig. S4) and then obtain the momentum distribution via appropriate variable substitution (?), owing to the scaling satisfied in the ballistic expansion. Due to the negligible momentum of the microwave photon, we have (?, ?), where the single-particle excitation energy is offset by the free-particle kinetic energy , as a result of energy conservation. Thus, the single-particle spectral function can be determined by performing proper transformations on and dividing by the Fermi function (?), where the chemical potential can be accurately obtained from the known thermodynamic EoS (?, ?) for the given reduced temperature .
Unlike the radio-frequency transition used in previous experiments (?, ?), the realization of a high energy-resolution microwave transition represents a great experimental challenge. This is because at G, the energy gradient is approximately MHz/G. In comparison with 8.48 kHz/G, we need to significantly improve the magnetic field stability by at least two orders in magnitude, to the level of 0.1 ppm (parts per million). To this end, we develop and combine several methods to stabilize the magnetic field, e.g., passive magnetic field shielding, ultrastable current sources, active magnetic field compensation, etc (see Fig. S2). To evaluate the final stability of the magnetic field, two complementary measurements are implemented for an ideal Fermi gas, where all the atoms are initially prepared in level . On the one hand, Rabi oscillations between levels and are measured (see Fig. S3), from which an unprecedented small uncertainty of approximately 20 G at G is inferred (?). On the other hand, as shown in Fig. 1C, the microwave spectrum is Fourier-limited. We obtain a very high energy-resolution of kHz for the microwave transition (i.e., approximately ), by fitting the data to a Gaussian function.
Single-particle spectral function
The ability to create a homogeneous unitary Fermi gas with a large Fermi energy and the realization of momentum-resolved microwave spectroscopy with a negligible final-state effect enable us to measure the single-particle spectral function in previously inaccessible parameter regimes. We first consider two limiting cases, i.e., unitary Fermi gases prepared at the lowest () and the highest temperatures (). The advantage of eliminating the final-state effect can be seen from the normalized dimensionless microwave rate at these two temperatures, as reported in Fig. 2, A and B.
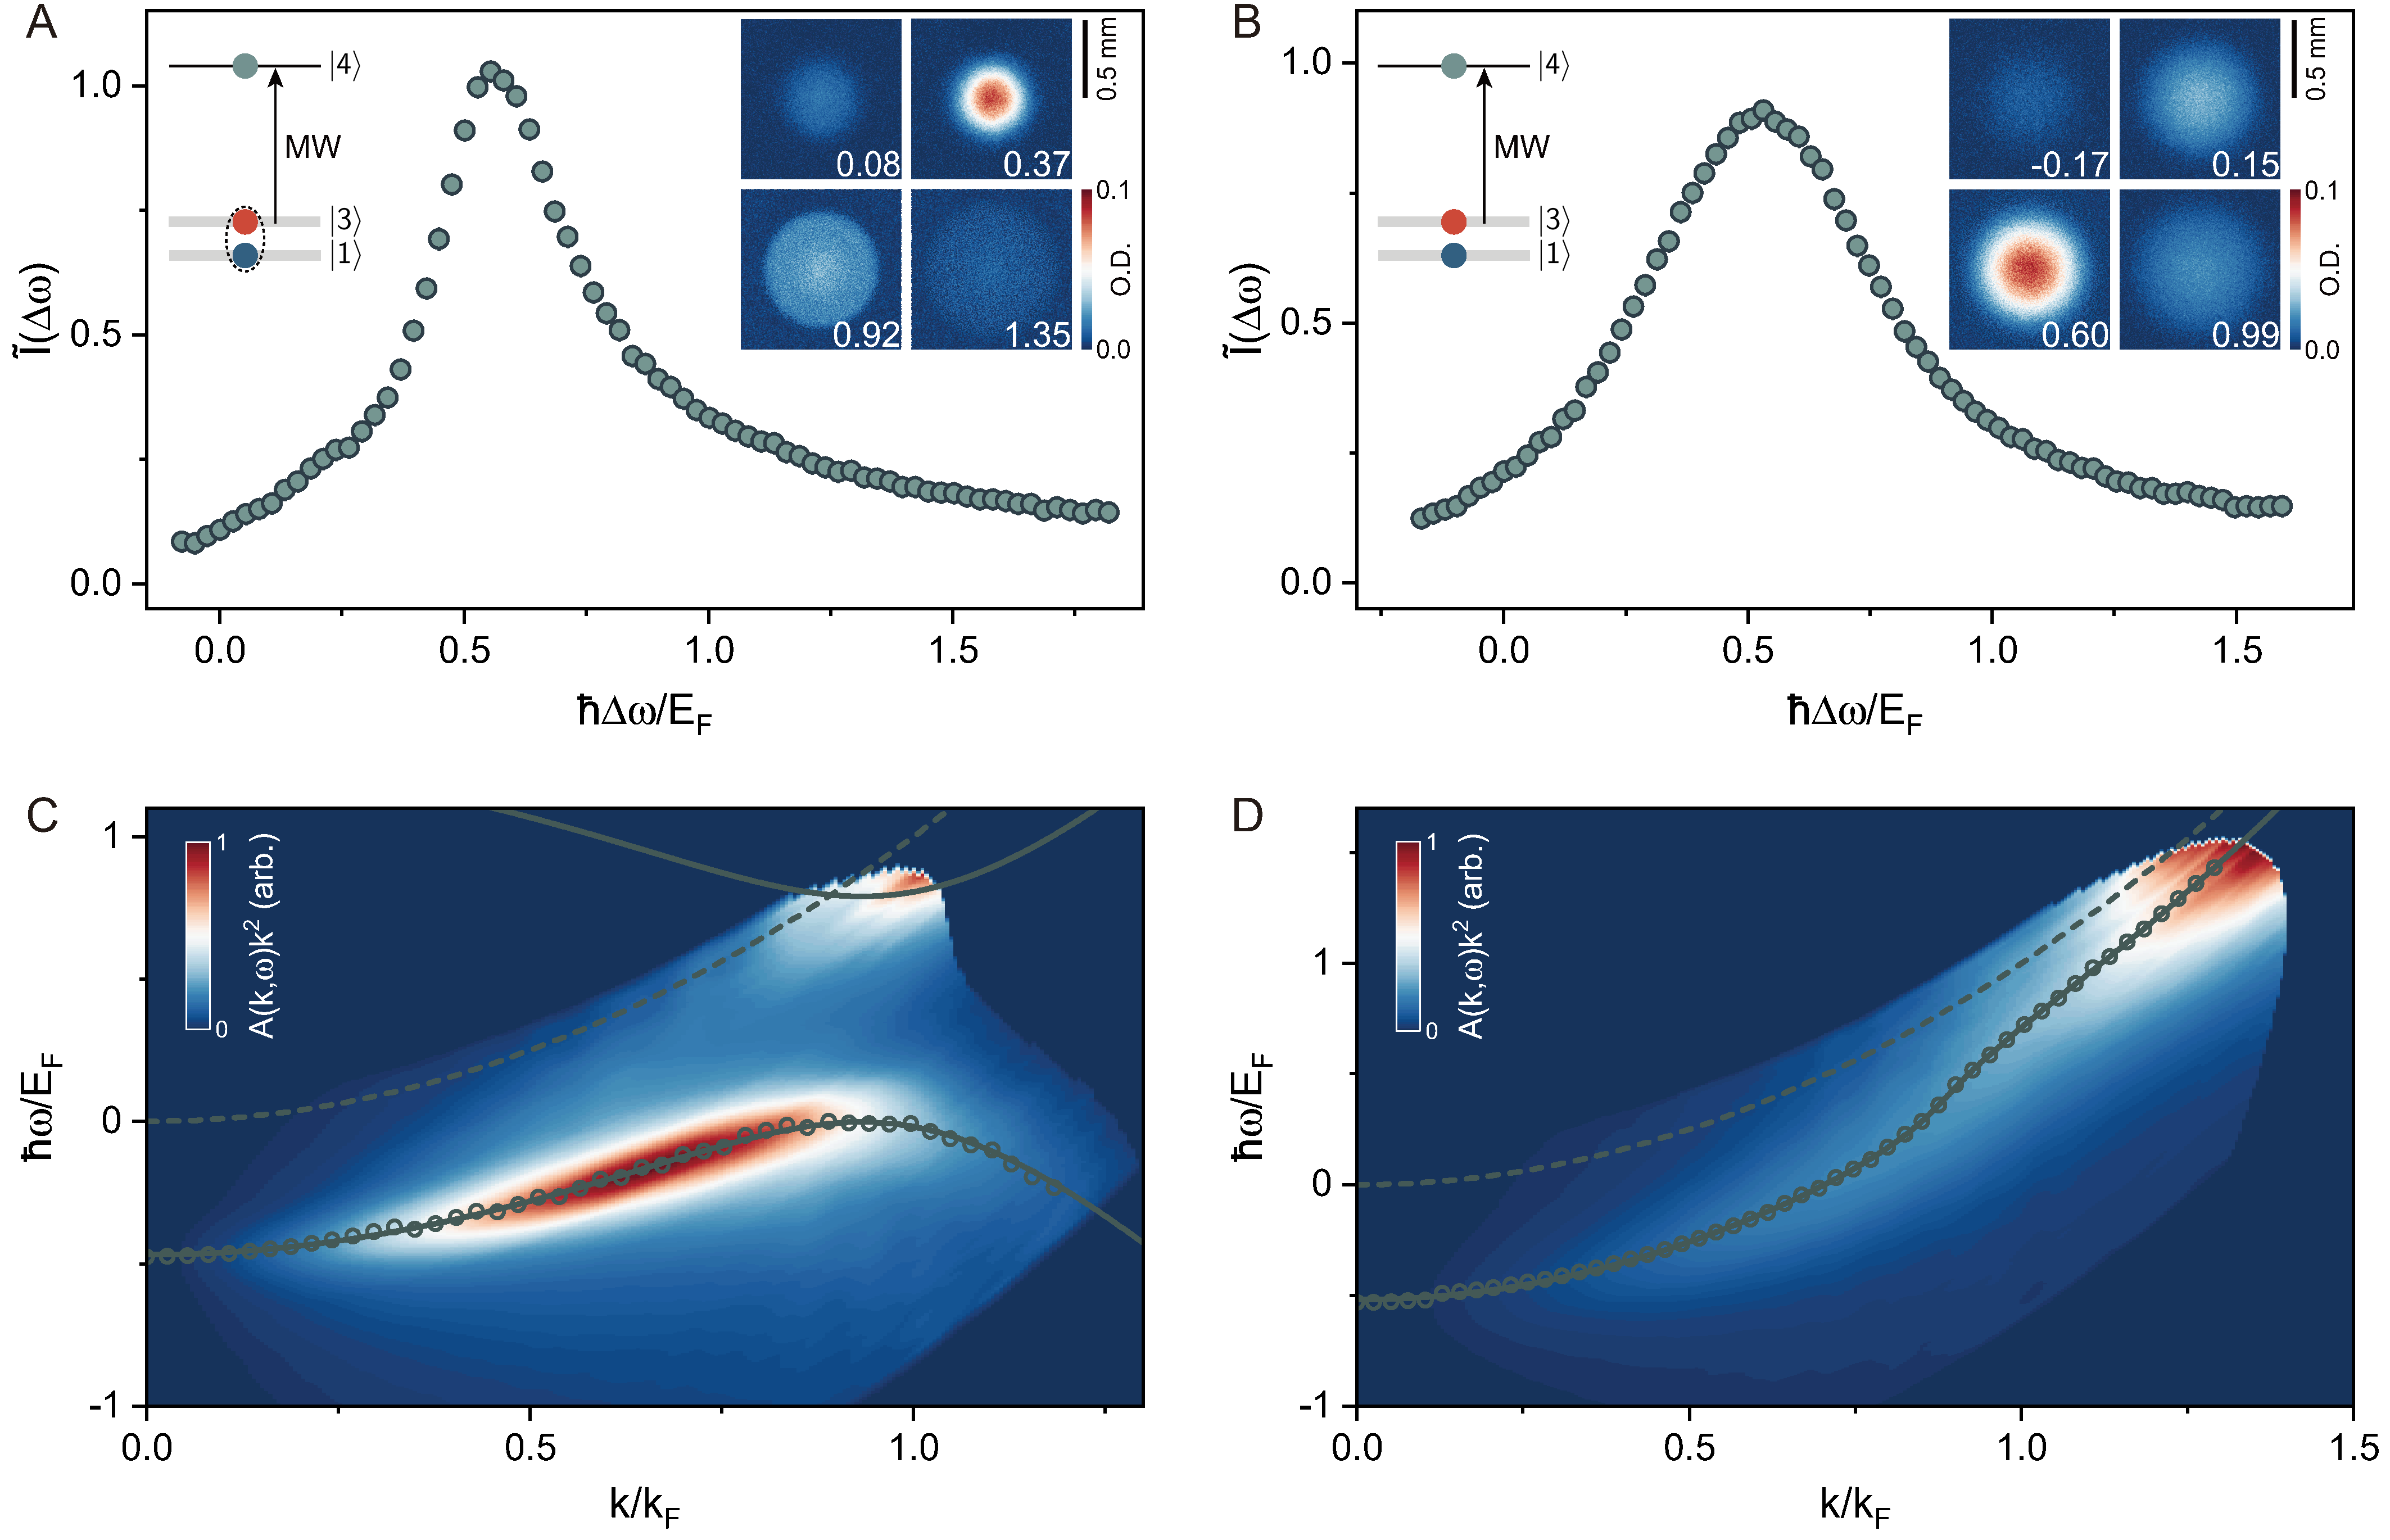
In comparison with a similar recent measurement (?) but using the transition, two distinctive features are observed in our microwave spectra: (i) The spectral width , i.e., the full width at half maximum of the spectrum, is narrower than previous results, which indicates a larger spectroscopic pair size , according to the relation (?). Furthermore, our measured increases by only as temperature increases from to , implying that the pair size of fermions does not change much over a wide range of temperatures, especially at . (ii) The peak position of the spectrum, which is mainly determined by and the Hartree energy (?), remains almost unchanged, i.e., () at (). This suggests that, as increases, may increase to compensate for the decrease in . The weak temperature dependence of both spectral width and peak position implies a smooth change in the many-body pairing gap across . We note that, the spectral response falls off as at , where is the Tan’s contact (?, ?, ?) characterizing short-range pair correlations. However, a quantitative verification of such a decay is difficult here, since a high SNR measurement can be achieved only in the range of . This is because, unlike previous experiments in which the pulse strength increased at high frequencies (?, ?), we apply the same microwave intensity for all the frequencies to avoid complications in analyzing the spectra.
To directly extract the many-body pairing gap, we present the momentum-resolved microwave spectra at and in Fig. 2, C and D, respectively. For , we observe two well-separated excitation branches, despite the relatively weak signal of the upper branch, which arises from thermally excited quasiparticles (?). In particular, the spectral weight near the Fermi surface (i.e., and ) is significantly depleted, unambiguously revealing the existence of a pairing gap . The observation of two quasiparticle branches and the direct visualization of the pairing gap highlight the technical advantage of our momentum-resolved microwave spectroscopy. We emphasize that in all previous measurements of momentum-resolved rf spectroscopy (?, ?, ?), only the lower quasiparticle branch was observed, and the data were plagued by the presence of trap inhomogeneity. The identification of the pairing gap relies heavily on its back-bending behavior at an unphysically large wavenumber . This has caused serious doubts about the pairing interpretation of the back-bending behavior (?, ?).
With a much improved SNR in a homogeneous setting, we observe the back-bending at , which is lower than as expected. Here, we quantitatively extract the pairing gap , by identifying the locus of the maximal spectral response of the lower excitation branch (see circles in Fig. 2C) with a BCS-like dispersion (?, ?):
| (1) |
Here, and are the quasiparticle energy dispersions in the upper and lower branches, respectively, with being the effective mass. The Hartree energy leads to a downshift of the spectrum from the free-particle dispersion (see the dashed line in Fig. 2C). The fitting curve to with , and as fitting parameters is shown as the lower solid line in Fig. 2C, which is in excellent agreement with the experimental data. The obtained pairing gap is at , slightly smaller than the most recent experimental result of from Bragg spectroscopy (?). The fit also gives and . Using these fitting parameters, is plotted as the upper solid line in Fig. 2C, which reasonably describes the observed upper quasiparticle branch.
At sufficiently high temperatures, one expects a single excitation branch with a quadratic dispersion (?, ?) in . We indeed observe a single upward branch for , as shown in Fig. 2D. However, the locus of exhibits an “S-shape” dispersion, which is particularly evident near . This can be attributed to the existence of a rather small pairing gap at . The two quasiparticle branches with BCS-like dispersions still exist; however, their thermal broadening smears out the spectral gap. Nevertheless, as the wavenumber increases across the Fermi surface, the maximal spectral response evolves from the lower to the upper branch, thus resulting in an “S-shape” dispersion.
This picture motivates us to explain the “S-shape” dispersion with a phenomenological model: , where we approximate . Here, is the crossover point, and controls the crossover rate between the two branches. At small wavenumber , and , so that reduces to . Conversely, holds at large wavenumber. Moreover, at the crossover point, indicates the equal contribution of the two branches to the maximal spectral response. By using the phenomenological dispersion to fit the observed , as shown by the solid line in Fig. 2D, we find a small pairing gap of , as anticipated. A larger Hartree shift of is also extracted, which leads to an essentially unchanged peak position in (see Fig. 2, A and B), as we speculated above.
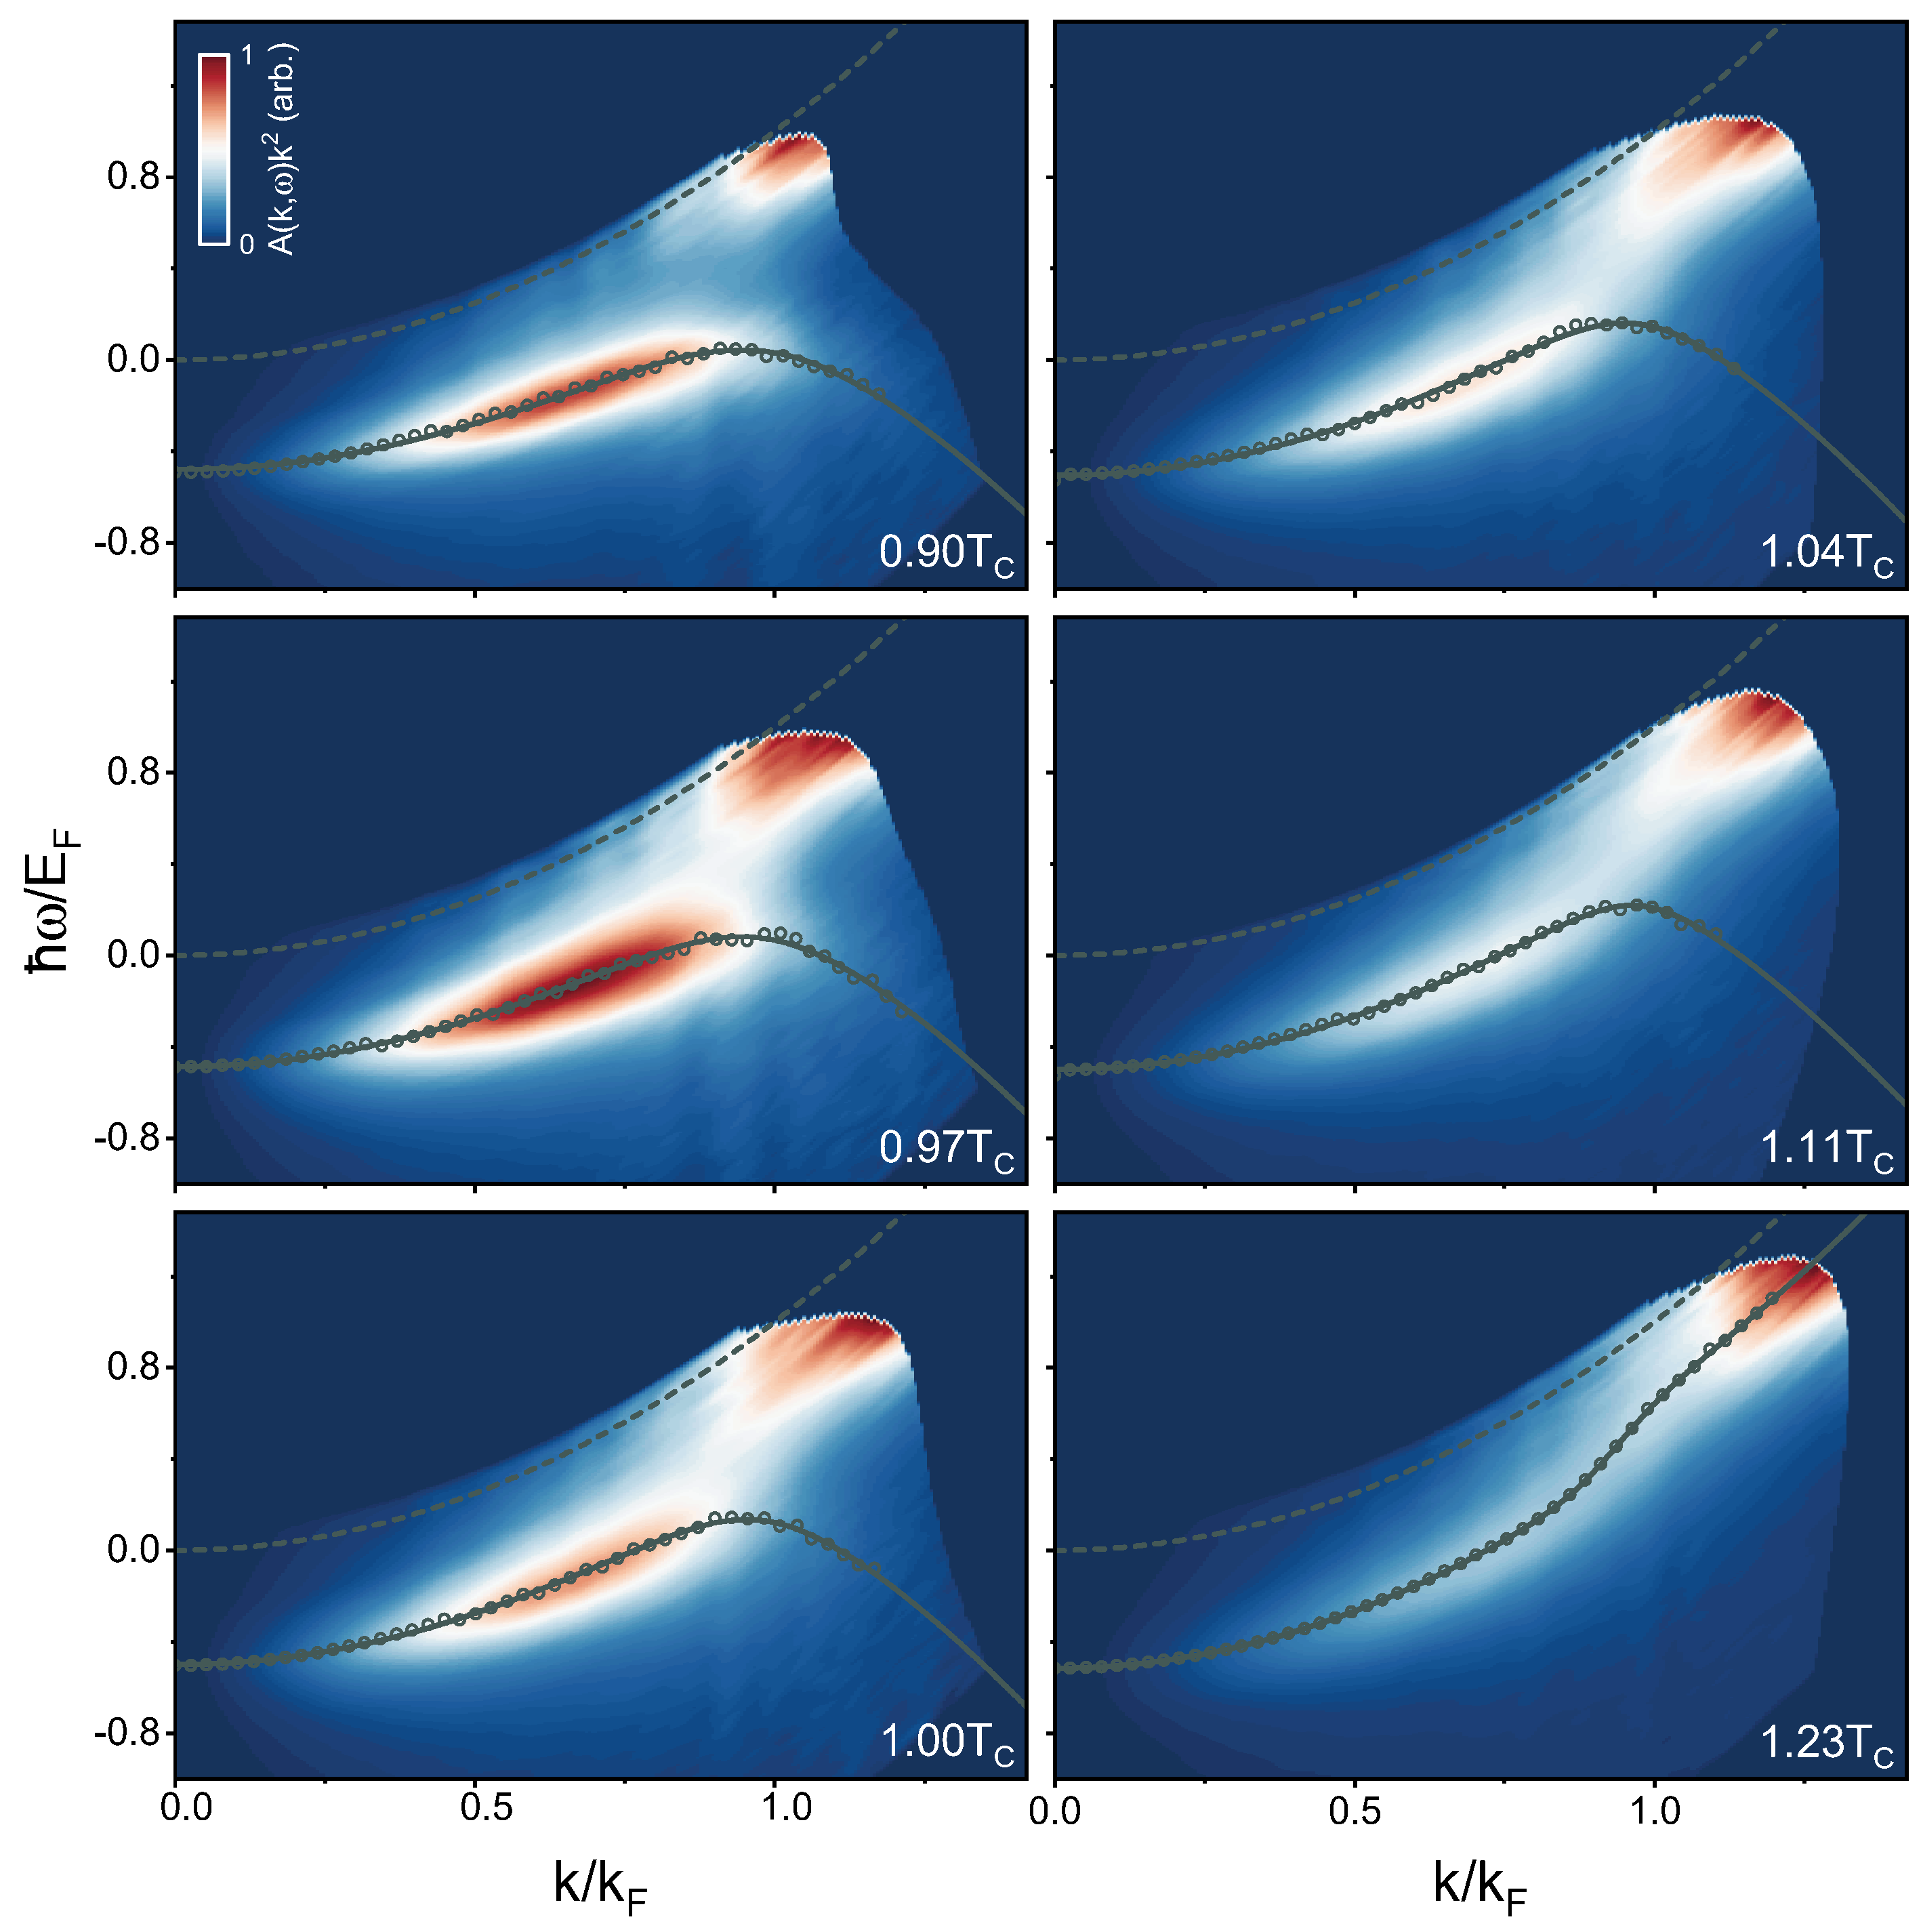
We now investigate how the spectral function varies with temperature and then determine the -dependent pairing gap across . As shown in Fig. 3, over a wide temperature range of , the lower and upper branches are clearly distinguishable, with their relative spectral weights varying smoothly across . More importantly, the suppression of spectral weight near the Fermi surface is unequivocally revealed for the normal state at . This is the spectroscopic smoking-gun signature of a pseudogap in a unitary Fermi gas, without the need to invoke any specific microscopic theories.
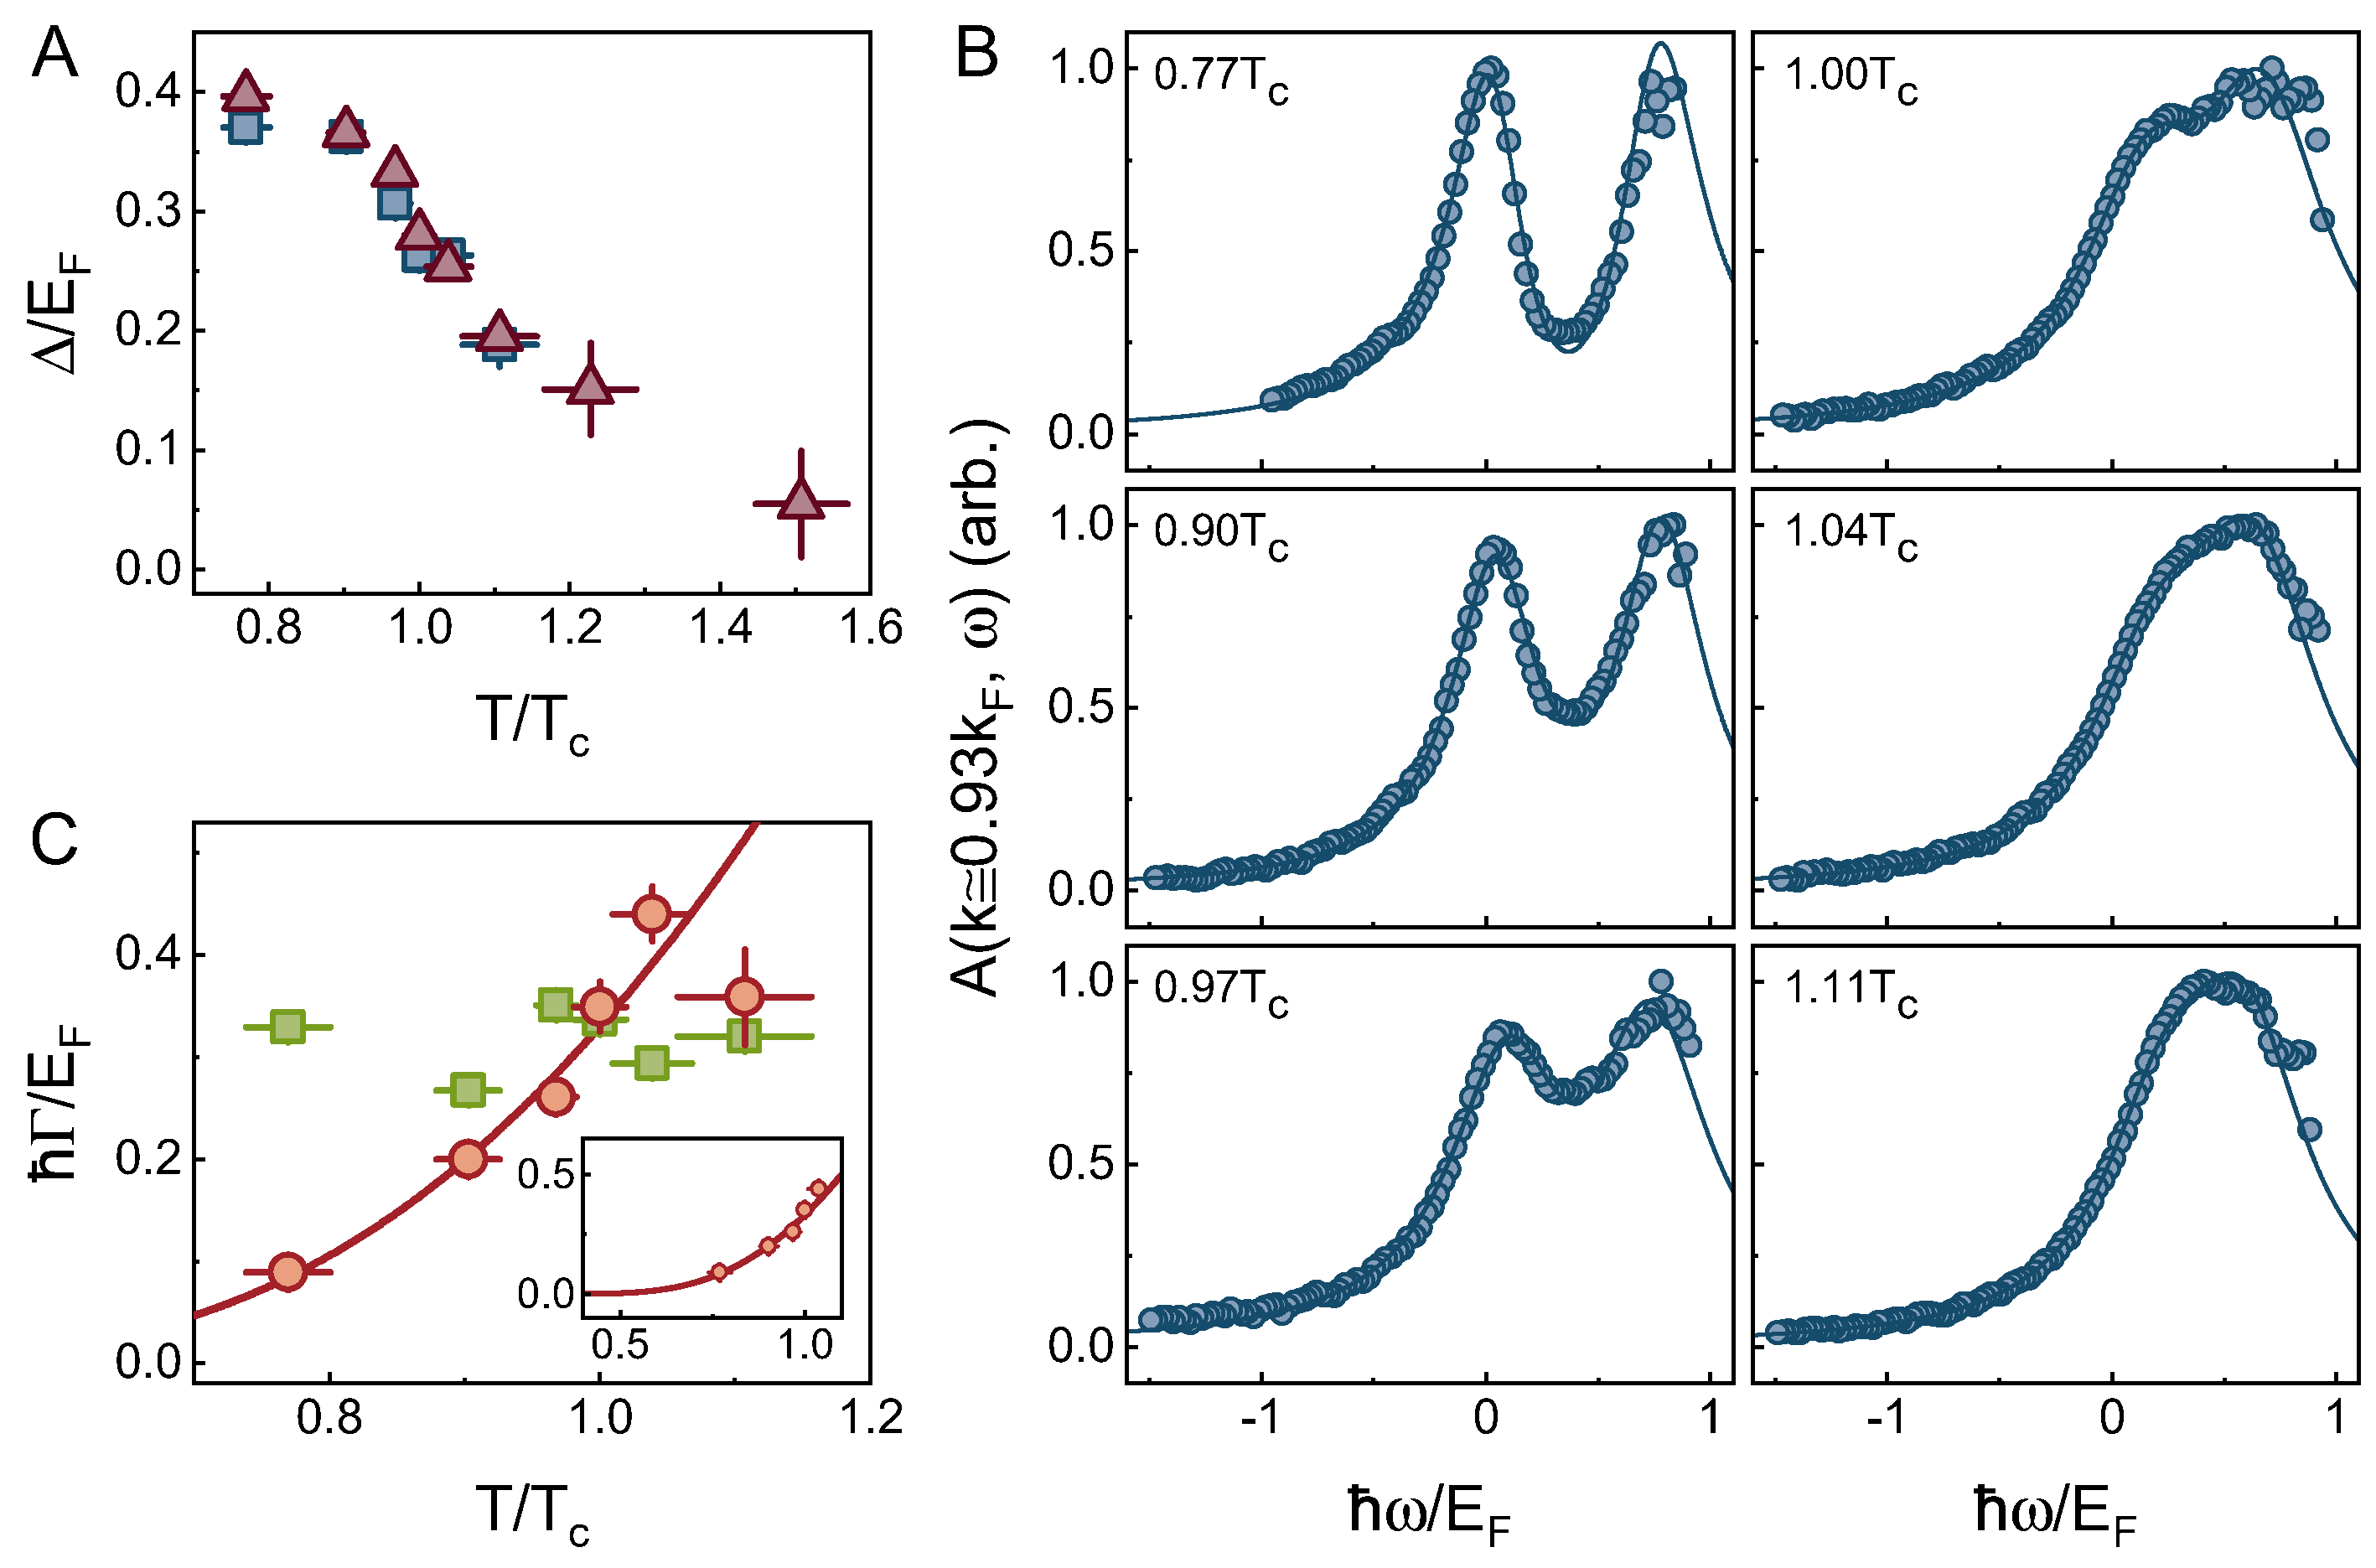
In Fig. 3, the back-bending of the lower quasiparticle branch can be observed for temperatures up to . We assume that the BCS-like dispersion, Eq. (1), is still applicable above the superfluid transition. The fitted is shown as the solid lines in Fig. 3, for . The obtained pairing gap is plotted as the red triangles in Fig. 4A, while the quasiparticle effective mass and the Hartree shift are listed in Table S1 (?). We find a smooth evolution of across the superfluid transition, with and . For the spectrum of , we can no longer resolve the back-bending in the intensity contour plot, due to the merging of the two branches and the thermally reduced population in the lower branch. The existence of a pseudogap, as clearly revealed by the weak suppression in the spectral weight near the Fermi surface, leads to an “S-shape” dispersion, which is more pronounced than that for . By fitting the data to the phenomenological expression of , we obtain , which is larger than as expected. Using linear extrapolation of down to zero, we may roughly estimate an onset pairing temperature .
Fermion self energy and energy distribution curve
Next, we extract from the spectral function the fermion self energy , a key quantity that characterizes the many-body interaction effects of a unitary Fermi gas (or any interacting system). In Fig. 4B, we present the normalized EDCs at for , where the back-bending point is essentially temperature independent. Remarkably, there are two sharp peaks at and in the EDCs for , corresponding to the well-defined quasiparticle energies. The dip between two peaks, located at , marks the maximal suppression of the spectral weight. Thus, in the superfluid phase, the pairing gap can be easily read off as the half separation of two peaks . The temperature dependence of EDC is evident as is raised: (i) the two quasiparticle peaks move toward each other, resulting in a slow decrease in ; and (ii) the peak width increases gradually, accompanied by an increasing intra-gap spectral weight. At , the two peaks are significantly broadened, leaving only a weak suppression of the spectral weight near the chemical potential . For higher temperatures and in the normal state, quasiparticle peaks cannot be identified in the EDCs, and we observe a flat top instead. We attribute the disappearance of the double-peak structure to the significantly increased peak width, which becomes comparable to or larger than the size of the pseudogap at .
The measured EDCs can be described using a minimal representation of the fermion self-energy (?), which has been widely adopted in the analysis of in high- superconductors:
| (2) |
where with , is responsible for the broadening of quasiparticle peaks due to the finite pair lifetime, and is the -independent single-particle scattering rate that characterizes the contribution from the “incoherent” background (?). Using Eq. (2), we fit the data with the explicit form of spectral function . As shown in Fig. 4B, the fitting curves (solid lines) agree well with the experimental data, enabling us to accurately extract , and . The obtained pairing gap is denoted by blue squares in Fig. 4A. We find , which agrees well with that extracted from the dispersion fitting (red triangles). Indeed, the two independent approaches, i.e., dispersion fitting with the BCS-like formula and EDC fitting, yield nearly the same pairing gap at all temperatures. This ensures the quantitative accuracy of the obtained pseudogap size, and thus provides the first experimental benchmark for many-body theories.
We present (orange circles) and (green squares) in Fig. 4C. The inverse pair lifetime exhibits a rapid increase with below , following a thermally activated exponential behavior, , where with being the fitted low- pairing gap. Note that, the obtained is consistent with our measured pairing gap at 0.77 and a many-body theoretical calculation (?). This result can be physically understood within a simple picture: is dominated by a virtual pair breaking and recombination process, which requires an excitation energy of . At , approaches approximately . The single-particle scattering rate exhibits a weak temperature dependence across the superfluid transition, with . This suggests that the single-fermion scattering process is insensitive to the fermion pairing, and thus is largely unchanged in the experimental temperature regime. Indeed, such a weak -dependence of has also been observed in high- superconductors. We find at , approximately 1.7 times the Planckian scattering limit (?) (i.e., ). This large is presumably due to the diverging scattering length in the unitary limit. Moreover, the viscous relaxation rate of a unitary Fermi gas in the normal state is given by the ratio of pressure to shear viscosity . Near , and , which leads to , in reasonable agreement with , taking as the transport relaxation rate (?).
Summary
We establish the existence of a pseudogap, which originates from strong pair fluctuations, in a homogeneous unitary Fermi gas through momentum-resolved microwave spectroscopy in the absence of the final-state effect. We obtain quantitatively accurate -dependent pairing gap , by both analyzing the quasiparticle energy dispersion and fitting the energy distribution curve with a minimal fermion self-energy model. Moreover, the inverse pair lifetime and the single-particle scattering rate are successfully extracted, which are two essential quantities for characterizing the microscopic interaction processes in strongly-interacting quantum systems. Our findings not only demonstrate that a many-body pairing pseudogap phase is a precursor to superfluidity, but also provide valuable microscopic details of unitary Fermi gases in the superfluid and normal phases. The quantitative theoretical explanation of the observed pseudogap constitutes a challenge for microscopic quantum many-body theories. Furthermore, our momentum-resolved microwave spectroscopy offers a powerful tool for probing many elusive quantum phases of strongly-interacting fermions, such as pseudogap and -wave superconductivity in the doped repulsive Fermi Hubbard model (?, ?, ?, ?) and the Fulde-Ferrell-Larkin-Ovchinnikov state (?) in a spin-polarized Fermi gas.
References
- 1. H. Ding, et al., Nature 382, 51 (1996).
- 2. A. G. Loeser, et al., Science 273, 325 (1996).
- 3. Q. Chen, J. Stajic, S. Tan, K. Levin, Phys. Rep. 412, 1 (2005).
- 4. S. Chakravarty, R. B. Laughlin, D. K. Morr, C. Nayak, Phys. Rev. B 63, 094503 (2001).
- 5. E. Fradkin, S. A. Kivelson, J. M. Tranquada, Rev. Mod. Phys. 87, 457 (2015).
- 6. S. A. Kivelson, et al., Rev. Mod. Phys. 75, 1201 (2003).
- 7. B. Keimer, S. A. Kivelson, M. R. Norman, S. Uchida, J. Zaanen, Nature 518, 179 (2015).
- 8. A. Damascelli, Z. Hussain, Z.-X. Shen, Rev. Mod. Phys. 75, 473 (2003).
- 9. C. Chin, R. Grimm, P. Julienne, E. Tiesinga, Rev. Mod. Phys. 82, 1225 (2010).
- 10. I. Bloch, J. Dalibard, S. Nascimbène, Nat. Phys. 8, 267 (2012).
- 11. J. Stajic, et al., Phys. Rev. A 69, 063610 (2004).
- 12. S. Giorgini, L. P. Pitaevskii, S. Stringari, Rev. Mod. Phys. 80, 1215 (2008).
- 13. W. Zwerger, ed., The BCS-BEC Crossover and the Unitary Fermi Gas (Springer Berlin Heidelberg, 2012).
- 14. M. Randeria, E. Taylor, Annu. Rev. Condens. Matter Phys. 5, 209 (2014).
- 15. C. Chin, et al., Science 305, 1128 (2004).
- 16. C. H. Schunck, Y. il Shin, A. Schirotzek, W. Ketterle, Nature 454, 739 (2008).
- 17. P. A. Murthy, et al., Science 359, 452 (2018).
- 18. J. T. Stewart, J. P. Gaebler, D. S. Jin, Nature 454, 744 (2008).
- 19. J. P. Gaebler, et al., Nat. Phys. 6, 569 (2010).
- 20. M. Feld, B. Froehlich, E. Vogt, M. Koschorreck, M. Koehl, Nature 480, 75 (2011).
- 21. E. J. Mueller, Rep. Progr. Phys. 80, 104401 (2017).
- 22. W. Schneider, M. Randeria, Phys. Rev. A 81, 021601 (2010).
- 23. S. Nascimbène, et al., Phys. Rev. Lett. 106, 215303 (2011).
- 24. A. L. Gaunt, T. F. Schmidutz, I. Gotlibovych, R. P. Smith, Z. Hadzibabic, Phys. Rev. Lett. 110, 200406 (2013).
- 25. B. Mukherjee, et al., Phys. Rev. Lett. 118, 123401 (2017).
- 26. L. Baird, X. Wang, S. Roof, J. Thomas, Phys. Rev. Lett. 123, 160402 (2019).
- 27. X. Li, et al., Science 375, 528 (2022).
- 28. G. Baym, C. J. Pethick, Z. Yu, M. W. Zwierlein, Phys. Rev. Lett. 99, 190407 (2007).
- 29. B. Mukherjee, et al., Phys. Rev. Lett. 122, 203402 (2019).
- 30. J. Zaanen, Nature 430, 512 (2004).
- 31. G. Grissonnanche, et al., Nature 595, 667 (2021).
- 32. J. A. N. Bruin, H. Sakai, R. S. Perry, A. P. Mackenzie, Science 339, 804 (2013).
- 33. G. Zürn, et al., Phys. Rev. Lett. 110, 135301 (2013).
- 34. See Supplemental Material for further information .
- 35. M. J. H. Ku, A. T. Sommer, L. W. Cheuk, M. W. Zwierlein, Science 335, 563 (2012).
- 36. Q. Chen, Y. He, C.-C. Chien, K. Levin, Rep. Progr. Phys. 72, 122501 (2009).
- 37. R. Haussmann, M. Punk, W. Zwerger, Phys. Rev. A 80, 063612 (2009).
- 38. C. Carcy, et al., Phys. Rev. Lett. 122, 203401 (2019).
- 39. Q. Chen, K. Levin, Phys. Rev. Lett. 102, 190402 (2009).
- 40. H. Biss, et al., Phys. Rev. Lett. 128, 100401 (2022).
- 41. M. R. Norman, M. Randeria, H. Ding, J. C. Campuzano, Phys. Rev. B 57, R11093 (1998).
- 42. R. Haussmann, W. Rantner, S. Cerrito, W. Zwerger, Phys. Rev. A 75, 023610 (2007).
- 43. T. Esslinger, Annu. Rev. Condens. Matter Phys. 1, 129 (2010).
- 44. R. A. Hart, et al., Nature 519, 211 (2015).
- 45. A. Mazurenko, et al., Nature 545, 462 (2017).
- 46. J. J. Kinnunen, J. E. Baarsma, J.-P. Martikainen, P. Törmä, Rep. Prog. Phys. 81, 046401 (2018).
Funding: This work is supported by the National Key R&D Program of China (Grant No. 2018YFA0306501), NSFC of China (Grant No. 11874340), the Innovation Program for Quantum Science and Technology (Grant No. 2021ZD0301900), the Chinese Academy of Sciences (CAS), the Anhui Initiative in Quantum Information Technologies, and the Shanghai Municipal Science and Technology Major Project (Grant No.2019SHZDZX01).