Stellar Neutrino Emission Across The Mass-Metallicity Plane
Abstract
We explore neutrino emission from nonrotating, single star models across six initial metallicities and seventy initial masses from the zero-age main sequence to the final fate. Overall, across the mass spectrum, we find metal-poor stellar models tend to have denser, hotter and more massive cores with lower envelope opacities, larger surface luminosities, and larger effective temperatures than their metal-rich counterparts. Across the mass-metallicity plane we identify the sequence (initial CNO 14N 22Ne 25Mg 26Al 26Mg 30P 30Si) as making primary contributions to the neutrino luminosity at different phases of evolution. For the low-mass models we find neutrino emission from the nitrogen flash and thermal pulse phases of evolution depend strongly on the initial metallicity. For the high-mass models, neutrino emission at He-core ignition and He-shell burning depends strongly on the initial metallicity. Anti-neutrino emission during C, Ne, and O burning shows a strong metallicity dependence with 22Ne(,)25Mg providing much of the neutron excess available for inverse- decays. We integrate the stellar tracks over an initial mass function and time to investigate the neutrino emission from a simple stellar population. We find average neutrino emission from simple stellar populations to be 0.5–1.2 MeV electron neutrinos. Lower metallicity stellar populations produce slightly larger neutrino luminosities and average decay energies. This study can provide targets for neutrino detectors from individual stars and stellar populations. We provide convenient fitting formulae and open access to the photon and neutrino tracks for more sophisticated population synthesis models.
1 Introduction
The next core-collapse (CC) supernova in the Milky Way or one of its satellite galaxies will be an opportunity to observe the explosion of a massive star across the electromagnetic, gravitational, and particle spectrums. For example, neutrinos with energies 10 MeV have played a prominent role in stellar physics (Hirata et al., 1987, 1988; Bionta et al., 1987; Alekseev et al., 1987; Bahcall, 1989; Borexino Collaboration et al., 2014, 2018, 2020) and particle physics (Bahcall, 1989; Ahmad et al., 2002; Ackermann et al., 2022). Maps of 1 TeV neutrinos from the Galactic plane are consistent with a diffuse emission model of neutrinos whose analysis includes the supernova remnant and pulsar wind nebula outcome(s) of CC events (IceCube Collaboration, 2023).
Ongoing technological improvements in detector masses, energy resolution, and background abatement will allow the global SuperNova Early Warning System network (Al Kharusi et al., 2021) to observe new signals from different stages of the lifecycle of individual stars or the aggregate signal from a stellar population with multi-kiloton detectors such as SuperKamiokande (Simpson et al., 2019; Harada et al., 2023), SNO+ (Allega et al., 2023), KamLAND (Abe et al., 2023), Daya Bay (An et al., 2023), DUNE (Acciarri et al., 2016), JUNO (Yang & JUNO Collaboration, 2022) and the upcoming HyperKamiokande (Abe et al., 2016).
Examples of ongoing stellar neutrino searches include pre-supernova neutrinos which allow new tests of stellar and neutrino physics (e.g., Odrzywolek et al., 2004; Kutschera et al., 2009; Odrzywolek, 2009; Patton et al., 2017a, b; Kato et al., 2017, 2020a; Kosmas et al., 2022) and enable an early alert of an impending CC supernova to the electromagnetic and gravitational wave communities (Beacom & Vogel, 1999; Vogel & Beacom, 1999; Mukhopadhyay et al., 2020; Al Kharusi et al., 2021). Other ongoing explorations include the diffuse supernova neutrino background (Hartmann & Woosley, 1997; Bisnovatyi-Kogan & Seidov, 1984; Krauss et al., 1984; Ando & Sato, 2004; Horiuchi et al., 2009; Beacom, 2010; Anandagoda et al., 2020; Suliga, 2022; Anandagoda et al., 2023), and neutrinos from the helium-core nitrogen flash (Serenelli & Fukugita, 2005), compact object mergers (Kyutoku & Kashiyama, 2018; Lin & Lunardini, 2020), tidal disruption of stars (Lunardini & Winter, 2017; Winter & Lunardini, 2022; Reusch et al., 2022), and pulsational pair-instability supernovae (Leung et al., 2020).
Farag et al. (2020) introduced the idea of a neutrino Hertzsprung–Russell Diagram (HRD) with a sparse grid of models. Each model started from the zero-age main sequence (ZAMS) and ended at a final fate but only at solar metallicity. They found all masses produce a roughly constant neutrino luminosity during core H burning on the main-sequence (MS), and confirmed that low-mass ( 8 ) Red Giant Branch (RGB) models with 2 undergo large increases in during the helium flash (nitrogen flash for neutrinos, Serenelli & Fukugita, 2005) and subsequent sub-flashes. They also found He burning in asymptotic giant branch (AGB) models undergo sharp increases in from thermal pulses (TPs), and significantly larger from the hotter and denser cores of later evolutionary stages culminating at the onset of CC in high-mass ( 8 ), non-rotating, single star models. A photon Hertzsprung–Russell Diagram (HRD) provides information about the stellar surface, a HRD can serve as a diagnostic tool of the stellar interior.
Changes in the initial metallicity Z of a model changes the structure of the model through the equation of state (EOS Saumon et al., 1995; Timmes & Swesty, 2000; Rogers & Nayfonov, 2002; Irwin, 2004; Potekhin & Chabrier, 2010; Jermyn et al., 2021; Bauer, 2023), radiative opacity (Iglesias & Rogers, 1993, 1996; Ferguson et al., 2005; Ferguson & Dotter, 2008; Poutanen, 2017), conductive opacity (Cassisi et al., 2007; Blouin et al., 2020), nuclear energy generation rate (Angulo et al., 1999; Cyburt et al., 2010a; Sallaska et al., 2013; deBoer et al., 2017; Farag et al., 2022), gravitational sedimentation (Bauer et al., 2020), and mass-loss by line driven winds (Sanyal et al., 2017; VandenBerg et al., 2022).
The coupling between these pieces of stellar physics and neutrino production from thermal (Itoh et al., 1996a) and weak reaction processes (Fuller et al., 1985; Oda et al., 1994; Langanke & Martínez-Pinedo, 2000; Nabi et al., 2021) suggests that changes in Z can cause changes in a HRD, and upon integration, the neutrino emission from a simple stellar population model.
This article is novel in exploring stellar neutrino emission across the mass-metallicity plane. This study can provide targets for neutrino detectors from individual stars and stellar populations. Section 2 describes the mass-metallicity grid and stellar physics, § 3 presents overall features and drivers across the mass-metallicity plane, § 4 analyzes low-mass tracks, § 5 details high-mass tracks, § 6 explores neutrino emission from a simple stellar population model, and § 7 summarizes our results.
| Name | Description | Appears |
|---|---|---|
| Atomic number | 2 | |
| Element diffusion coefficient | 2 | |
| Energy | 3.2 | |
| Average neutrino energy | 5.1 | |
| Gravitational acceleration | 3.2 | |
| Pressure scale height | 3.2 | |
| Opacity | 3.2 | |
| Boltzmann constant | 3.2 | |
| Luminosity | 1 | |
| Stellar mass | 1 | |
| Mean molecular weight | 2 | |
| Number density | 2 | |
| Neutron excess | 2 | |
| Stellar Radius | 4.2 | |
| Mass density | 3.2 | |
| Pressure | 3.2 | |
| Temperature | 2 | |
| Time or Timescale | 4.2 | |
| Mass fraction | 2 | |
| X | Hydrogen mass fraction | 2 |
| Abundance | 2 | |
| Y | Helium mass fraction | 2 |
| Electron fraction | 2 | |
| Z | Metal mass fraction | 1 |
| Atomic charge | 2 |
| Acronym | Description | Appears |
|---|---|---|
| AGB | Asymptotic Giant Branch | 1 |
| CC | Core Collapse | 1 |
| CHeB | Core Helium Burning | 3 |
| CHeD | Core Helium Depletion | 3 |
| CO | Carbon-Oxygen | 3.1 |
| EOS | Equation of State | 1 |
| HRD | Photon Hertzsprung Russell Diagram | 1 |
| HRD | Neutrino Hertzsprung Russell Diagram | 1 |
| HB | Horizontal Branch | 4 |
| IMF | Initial mass function | 6 |
| MLT | Mixing Length Theory | 2 |
| PMS | Pre-Main Sequence | 2 |
| RGB | Red Giant Branch | 1 |
| RSG | Red Supergiant | 5 |
| TAMS | Terminal Age Main Sequence | 3.1 |
| TP | Thermal Pulse | 1 |
| WD | White Dwarf | 2 |
| ZAMS | Zero Age Main Sequence | 1 |
| TAMS | Terminal Age Main Sequence | 3 |
| Low-mass | 8 | 1 |
| High-mass | 8 | 1 |
2 Mass-Metallicity Plane and Stellar Physics
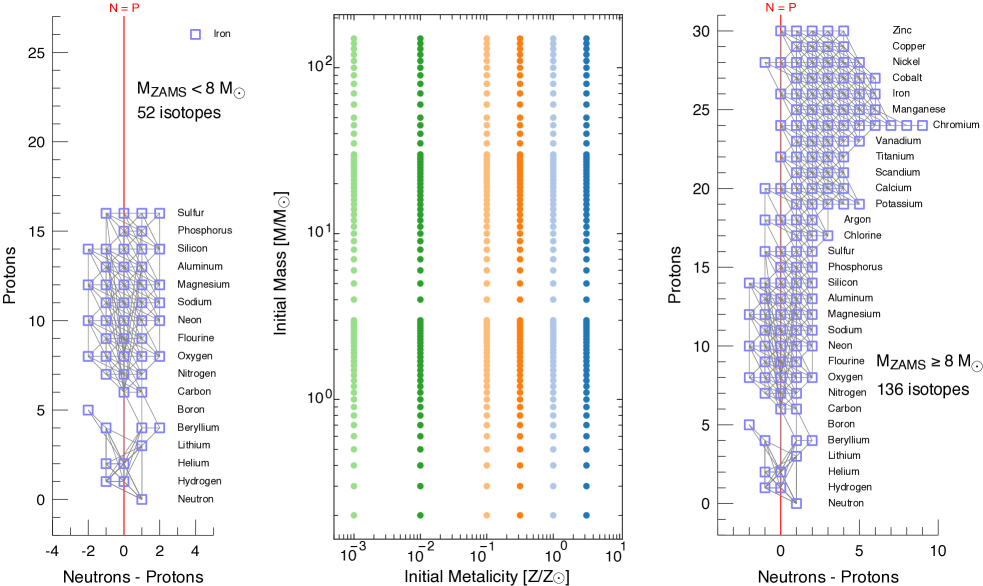
We model the evolution of single, non-rotating stars over a wide range of initial masses and metallicities, from the pre-main sequence (PMS) to the final fate. Figure 1 shows the mass-metallicity plane for 70 models distributed in the range 0.2 150 for six initial metallicities (Z/) = 0.5, 0, 0.5, 1, 2, 3, where we choose = 0.0142 (Asplund et al., 2009). This mass-metallicity plane spans the range of single stars found in the Galaxy (Edvardsson et al., 1993; Ratcliffe et al., 2023; Almeida-Fernandes et al., 2023), and aids estimates of the neutrino emission from simple stellar population models.
We use MESA version r15140 to construct our stellar models (Paxton et al., 2011, 2013, 2015, 2018, 2019; Jermyn et al., 2023). We follow MIST Choi et al. (2016) to scale the H mass fraction X, He mass fraction Y, and metallicity Z
| (1) | |||||
| (2) |
where we adopt the primordial He abundance Yp = 0.249 (Planck Collaboration et al., 2016), = 0.2703 and = 0.0142 with mass fractions from Asplund et al. (2009).
For the low-mass models, we chose the Riemers wind mass loss scheme (Reimers, 1977) with an efficiency of 0.5 on the RGB, and Blöckers wind mass loss scheme (Blöcker, 2001) with an efficiency of 1.0 on the AGB. All low-mass models terminate as a white dwarf (WD) at = 10-3 , even if the evolution is longer than the age of the universe.
For the high-mass models, we choose the “Dutch” wind loss scheme (Nieuwenhuijzen & de Jager, 1990; Nugis & Lamers, 2000; Vink et al., 2001; Glebbeek et al., 2009) with an efficiency of 1.0 to generate stripped models. All models use an Eddington-grey iterated atmosphere as an outer boundary condition. We apply an extra pressure to the surface (see Section 6.1 of Jermyn et al., 2023) of our AGB and high-mass models to maintain stability of the surface layer in super Eddington regimes where the surface of the model can otherwise run away. The termination age for all high-mass models is at the onset of CC when the infall velocity of the Fe core reaches 100 km s-1. A subset of our models halted prematurely: at core C-depletion ( = 8–10 ), a stalled Ne/O flame in a degenerate core ( = 11–14 ), the onset of pair-instability (C-ignition with MHe 45 ), or due to numerical difficulties near the onset of CC.
We adopt a minimum chemical diffusive mixing coefficient of Dmin = cm2 s-1 from C-ignition to the onset of CC to aid the convergence properties of our high-mass models (Farag et al., 2022). To reduce the numerical cost we use operator splitting to decouple the hydrodynamics from the nuclear burning for temperatures above = 1109 K (Jermyn et al., 2023).
We also adopt = 1.5 for the convective mixing-length parameter, and = 0.016, = 0.008 for the convective overshooting parameters in all convective regions (Herwig, 2000; Choi et al., 2016). All stellar models use the MLT++ treatment for superadiabatic convection in the envelopes (Sabhahit et al., 2021). We also damp the velocities in the envelopes of our low-mass AGB models and high-mass models during the advanced burning stages to inhibit the growth of radial pulsations.
Figure 1 illustrates the 52 isotope nuclear reaction network used for low-mass stars and the 136 isotope reaction network used for high-mass models. Extended networks are required to accurately capture the nuclear energy generation, composition and stellar structure profiles, and the neutrino luminosity and spectra from -processes (Farmer et al., 2016; Patton et al., 2017a, b; Kato et al., 2020a). The 136 isotope network is reliable up to the onset of Si-shell burning, 4109 K. At higher temperatures, the paucity of Fe group isotopes in this reaction network cannot fully capture the nuclear burning (Farmer et al., 2016; Patton et al., 2017a).
Nuclear reaction rates are a combination of NACRE (Angulo et al., 1999) and JINA REACLIB (Cyburt et al., 2010b). We use the median 12C(,)16O reaction rate from the experimental probability distribution function provided by deBoer et al. (2017), updated in Mehta et al. (2022), and publicly released in Chidester et al. (2022). Reaction rate screening corrections are from Chugunov et al. (2007), which includes a physical parameterization for the intermediate screening regime and reduces to the weak (Dewitt et al., 1973; Graboske et al., 1973) and strong (Alastuey & Jancovici, 1978; Itoh et al., 1979) screening limits at small and large values of the plasma coupling parameter. Weak reaction rates are based, in order of precedence, on Langanke & Martínez-Pinedo (2000), Oda et al. (1994), and Fuller et al. (1985).
Baryon number is conserved in nuclear reactions. Define the abundance of species by
| (3) |
where is the number density of isotope and is baryon number density. The number of baryons in isotope divided by the total number of baryons of all isotopes is the baryon fraction (mass fraction)
| (4) |
where is the atomic mass number, the number of baryons in an isotope. The mean atomic number is
| (5) |
the mean charge is
| (6) |
the electron to baryon ratio (electron fraction) is
| (7) |
where is the free electron number density and the second equality assumes full ionization. The related neutron excess is
| (8) |
the mean ion molecular weight is
| (9) |
the mean electron molecular weight is
| (10) |
and the mean molecular weight is
| (11) |
Across the mass-metallicity plane the dominant thermal neutrino processes in our models are plasmon decay () which scales with the composition as , photoneutrino production () which scales as , and pair annihilation () which also scales as . All else being equal, as material becomes more neutron rich the neutrino emission from these three dominant processes decrease.
Bremsstrahlung (), which scales with the composition as , and recombination () , which scales as , play smaller roles. Neutrino emission from these five processes are discussed in Itoh et al. (1989, 1992, 1996a, 1996b); Kantor & Gusakov (2007) and implemented, with partial first derivatives, in the MESA module neu. Differential thermal neutrino emission rates are discussed in Ratković et al. (2003); Dutta et al. (2004); Misiaszek et al. (2006a); Odrzywołek (2007); Kato et al. (2015); Patton et al. (2017a); Dzhioev et al. (2023).
Each of the 420 stellar models in the mass-metallicity grid use between 2000–3500 mass zones (lower values occur at ZAMS where there are no composition gradients) with 3000 mass zones over the evolution being typical. Each low-mass model uses 1105 – 3105 timesteps depending on the number of thermal pulses (TPs), and each high-mass model uses 2104 – 5104 timesteps. Each model executes on a 16 core node with 2 GHz AMD Epyc 7713 CPUs, with low-mass models consuming 14–21 days and high-mass models using 10-21 days. The uncompressed total data set size is 730 GB.
The MESA files to reproduce our models, and open access to the photon and neutrino tracks, are available at http://doi.org/10.5281/zenodo.8327401 (catalog http://doi.org/10.5281/zenodo.8327401).
3 Overall Mass-Metallicity Features
Here we present features and drivers of the neutrino emission, first at one metallicity in Section 3.1 and then for all six metallicities in Section 3.2.
3.1 One Metallicity
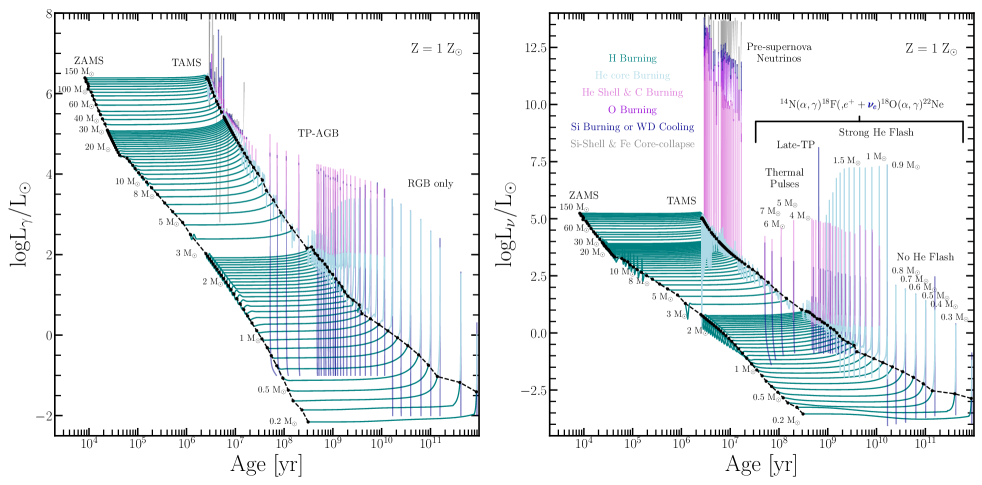
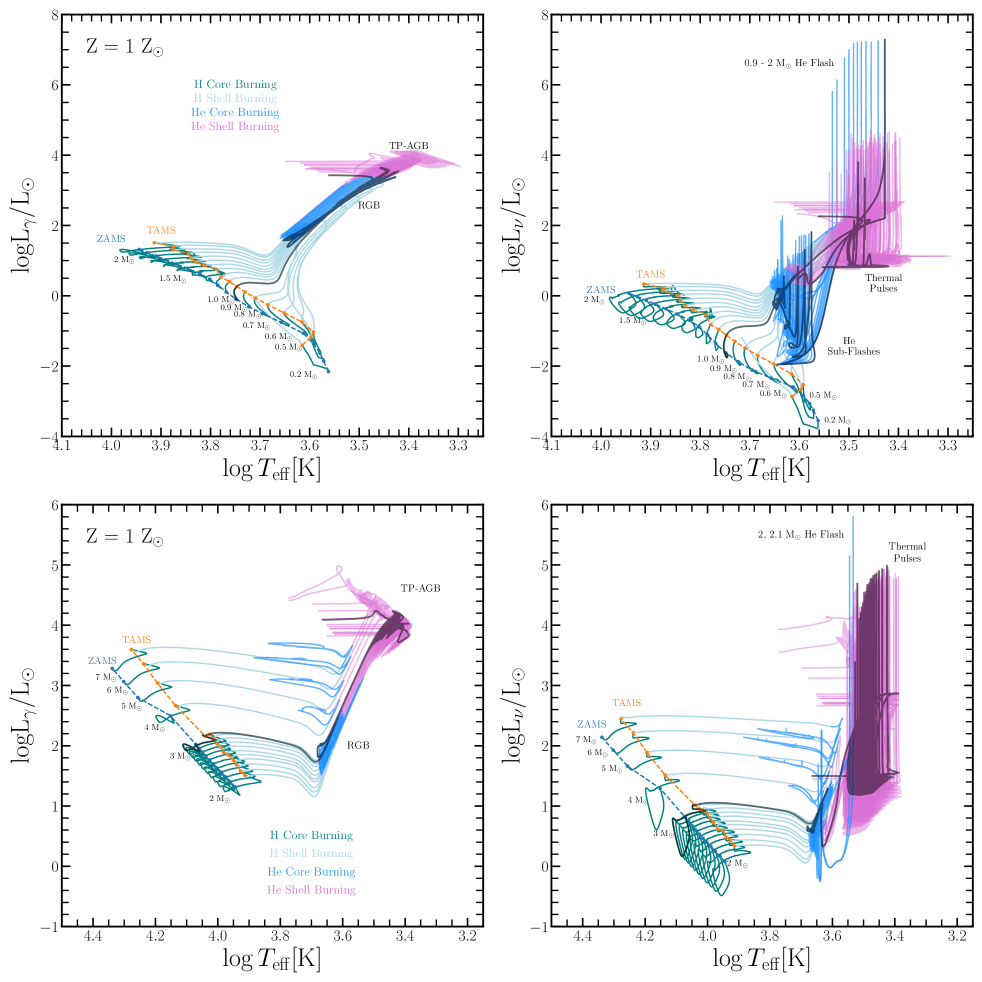
Figure 2 shows the photon and neutrino light curves for all 70 calculated masses at Z = 1 . Both plots begin at the ZAMS, defined when the luminosity from nuclear reactions is 99% of the total luminosity , marking a transition from evolution on thermal timescale to a nuclear timescale.
MS evolution is characterized by stable core H-burning, where neutrinos are produced by weak reactions in the proton-proton (pp) chains p(p,e+)2H, p(e-p,)2H, 3He(p,e+)4He, 7Be(e-,)7Li, 8B(,e+)8Be, and the CNO cycles 13N(,e+)13C, 13N(e-,)13C, 15O(,e+)15N, 15O(e-,)15N, 17F(,e+)17O, 17F(e-,)17O, 18F(,e+)18O, where electron capture reactions on CNO nuclei are included (Stonehill et al., 2004).
Models with 1.2 have a central temperature 18107 K and burn H in their cores primarily through the pp chains, with a small fraction from the CNO cycles. For example, based on observations of solar neutrinos CNO burning accounts for around 1.6% of the current energy generation of the Sun (Naumov, 2011; Borexino Collaboration et al., 2020). Models with 1.2 have 18107 K and maintain their stability primarily from the CNO cycles (Wiescher et al., 2010). Metal-poor models can produce their own carbon to begin CNO cycle H-burning (Mitalas, 1985; Wiescher et al., 1989; Weiss et al., 2000; Tompkins et al., 2020). In addition, most of a model’s initial Z comes from the CNO and 56Fe nuclei inherited from its ambient interstellar medium. The slowest step in the CNO cycle is proton capture onto 14N, resulting in all the CNO catalysts accumulating into 14N during core H-burning.
All light curves in Figure 2 proceed to the terminal age main sequence (TAMS), defined by core H-depletion (Xc 10-6). The He-rich core contracts as a H-burning shell forms. The higher temperatures of shell H-burning can activate the Ne-Na, and Mg-Al cycles (Salpeter, 1955; Marion & Fowler, 1957; Arnould et al., 1999; José et al., 1999; Izzard et al., 2007; Boeltzig et al., 2022). The light curves then bifurcate depending on .
During He-burning the accumulated 14N is converted into the neutron-rich isotope 22Ne through the reaction sequence 14N(,)18F(,)18O(,)22Ne, also shown in Figure 2. This sequence is the source of neutrinos powering Lν through all phases of He-burning (Serenelli & Fukugita, 2005; Farag et al., 2020).
Usually the ashes of nuclear burning have a larger and lie interior to the unburned fuel. For example, a He core is interior to a H-burning shell, and a carbon-oxygen (CO) core is interior to a He-burning shell. Exceptions occur when electron degeneracy and thermal neutrino losses lead to a temperature inversion with cooler temperatures in the central regions and hotter temperatures exterior to the core. The fuel ignites off-center and a burning front propagates towards the center.
For example, the 0.9 2 light curves in Figure 2 undergo off-center He ignition, the He Flash (Thomas, 1967; Bildsten et al., 2012; Gautschy, 2012; Serenelli et al., 2017). The accompanying nitrogen flash for neutrinos (Serenelli & Weiss, 2005) are prominent and labeled. In contrast, the 2 light curves undergo central He burning. The 0.9 7 light curves undergo TPs on the AGB, generating neutrinos first from H burning, and subsequently from He burning. A few light curves show a late TP during the transition to a cool WD.
Neutrino emission from nuclear reactions dominate whenever H and He burn, otherwise neutrinos from thermal processes generally dominate (Farag et al., 2020). For example, light curves for 8 in Figure 2 have the minimum mass for C ignition and those for 10 have the minimum mass for Ne ignition (Becker & Iben, 1979, 1980; García-Berro et al., 1997; Farmer et al., 2015; De Gerónimo et al., 2022). For these advanced burning stages in Figure 2 become nearly vertical and greatly exceeds . Thermal neutrinos from pair-production dominate until the last few hours before CC when neutrinos from nuclear processes contribute (Odrzywolek et al., 2004; Odrzywolek & Heger, 2010; Patton et al., 2017a, b; Kato et al., 2020a, b).
3.2 Six Metallicities
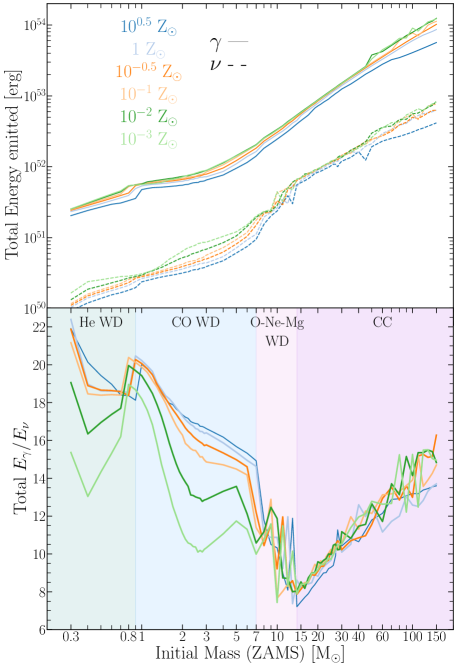
The top panel of Figure 3 shows the total energy emitted in photons and neutrinos , obtained by integrating and over the lifetime of a model. Metal-poor models tend to have larger and than the metal-rich models. Homology relations with power-law expressions for a bound-free Kramers opacity , pp-chain energy generation rate , and mean molecular weight lead to (Sandage, 1986; Hansen et al., 2004)
| (12) |
where is the MS lifetime. Similarly, for a Thomson electron scattering opacity and CNO cycle energy generation rate ,
| (13) |
These expressions suggest that displacement on the MS due to a lower Z is partially offset by a shift to a larger X (Demarque, 1960). In addition, a lower Z requires higher to produce the same and . This is mainly why the low-Z high-mass models in Figure 3 produce only a marginally larger and on the MS while possessing larger . In turn, a larger implies a larger radiative gradient, and thus a larger core mass.
and in the core is primarily set by the mass of the model. Envelope opacities affect the rate of nuclear reactions in the core insofar as the envelope has a large mass. The hotter the model is overall (e.g., the more massive), the less mass in the envelope will be cold enough to provide bound-free or bound-bound opacity. The largest differences due to the opacity occur in the low-mass models because they are colder, both in the core and the envelope. The models adjust the structure to accommodate a change in Z at a fixed luminosity.
Overall, across the mass spectrum, metal-poor stellar models tend to have denser, hotter and more massive cores with lower envelope opacities, larger surface luminosities and larger effective temperatures than their metal-rich counterparts (Demarque, 1960; Iben, 1963; Demarque, 1967; Iben & Rood, 1970; Vandenberg, 1983; Sandage, 1986; Hansen et al., 2004; Georgy et al., 2013; Young, 2018; Groh et al., 2019; Kemp et al., 2022). These are the main drivers of changes to the thermal and nuclear reaction neutrino emission as the initial Z changes.
The bottom panel of Figure 3 shows the ratio /. A maximum of / 20 at 0.9 occurs at the transition between models that ignite He and those that do not, between the most massive He WD and the least massive CO WD. As increases the resulting electron degenerate cores, first CO then ONeMg, become progressively more massive, denser, and hotter (also see Woosley & Heger, 2015). This increases production of thermal neutrinos from the plasmon, photoneutrino, and pair annihilation channels faster than the production of reaction neutrinos or photons. Thus / decreases with as shown in Figure 3.
A minimum of / 8 at 12 in Figure 3 occurs at the transition between models that produce the most massive WD and those that go to CC. As further increases, thermal neutrinos from pair annihilation increases slower than reaction neutrinos or photons, and thus is smaller than in more massive models (pulsational pair-instability supernovae models are suppressed). The ratio / thus rises from the minimum and develops a roughly linear trend for 12 . Overall, both extrema of / of Figure 3 correlate with transitions in the final fate.
Another trend in the bottom panel of Figure 3 is the metallicity dependence of models that become CO WD, the blue shaded region. More metal-rich models have a larger / than metal-poor models. A larger initial Z produces a larger accumulation of 14N during CNO cycle H-burning, thus a larger mass fraction of 22Ne during He-burning, and hence a smaller as the CO WD becomes more neutron-rich. Plasmon neutrino rates scale as leading to a smaller , hence more metal-rich models have a larger / than metal-poor models in this range. The dependence of CO WD on the 22Ne mass fraction, the degree of neutronization, may have implications for the progenitors Type Ia supernova (Timmes et al., 2003; Townsley et al., 2009; Bravo et al., 2010; Piersanti et al., 2022) and the pulsation periods of variable WD (Campante et al., 2016; Chidester et al., 2021; Althaus & Córsico, 2022).
Farag et al. (2020) showed / 40 for a standard solar model. As this model evolves off the MS the inert He core becomes denser, more electron degenerate, thermal neutrino production rise, increases, and thus /decreases. Integrated over the lifetime of the model, / decreases to 20 as shown in Figure 3.
For any , what is the impact of changing Z on the neutrino emission at any evolutionary stage?
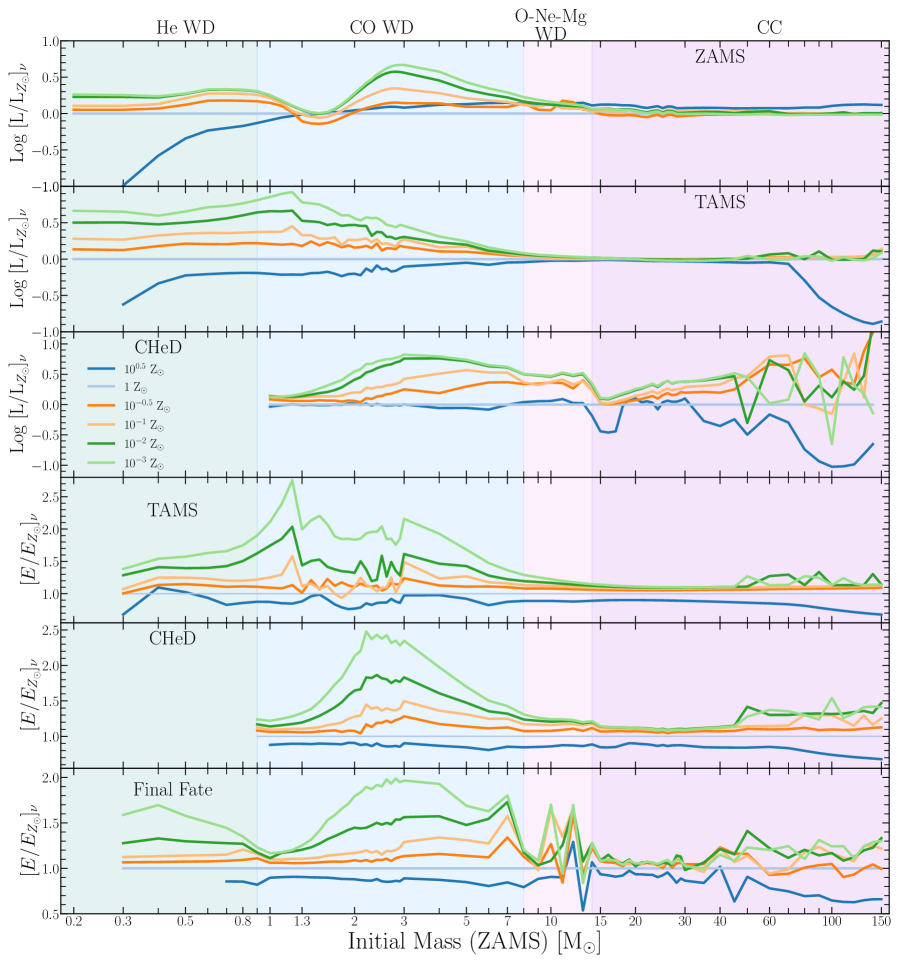
Figure 4 compares to of the Z = 1 model across the mass-metallicity plane at three evolutionary stages in the top three panels. As for Figure 3, at the ZAMS there is generally a small dependence on the initial Z but there are interesting features. For example, the dip at 1.2 corresponds to the transition from pp-chain dominated to CNO cycle dominated H-burning. Another feature is the stronger Z dependence for models that become CO WD. As low-Z models tend to have denser, hotter and more massive H-burning cores, thermal and reaction neutrino contributions to is larger relative to high-Z models.
At the TAMS, the models in Figure 4 have a partially degenerate He-rich core. As low-Z models have denser, hotter and more massive cores than high-Z models, the thermal plasmon neutrino contributions to are larger. More massive models do not develop degenerate He-rich cores, and the small dependence on the initial Z continues. The most metal-rich track decreases due to the larger mass loss.
At core He-depletion (CHeD), the 0.9 8.0 models have a partially electron-degenerate CO-rich core. The denser, hotter and more massive cores of the low-Z models means larger thermal neutrino contributions, and thus is larger in lower Z models.
The 60 models at CHeD in Figure 4 show sawtooth profiles with the lowest Z models disrupting a metallicity trend. This occurs because the convective boundary mixing model, exponential overshooting (Herwig, 2000), is based on the pressure scale height , where is the pressure, is the Boltzmann constant, and is the gravitational acceleration. All else being equal, a smaller Z means a smaller , a larger , and thus the chemical mixing region in low-Z models is larger than in high-Z models. If two burning shells are within , they are mixed. For masses with low , the H-shell mixes into the burning He core repeatedly. This delays core He burning until there is a homogeneous stripped CO core with a little He on the surface. By CHeD there is no H-shell to undergo CNO burning and all the 14N is depleted, ergo is very low.
Overall, for fixed overshooting parameters, metal-poor models have larger amounts of chemical mixing. This is a secondary driver of changes to the thermal and nuclear reaction neutrino emission as the initial metallicity changes. Other specific examples of overshooting dominating are shown for low-mass models in Section 4 and for high-mass models in Section 5. The overshooting prescription may have an additional metallicity dependence that is not captured by these models.
Figure 4 also compares at each to of the Z = 1 model on a linear scale at three evolutionary stages in the bottom three panels. At the TAMS, models across the mass spectrum reflect the Z dependence of shown in the top two panels. At CHeD, the denser, hotter and more massive cores of the low-Z models, plus contributions from the conversion of 14N into 22Ne, also show larger with decreasing Z.
Tracks in the bottom panel of Figure 4 are the same neutrino tracks in Figure 3 but normalized to the solar metallicity track. The range for He WD and CO WD have the metallicity signature of having had an inert, electron-degenerate core during their evolution. The ONeMg WD region shows a sawtooth pattern because these models had numerical challenges completing the propagation of their off-center, convectively bounded flame fronts to the center. The region for CC events show a weak dependence of on Z.
4 Low-Mass Stars
Here we analyze the neutrino emission from the low-mass stellar tracks at one metallicity in Section 4.1, and then for all six metallicities in Section 4.2.
4.1 One Metallicity
Figure 5 shows the tracks in a HRD and a HRD for Z = 1 . The cores are progressively enriched with the ashes of H-burning as the models begin to evolve beyond the MS. The H-burning reactions increase and thus in the core. To maintain hydrostatic equilibrium the central temperature rises with the central density , increasing the rate of nuclear fusion and thus and . This slow increase of is reflected in the HRD and HRD of Figure 5 as an increase in their respective luminosities until core H-depletion at the terminal-age main-sequence (TAMS).
The He-rich core contracts as an H-burning shell forms and the tracks in Figure 5 evolve across both HRDs on a thermal timescale. Both and increase along the RGB until core He-ignition at the tip of the RGB. All tracks that reach this point have a semi electron degenerate He core with 0.5 1.7 , and a similar , , and (Cassisi & Salaris, 2013; Serenelli et al., 2017). Photons from the tip of the RGB provide a standard candle distance indicator (Da Costa & Armandroff, 1990; Lee et al., 1993; Madore et al., 2023), and offer constraints on the neutrino magnetic dipole moment (Capozzi & Raffelt, 2020; Franz et al., 2023).
He ignition by the triple- process in the 0.9 2.1 tracks of Figure 5 occur off-center (on-center in the 2.1 ) and under semi-electron-degenerate conditions in a helium flash (Thomas, 1967; Bildsten et al., 2012; Gautschy, 2012; Serenelli et al., 2017). A He burning front propagates towards the center by conduction, with burning behind the front driving convection. The helium flash and the sub-flashes that follow burn very little He; the nuclear energy generated mainly goes into lifting the electron degeneracy in the core. The last sub-flash reaches and heats the center allowing stable convective core He-burning under non-degenerate conditions.
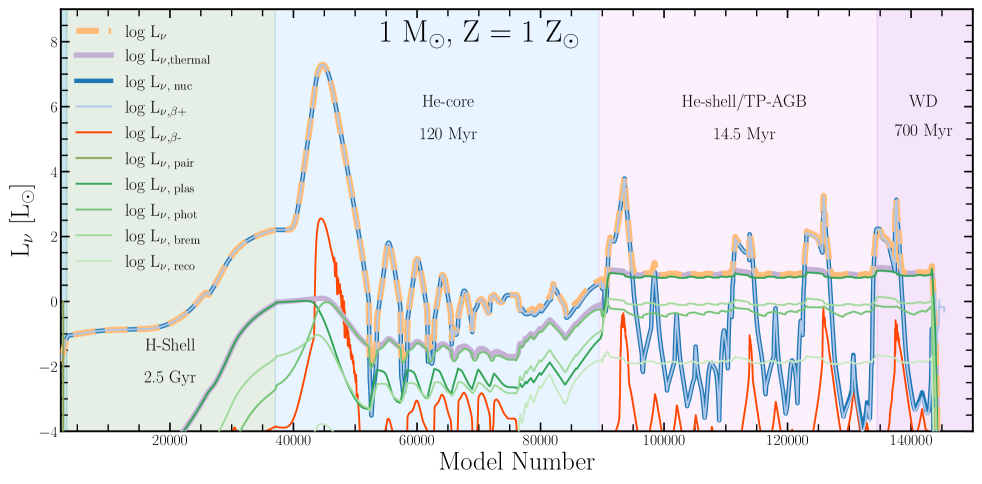
During each helium flash, a nitrogen flash also occurs from the conversion of all of the accumulated 14N to 22Ne, sharply increasing Lν via 18F(,)18O (Serenelli & Weiss, 2005). For example, Figure 6 shows that a = 1 , Z = 1 track undergoes 7 flashes. The first flash is the strongest, occurring at and reaches for days.
Tracks with 2.1 reach a high enough at the tip of the RGB to ignite He in the center quiescently under non-degenerate conditions. For example, Figure 6 shows a = 3 , 1 track produces a smoother signature during core He burning than a = 1 , 1 track. Tracks in this mass-metallicity range also experience a blue loop (Hayashi et al., 1962; Hofmeister et al., 1964; Xu & Li, 2004; Zhao et al., 2023) in the HRD and HRD of Figure 5.
Post He ignition, the tracks in Figure 5 migrate to the horizontal branch (HB), becoming less luminous with larger . All the He cores have approximately the same mass, regardless of the total stellar mass, and thus about the same helium fusion luminosity . These stars form the red clump at 5,000 K, and (Alves & Sarajedini, 1999; Sarajedini, 1999; Girardi, 1999; Hawkins et al., 2017; Wang & Chen, 2021). Less massive H envelopes shift the tracks to hotter and smaller on the HB. This effect occurs more readily at lower Z (see §4.2) with old metal-poor clusters showing pronounced HB in a HRD (Casamiquela et al., 2021; Dondoglio et al., 2021).
Core He-burning produces an electron-degenerate CO core with a semi-electron-degenerate He shell encased in a larger H-rich envelope. These AGB stars are the final stage of evolution driven by nuclear burning, characterized by H and He burning in geometrically thin shells on top of the CO core (Herwig, 2005). Larger yield super-AGB models, where an Oxygen-Neon-Magnesium (ONeMg) core forms from a convectively bounded carbon flame propagating toward the center (Becker & Iben, 1979, 1980; Timmes et al., 1994; García-Berro et al., 1997; Siess, 2007; Denissenkov et al., 2015; Farmer et al., 2015; Lecoanet et al., 2016).
During the AGB phase a thin He shell grows in mass as material from the adjacent H-burning shell is processed, causing the He shell to increase in temperature and pressure. When the mass in the He shell reaches a critical value (Schwarzschild & Härm, 1965; Giannone & Weigert, 1967; Siess, 2010; Gautschy, 2013; Lawlor, 2023), He ignition causes a thermal pulse (TP).
For example, Figure 6 shows the of a 3 , 1 track experiencing a series of 21 TPs, with an interpulse period of 105 yr. Like the helium flash, each TP is composed of a primary flash followed by a series of weaker sub-flashes. These TP sequences appear as spikes in the HRD of Figure 5. The primary flash produces the largest from 18F(,)18O. The sub-flashes do not produce neutrino emissions from this process, as nearly all of the 14N is converted to 22Ne during the primary flash. The number of TPs a track undergoes is uncertain as the number is sensitive to the mass and time resolution, the stellar mass loss rate, and the treatment of convective boundaries.
4.2 Six Metallicities
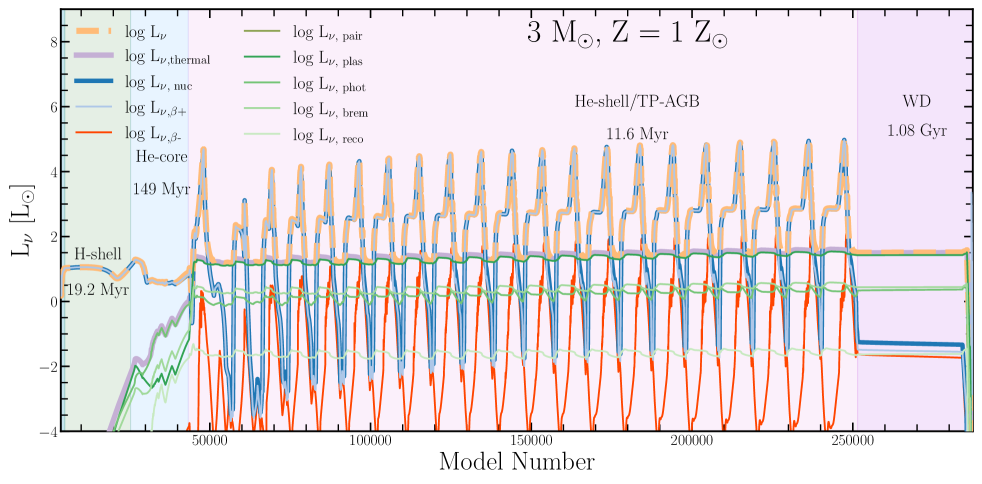
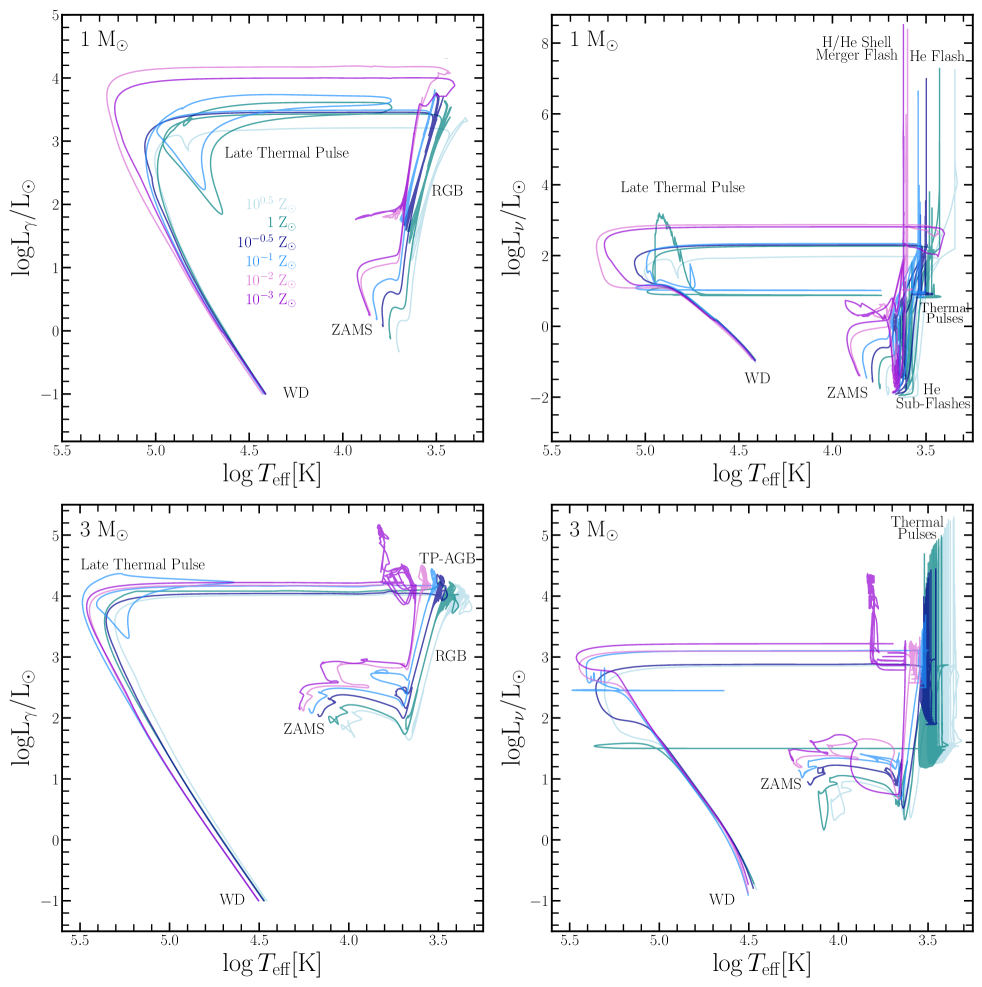
Figure 7 shows the evolution of = 1 and 3 in a HRD and a HRD across all six metallicities. Overall, the low-Z models show the trend of having denser, hotter and more massive cores with lower envelope opacities, larger surface luminosities and larger effective temperatures than the high-Z counterparts. Features in the HRD between core H depletion and the end of the TP-AGB phase are analyzed below.
The tracks in Figure 7 leave the TP-AGB phase when the envelope mass above the H and He burning shells is reduced to 0.01 by stellar winds. All the tracks then evolve toward larger at nearly constant and . The = 1 and 3 tracks, in both the -HRD and -HRD, show late TPs for some metallicities. These are the result of a strong He flash (and nitrogen flash) that occurs after the AGB phase but before the WD cooling phase (Iben et al., 1983; Bloecker & Schoenberner, 1997; Lawlor, 2023). A candidate late TP star is V839 Ara, the central star of the Stingray Nebula (Reindl et al., 2017; Peña et al., 2022). The more dramatic very late TP stars, also visible in Figure 7, include Sakurai’s Object, V605 Aql, and perhaps HD 167362 the central star of planetary nebula SwSt 1 (Clayton & De Marco, 1997; Herwig, 2002; Miller Bertolami & Althaus, 2007; Hajduk et al., 2020; Lawlor, 2023).
Plasmon neutrino emission then dominates the energy loss budget in Figure 7 for average-mass 0.6 CO WDs with 25,000 K (Vila, 1966; Kutter & Savedoff, 1969; Bischoff-Kim & Montgomery, 2018). As the WD continues to cool, photons dominate the cooling as the electrons transition to a strongly degenerate plasma (van Horn, 1971; Córsico et al., 2019). The tracks in Figure 7 are arbitrarily chosen to terminate when the WD reaches . This is sufficient (see Figure 5 of Timmes et al., 2018) for calculating the integrated neutrino background from a simple stellar population.
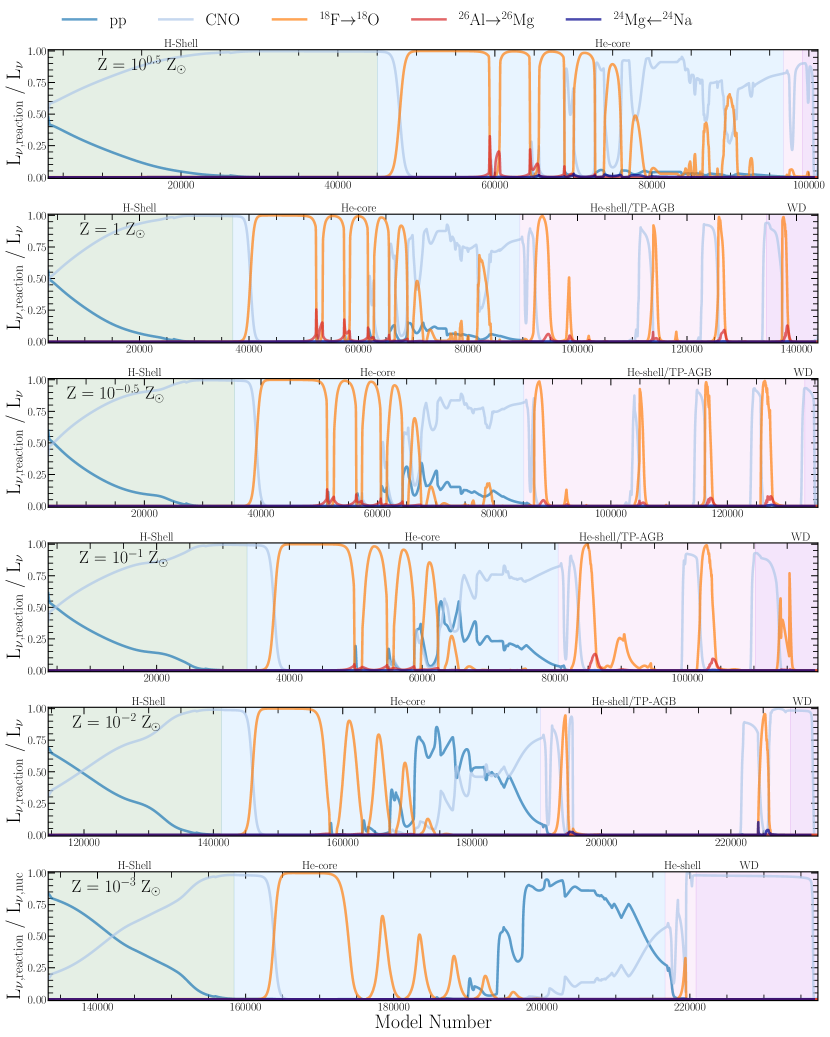
Figure 8 shows the fraction of from specific reaction sequences and weak reactions over the lifetime of the 1 models for all six metallicities. Fractions whose components do not sum to unity indicate the contribution of thermal neutrinos to .
The green shaded regions correspond to shell H-burning. The fraction of from the CNO cycles in this phase steadily increases with metallicity from the Z = 10-3 in the bottom panel to Z = 100.5 in the top panel. Since the CNO nuclei catalyze H-burning, and depend directly on the initial metallicity.
The blue shaded regions represent core He-burning. In this phase, the fraction of from the 19F 18O reaction dominates during the nitrogen flash. Neutrino emission from the H-burning pp-chain and CNO cycles appear during this phase of evolution for all six metallicities due to convective boundary mixing processes ingesting fresh H-rich material into the hotter core region. For the Z 10-0.5 tracks, the convective boundary mixing processes and hotter temperatures drive the H-burning Mg-Al cycles (red curves) and the appearance of 26Al 26Mg between sub-flashes.
Shell He-burning and the TP-AGB phase of evolution are shown by the pink shaded regions in Figure 8. The Z = 10-1,-0.5,0 tracks show traditional TPs, with the fractions contributing to oscillating between successive TPs. Neutrino emission is initially from CNO burning before a TP, and then from 19F 18O during the ensuing He-burning TP.
The Z = 10-3 and Z = 10-2 tracks in Figure 8 do not show traditional TPs. Instead they show a single event from a merger of their H-shells and He-shells that is driven by convective boundary mixing. As analyzed in Section 3.2, this is because metal-poor models have larger chemical convective boundary mixing regions than metal-rich models for fixed overshooting parameters. The Z = 100.5 tracks in Figure 8 also do not show traditional TPs due their thinner envelopes, caused by the metallicity dependent line driven wind mass loss prescriptions removing more envelope mass (). During the WD cooling phase (purple shaded regions) late TPS are visible in the Z = 10-1,0 tracks by the rise of from CNO burning and subsequently 19F 18O.
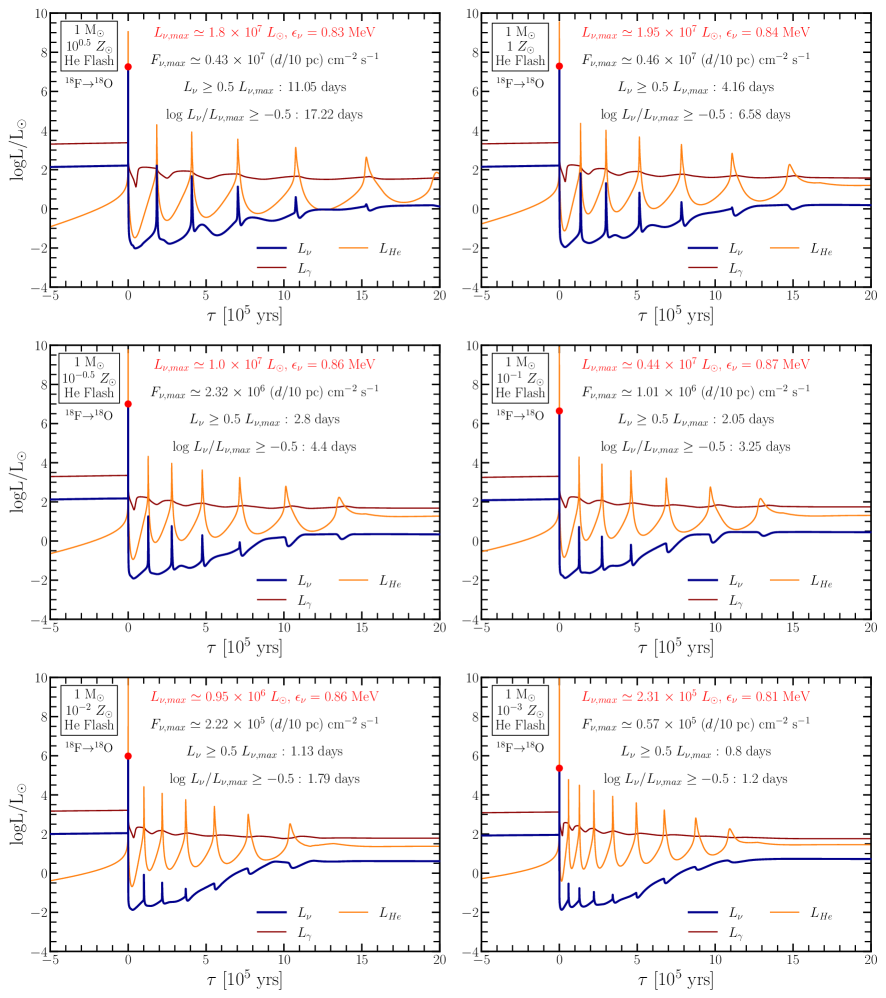
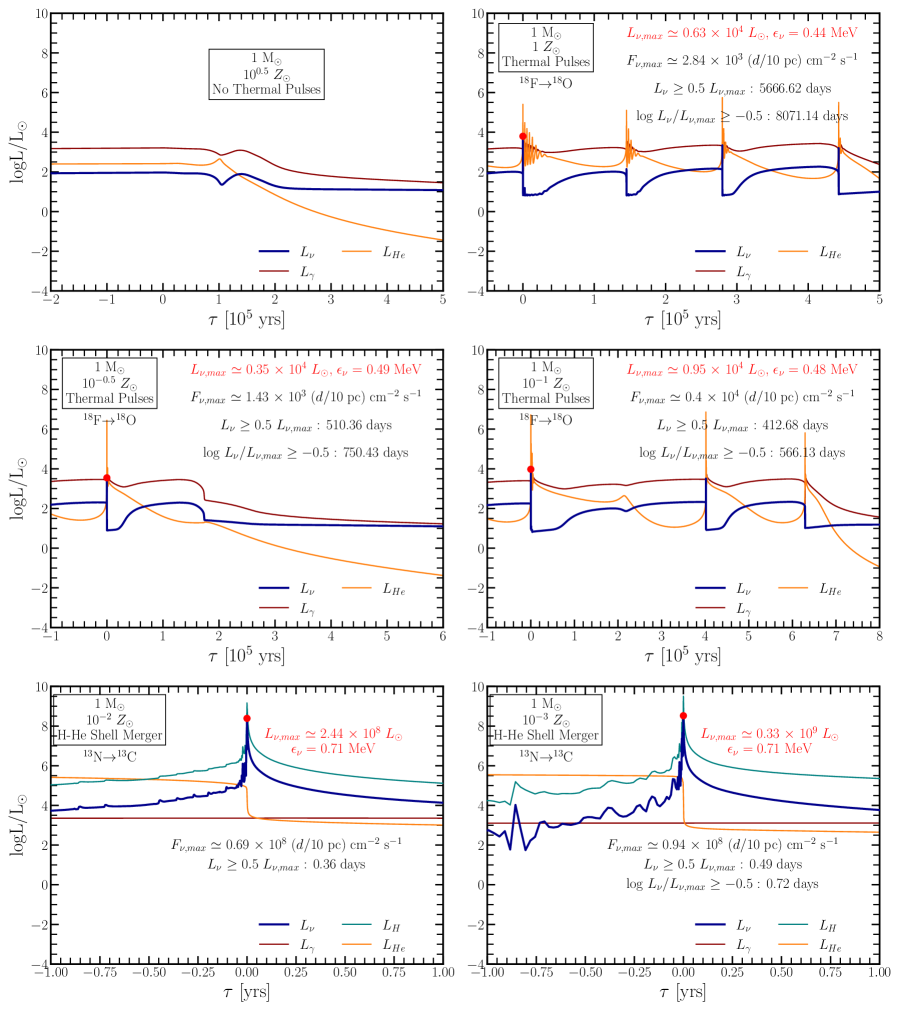
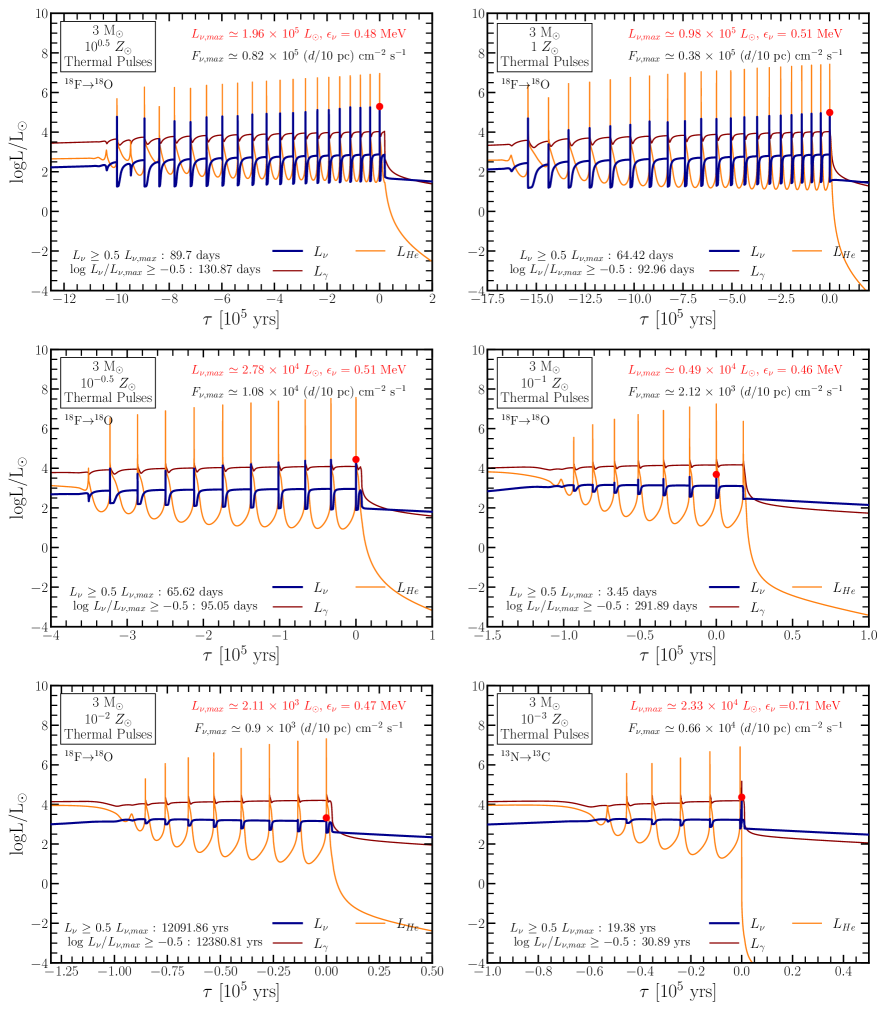
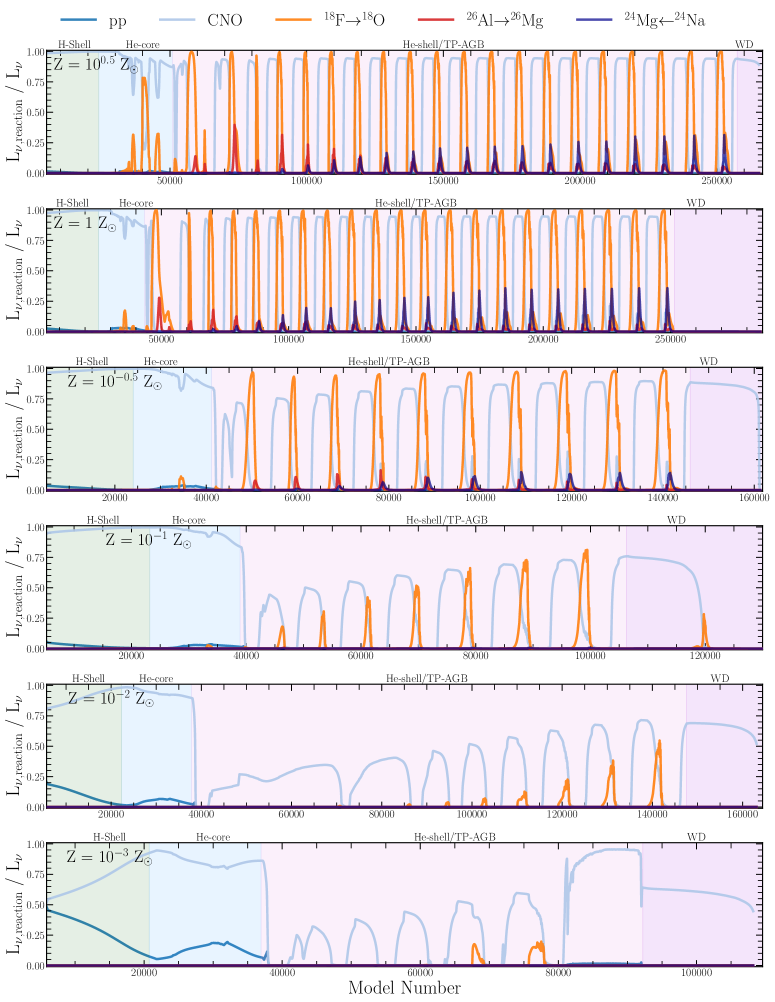
Figure 9 is the same as Figure 8 but for the lifetime of the 3 models for all six metallicities. The fraction of from CNO processing during shell H-burning (green regions) is larger for the 3 tracks than the corresponding 1 tracks of Figure 8 at all metallicities. Core He-burning (blue shaded regions) proceeds smoothly under non-degenerate conditions at all metallicities. The spikes from 19F 18O in the Z = 100.5 track during core He-burning are due to overshooting injecting fresh H-rich fuel into the core. Shell He-burning and the TP-AGB phase of evolution (pink regions) show a trend of stronger and more numerous TPs as the metallicity increases from Z = 10-3 to Z = 100.5 . Hotter temperatures in the 3 models cause neutrino emission from 26Al 26Mg during the H burning Ne-Na cycle (red curves) and from the inverse beta decay 24Na 24Mg reaction (purple curves). While 24Na is not part of the H burning Mg-Al cycle, this isotope is synthesized at low abundance levels during the Mg-Al cycle. A late TP occurs during the WD cooling phase (purple regions) for the Z = 100,-1 tracks.
Figure 10 shows , , and the He-burning luminosity during the nitrogen flash in 1 models. Across all metallicities the first flash has the largest and with . The maximum neutrino luminosity , marked by the red circles and labels, spans 2 orders of magnitude as the initial metallicity varies from Z = 10-3 to Z = 100.5 . Note is larger for the Z = 1 model than the Z = 100.5 model. This is due to mass loss. If the metallicity was 100.3 , then at the He flash would be larger than the Z = 1 model. At Z = 100.5 , mass-loss hampers the strength of the He flash. The Z = 100.5 model has = 0.6 at the onset of He-flash, while the Z = 1 model has = 0.66 . The smaller shell burning temperatures is sufficient to weaken . Note the duration of the peak in the Z = 100.5 model is significantly longer than in the Z = 1 model, ensuring more neutrinos are produced overall from the larger 14N reservoir, but with a of similar magnitude.
Figure 10 shows the average neutrino energy at is insensitive to the initial Z. The neutrino fluxes at span 2 orders of magnitude across metallicity and can serve as target values for neutrino observations of the nitrogen flash. The duration where 1/2 increases steadily from 0.8 days at Z = 10-3 to 11 days at Z = 100.5 . The duration where 1/3 increases from 1.2 days at Z = 10-3 to 17 days at Z = 100.5 . In addition, the time period between sub-flashes increases from 105 yr at Z = 10-3 to 2105 yr at Z = 100.5 while the number of sub-flashes ranges between 8 at the lowest initial Z to 5 at the largest initial Z.
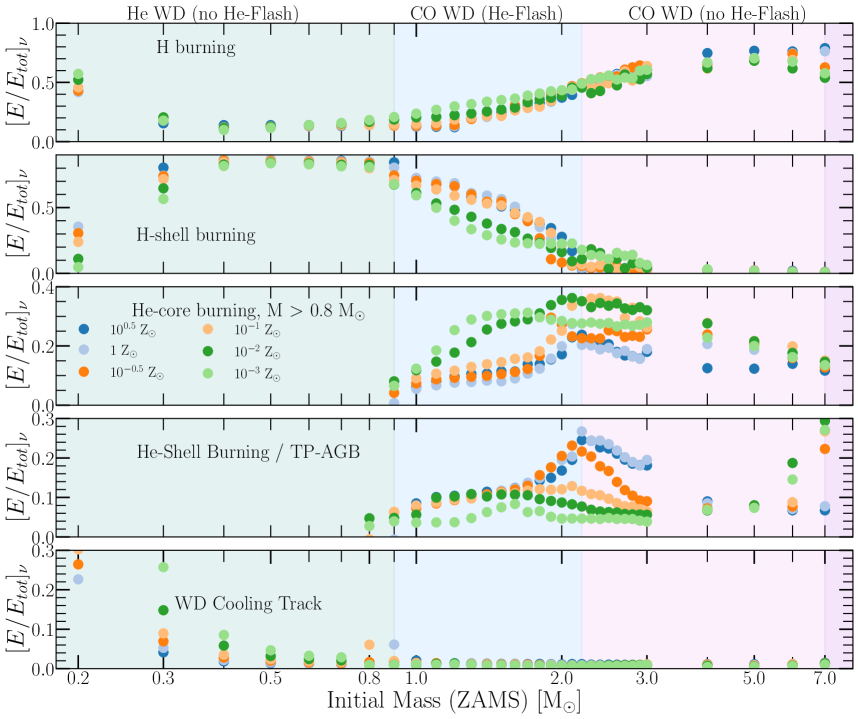
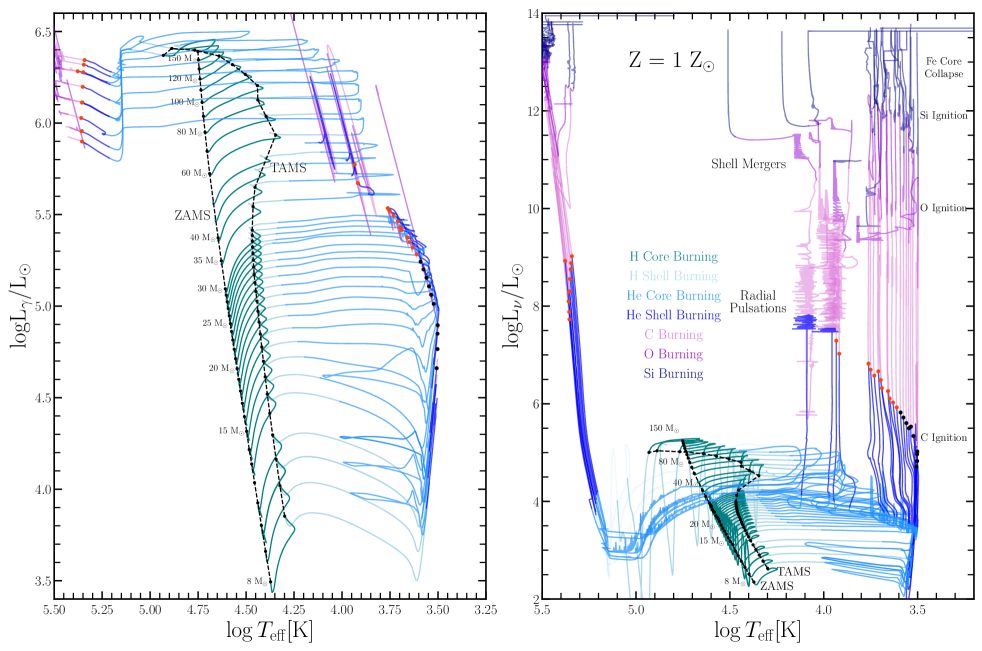
Figure 11 shows , , and during the TP-AGB phase of evolution in 1 models for all six metallicities. As discussed for Figure 8, the tracks for the lowest initial Z show a single H-shell and He-shell merger event instead of a traditional TP. For these models is dominated by 13N 13C from non-equilibrium hot CNO cycle burning. At the peak of the merger 2108 K and 104 g cm-3. At these conditions the first half of the CNO cycle, 12C(,)13N(,)13C(,)14N, is sufficiently energetic to cause a rapid expansion that self-quenches the second half of the CNO cycle, 14N(,)15O(,)15N(,)12C. For example, the stellar radius of the Z = 10-3 model rapidly increases from 68 to 465 during the merger and the number of reactions per second from 13N 13C is 3 orders of magnitude larger than from 15O 15N. Thus, these 1 low-Z models do not undergo a TP because a violent shell merger causes the model to quickly lose most of the H envelope. These mergers, driven by convective boundary mixing, produce the largest events over the entire evolution. They are also prominent and labeled in the HRD of Figure 7. The Z = 100.5 track also does not show TPs due to their thinner envelopes from wind mass loss. For the other metallicities, during the TPs is 3 orders of magnitude smaller than from the nitrogen flash shown in Figure 10.
Figure 12 shows , , and during the TP-AGB phase in the 3 models. The number of peaks (6 to 21), the peaks (2103 to 2105 ), and time between peaks (2104 yr to 4104 yr) increase with Z, with evidence of saturation by Z = 1 . Each successive TP releases more nuclear energy, thus occurs at the end of the tracks (red circles and labels) across all metallicities. The Z = 10-3 model has a larger than the Z = 10-2 model due to 13N 13O (instead of the usual 18F 18O) from a shell merger that is driven by convective boundary mixing.
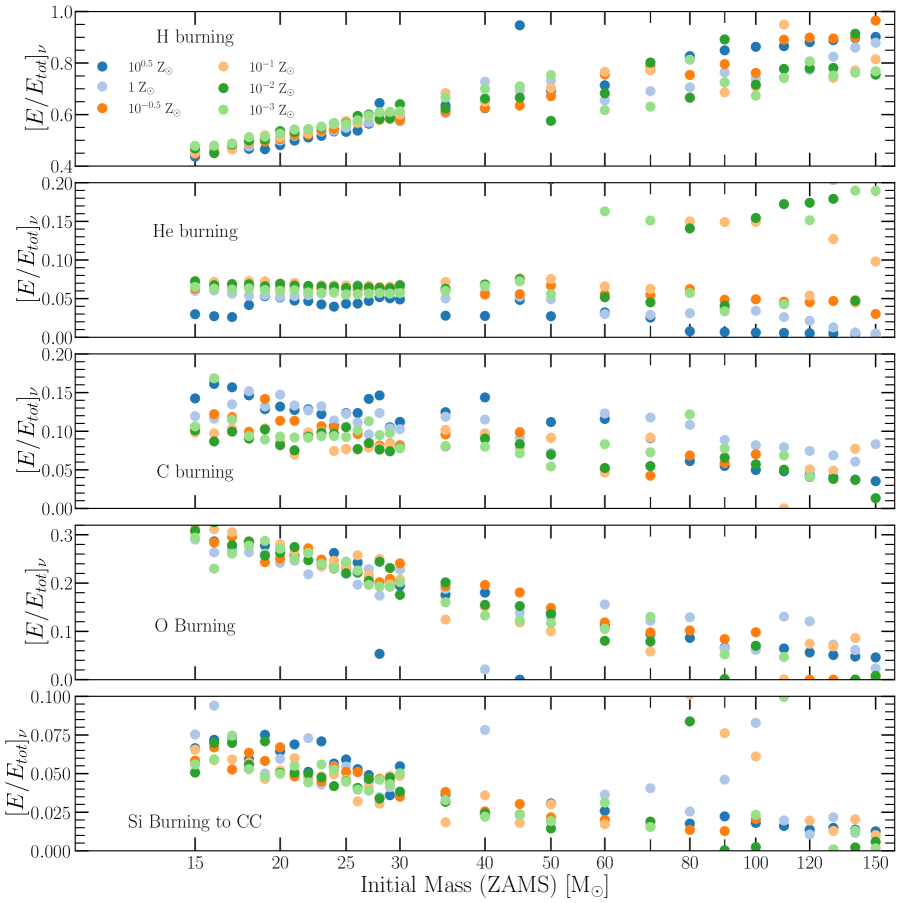
Figure 13 compares the fraction of the total energy emitted by neutrinos at five phases of evolution across the mass-metallicity plane. Models with 0.2 0.8 emit 80% of their neutrinos during shell H-burning (second panel) with a slight trend towards high-Z tracks making larger contributions than low-Z tracks. A 10% contribution originates from core H-burning (top panel), and a 10% contribution occurs during the He WD cooling phase (bottom panel). These models do not go through shell He-burning phase, as indicated by the empty region in the fourth panel, and the shorter tracks in the HRD and HRD of Figure 7.
Models whose final fate is a CO WD emit 20–80% of their neutrinos during core H-burning, 20–40% during core He-burning, and 10–30% during the TP-AGB phase. The percentages increase with , and with Z for more massive models.
5 High-mass Stars
We present features of the neutrino emission from high-mass models for one metallicity in Section 5.1, and then for all six metallicities in Section 5.2.
5.1 One Metallicity
Tracks from the ZAMS to the onset of CC for the 8 150 models in a HRD and HRD is shown in Figure 14. All tracks evolve at roughly constant and during core H-burning and He-burning as the tracks evolve from ZAMS to cooler . Neutrinos from the CNO cycles and 14N 22Ne power through these phases of evolution. From CHeD onwards, the dominance of from the core over from the surface results in a rapid reduction in evolutionary timescales from years to hours to seconds (Fowler & Hoyle, 1964; Deinzer & Salpeter, 1965; Woosley et al., 2002). This escalating rapidity appears in the HRD as the nearly vertical curves at approximately constant .
For 50 , the nearly vertical tracks at cooler in the HRD end their lives as red supergiants (RSG). The 50 models evolve through the advanced stages at increasingly hotter with thinner H envelopes, until wind driven mass-loss strips the H-envelope, creating a Wolf–Rayet model. The nearly vertical tracks at hotter in the HRD end their lives as a blue supergiants. This transition mass is the Humphrey-Davidson limit in our models (Humphreys & Davidson, 1979; Davies et al., 2018; Davies & Beasor, 2020; Sabhahit et al., 2021). The conversion of a mass limit to a luminosity limit depends on assumptions. For example, Sabhahit et al. (2021) adopt the luminosity limit as the luminosity above which a massive star model spends 5% of it’s lifetime or above the luminosity limit while the model is a yellow/red supergiant. This transition mass is sensitive to the mass and time resolution, mass-loss prescription, and treatment of super adiabatic convection in the outer envelope (Sabhahit et al., 2021).
Another feature in the HRD of Figure 14 is the radial pulsations in the 35 50 tracks that develop during He shell or C-burning, models with thin H envelopes, and 3.9 log() 4.1.
C-burning sets the entropy for the continued evolution to CC, by proceeding either convectively or radiatively (Murai et al., 1968; Arnett, 1972; Lamb et al., 1976). If the energy released by nuclear reactions is slightly larger than pair production neutrino losses, then net energy produced is transported by convection (e.g., Cristini et al., 2017). Otherwise, the core burns carbon radiatively in balanced power (Woosley et al., 2002; El Eid et al., 2004; Limongi & Chieffi, 2018), where the mass averaged nuclear energy release nearly balances the mass averaged neutrino losses. For Z = 1 , tracks for 20 burn carbon convectively (black circles in Figure 14) and tracks with 21 burn carbon radiatively (red circles in Figure 14).
The decrease in entropy from thermal neutrino emission that occurs during convective core C-burning is missing during radiative core C-burning (Weaver & Woosley, 1993). For the 21 tracks that undergo radiative C-burning, the subsequent burning phases occur at higher entropy, , at higher temperatures and lower densities. The larger entropy, in turn, drives shallower and more extended density gradients, larger effective Chandrasekhar masses at core-collapse, smaller compactness parameters, and thus are more challenging to explode as CC events (Woosley & Weaver, 1986; Nomoto & Hashimoto, 1988; Sukhbold & Woosley, 2014; Sukhbold et al., 2016, 2018; Limongi & Chieffi, 2018; Sukhbold & Adams, 2020; Burrows & Vartanyan, 2021). This entropy bifurcation at C-burning may seed a bimodal compact object distribution for single stars that undergo convective C-burning forming one peak in the compact object initial mass function (neutron stars) and single stars that undergo radiative C-burning forming a second peak (black holes) (e.g., Timmes et al., 1996; Heger et al., 2003; Zhang et al., 2008; Piro et al., 2017; Sukhbold et al., 2018; Vartanyan et al., 2018; Takahashi et al., 2023).
In the terminal phases and act as guides to the evolution and culminating fate. A dwindling , catalyzed by electron captures, hastens the core’s contraction and amplifies energy depletion through neutrino emissions, thereby altering the core’s structural equilibrium. Concurrently, as , an ascending signifies a shift towards fusing isotopically heavier nuclei, requiring ever larger core temperatures and densities to maintain hydrostatic equilibrium.
In addition, dynamical large-scale mixing on nuclear burning timescales can occur, as can mergers between the He, C, Ne, O, and Si shells. These shell mergers are sensitive to the mixing scheme adopted and particularly the treatment of convective boundary mixing across shell boundaries (e.g., Ritter et al., 2018; Fields & Couch, 2021). An approximate location of these shell mergers is labeled in the HRD of Figure 14. Strong coupling between nuclear burning and turbulent convection develop during late O-burning which requires 3D simulations to establish the fidelity of the 1D convection approximations (Meakin & Arnett, 2007; Couch et al., 2015; Müller et al., 2017; Fields & Couch, 2020, 2021). As the Fe core approaches its effective Chandrasekhar mass, electron capture and photodisintegration of nuclei drive the onset of CC.
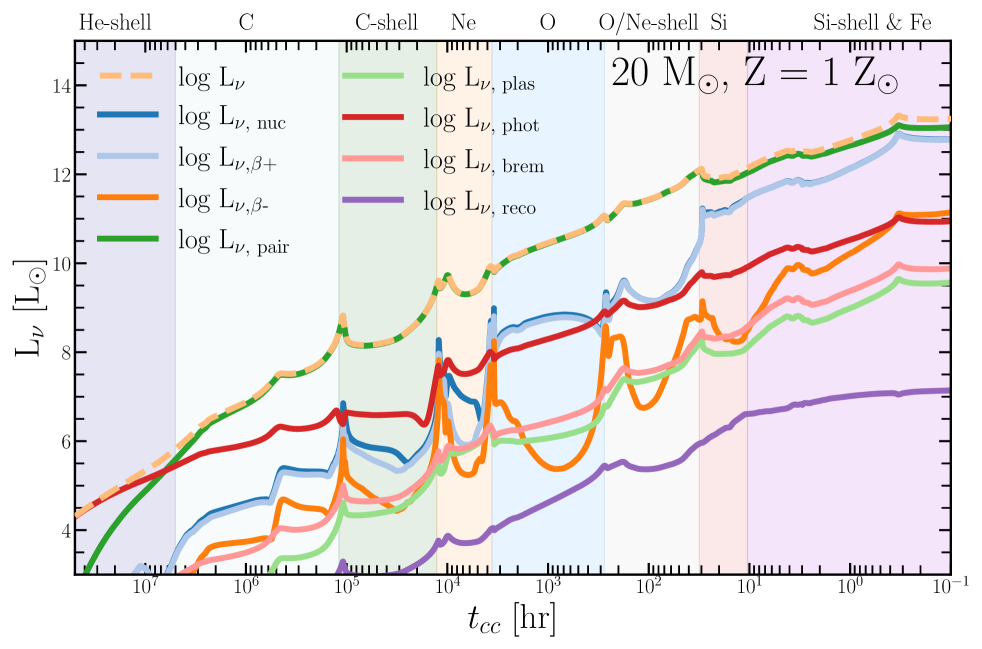
Figure 15 shows the components Lν for each phase of evolution in the = 20 Z = 1 model, from shell He-burning on the left to CC on the right. After CHeD the CO core cools and contracts as a convective He-burning shell forms. The first panel on the left shows the energy budget becomes increasingly dominated by photoneutrino production with 105 .
At 574 yr, carbon ignites with 106 and the energy budget becomes dominated by pair annihilation (second panel) . Thermal neutrinos from plasmon decay, bremsstrahlung, and recombination have luminosities several orders of magnitude smaller.
At 13.6 yr the C-shell ignites (third panel), with a sharp increase in = + 106.7 . At 1.5 yr Ne ignites (fourth panel) also with a second sharp increase in and / 5%. At 0.5 yr (fifth panel) core O ignites. Convection mixes some of the Ne-shell into the core inducing a third spike in and / 15%. At 11.5 day (sixth panel) the O-Neon shell ignites, producing a fourth spike with L and L, followed shortly by a subdued fifth spike marking the depletion of the Ne-shell and the ignition of shell O-burning. The common reason for these sharp increases (22Ne) is analyzed in detail below. At 11.5 day (seventh panel) the Si-core ignites, yielding another phase where / 15%. At 10 hr (last panel) the Si-shell ignites and 56Fe begins to form through -capture channels. Shortly after, electron capture and endothermic burning in the Fe core leads to the onset of CC.
Overall, Figure 15 shows thermal processes are the dominant form of neutrino production until Si-depletion, when neutrinos from -processes in Fe-group nuclei become a comparable portion of energy-loss budget until CC. In models which include more Fe-group nuclei in the nuclear network than we do here, neutrinos from -processes surpass thermal neutrino production at the onset of CC (Patton et al., 2017a, b; Farag et al., 2020).
We calculate an approximate pair-neutrino spectrum (Misiaszek et al., 2006b; Leung et al., 2020) from
| (14) |
where is the number of emissions with energy , and the fitting parameters are = 3.180657028, = 1.018192299, = 0.1425776426. This expression assumes the matter is relativistic and non-degenerate. We also assume all of the neutrinos are produced at the of a model, so our estimates serve as upper limits. The average pair-neutrino energy is then
| (15) |
where the integral limits are in MeV. We also cumulatively integrate over the pair-neutrino spectrum to find the lower 10% and upper 90% of neutrino energies of the pair-neutrino spectrum.
We also calculate the average electron neutrino energy from processes and average electron antineutrino energy from processes as the sum of the energy released per second of each weak reaction divided by the number luminosity
| (16) |
where =40 for the low-mass reaction network and =148 for the high-mass reaction network of Figure 1.
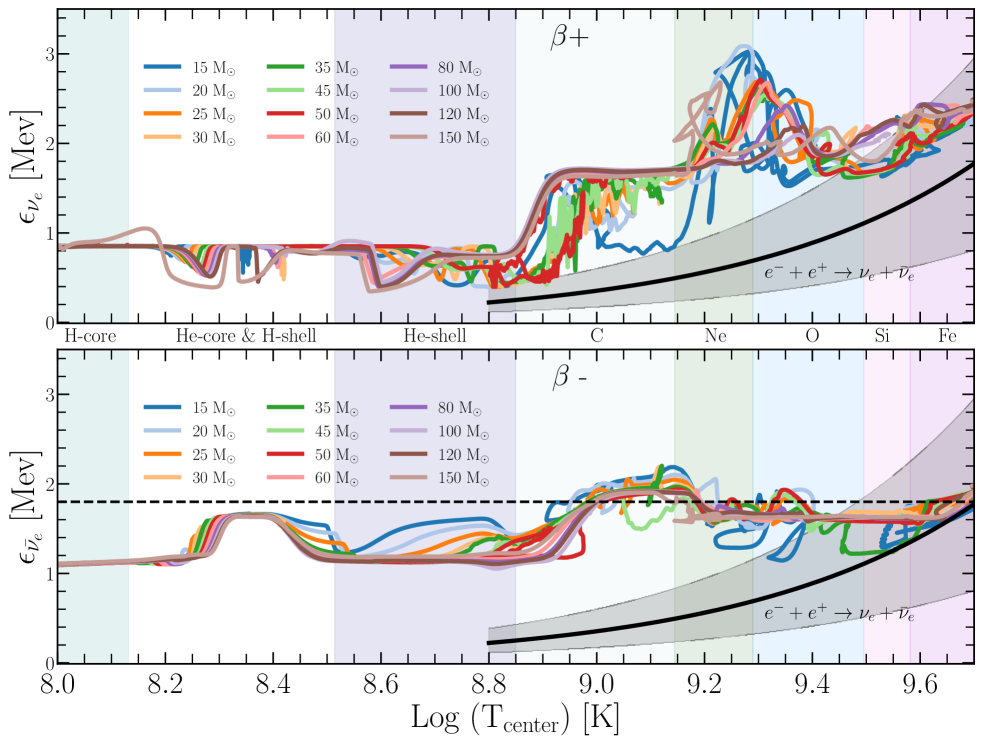
Figure 16 shows and versus for different at Z = 1 . During H and He burning, 1 MeV while 1–1.5 MeV. From C-burning to the onset of CC, remains well below and .
During C and Ne burning processes are dominated by 21,22NaNe from the Ne-Na cycle, 26AlMg from the Mg-Al cycle, and supplemented by 23MgNa. These reactions decrease in the core, and produce with average energies 1.6, 1.8, and 1.7 MeV respectively. During this phase decays are dominated by 28SiAl, 24MgNa, and 27AlMg, producing with average energies 1.6, 2.7, and 0.9 MeV respectively. The total neutrino emission grows from 20% of the total emission during C burning to 50% during Ne burning, with between 1.6–2 MeV independent of .
During Ne and O-burning there are windows where the exceeds the 1.8 MeV detection threshold to inverse beta decay of current neutrino detectors (e.g., Simpson et al., 2019; Harada et al., 2023). Table 3 lists the dominant electron anti-neutrino luminosity sources for the model during the windows where exceeds current detector thresholds.
| Rate | () | (s-1)a | (Mev) | b | b |
|---|---|---|---|---|---|
| Core Ne | |||||
| 28SiAl | 9.01046 | 1.6 | 7.2 d | 11.8 d | |
| 24MgNa | 6.11045 | 2.7 | 5.3 d | 14 d | |
| 27AlMg | 1.01046 | 0.9 | 5.2 d | 7.7 d | |
| Core O | |||||
| 28SiAl | 3.71047 | 1.6 | 11.7 hr | 8.3 hr | |
| 24MgNa | 2.31045 | 2.8 | 13 d | 17.4 d | |
| 27AlMg | 2.61045 | 1.0 | 6.5 d | 9.1 d | |
| Shell O-Ne | |||||
| 28SiAl | 5.71047 | 1.6 | 13.4 hr | 19.3 hr | |
| 24MgNa | 3.11046 | 1.0 | 20.4 hr | 1.24 d | |
| 27AlMg | 4.51046 | 2.8 | 13.7 hr | 19.2 hr |
The core continues to become more neutron-rich during O-burning primarily from 31SP, supplemented by 30PSi, 36ArCl, producing with average energies 2.2–2.4, 2.4–3.0, and 1.4 MeV respectively. -processes in the He, C, and Ne shells remain active.
Core and shell Si-burning are the last exothermic burning stages and produce the Fe-peak nuclei. Initially 31,32SP and 35,36ArCl are the main -decay channels, but are quickly replaced by 53,54,55FeMn, 51,52,53,54MnCr, 51,52,53,54MnCr, 55,56,57CoFe, 48,49CrV, and 556,57,58,60NiCo. Many of the isotopes formed during the final stages undergo -processes that continue to make the core more neutron-rich (e.g., Heger et al., 2001; Odrzywolek, 2009; Patton et al., 2017b) with 2.2 MeV and 1.8 MeV.
5.2 Six Metallicities
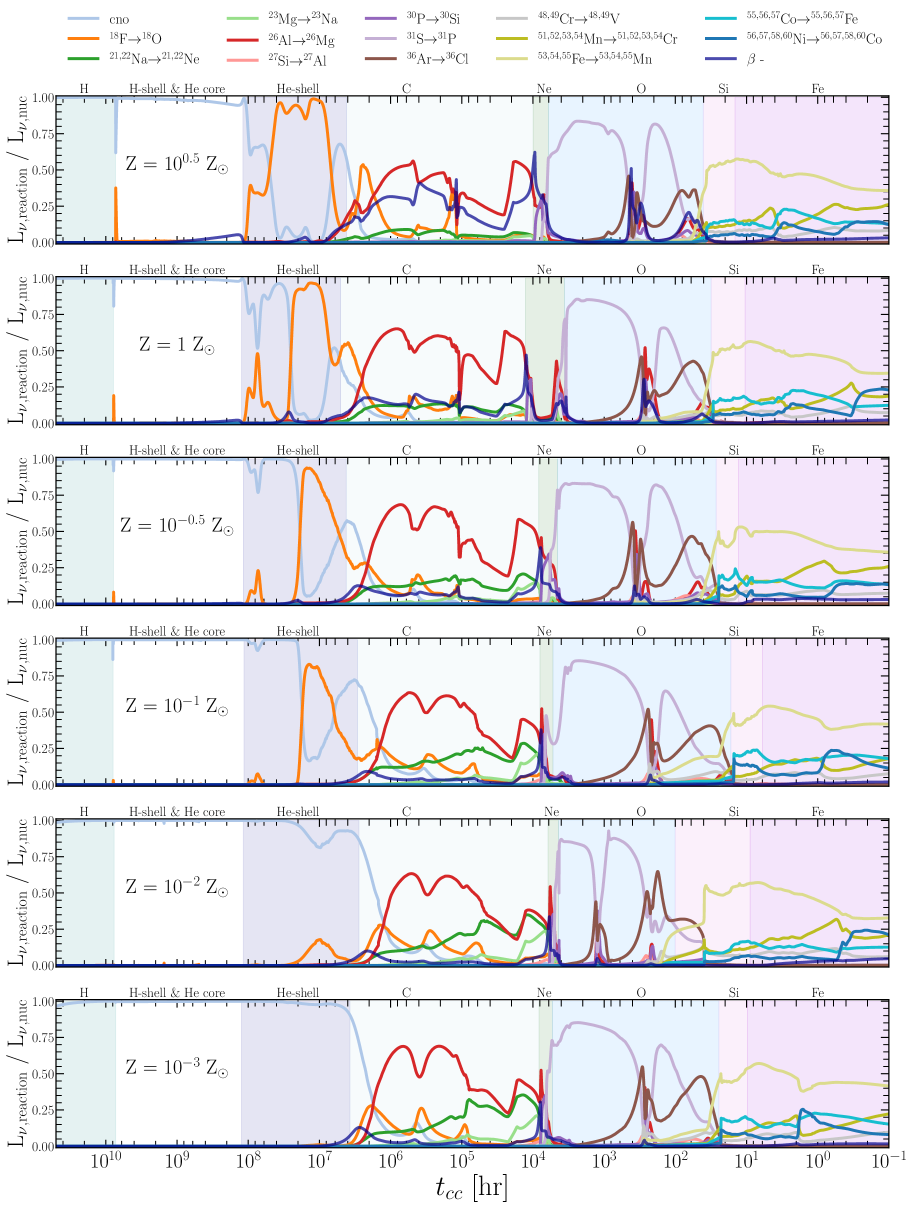
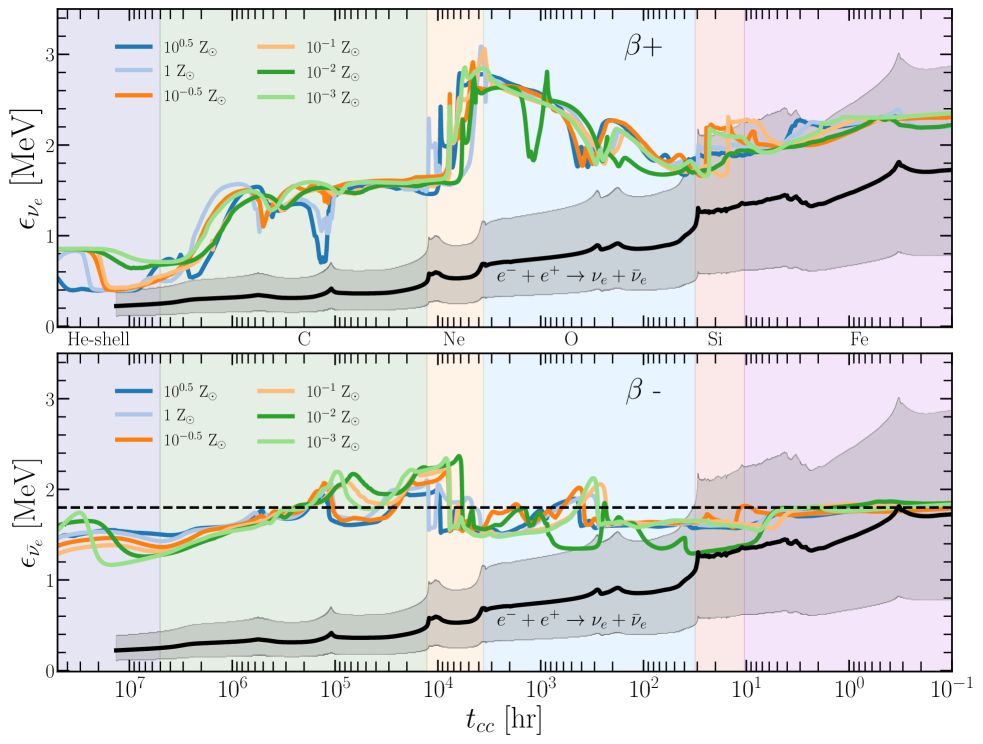
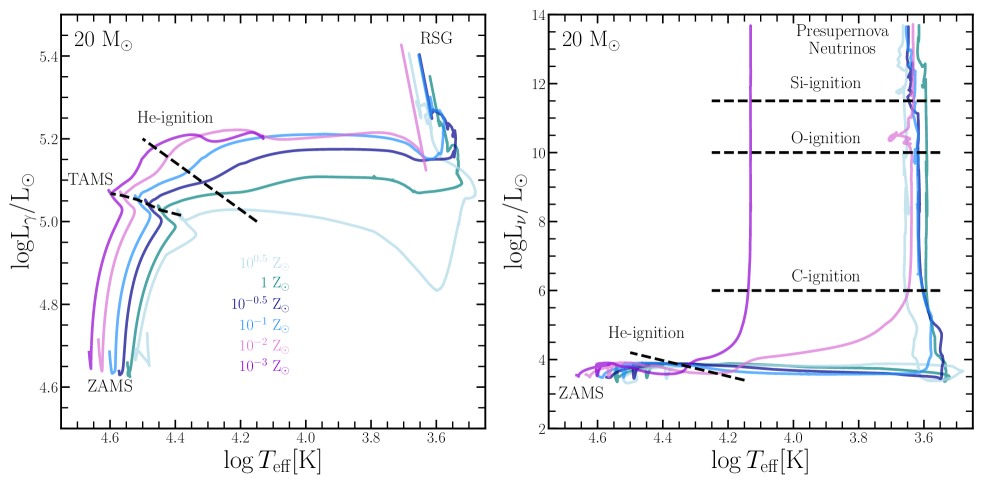
Figure 17 shows the tracks of a = 20 model in a HRD and a HRD across all six metallicities. Overall, the low-Z models show the trend of having denser, hotter and more massive cores with lower envelope opacities, larger surface luminosities and larger effective temperatures than the high-Z counterparts. The hotter yet more massive H cores extends their MS lifetimes. High-Z models show significantly shorter lifetimes than low-Z models due to their smaller H abundance at the ZAMS. For example, at the ZAMS, X = 0.75 for Z = 10-3 and X = 0.637 for Z = 100.5 . The Z = 100.5 model also possesses a significantly smaller H reservoir to burn, due to the large line-driven wind mass-loss prescription () which drives the already less massive H-burning region to retreat further inward during the MS evolution, resulting in a significantly shorter MS lifetime than any other model. Metal-poor tracks have lower envelope opacities and do not evolve to as low an as their metal-rich counterparts. This behavior is especially prominent in the Z = 10-3 model, the purple curve in Figure 17, which has a much shorter track in the HRD and is prominently offset from the lower-Z models in the HRD.
The first and second vertical panels in Figure 18 show the primary source of neutrinos during H-burning and He-core burning in a 20 model is CNO decays. At CHeD and the onset of shell He-burning (third vertical panel) from decays decreases while the CO core contracts and heats up. In higher Z models, the dominant source of neutrinos are from 14N22Ne in the growing He-burning shell. In lower Z models where less 14N is present, the dominant source of neutrinos continues to be from CNO decays in the active H-burning shell. In all models, thermally excited photoneutrinos in the hot contracting CO core begin to dominate the neutrino emission until temperatures are high enough, K, for pair-neutrinos to become the dominant energy loss mechanisms.
The accumulation of isotopically heavy 22Ne during He-burning provides the neutron excess necessary for decays to occur during advanced burning stages. A fraction of the 22Ne undergoes 22Ne(,)25Mg and to a lesser extent 22Ne(,)26Mg. Through CHeD and into C-burning 22Ne(,)25Mg is a neutron source for s-process nucleosynthesis (Peters, 1968; Couch et al., 1974; Prantzos et al., 1990; Raiteri et al., 1991b; Kappeler et al., 1989; Gallino et al., 1998; Pignatari et al., 2010; Käppeler et al., 2011; Wiescher et al., 2023).
The fate of neutron-rich 25Mg evolves during C-burning (Raiteri et al., 1991a), which is the fusion of two 12C nuclei to form an excited 24Mg∗ nucleus which decays in three channels (e.g., Woosley et al., 2002)
| (17) |
The - and -channels occur at similar rates while the channel branching ratio of 1 % (Dayras et al., 1977). Uncertainties in the branching ratios and temperature dependant rates can alter the nucleosynthetic yields during C-burning through the Ne-Na or Mg-Al cycles and the amount 20Ne available for Ne-melting (Bennett et al., 2012; Pignatari et al., 2013; Zickefoose et al., 2018; Tan et al., 2020; Monpribat et al., 2022).
The fourth vertical panel in Figure 18 shows 26Al26Mg (red curve) makes a primary contribution to from nuclear reactions at all metallicities during C-burning. The -channel powers the Ne-Na cycle, producing a neutrino signal through 21,22NaNe and 23MgNa decays. 24Mg is then produced via 23Na(,)24Mg, and 23Na(,)20Ne creates stable 20Ne – now available for a later stage of Ne-melting into 24Mg and 28Si. The Mg-Al cycle is weakly powered by the -channel 24Mg(,)25Al reaction. Instead the -channel powers the Mg-Al cycle by providing the He nuclei necessary for 22Ne(,)25Mg for the cycle to operate. Instead of 25Mg then being consumed by 25Mg(,)26Mg, protons from the -channel power 25Mg(,)26Al which undergoes decay 26AlMg, dominating the nuclear neutrino production during C-burning.
The larger of low-Z models results in a stronger expression of 21,22NaNe during C-burning. High-Z models also show a larger luminosity during C-burning than their low-Z counterparts. This results from differences in the neutron excess across metallicities. High-Z models enter C-burning with a larger 22Ne abundance available for 22Ne(,)25Mg, which provides most of the free neutrons for an s-process (Raiteri et al., 1991a; The et al., 2007; Choplin et al., 2018).
Another feature during C-burning is the luminosity declines from 50% of the total neutrino luminosity in the Z = 100.5 model, to 25% in the Z = 1 model, and 10% in lower Z models. Independent of metallicity, these decays are primarily 28AlSi, 27MgAl, and 24NaMg.
Neon melting is characterized by photodisintegration of Neon into particles, which recapture onto a second Neon nucleus to form 16O and 24Mg. The fifth vertical panel in Figure 18 shows -capture onto the remaining 22Ne in the core provides a spike in the luminosity, and a neutron source for an s-process. A metallicity dependence on the initial 22Ne content of the core affects the strength of decays at the onset of Ne-melting. A significant fraction of the 26Mg also undergoes 26Mg(,)30P which then decays to 30PSi.
O-burning is the fusion of two 16O nuclei to form an excited state of 32S∗, which promptly decays to
| (18) |
Branching ratios for the , , and channels are 34%, 56%, 5%, and 5% respectively, and the products of O-burning include 28Si, 32,33,34S, 35,36,37Cl, 36,37,38Ar, 39,40,41K, and 40,41,42Ca (Woosley et al., 2002). The limited extent of neutron rich isotopes in the high-mass nuclear reaction network of Figure 1 means we do not capture all these isotopes, including 35S and 33P.
The sixth vertical panel in Figure 18 shows 31SP makes a primary contribution to from nuclear reactions at all metallicities during O-burning. The accumulation of 36Ar leads to a growing neutrino signal from 36ArCl. After core O-depletion, shell Ne-melting occurs before O-shell burning. The -captures onto the remaining 22Ne nuclei in the shell provides a second spike in the luminosity in Figure 18.
From Si burning (Si-) until CC, the seventh and eighth vertical panel in Figure 18, there are little differences in the relative strength of individual decays. At this stage of evolution, the expression of Fe-group decays is metallicity independent, and decays remain subdominant until hr (Patton et al., 2017a, b; Kato et al., 2017, 2020a; Kosmas et al., 2022).
In Figure 19 the average neutrino and anti-neutrino energies are, to first-order, similar across metallicities for and decays in a 20 model. The largest differences in anti-neutrino energies occur during C-shell and Ne-core burning, when the neutron excess provided by 22Ne is most important. Metal-poor tracks possess lower , but higher overall average anti-neutrino energy, since the signal is increasingly dominated by 24MgNa as opposed to 28SiAl. Windows where exceeds current detector thresholds are listed in Table 3 for the Z = 1 model.
Figure 20 shows the fraction of the total neutrino energy produced during different phases of evolution in the mass-metallicity plane. The spread reflects the different fates experienced by stellar models of differing mass-metallicity. Larger spreads occur for the high-mass models where wind-driven mass-loss and shell-core mergers contribute.
Across metallicities in Figure 20, the chief nuclear neutrino production in high-mass models come from the CNO cycle during H-burning, accounting for 40–90% of the total neutrino emission with a trend towards larger fractions with increasing . Typical fractions for He-burning are , with an exception for some very massive models that produce 10–20% from recurrent mixing of the shell-H into the He core before CHeD. Typical fractions for C-burning and O-burning are 5–20% and % respectively, with a negative trend toward higher masses. From core-Si ignition to CC, 2–10% of the total neutrino emission occurs with a negative trend toward increasing masses. Overall, most neutrinos are produced during H and He burning from decays, especially in the most massive models.
6 Integrated Stellar Photon and Neutrino Emission
We explore the time-integrated photon and neutrino emission of a simple stellar population model. We assume a burst cluster population where all models are born at the same time and evolve together.
| (19) |
| (20) |
We adopt the normalized broken power law initial mass function (IMF) from Kroupa (2001) for the number of stars per unit mass . We integrate over the IMF in Equation 19 to solve for a normalization coefficient such that a cluster of mean mass 1 is formed in the burst of star formation. The minimum mass = 0.01 and the maximum mass = 150 of the IMF set the integration limits for the 1 stellar cluster. We then solve Equation 20 for the resultant integrated quantity, where is the quantity we source along an isochrone. The minimum mass = 0.2 and the maximum mass = 150 of the mass-metallicity plane set the integration limits.
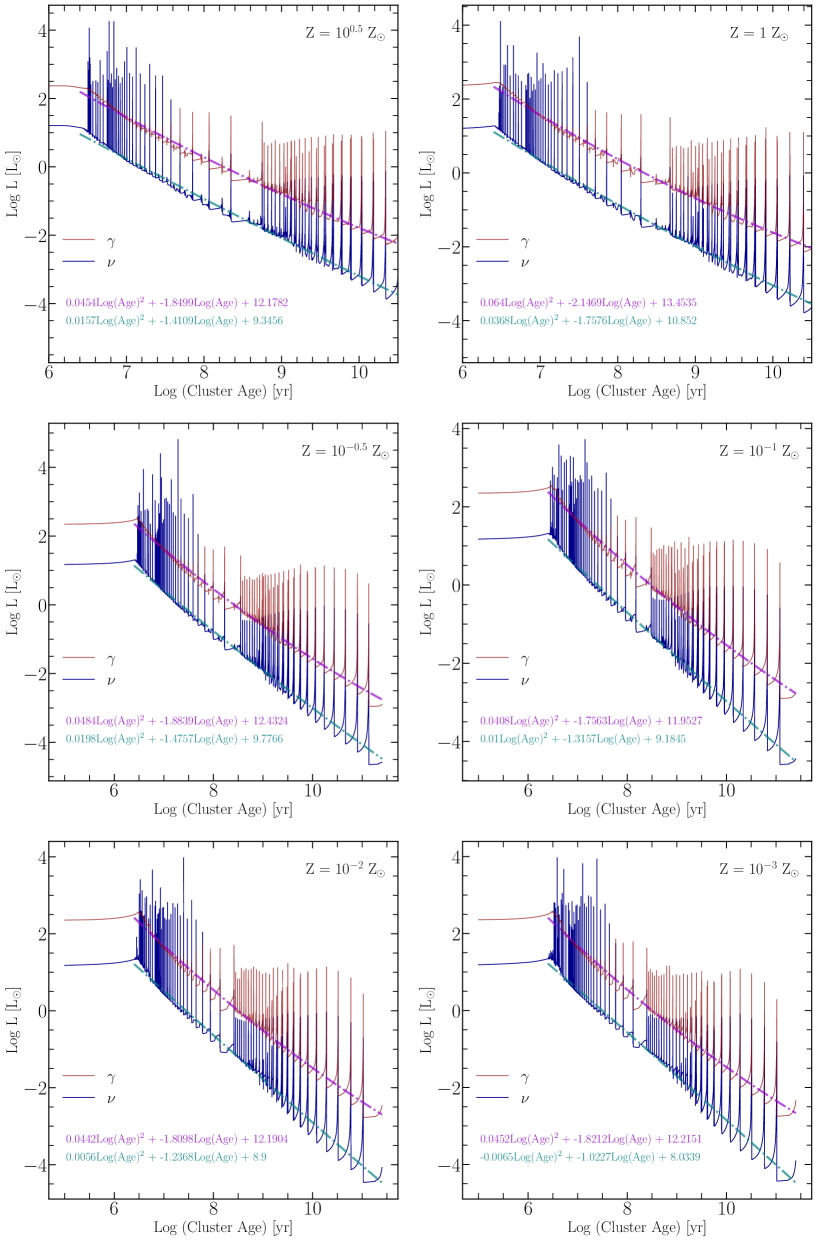
Figure 21 shows and light curves for each population synthesis model, sampled at 600,000 points in log(Age) for each metallicity. We overlay a quadratic power law for each population synthesis model to provide a convenient fitting formulae for and as a function of the stellar cluster age and mass
| (21) |
where the fit coefficients (,,) are listed in Table 4.
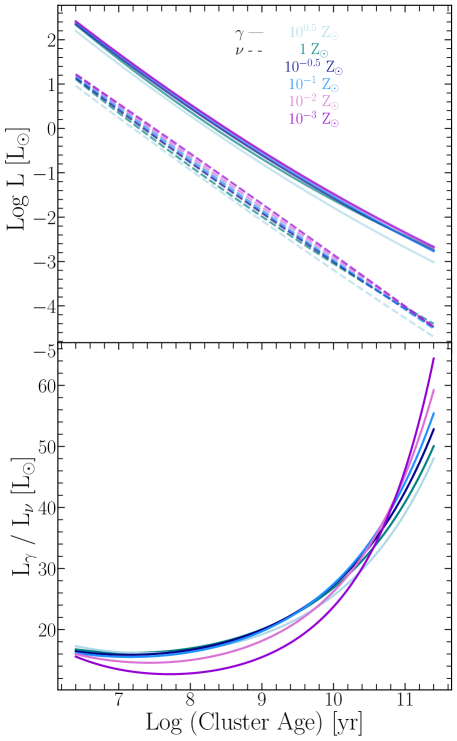
Figure 22 shows the cluster and light curves and their ratio of /. Both and are slightly larger in low-Z models until Gyr when low-Z models are depleted of most H-burning and He-burning stellar tracks, and and become comparable across all metallicities (except for Z = ). Low-Z stellar population fits show an overall larger / than high-Z fits until Gyr, when the population synthesis models are dominated by very low-mass models 0.8 .
| For Z = 100.5 | |||
| 0.0454 | 1.8499 | 12.1782 | |
| 0.0157 | 1.4109 | 9.3456 | |
| For Z = 100.0 | |||
| 0.0640 | 2.1469 | 13.4535 | |
| 0.0368 | 1.7576 | 10.8520 | |
| For Z = 10-0.5 | |||
| 0.0484 | 1.8839 | 12.4324 | |
| 0.0198 | 1.4757 | 9.7766 | |
| For Z = 10-1.0 | |||
| 0.0408 | 1.7563 | 11.9527 | |
| 0.0100 | 1.3157 | 9.1845 | |
| For Z = 10-2.0 | |||
| 0.0442 | 1.8098 | 12.1904 | |
| 0.0056 | 1.2368 | 8.9000 | |
| For Z = 10-3.0 | |||
| 0.0452 | 1.8212 | 12.2151 | |
| -0.0065 | 1.0227 | 8.0339 |
Figure 23 shows the , , B-V color, V-K color, and the light to mass ratio in the V-band versus cluster age for all six metallicities. Photon and neutrino emission at early times 107 yr is indicative of high-mass model emissions. By 108 yr, all high-mass models have reached their final fate, leaving only low-mass models in the stellar population. Most of a star’s life is spent during H and He burning in which neutrino emission is dominated by processes, therefore it is reasonable to approximate the average neutrino energy of a simple stellar population by processes alone.
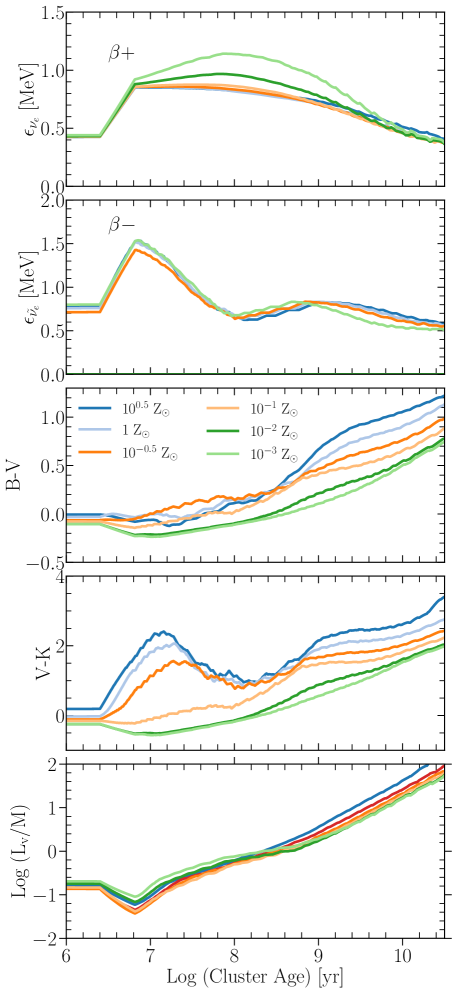
The top panel in Figure 23 shows the average neutrino energy from a simple stellar population model ranges from 0.5–1 MeV. Average neutrino energies show a slight metallicity trend, with low-Z models producing up to 0.5 MeV larger signal than high-Z models between ages of 107 – 109.5 yr, then decreasing to 0.5 MeV at 1010.5 yr. The second panel shows the average anti-neutrino energy ranging from 0.6 – 1.8 MeV. The anti-neutrino emission at early times, 107 yr, is dominated by high-mass models reaching up to MeV. By 108 yr, the anti-neutrino energy has reduced to 0.6 MeV, and remains roughly constant until yr.
The third and fourth panels in Figure 23 shows the Johnson-Cousins B-V and V-K colors respectively, calculated using the tabulations from Lejeune et al. (1998). At early times, 107 yr, there is a slight excess in B-V and a relatively large jump in V-K from the high-Z population models, roughly at the onset of the RSG phase in the high-mass models (Choi et al., 2016). The bump in V-K is suppressed in the lowest metallicity models, which do not evolve toward the RSG branch and instead remain relatively blue, with RSG color spectra similar to the MS. At late times, 109 yr when the population contains only low-mass stars, the B-V and V-K colors show an overall reddening in high-Z stellar populations.
The V band light to mass ratio in the bottom panel of Figure 23 shows a weak but distinct metallicity trend. At early times, is larger in the lower metallicity populations. This is due to the increased in low-Z models. At late times, the trend is inverted with larger the high-Z population models. This is due to the longer MS lifetimes in the high-Z population models.
7 Summary
We explored the evolution of stellar neutrino emission with 420 models spanning the initial mass 0.2 150 and initial metallicity 3 log(Z/) 0.5 plane. We found lower metallicity models are more compact, hotter, and produce larger with two exceptions. At He-core ignition on the RGB and He-shell burning on the AGB, the birth metallicity determines the amount of 14N available for the nitrogen flash 14N(,)18F(,)18O. In high-mass models, the birth metallicity determines the amount of 14N and therefore 22Ne available for 22Ne(,)25Mg, providing a neutron excess to power anti-neutrino emission during C, Ne and O burning. Overall, across the mass-metallicity plane we identify the sequence (ZCNO 14N 22Ne 25Mg 26Al 26Mg 30P 30Si) as making primary contributions to at different phases of evolution.
Simple stellar populations with lower birth metallicities have higher overall than their metal-rich counterparts. We find that most neutrinos from simple stellar populations are emitted in the form of electron-neutrinos through decays, with average energies in the range 0.5 – 1.2 MeV. Lastly, we find that metal-poor stellar populations produce larger average neutrino energies (up to 0.5 MeV), though this trend is much weaker, if resolved, for neutrino emission.
We close this article by pointing out that there are many potential sensitivities that we have not investigated. Examples include choosing different convective mixing prescriptions, mass loss algorithms, and nuclear reaction rate probability distribution functions (especially 12C(,)16O and triple-). We also neglected rotation, their associated magnetic fields, and binary interactions. Future uncertainty quantification studies could also explore potential couplings between simultaneous variations in uncertain parameters. We caution that these uncertainties, or missing physics, could alter the neutrino emission properties of our models.
Acknowledgements
We thank Thomas Steindal for his helpful discussions. We acknowledge using ChatGPT (OpenAI, 2023) to help polish the language of one paragraph (Vishniac, 2023). This research is supported by the National Science Foundation (NSF) under grant 2154339 entitled ”Neutrino Emission From Stars”. This research made extensive use of the SAO/NASA Astrophysics Data System (ADS).
References
- Abe et al. (2016) Abe, K., Haga, Y., Hayato, Y., et al. 2016, Astroparticle Physics, 81, 39, doi: 10.1016/j.astropartphys.2016.04.003
- Abe et al. (2023) Abe, S., Asami, S., Eizuka, M., et al. 2023, Phys. Rev. Lett., 130, 051801, doi: 10.1103/PhysRevLett.130.051801
- Acciarri et al. (2016) Acciarri, R., Acero, M. A., Adamowski, M., et al. 2016, arXiv e-prints, arXiv:1601.02984. https://arxiv.org/abs/1601.02984
- Ackermann et al. (2022) Ackermann, M., Bustamante, M., Lu, L., et al. 2022, Journal of High Energy Astrophysics, 36, 55, doi: 10.1016/j.jheap.2022.08.001
- Ahmad et al. (2002) Ahmad, Q. R., Allen, R. C., Andersen, T. C., et al. 2002, Phys. Rev. Lett., 89, 011301, doi: 10.1103/PhysRevLett.89.011301
- Al Kharusi et al. (2021) Al Kharusi, S., BenZvi, S. Y., Bobowski, J. S., et al. 2021, New Journal of Physics, 23, 031201, doi: 10.1088/1367-2630/abde33
- Alastuey & Jancovici (1978) Alastuey, A., & Jancovici, B. 1978, ApJ, 226, 1034
- Alekseev et al. (1987) Alekseev, E. N., Alekseeva, L. N., Volchenko, V. I., & Krivosheina, I. V. 1987, Soviet Journal of Experimental and Theoretical Physics Letters, 45, 589
- Allega et al. (2023) Allega, A., Anderson, M. R., Andringa, S., et al. 2023, Phys. Rev. Lett., 130, 091801, doi: 10.1103/PhysRevLett.130.091801
- Almeida-Fernandes et al. (2023) Almeida-Fernandes, F., Placco, V. M., Rocha-Pinto, H. J., et al. 2023, MNRAS, 523, 2934, doi: 10.1093/mnras/stad1561
- Althaus & Córsico (2022) Althaus, L. G., & Córsico, A. H. 2022, A&A, 663, A167, doi: 10.1051/0004-6361/202243943
- Alves & Sarajedini (1999) Alves, D. R., & Sarajedini, A. 1999, ApJ, 511, 225, doi: 10.1086/306655
- An et al. (2023) An, F. P., Bai, W. D., Balantekin, A. B., et al. 2023, Phys. Rev. Lett., 130, 161802, doi: 10.1103/PhysRevLett.130.161802
- Anandagoda et al. (2020) Anandagoda, S., Hartmann, D. H., Ajello, M., & Desai, A. 2020, Research Notes of the American Astronomical Society, 4, 4, doi: 10.3847/2515-5172/ab66c5
- Anandagoda et al. (2023) Anandagoda, S., Hartmann, D. H., Fryer, C. L., et al. 2023, ApJ, 950, 29, doi: 10.3847/1538-4357/acc84f
- Ando & Sato (2004) Ando, S., & Sato, K. 2004, New Journal of Physics, 6, 170, doi: 10.1088/1367-2630/6/1/170
- Angulo et al. (1999) Angulo, C., Arnould, M., Rayet, M., et al. 1999, Nuclear Physics A, 656, 3 , doi: 10.1016/S0375-9474(99)00030-5
- Arnett (1972) Arnett, W. D. 1972, ApJ, 176, 699, doi: 10.1086/151672
- Arnould et al. (1999) Arnould, M., Goriely, S., & Jorissen, A. 1999, A&A, 347, 572, doi: 10.48550/arXiv.astro-ph/9904407
- Asplund et al. (2009) Asplund, M., Grevesse, N., Sauval, A. J., & Scott, P. 2009, ARA&A, 47, 481, doi: 10.1146/annurev.astro.46.060407.145222
- Bahcall (1989) Bahcall, J. N. 1989, Neutrino Astrophysics (Cambridge, UK: Cambridge Univ. Press. )
- Bauer (2023) Bauer, E. B. 2023, ApJ, 950, 115, doi: 10.3847/1538-4357/acd057
- Bauer et al. (2020) Bauer, E. B., Schwab, J., Bildsten, L., & Cheng, S. 2020, ApJ, 902, 93, doi: 10.3847/1538-4357/abb5a5
- Beacom (2010) Beacom, J. F. 2010, Annual Review of Nuclear and Particle Science, 60, 439, doi: 10.1146/annurev.nucl.010909.083331
- Beacom & Vogel (1999) Beacom, J. F., & Vogel, P. 1999, Phys. Rev. D, 60, 033007, doi: 10.1103/PhysRevD.60.033007
- Becker & Iben (1979) Becker, S. A., & Iben, Jr., I. 1979, ApJ, 232, 831, doi: 10.1086/157345
- Becker & Iben (1980) —. 1980, ApJ, 237, 111, doi: 10.1086/157850
- Bennett et al. (2012) Bennett, M. E., Hirschi, R., Pignatari, M., et al. 2012, MNRAS, 420, 3047, doi: 10.1111/j.1365-2966.2012.20193.x
- Bildsten et al. (2012) Bildsten, L., Paxton, B., Moore, K., & Macias, P. J. 2012, ApJ, 744, L6, doi: 10.1088/2041-8205/744/1/L6
- Bionta et al. (1987) Bionta, R. M., Blewitt, G., Bratton, C. B., et al. 1987, Phys. Rev. Lett., 58, 1494, doi: 10.1103/PhysRevLett.58.1494
- Bischoff-Kim & Montgomery (2018) Bischoff-Kim, A., & Montgomery, M. H. 2018, AJ, 155, 187, doi: 10.3847/1538-3881/aab70e
- Bisnovatyi-Kogan & Seidov (1984) Bisnovatyi-Kogan, G. S., & Seidov, Z. F. 1984, Annals of the New York Academy of Sciences, 422, 319, doi: 10.1111/j.1749-6632.1984.tb23362.x
- Blöcker (2001) Blöcker, T. 2001, Ap&SS, 275, 1. https://arxiv.org/abs/astro-ph/0102135
- Bloecker & Schoenberner (1997) Bloecker, T., & Schoenberner, D. 1997, A&A, 324, 991
- Blouin et al. (2020) Blouin, S., Shaffer, N. R., Saumon, D., & Starrett, C. E. 2020, ApJ, 899, 46, doi: 10.3847/1538-4357/ab9e75
- Boeltzig et al. (2022) Boeltzig, A., deBoer, R. J., Chen, Y., et al. 2022, Phys. Rev. C, 106, 045801, doi: 10.1103/PhysRevC.106.045801
- Borexino Collaboration et al. (2014) Borexino Collaboration, Bellini, G., Benziger, J., et al. 2014, Nature, 512, 383, doi: 10.1038/nature13702
- Borexino Collaboration et al. (2018) Borexino Collaboration, Agostini, M., Altenmüller, K., et al. 2018, Nature, 562, 505, doi: 10.1038/s41586-018-0624-y
- Borexino Collaboration et al. (2020) —. 2020, Nature, 587, 577
- Bravo et al. (2010) Bravo, E., Domínguez, I., Badenes, C., Piersanti, L., & Straniero, O. 2010, ApJ, 711, L66, doi: 10.1088/2041-8205/711/2/L66
- Burrows & Vartanyan (2021) Burrows, A., & Vartanyan, D. 2021, Nature, 589, 29, doi: 10.1038/s41586-020-03059-w
- Campante et al. (2016) Campante, T. L., Schofield, M., Kuszlewicz, J. S., et al. 2016, ApJ, 830, 138, doi: 10.3847/0004-637X/830/2/138
- Capozzi & Raffelt (2020) Capozzi, F., & Raffelt, G. 2020, Phys. Rev. D, 102, 083007, doi: 10.1103/PhysRevD.102.083007
- Casamiquela et al. (2021) Casamiquela, L., Soubiran, C., Jofré, P., et al. 2021, A&A, 652, A25, doi: 10.1051/0004-6361/202039951
- Cassisi et al. (2007) Cassisi, S., Potekhin, A. Y., Pietrinferni, A., Catelan, M., & Salaris, M. 2007, ApJ, 661, 1094, doi: 10.1086/516819
- Cassisi & Salaris (2013) Cassisi, S., & Salaris, M. 2013, Old Stellar Populations: How to Study the Fossil Record of Galaxy Formation (Wiley-VCH)
- Chidester et al. (2022) Chidester, M. T., Farag, E., & Timmes, F. X. 2022, ApJ, 935, 21, doi: 10.3847/1538-4357/ac7ec3
- Chidester et al. (2021) Chidester, M. T., Timmes, F. X., Schwab, J., et al. 2021, ApJ, 910, 24, doi: 10.3847/1538-4357/abdec4
- Choi et al. (2016) Choi, J., Dotter, A., Conroy, C., et al. 2016, ApJ, 823, 102, doi: 10.3847/0004-637X/823/2/102
- Choplin et al. (2018) Choplin, A., Hirschi, R., Meynet, G., et al. 2018, A&A, 618, A133, doi: 10.1051/0004-6361/201833283
- Chugunov et al. (2007) Chugunov, A. I., Dewitt, H. E., & Yakovlev, D. G. 2007, Phys. Rev. D, 76, 025028, doi: 10.1103/PhysRevD.76.025028
- Clayton & De Marco (1997) Clayton, G. C., & De Marco, O. 1997, AJ, 114, 2679, doi: 10.1086/118678
- Córsico et al. (2019) Córsico, A. H., Althaus, L. G., Miller Bertolami, M. M., & Kepler, S. O. 2019, A&A Rev., 27, 7, doi: 10.1007/s00159-019-0118-4
- Couch et al. (1974) Couch, R. G., Schmiedekamp, A. B., & Arnett, W. D. 1974, ApJ, 190, 95, doi: 10.1086/152851
- Couch et al. (2015) Couch, S. M., Chatzopoulos, E., Arnett, W. D., & Timmes, F. X. 2015, ApJ, 808, L21, doi: 10.1088/2041-8205/808/1/L21
- Cristini et al. (2017) Cristini, A., Meakin, C., Hirschi, R., et al. 2017, MNRAS, 471, 279, doi: 10.1093/mnras/stx1535
- Cyburt et al. (2010a) Cyburt, R. H., Amthor, A. M., Ferguson, R., et al. 2010a, ApJS, 189, 240, doi: 10.1088/0067-0049/189/1/240
- Cyburt et al. (2010b) —. 2010b, ApJS, 189, 240, doi: 10.1088/0067-0049/189/1/240
- Da Costa & Armandroff (1990) Da Costa, G. S., & Armandroff, T. E. 1990, AJ, 100, 162, doi: 10.1086/115500
- Davies & Beasor (2020) Davies, B., & Beasor, E. R. 2020, MNRAS, 493, 468, doi: 10.1093/mnras/staa174
- Davies et al. (2018) Davies, B., Crowther, P. A., & Beasor, E. R. 2018, MNRAS, 478, 3138, doi: 10.1093/mnras/sty1302
- Dayras et al. (1977) Dayras, R., Switkowski, Z. E., & Woosley, S. E. 1977, Nucl. Phys. A, 279, 70, doi: 10.1016/0375-9474(77)90421-3
- De Gerónimo et al. (2022) De Gerónimo, F. C., Miller Bertolami, M. M., Plaza, F., & Catelan, M. 2022, A&A, 659, A150, doi: 10.1051/0004-6361/202142341
- deBoer et al. (2017) deBoer, R. J., Görres, J., Wiescher, M., et al. 2017, Reviews of Modern Physics, 89, 035007, doi: 10.1103/RevModPhys.89.035007
- Deinzer & Salpeter (1965) Deinzer, W., & Salpeter, E. E. 1965, ApJ, 142, 813, doi: 10.1086/148355
- Demarque (1960) Demarque, P. 1960, ApJ, 132, 366, doi: 10.1086/146936
- Demarque (1967) —. 1967, ApJ, 149, 117, doi: 10.1086/149235
- Denissenkov et al. (2015) Denissenkov, P. A., Truran, J. W., Herwig, F., et al. 2015, MNRAS, 447, 2696, doi: 10.1093/mnras/stu2589
- Dewitt et al. (1973) Dewitt, H. E., Graboske, H. C., & Cooper, M. S. 1973, ApJ, 181, 439
- Dondoglio et al. (2021) Dondoglio, E., Milone, A. P., Lagioia, E. P., et al. 2021, ApJ, 906, 76, doi: 10.3847/1538-4357/abc882
- Dutta et al. (2004) Dutta, S. I., Ratković, S., & Prakash, M. 2004, Phys. Rev. D, 69, 023005, doi: 10.1103/PhysRevD.69.023005
- Dzhioev et al. (2023) Dzhioev, A. A., Yudin, A. V., Dunina-Barkovskaya, N. V., & Vdovin, A. I. 2023, arXiv e-prints, arXiv:2306.16055, doi: 10.48550/arXiv.2306.16055
- Edvardsson et al. (1993) Edvardsson, B., Andersen, J., Gustafsson, B., et al. 1993, A&A, 275, 101
- El Eid et al. (2004) El Eid, M. F., Meyer, B. S., & The, L.-S. 2004, ApJ, 611, 452, doi: 10.1086/422162
- Farag et al. (2022) Farag, E., Renzo, M., Farmer, R., Chidester, M. T., & Timmes, F. X. 2022, ApJ, 937, 112, doi: 10.3847/1538-4357/ac8b83
- Farag et al. (2020) Farag, E., Timmes, F. X., Taylor, M., Patton, K. M., & Farmer, R. 2020, ApJ, 893, 133, doi: 10.3847/1538-4357/ab7f2c
- Farmer et al. (2016) Farmer, R., Fields, C. E., Petermann, I., et al. 2016, ApJS, 227, 22, doi: 10.3847/1538-4365/227/2/22
- Farmer et al. (2015) Farmer, R., Fields, C. E., & Timmes, F. X. 2015, ApJ, 807, 184, doi: 10.1088/0004-637X/807/2/184
- Ferguson et al. (2005) Ferguson, J. W., Alexander, D. R., Allard, F., et al. 2005, ApJ, 623, 585, doi: 10.1086/428642
- Ferguson & Dotter (2008) Ferguson, J. W., & Dotter, A. 2008, in The Art of Modeling Stars in the 21st Century, ed. L. Deng & K. L. Chan, Vol. 252, 1–11
- Fields & Couch (2020) Fields, C. E., & Couch, S. 2020
- Fields & Couch (2021) Fields, C. E., & Couch, S. M. 2021, ApJ, 921, 28, doi: 10.3847/1538-4357/ac24fb
- Fowler & Hoyle (1964) Fowler, W. A., & Hoyle, F. 1964, ApJS, 9, 201, doi: 10.1086/190103
- Franz et al. (2023) Franz, N., Dennis, M., & Sakstein, J. 2023, arXiv e-prints, arXiv:2307.13050, doi: 10.48550/arXiv.2307.13050
- Fuller et al. (1985) Fuller, G. M., Fowler, W. A., & Newman, M. J. 1985, ApJ, 293, 1, doi: 10.1086/163208
- Gallino et al. (1998) Gallino, R., Arlandini, C., Busso, M., et al. 1998, ApJ, 497, 388, doi: 10.1086/305437
- García-Berro et al. (1997) García-Berro, E., Ritossa, C., & Iben, Jr., I. 1997, ApJ, 485, 765
- Gautschy (2012) Gautschy, A. 2012, ArXiv e-prints. https://arxiv.org/abs/1208.3870
- Gautschy (2013) —. 2013, arXiv e-prints, arXiv:1303.6652, doi: 10.48550/arXiv.1303.6652
- Georgy et al. (2013) Georgy, C., Ekström, S., Eggenberger, P., et al. 2013, A&A, 558, A103, doi: 10.1051/0004-6361/201322178
- Giannone & Weigert (1967) Giannone, P., & Weigert, A. 1967, ZAp, 67, 41
- Girardi (1999) Girardi, L. 1999, MNRAS, 308, 818, doi: 10.1046/j.1365-8711.1999.02746.x
- Glebbeek et al. (2009) Glebbeek, E., Gaburov, E., de Mink, S. E., Pols, O. R., & Portegies Zwart, S. F. 2009, A&A, 497, 255, doi: 10.1051/0004-6361/200810425
- Graboske et al. (1973) Graboske, H. C., Dewitt, H. E., Grossman, A. S., & Cooper, M. S. 1973, ApJ, 181, 457
- Groh et al. (2019) Groh, J. H., Ekström, S., Georgy, C., et al. 2019, A&A, 627, A24, doi: 10.1051/0004-6361/201833720
- Hajduk et al. (2020) Hajduk, M., Todt, H., Hamann, W.-R., et al. 2020, MNRAS, 498, 1205, doi: 10.1093/mnras/staa2274
- Hansen et al. (2004) Hansen, C. J., Kawaler, S. D., & Trimble, V. 2004, Stellar interiors : physical principles, structure, and evolution (New York: Springer-Verlag)
- Harada et al. (2023) Harada, M., Abe, K., Bronner, C., et al. 2023, arXiv e-prints, arXiv:2305.05135, doi: 10.48550/arXiv.2305.05135
- Hartmann & Woosley (1997) Hartmann, D. H., & Woosley, S. E. 1997, Astroparticle Physics, 7, 137, doi: 10.1016/S0927-6505(97)00018-2
- Hawkins et al. (2017) Hawkins, K., Leistedt, B., Bovy, J., & Hogg, D. W. 2017, MNRAS, 471, 722, doi: 10.1093/mnras/stx1655
- Hayashi et al. (1962) Hayashi, C., Hōshi, R., & Sugimoto, D. 1962, Progress of Theoretical Physics Supplement, 22, 1, doi: 10.1143/PTPS.22.1
- Heger et al. (2003) Heger, A., Fryer, C. L., Woosley, S. E., Langer, N., & Hartmann, D. H. 2003, ApJ, 591, 288, doi: 10.1086/375341
- Heger et al. (2001) Heger, A., Woosley, S. E., Martínez-Pinedo, G., & Langanke, K. 2001, ApJ, 560, 307, doi: 10.1086/324092
- Herwig (2000) Herwig, F. 2000, A&A, 360, 952
- Herwig (2002) —. 2002, Ap&SS, 279, 103, doi: 10.48550/arXiv.astro-ph/0103003
- Herwig (2005) —. 2005, ARA&A, 43, 435
- Hirata et al. (1987) Hirata, K., Kajita, T., Koshiba, M., Nakahata, M., & Oyama, Y. 1987, Phys. Rev. Lett., 58, 1490, doi: 10.1103/PhysRevLett.58.1490
- Hirata et al. (1988) Hirata, K. S., Kajita, T., Koshiba, M., et al. 1988, Phys. Rev. D, 38, 448, doi: 10.1103/PhysRevD.38.448
- Hofmeister et al. (1964) Hofmeister, E., Kippenhahn, R., & Weigert, A. 1964, ZAp, 60, 57
- Horiuchi et al. (2009) Horiuchi, S., Beacom, J. F., & Dwek, E. 2009, Phys. Rev. D, 79, 083013, doi: 10.1103/PhysRevD.79.083013
- Humphreys & Davidson (1979) Humphreys, R. M., & Davidson, K. 1979, ApJ, 232, 409, doi: 10.1086/157301
- Hunter (2007) Hunter, J. D. 2007, Computing In Science & Engineering, 9, 90
- Iben et al. (1983) Iben, I., J., Kaler, J. B., Truran, J. W., & Renzini, A. 1983, ApJ, 264, 605, doi: 10.1086/160631
- Iben (1963) Iben, Icko, J. 1963, ApJ, 138, 452, doi: 10.1086/147658
- Iben & Rood (1970) Iben, Icko, J., & Rood, R. T. 1970, ApJ, 159, 605, doi: 10.1086/150335
- IceCube Collaboration (2023) IceCube Collaboration. 2023, Science, 380, 1338, doi: 10.1126/science.adc9818
- Iglesias & Rogers (1993) Iglesias, C. A., & Rogers, F. J. 1993, ApJ, 412, 752, doi: 10.1086/172958
- Iglesias & Rogers (1996) —. 1996, ApJ, 464, 943, doi: 10.1086/177381
- Irwin (2004) Irwin, A. W. 2004, The FreeEOS Code for Calculating the Equation of State for Stellar Interiors, http://freeeos.sourceforge.net/,
- Itoh et al. (1989) Itoh, N., Adachi, T., Nakagawa, M., Kohyama, Y., & Munakata, H. 1989, ApJ, 339, 354, doi: 10.1086/167301
- Itoh et al. (1996a) Itoh, N., Hayashi, H., Nishikawa, A., & Kohyama, Y. 1996a, ApJS, 102, 411
- Itoh et al. (1992) Itoh, N., Mutoh, H., Hikita, A., & Kohyama, Y. 1992, ApJ, 395, 622, doi: 10.1086/171682
- Itoh et al. (1996b) Itoh, N., Nishikawa, A., & Kohyama, Y. 1996b, ApJ, 470, 1015, doi: 10.1086/177926
- Itoh et al. (1979) Itoh, N., Totsuji, H., Ichimaru, S., & Dewitt, H. E. 1979, ApJ, 234, 1079
- Izzard et al. (2007) Izzard, R. G., Lugaro, M., Karakas, A. I., Iliadis, C., & van Raai, M. 2007, A&A, 466, 641, doi: 10.1051/0004-6361:20066903
- Jermyn et al. (2021) Jermyn, A. S., Schwab, J., Bauer, E., Timmes, F. X., & Potekhin, A. Y. 2021, ApJ, 913, 72, doi: 10.3847/1538-4357/abf48e
- Jermyn et al. (2023) Jermyn, A. S., Bauer, E. B., Schwab, J., et al. 2023, ApJS, 265, 15, doi: 10.3847/1538-4365/acae8d
- José et al. (1999) José, J., Coc, A., & Hernanz, M. 1999, ApJ, 520, 347, doi: 10.1086/307445
- Kantor & Gusakov (2007) Kantor, E. M., & Gusakov, M. E. 2007, MNRAS, 381, 1702, doi: 10.1111/j.1365-2966.2007.12342.x
- Kappeler et al. (1989) Kappeler, F., Beer, H., & Wisshak, K. 1989, Reports on Progress in Physics, 52, 945, doi: 10.1088/0034-4885/52/8/002
- Käppeler et al. (2011) Käppeler, F., Gallino, R., Bisterzo, S., & Aoki, W. 2011, Reviews of Modern Physics, 83, 157, doi: 10.1103/RevModPhys.83.157
- Kato et al. (2015) Kato, C., Delfan Azari, M., Yamada, S., et al. 2015, ApJ, 808, 168, doi: 10.1088/0004-637X/808/2/168
- Kato et al. (2020a) Kato, C., Hirai, R., & Nagakura, H. 2020a, MNRAS, 496, 3961, doi: 10.1093/mnras/staa1738
- Kato et al. (2020b) Kato, C., Ishidoshiro, K., & Yoshida, T. 2020b, Annual Review of Nuclear and Particle Science, 70, 121, doi: 10.1146/annurev-nucl-040620-021320
- Kato et al. (2017) Kato, C., Nagakura, H., Furusawa, S., et al. 2017, ApJ, 848, 48, doi: 10.3847/1538-4357/aa8b72
- Kemp et al. (2022) Kemp, A. J., Karakas, A. I., Casey, A. R., Kobayashi, C., & Izzard, R. G. 2022, MNRAS, 509, 1175, doi: 10.1093/mnras/stab3103
- Kosmas et al. (2022) Kosmas, T. S., Tsoulos, I., Kosmas, O., & Giannaka, P. G. 2022, Frontiers in Astronomy and Space Sciences, 8, 763276, doi: 10.3389/fspas.2021.763276
- Krauss et al. (1984) Krauss, L. M., Glashow, S. L., & Schramm, D. N. 1984, Nature, 310, 191, doi: 10.1038/310191a0
- Kroupa (2001) Kroupa, P. 2001, MNRAS, 322, 231, doi: 10.1046/j.1365-8711.2001.04022.x
- Kutschera et al. (2009) Kutschera, M., Odrzywołek, A., & Misiaszek, M. 2009, Acta Physica Polonica B, 40, 3063
- Kutter & Savedoff (1969) Kutter, G. S., & Savedoff, M. P. 1969, ApJ, 156, 1021, doi: 10.1086/150033
- Kyutoku & Kashiyama (2018) Kyutoku, K., & Kashiyama, K. 2018, Phys. Rev. D, 97, 103001, doi: 10.1103/PhysRevD.97.103001
- Lamb et al. (1976) Lamb, S. A., Iben, Jr., I., & Howard, W. M. 1976, ApJ, 207, 209, doi: 10.1086/154486
- Langanke & Martínez-Pinedo (2000) Langanke, K., & Martínez-Pinedo, G. 2000, Nuclear Physics A, 673, 481, doi: 10.1016/S0375-9474(00)00131-7
- Lawlor (2023) Lawlor, T. M. 2023, MNRAS, 519, 5373, doi: 10.1093/mnras/stad042
- Lecoanet et al. (2016) Lecoanet, D., Schwab, J., Quataert, E., et al. 2016, ApJ, 832, 71, doi: 10.3847/0004-637X/832/1/71
- Lee et al. (1993) Lee, M. G., Freedman, W. L., & Madore, B. F. 1993, ApJ, 417, 553, doi: 10.1086/173334
- Lejeune et al. (1998) Lejeune, T., Cuisinier, F., & Buser, R. 1998, A&AS, 130, 65, doi: 10.1051/aas:1998405
- Leung et al. (2020) Leung, S.-C., Blinnikov, S., Ishidoshiro, K., Kozlov, A., & Nomoto, K. 2020, ApJ, 889, 75, doi: 10.3847/1538-4357/ab6211
- Limongi & Chieffi (2018) Limongi, M., & Chieffi, A. 2018, ApJS, 237, 13, doi: 10.3847/1538-4365/aacb24
- Lin & Lunardini (2020) Lin, Z., & Lunardini, C. 2020, Phys. Rev. D, 101, 023016, doi: 10.1103/PhysRevD.101.023016
- Lunardini & Winter (2017) Lunardini, C., & Winter, W. 2017, Phys. Rev. D, 95, 123001, doi: 10.1103/PhysRevD.95.123001
- Madore et al. (2023) Madore, B. F., Freedman, W. L., Owens, K. A., & Jang, I. S. 2023, AJ, 166, 2, doi: 10.3847/1538-3881/acd3f3
- Marion & Fowler (1957) Marion, J. B., & Fowler, W. A. 1957, ApJ, 125, 221, doi: 10.1086/146296
- Meakin & Arnett (2007) Meakin, C. A., & Arnett, D. 2007, ApJ, 667, 448
- Mehta et al. (2022) Mehta, A. K., Buonanno, A., Gair, J., et al. 2022, ApJ, 924, 39, doi: 10.3847/1538-4357/ac3130
- Miller Bertolami & Althaus (2007) Miller Bertolami, M. M., & Althaus, L. G. 2007, MNRAS, 380, 763, doi: 10.1111/j.1365-2966.2007.12115.x
- Misiaszek et al. (2006a) Misiaszek, M., Odrzywołek, A., & Kutschera, M. 2006a, Phys. Rev. D, 74, 043006, doi: 10.1103/PhysRevD.74.043006
- Misiaszek et al. (2006b) —. 2006b, Phys. Rev. D, 74, 043006, doi: 10.1103/PhysRevD.74.043006
- Mitalas (1985) Mitalas, R. 1985, ApJ, 290, 273, doi: 10.1086/162981
- Monpribat et al. (2022) Monpribat, E., Martinet, S., Courtin, S., et al. 2022, A&A, 660, A47, doi: 10.1051/0004-6361/202141858
- Mukhopadhyay et al. (2020) Mukhopadhyay, M., Lunardini, C., Timmes, F. X., & Zuber, K. 2020, ApJ, 899, 153, doi: 10.3847/1538-4357/ab99a6
- Müller et al. (2017) Müller, B., Melson, T., Heger, A., & Janka, H.-T. 2017, MNRAS, 472, 491, doi: 10.1093/mnras/stx1962
- Murai et al. (1968) Murai, T., Sugimoto, D., Hōshi, R., & Hayashi, C. 1968, Progress of Theoretical Physics, 39, 619, doi: 10.1143/PTP.39.619
- Nabi et al. (2021) Nabi, J.-U., Ullah, A., & Khan, A. A. 2021, ApJ, 911, 93, doi: 10.3847/1538-4357/abe94f
- Naumov (2011) Naumov, V. A. 2011, Physics of Particles and Nuclei Letters, 8, 683, doi: 10.1134/S1547477111070144
- Nieuwenhuijzen & de Jager (1990) Nieuwenhuijzen, H., & de Jager, C. 1990, A&A, 231, 134
- Nomoto & Hashimoto (1988) Nomoto, K., & Hashimoto, M. 1988, Phys. Rep., 163, 13, doi: 10.1016/0370-1573(88)90032-4
- Nugis & Lamers (2000) Nugis, T., & Lamers, H. J. G. L. M. 2000, A&A, 360, 227
- Oda et al. (1994) Oda, T., Hino, M., Muto, K., Takahara, M., & Sato, K. 1994, Atomic Data and Nuclear Data Tables, 56, 231, doi: 10.1006/adnd.1994.1007
- Odrzywołek (2007) Odrzywołek, A. 2007, European Physical Journal C, 52, 425, doi: 10.1140/epjc/s10052-007-0378-4
- Odrzywolek (2009) Odrzywolek, A. 2009, Phys. Rev. C, 80, 045801, doi: 10.1103/PhysRevC.80.045801
- Odrzywolek & Heger (2010) Odrzywolek, A., & Heger, A. 2010, Acta Phys. Polon. B, 41, 1611
- Odrzywolek et al. (2004) Odrzywolek, A., Misiaszek, M., & Kutschera, M. 2004, Astroparticle Physics, 21, 303, doi: 10.1016/j.astropartphys.2004.02.002
- OpenAI (2023) OpenAI. 2023, arXiv e-prints, arXiv:2303.08774, doi: 10.48550/arXiv.2303.08774
- Patton et al. (2017a) Patton, K. M., Lunardini, C., & Farmer, R. J. 2017a, ApJ, 840, 2, doi: 10.3847/1538-4357/aa6ba8
- Patton et al. (2017b) Patton, K. M., Lunardini, C., Farmer, R. J., & Timmes, F. X. 2017b, ApJ, 851, 6, doi: 10.3847/1538-4357/aa95c4
- Paxton et al. (2011) Paxton, B., Bildsten, L., Dotter, A., et al. 2011, ApJS, 192, 3, doi: 10.1088/0067-0049/192/1/3
- Paxton et al. (2013) Paxton, B., Cantiello, M., Arras, P., et al. 2013, ApJS, 208, 4, doi: 10.1088/0067-0049/208/1/4
- Paxton et al. (2015) Paxton, B., Marchant, P., Schwab, J., et al. 2015, ApJS, 220, 15, doi: 10.1088/0067-0049/220/1/15
- Paxton et al. (2018) Paxton, B., Schwab, J., Bauer, E. B., et al. 2018, ApJS, 234, 34, doi: 10.3847/1538-4365/aaa5a8
- Paxton et al. (2019) Paxton, B., Smolec, R., Schwab, J., et al. 2019, arXiv e-prints, arXiv:1903.01426. https://arxiv.org/abs/1903.01426
- Peña et al. (2022) Peña, M., Parthasarathy, M., Ruiz-Escobedo, F., & Manick, R. 2022, MNRAS, 515, 1459, doi: 10.1093/mnras/stac1750
- Peters (1968) Peters, J. G. 1968, ApJ, 154, 225, doi: 10.1086/149753
- Piersanti et al. (2022) Piersanti, L., Bravo, E., Straniero, O., Cristallo, S., & Domínguez, I. 2022, ApJ, 926, 103, doi: 10.3847/1538-4357/ac403b
- Pignatari et al. (2010) Pignatari, M., Gallino, R., Heil, M., et al. 2010, ApJ, 710, 1557, doi: 10.1088/0004-637X/710/2/1557
- Pignatari et al. (2013) Pignatari, M., Hirschi, R., Wiescher, M., et al. 2013, ApJ, 762, 31, doi: 10.1088/0004-637X/762/1/31
- Piro et al. (2017) Piro, A. L., Giacomazzo, B., & Perna, R. 2017, ApJ, 844, L19, doi: 10.3847/2041-8213/aa7f2f
- Planck Collaboration et al. (2016) Planck Collaboration, Ade, P. A. R., Aghanim, N., et al. 2016, A&A, 594, A13, doi: 10.1051/0004-6361/201525830
- Potekhin & Chabrier (2010) Potekhin, A. Y., & Chabrier, G. 2010, Contributions to Plasma Physics, 50, 82, doi: 10.1002/ctpp.201010017
- Poutanen (2017) Poutanen, J. 2017, ApJ, 835, 119, doi: 10.3847/1538-4357/835/2/119
- Prantzos et al. (1990) Prantzos, N., Hashimoto, M., & Nomoto, K. 1990, A&A, 234, 211
- Prša et al. (2016) Prša, A., Harmanec, P., Torres, G., et al. 2016, AJ, 152, 41, doi: 10.3847/0004-6256/152/2/41
- Raiteri et al. (1991a) Raiteri, C. M., Busso, M., Gallino, R., & Picchio, G. 1991a, ApJ, 371, 665, doi: 10.1086/169932
- Raiteri et al. (1991b) Raiteri, C. M., Busso, M., Gallino, R., Picchio, G., & Pulone, L. 1991b, ApJ, 367, 228, doi: 10.1086/169622
- Ratcliffe et al. (2023) Ratcliffe, B., Minchev, I., Anders, F., et al. 2023, MNRAS, doi: 10.1093/mnras/stad1573
- Ratković et al. (2003) Ratković, S., Iyer Dutta, S., & Prakash, M. 2003, Phys. Rev. D, 67, 123002, doi: 10.1103/PhysRevD.67.123002
- Reimers (1977) Reimers, D. 1977, A&A, 61, 217
- Reindl et al. (2017) Reindl, N., Rauch, T., Miller Bertolami, M. M., Todt, H., & Werner, K. 2017, MNRAS, 464, L51, doi: 10.1093/mnrasl/slw175
- Reusch et al. (2022) Reusch, S., Stein, R., Kowalski, M., et al. 2022, Phys. Rev. Lett., 128, 221101, doi: 10.1103/PhysRevLett.128.221101
- Ritter et al. (2018) Ritter, C., Andrassy, R., Côté, B., et al. 2018, MNRAS, 474, L1, doi: 10.1093/mnrasl/slx126
- Rogers & Nayfonov (2002) Rogers, F. J., & Nayfonov, A. 2002, ApJ, 576, 1064
- Sabhahit et al. (2021) Sabhahit, G. N., Vink, J. S., Higgins, E. R., & Sander, A. A. C. 2021, MNRAS, 506, 4473, doi: 10.1093/mnras/stab1948
- Sallaska et al. (2013) Sallaska, A. L., Iliadis, C., Champange, A. E., et al. 2013, ApJS, 207, 18, doi: 10.1088/0067-0049/207/1/18
- Salpeter (1955) Salpeter, E. E. 1955, Physical Review, 97, 1237, doi: 10.1103/PhysRev.97.1237
- Sandage (1986) Sandage, A. 1986, ARA&A, 24, 421, doi: 10.1146/annurev.aa.24.090186.002225
- Sanyal et al. (2017) Sanyal, D., Langer, N., Szécsi, D., -C Yoon, S., & Grassitelli, L. 2017, A&A, 597, A71, doi: 10.1051/0004-6361/201629612
- Sarajedini (1999) Sarajedini, A. 1999, AJ, 118, 2321, doi: 10.1086/301112
- Saumon et al. (1995) Saumon, D., Chabrier, G., & van Horn, H. M. 1995, ApJS, 99, 713, doi: 10.1086/192204
- Schwarzschild & Härm (1965) Schwarzschild, M., & Härm, R. 1965, ApJ, 142, 855, doi: 10.1086/148358
- Serenelli & Weiss (2005) Serenelli, A., & Weiss, A. 2005, A&A, 442, 1041, doi: 10.1051/0004-6361:20053390
- Serenelli et al. (2017) Serenelli, A., Weiss, A., Cassisi, S., Salaris, M., & Pietrinferni, A. 2017, A&A, 606, A33, doi: 10.1051/0004-6361/201731004
- Serenelli & Fukugita (2005) Serenelli, A. M., & Fukugita, M. 2005, ApJ, 632, L33, doi: 10.1086/497535
- Siess (2007) Siess, L. 2007, A&A, 476, 893, doi: 10.1051/0004-6361:20078132
- Siess (2010) —. 2010, A&A, 512, A10, doi: 10.1051/0004-6361/200913556
- Simpson et al. (2019) Simpson, C., Abe, K., Bronner, C., et al. 2019, ApJ, 885, 133, doi: 10.3847/1538-4357/ab4883
- Stonehill et al. (2004) Stonehill, L. C., Formaggio, J. A., & Robertson, R. G. 2004, Phys. Rev. C, 69, 015801, doi: 10.1103/PhysRevC.69.015801
- Sukhbold & Adams (2020) Sukhbold, T., & Adams, S. 2020, MNRAS, 492, 2578, doi: 10.1093/mnras/staa059
- Sukhbold et al. (2016) Sukhbold, T., Ertl, T., Woosley, S. E., Brown, J. M., & Janka, H. T. 2016, ApJ, 821, 38, doi: 10.3847/0004-637X/821/1/38
- Sukhbold & Woosley (2014) Sukhbold, T., & Woosley, S. E. 2014, ApJ, 783, 10, doi: 10.1088/0004-637X/783/1/10
- Sukhbold et al. (2018) Sukhbold, T., Woosley, S. E., & Heger, A. 2018, ApJ, 860, 93, doi: 10.3847/1538-4357/aac2da
- Suliga (2022) Suliga, A. M. 2022, arXiv e-prints, arXiv:2207.09632. https://arxiv.org/abs/2207.09632
- Takahashi et al. (2023) Takahashi, K., Takiwaki, T., & Yoshida, T. 2023, ApJ, 945, 19, doi: 10.3847/1538-4357/acb8b3
- Tan et al. (2020) Tan, W. P., Boeltzig, A., Dulal, C., et al. 2020, Phys. Rev. Lett., 124, 192702, doi: 10.1103/PhysRevLett.124.192702
- The et al. (2007) The, L.-S., El Eid, M. F., & Meyer, B. S. 2007, ApJ, 655, 1058, doi: 10.1086/509753
- Thomas (1967) Thomas, H.-C. 1967, ZAp, 67, 420
- Timmes et al. (2003) Timmes, F. X., Brown, E. F., & Truran, J. W. 2003, ApJ, 590, L83
- Timmes & Swesty (2000) Timmes, F. X., & Swesty, F. D. 2000, ApJS, 126, 501, doi: 10.1086/313304
- Timmes et al. (2018) Timmes, F. X., Townsend, R. H. D., Bauer, E. B., et al. 2018, ApJ, 867, L30, doi: 10.3847/2041-8213/aae70f
- Timmes et al. (1994) Timmes, F. X., Woosley, S. E., & Taam, R. E. 1994, ApJ, 420, 348
- Timmes et al. (1996) Timmes, F. X., Woosley, S. E., & Weaver, T. A. 1996, ApJ, 457, 834
- Tompkins et al. (2020) Tompkins, S., Windhorst, R., Young, P., & Timmes, F. X. 2020, Research Notes of the American Astronomical Society, 4, 172, doi: 10.3847/2515-5172/abbc0e
- Townsend (2019a) Townsend, R. H. D. 2019a, MESA SDK for Linux, 20190503, Zenodo, doi: 10.5281/zenodo.2669541. https://doi.org/10.5281/zenodo.2669541
- Townsend (2019b) —. 2019b, MESA SDK for Mac OS, 20190503, Zenodo, doi: 10.5281/zenodo.2669543. http://doi.org/10.5281/zenodo.2669543
- Townsley et al. (2009) Townsley, D. M., Jackson, A. P., Calder, A. C., et al. 2009, ApJ, 701, 1582, doi: 10.1088/0004-637X/701/2/1582
- van der Walt et al. (2011) van der Walt, S., Colbert, S. C., & Varoquaux, G. 2011, Computing in Science Engineering, 13, 22, doi: 10.1109/MCSE.2011.37
- van Horn (1971) van Horn, H. M. 1971, in IAU Symposium, Vol. 42, White Dwarfs, ed. W. J. Luyten (Dordrecht: Springer), 97
- Vandenberg (1983) Vandenberg, D. A. 1983, ApJS, 51, 29, doi: 10.1086/190839
- VandenBerg et al. (2022) VandenBerg, D. A., Casagrande, L., & Edvardsson, B. 2022, MNRAS, 509, 4208, doi: 10.1093/mnras/stab2998
- Vartanyan et al. (2018) Vartanyan, D., Burrows, A., Radice, D., Skinner, M. A., & Dolence, J. 2018, MNRAS, 477, 3091, doi: 10.1093/mnras/sty809
- Vila (1966) Vila, S. C. 1966, ApJ, 146, 437, doi: 10.1086/148908
- Vink et al. (2001) Vink, J. S., de Koter, A., & Lamers, H. J. G. L. M. 2001, A&A, 369, 574, doi: 10.1051/0004-6361:20010127
- Vishniac (2023) Vishniac, E. T. 2023, in Bulletin of the American Astronomical Society, Vol. 55, 016
- Vogel & Beacom (1999) Vogel, P., & Beacom, J. F. 1999, Phys. Rev. D, 60, 053003, doi: 10.1103/PhysRevD.60.053003
- Wang & Chen (2021) Wang, S., & Chen, X. 2021, ApJ, 923, 145, doi: 10.3847/1538-4357/ac22a7
- Weaver & Woosley (1993) Weaver, T. A., & Woosley, S. E. 1993, Phys. Rep., 227, 65, doi: 10.1016/0370-1573(93)90058-L
- Weiss et al. (2000) Weiss, A., Cassisi, S., Schlattl, H., & Salaris, M. 2000, ApJ, 533, 413, doi: 10.1086/308661
- Wiescher et al. (2023) Wiescher, M., deBoer, R. J., & Görres, J. 2023, European Physical Journal A, 59, 11, doi: 10.1140/epja/s10050-023-00917-9
- Wiescher et al. (1989) Wiescher, M., Gorres, J., Graff, S., Buchmann, L., & Thielemann, F. K. 1989, ApJ, 343, 352, doi: 10.1086/167709
- Wiescher et al. (2010) Wiescher, M., Görres, J., Uberseder, E., Imbriani, G., & Pignatari, M. 2010, Annual Review of Nuclear and Particle Science, 60, 381, doi: 10.1146/annurev.nucl.012809.104505
- Winter & Lunardini (2022) Winter, W., & Lunardini, C. 2022, arXiv e-prints, arXiv:2205.11538. https://arxiv.org/abs/2205.11538
- Woosley & Heger (2015) Woosley, S. E., & Heger, A. 2015, ApJ, 810, 34, doi: 10.1088/0004-637X/810/1/34
- Woosley et al. (2002) Woosley, S. E., Heger, A., & Weaver, T. A. 2002, Rev. Mod. Phys., 74, 1015, doi: 10.1103/RevModPhys.74.1015
- Woosley & Weaver (1986) Woosley, S. E., & Weaver, T. A. 1986, ARA&A, 24, 205
- Xu & Li (2004) Xu, H. Y., & Li, Y. 2004, A&A, 418, 213, doi: 10.1051/0004-6361:20040024
- Yang & JUNO Collaboration (2022) Yang, Y., & JUNO Collaboration. 2022, Nuclear Instruments and Methods in Physics Research A, 1042, 167435, doi: 10.1016/j.nima.2022.167435
- Young (2018) Young, P. A. 2018, Stellar Composition, Structure and Evolution: Impact on Habitability, ed. H. J. Deeg & J. A. Belmonte (Springer International Publishing), 1–22. https://doi.org/10.1007/978-3-319-30648-3_60-1
- Zhang et al. (2008) Zhang, W., Woosley, S. E., & Heger, A. 2008, ApJ, 679, 639, doi: 10.1086/526404
- Zhao et al. (2023) Zhao, L., Song, H., Meynet, G., et al. 2023, A&A, 674, A92, doi: 10.1051/0004-6361/202245665
- Zickefoose et al. (2018) Zickefoose, J., Di Leva, A., Strieder, F., et al. 2018, Phys. Rev. C, 97, 065806, doi: 10.1103/PhysRevC.97.065806