CAPOS: The bulge Cluster APOgee Survey IV
Elemental Abundances of the bulge globular cluster NGC 6558
Abstract
This study presents the results concerning six red giant stars members of the globular cluster NGC 6558. Our analysis utilized high-resolution near-infrared spectra obtained through the CAPOS initiative (the APOgee Survey of Clusters in the Galactic Bulge), which focuses on surveying clusters within the Galactic Bulge, as a component of the Apache Point Observatory Galactic Evolution Experiment II survey (APOGEE-2). We employ the BACCHUS (Brussels Automatic Code for Characterizing High accUracy Spectra) code to provide line-by-line elemental-abundances for Fe-peak (Fe, Ni), -(O, Mg, Si, Ca, Ti), light-(C, N), odd-Z (Al), and the -process element (Ce) for the 4 stars with high signal-to-noise ratios. This is the first reliable measure of the CNO abundances for NGC 6558. Our analysis yields a mean metallicity for NGC 6558 of [Fe/H] = , with no evidence for a metallicity spread. We find a Solar Ni abundance, [Ni/Fe] 0.01, and a moderate enhancement of -elements, ranging between 0.16 to 0.42, and a slight enhancement of the -process element [Ce/Fe] 0.19. We also found low levels of [Al/Fe], but with a strong enrichment of nitrogen, [N/Fe], along with a low level of carbon, [C/Fe]. This behaviour of Nitrogen-Carbon is a typical chemical signature for the presence of multiple stellar populations in virtually all GCs; this is the first time that it is reported in NGC 6558. We also observed a remarkable consistency in the behaviour of all the chemical species compared to the other CAPOS bulge GCs of the same metallicity.
keywords:
Stars: abundances – Stars: chemically peculiar – Galaxy: globular clusters: individual: NGC 6558 – Techniques: spectroscopic1 Introduction
The Milky Way bulge is a centrally concentrated component that has an associated system of globular clusters (Minniti, 1995). Globular clusters (GCs) in the central region ( 3.5 kpc; Barbuy et al., 2018a, b) of the Galactic Bulge (GB) could contain the oldest stars in the Galaxy. Indeed, the rapid chemical evolution in the deep potential well of the GB means that GCs could be potentially older than their halo cousins, which were born and raised in much less massive satellites (Cescutti, 2008; Barbuy et al., 2018b; Savino et al., 2020; Geisler et al., 2021). Thus, the bulge GCs are an excellent fossil to better understand the assembly of the most ancient part of our Galaxy. They are believed to have developed in situ (Massari et al., 2019), as opposed to the halo GCs, all or mostly of which originated in satellite galaxies that later merged with the proto-Milky Way.
NGC 6558 is an important member of these ancient bulge GCs (BGCs). This cluster presents a post-core collapse structure (Trager et al., 1995), and lies in a relatively clear region inside the bulge (l = 0.20096∘, b = 6.02488∘), with a mean heliocentric distance of 7.47 kpc (Baumgardt & Vasiliev, 2021a; Moreno et al., 2022) and a mean Galactocentric distance of 1.3 kpc. In an early work, Rich et al. (1998) used photometry to identify a strong blue extended horizontal branch in NGC 6558 with a metallicity estimated to lie in the range of 1.6 <[Fe/H]<1.2. Most recently, Cohen et al. (2021) resolved the cluster main-sequence turnoff using the filters F606W and F814W from the Hubble Space Telescope (HST), and determined an age of 12.3 1.1 Gyr. For their part, Barbuy et al. (2007, 2018b) presented for the first time a detailed spectroscopic analysis of five giant stars in NGC 6558 using high-resolution GIRAFFE optical spectra ( 22.000), and four giant stars using very high-resolution FLAMES-UVES spectra ( 45.000). These authors obtained precise abundances of the light elements C, N, O, the odd-Z elements Na, Al, the -elements Mg, Si, Ca, Ti, and the heavy elements Y, Ba, La, and Eu. They derived a mean metallicity of [Fe/H] = 1.17 0.10 for the cluster via UVES spectra, with strong enhancements of 0.40 and 0.33 in the -elements O and Mg, but lower enhancements of 0.11 and 0.07 in Si and Ca, respectively. The Odd-Z element Na showed a Solar value, while Al was slightly enhanced, with [Al/Fe]=0.15, suggesting that these elemental abundances are in good agreement with the typical abundance behaviour found in other old BGCs such as NGC 6522 (Barbuy et al., 2009, 2014; Fernández-Trincado et al., 2019b) and HP 1 (Geisler et al., 2021). On the other hand, the authors also noted a spread in the abundances of Y and Ba, compatible with expectations from massive spinstars (Chiappini et al., 2011; Frischknecht et al., 2016), while the -element Eu is highly enhanced, with [Eu/Fe]=0.6, compatible with production by supernovae type II (SNII) or neutron star mergers (Goriely et al., 2011; Wanajo et al., 2021). Such high values of Eu are usually found in field halo stars, while higher enhancements are typically found in some ultra-faint dwarf galaxies (see, e.g., Ji et al., 2016; Roederer et al., 2016; Hansen et al., 2017; Simon, 2019; Reichert et al., 2020).
Kinematically, Barbuy et al. (2007, 2018b), obtained precise mean radial velocities (RVs) for the cluster of 197.34.0 km s-1 and 194.452.1 km s-1, respectively. With the close proximity of NGC 6558 to the GB, along with its proper motion, Rossi et al. (2015) and Pérez-Villegas et al. (2020) found that NGC 6558 is probably an in situ formed GC, co-rotating with the bar, similar to other GCs they classified. Recent works like Massari et al. (2019) and Malhan et al. (2022) found similar results using the proper motions and parallaxes from the Gaia releases available at that time.
Nowadays, with the high-precision astrometric and photometric data from the latest release of the ESA Gaia mission (Gaia DR3; Gaia Collaboration et al., 2022), along with the photometric depth in both the Two-Micron All Sky Survey (Skrutskie et al., 2006) and the infrared survey VISTA Variables in the Vía Láctea (VVV, Minniti et al., 2010; Saito et al., 2012), as well as the accurate chemical elements provided by the seventeenth data release of the APOGEE-2 survey (Majewski et al., 2017; Abdurro’uf et al., 2022a), there is an unprecedented opportunity to examine in great detail these ancient GCs toward the GB, despite their location within very crowded and highly reddened regions. This is indeed the goal of the CAPOS project (Geisler et al., 2021).
In this paper, we present -band spectroscopy for six members of NGC 6558, using spectra from the bulge Cluster APOgee Survey (CAPOS, Geisler et al., 2021), an internal program of the Apache Point Observatory Galactic Evolution Experimental II survey (APOGEE-2, Majewski et al. 2017) and the Sloan Digital Sky IV survey (Blanton et al., 2017; Ahumada et al., 2020). These spectra make it possible to derive detailed elemental abundances for a large number of giant stars, as well as to achieve RVs with precision better than 1 km s-1.
This paper is organized as follows: Section 2 and 3 present an overview of the CAPOS data analysed toward the NGC 6558 field, while Section 4 describes the adopted atmospheric parameters employed to determine the elemental abundances. The resulting elemental abundances obtained with the BACCHUS code are described in Section 5. We discuss our results and compare them with previous literature in Section 6. Our conclusions are presented in Section 7.
| APOGEE ID | G | BP | RP | J | H | Ks | RV | S/N | APOGEE-2 | ||
| (mas yr-1) | (mas yr-1) | (km s-1) | (pixel-1) | programs | |||||||
| High S/N | |||||||||||
| 2M181013543146216 | 14.15 | 14.98 | 13.22 | 11.87 | 11.11 | 10.94 | 191.7 | 160 | geisler_19b | ||
| AP181023423146515 | 14.41 | 15.22 | 13.48 | 12.16 | 11.41 | 11.26 | 193.26 | 130 | geisler_19b | ||
| 2M181011173144580 | 13.90 | 14.53 | 12.80 | 11.60 | 10.81 | 10.61 | 194.13 | 103 | geisler_19b | ||
| 2M181017683145246 | 15.10 | 15.75 | 14.13 | 12.97 | 12.31 | 12.18 | 190.64 | 80 | geisler_19b | ||
| Low S/N | |||||||||||
| 2M181022233145435 | 15.38 | 16.11 | 14.52 | 13.28 | 12.59 | 12.47 | 193.44 | 46 | geisler_19b | ||
| 2M181016233145423 | 15.98 | 16.30 | 15.18 | 14.51 | 14.13 | 14.03 | 10 | kollmeier_17a |
2 Observations and Data
The second phase of the Apache Point Observatory Galactic Evolution Experiment (APOGEE-2; Majewski et al., 2017) is a high-resolution () near-infrared (NIR) spectroscopic survey containing observations of unique stars released as part of the SDSS-IV survey (Blanton et al., 2017), targeting these objects with selections detailed in Zasowski et al. (2013), Zasowski et al. (2017), Beaton et al. (2021), and Santana et al. (2021). These papers additionally provide an extensive explanation of the targeting approach employed in the APOGEE-2 survey. The spectra were obtained using the cryogenic, multi-fiber (300) APOGEE spectrograph (Wilson et al., 2019), mounted on the 2.5m SDSS telescope (Gunn et al., 2006) at Apache Point Observatory, to observe the Northern Hemisphere (APOGEE-2N), and expanded to include a second APOGEE spectrograph on the 2.5m Irénée du Pont telescope (Bowen & Vaughan, 1973) at Las Campanas Observatory to observe the Southern Hemisphere (APOGEE-2S). Each instrument registers the H-band in wavelengths between the Å and Å, utilizing three detectors. There are small gaps in coverage between them of about 100 Å around 15800 Å and 16400 Å , respectively. Additionally, each fiber provides an on-sky field of view with an diameter of 2 in the Northern instrument and 13 in the Southern instrument.
The final version of the APOGEE-2 catalog was published in December 2021 as part of the 17th data release of the Sloan Digital Sky Survey (DR17; Abdurro’uf et al., 2022b) and is available publicly online through the SDSS Science Archive Server and Catalog Archive Server111SDSS DR17 data: https://www.sdss4.org/dr17/irspec/spectro_data/. The spectra were reduced following the procedures extensively described in Nidever et al. (2015). For detailed information, we refer the interested reader to that reference. The stellar parameters and chemical abundances in APOGEE-2 were derived within the APOGEE Stellar Parameters and Chemical Abundances Pipeline (ASPCAP; García Pérez et al., 2016). ASPCAP derives stellar-atmospheric parameters, radial velocities, and as many as 20 individual elemental abundances for each APOGEE-2 spectrum by comparing each to a multidimensional grid of theoretical MARCS model atmospheres grid (Zamora et al., 2015), employing a minimization routine with the code FERRE (Allende Prieto et al., 2006) to derive the best-fit parameters for each spectrum.
The accuracy and precision of the atmospheric parameters and chemical abundances are extensively analysed in Holtzman et al. (2018), Jönsson et al. (2018), and Jönsson et al. (2020), while details regarding the customized H-band line list are fully described in Shetrone et al. (2015), Hasselquist et al. (2016), Cunha et al. (2017), and Smith et al. (2021).
3 NGC 6558
NGC 6558 was observed as part of the Contributed APOGEE-2S CNTAC222CNTAC: Chilean Telescope Allocation Committee CN2019B program (P.I: Doug Geisler; geisler_19b) during July 9–10, 2019, as part of the CAPOS survey (Geisler et al., 2021).
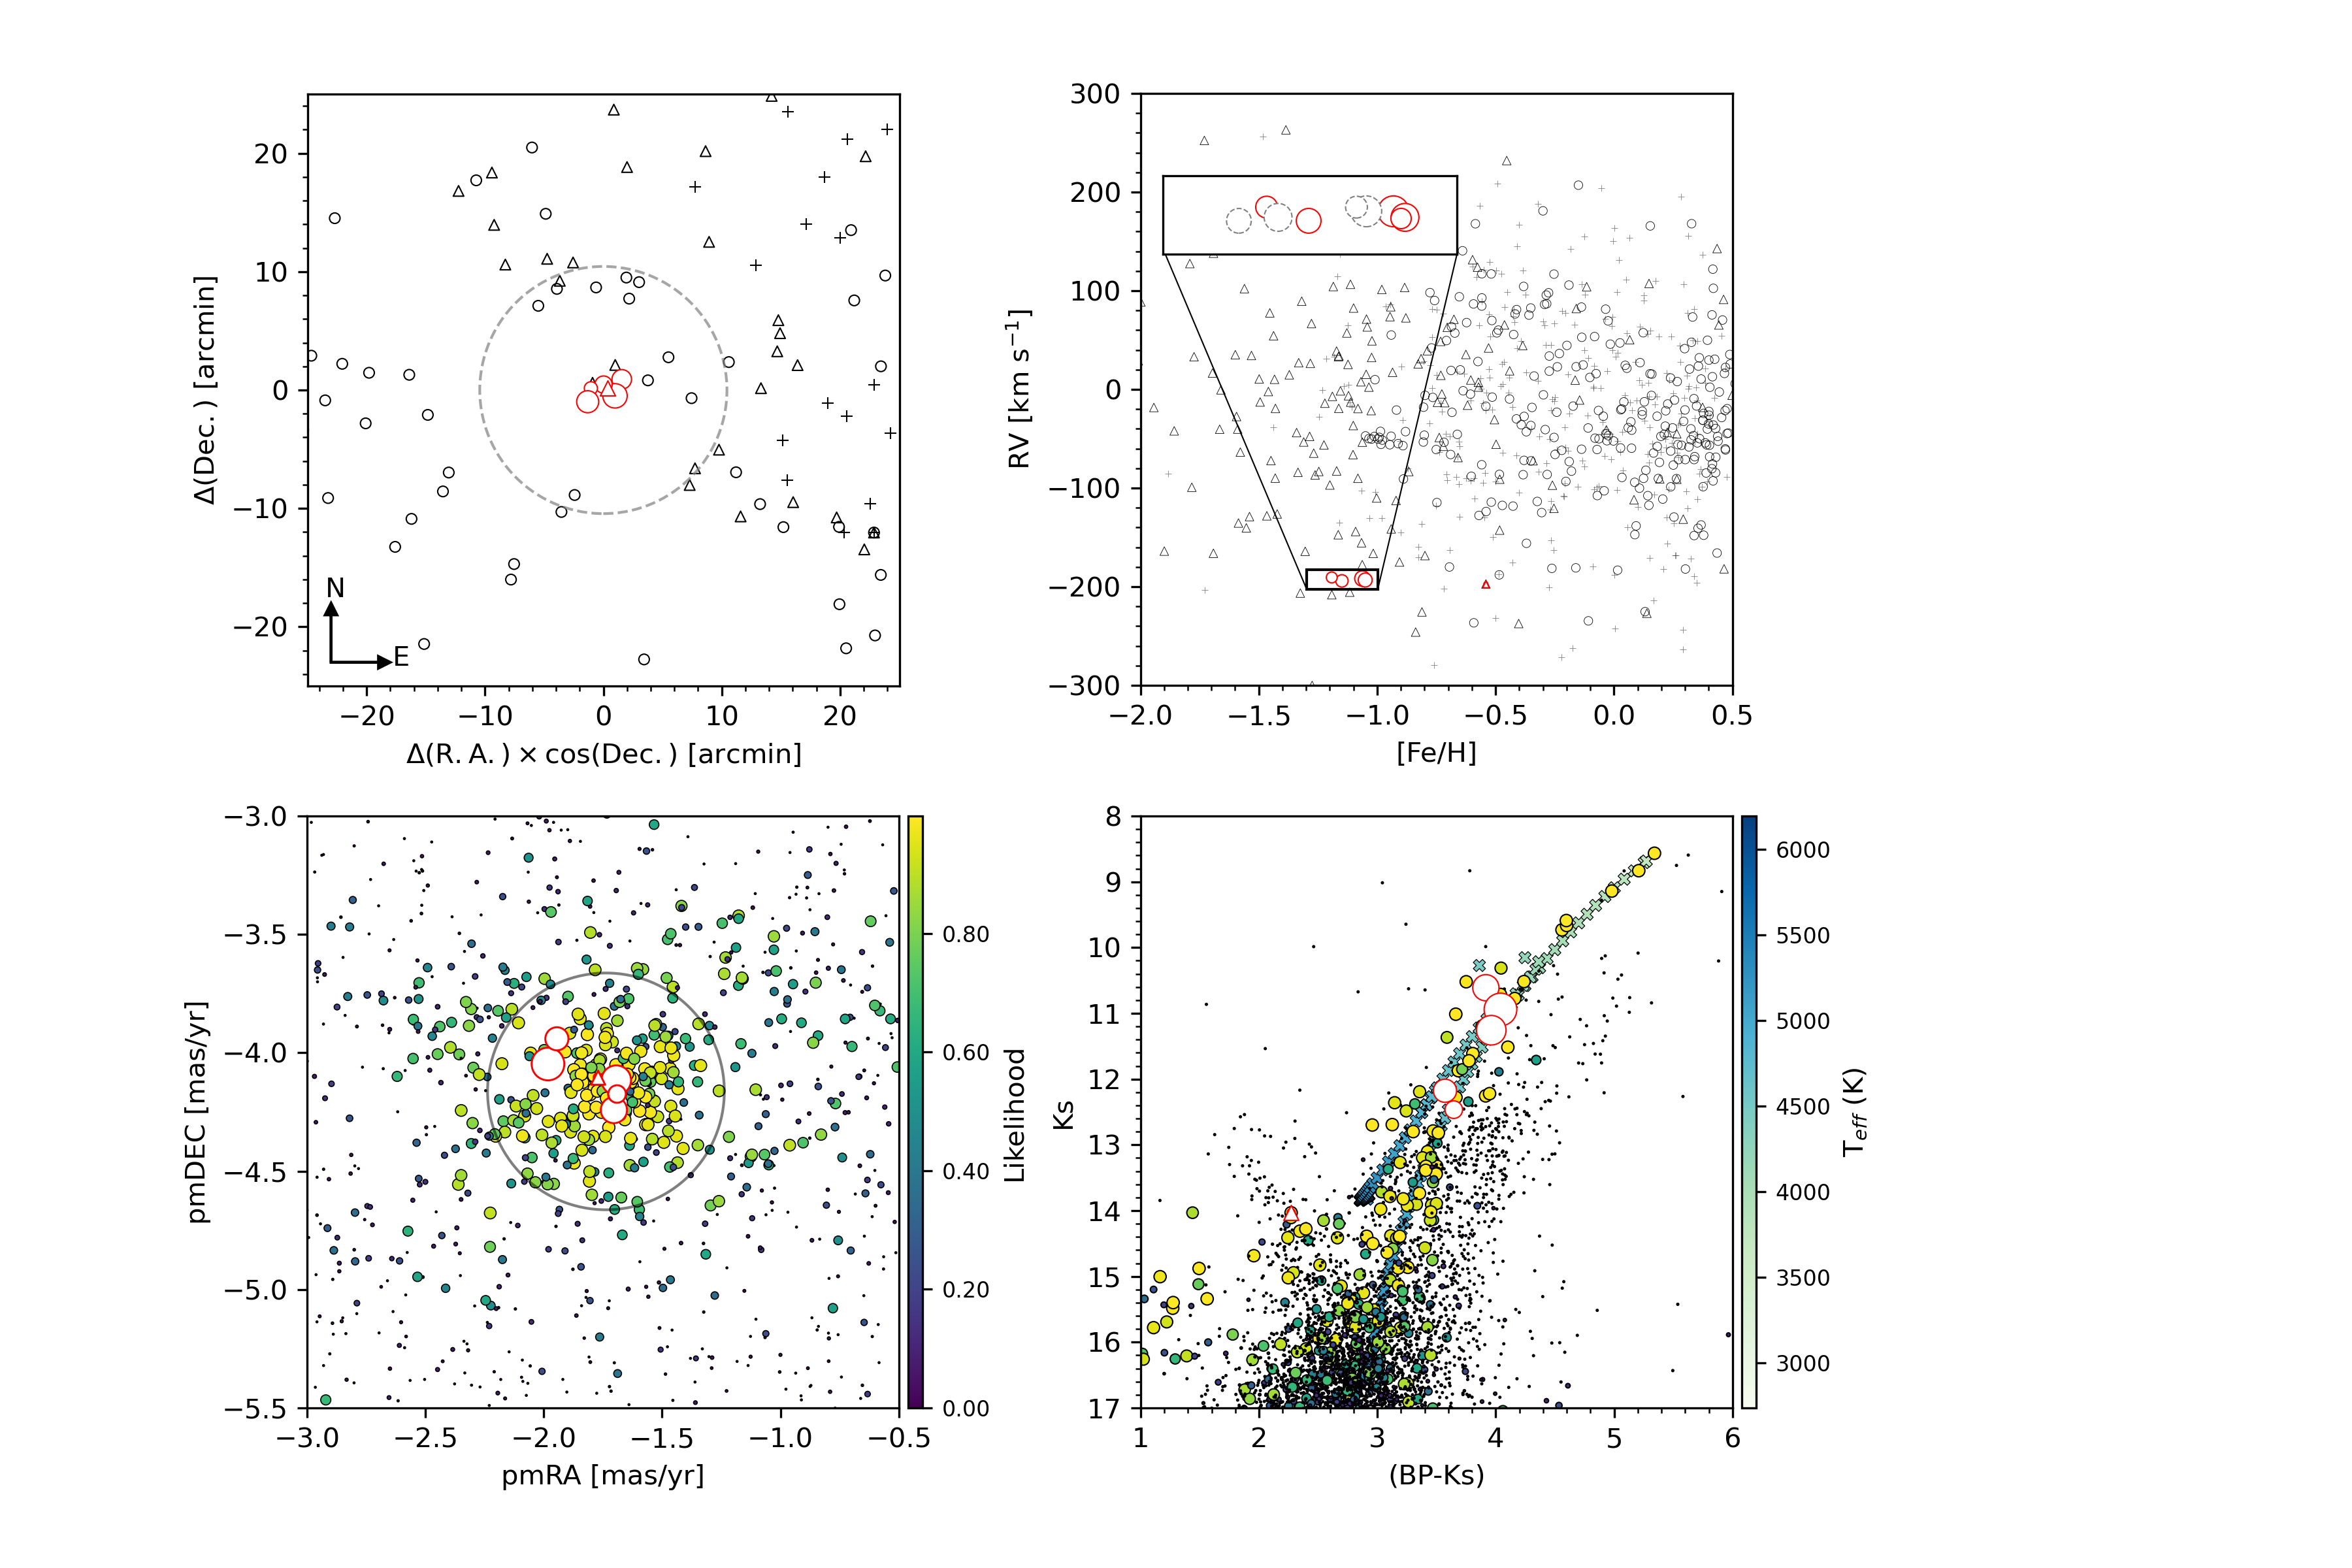
Fig. 1 shows the spatial distribution of the stars toward the NGC 6558 field in the APOGEE-2S footprint (top-left panel), together with the six identified cluster members listed in this work. The main APOGEE-2S plug-plate containing the NGC 6558 cluster (toward 18h10m18.38s and = 31d45m48.6s) was centered on (l,b) (0.0, 0.6) degrees, and 15 out of 550 science fibers were located inside the cluster tidal radius (r ; Harris, 1996, 2010, dashed circumference in Fig. 1).
CAPOS targets were originally selected on the basis of Gaia DR2 (Gaia Collaboration et al., 2018) to have proper motions (PMs) within an approximate radius of 0.5 mas yr-1 around the nominal PMs of NGC 6558; () and (see, e.g. Baumgardt & Vasiliev, 2021b). We initially selected these values to estimate candidate members from the PMs to reduce the potential field star contamination in both optical and NIR color-magnitude diagrams (CMDs). We re-examined the PMs from the original sample, but we did not find important differences between Gaia DR2 (Gaia Collaboration et al., 2018) and Gaia DR3 PMs (Gaia Collaboration et al., 2022) toward NGC 6558. The left-bottom panel in Fig. 1 shows the updated version of the PMs using Gaia DR3Gaia (Gaia Collaboration et al., 2022). Besides PMs, the selected stars are distributed along both the red giant branch (RGB) and the asymptotic giant branch (AGB) of the cluster, as illustrated in the bottom-right panel of Fig. 1.
Our target stars not only lie inside the tidal radius of the cluster, but also share similar PMs, follow the same evolutionary track in the opticalNIR CMDs, and share similar radial velocity (RV) and metallicity ([Fe/H], top-right panel), which confirm that the 5 CAPOS stars (the red open circles) are very likely cluster members. Both the RV and [Fe/H] were extracted from the spectra reduced with the ASPCAP pipeline, and these values in the metallicity were used only for the member selection. In fact, Fernández-Trincado et al. (2020b) shows that there is usually an offset of 0.2 dex on average between the abundances measured with ASPCAP pipeline with respect to the BACCHUS code in most of the chemical species. The methodology followed to determine the final values of the abundances is described in detail in Sections 4 and 5. In this sense, the zoomed black box rectangle in the top-right panel of the Fig. 1 shows the revised Fe abundances as black dashed open circles, together with the ASPCAP values (red open circles). The APOGEE-2 designations of the stars, the coordinates, Gaia DR3 and VVV magnitudes, RV, and S/N are listed in Table 1.
Additionally, we also examined two overlapping APOGEE-2S plug-plates toward NGC 6558, which contain the APOGEE-2S programs: kollmeier_17a (238 science fibers) and apogee (332 science fibers). We refer the interested reader to Santana et al. (2021) for further details on these programs.
From kollmeier_17a, we have identified one star (2M181016233145423) satisfying almost all the cluster membership criteria imposed in this work. However, this star is only recorded in Table 1 together with the APOGEE-2 RV, Gaia DR3 astrometry, and photometry information because its spectral S/N is too low () to obtain reliable elemental abundances. This star is positioned along the cluster CMD’s horizontal branch (HB), and is likely associated with the RR Lyrae population of NGC 6558.
Finally, we imposed a quality cut in the APOGEE-2 spectra using an S/N threshold 70 per pixel to ensure the analysis of good-quality spectra and maximize the precision of the stellar abundances. Thus, elemental abundances are restricted to the 4 stars with high S/N listed in Table 1.
| APOGEE ID | Teff | g | |
|---|---|---|---|
| (K) | (c.g.s) | (km s-1) | |
| 2M181013543146216 | 4319 | 1.3 | 1.61 |
| AP181023423146515 | 4305 | 1.4 | 1.48 |
| 2M181011173144580 | 4381 | 1.1 | 1.80 |
| 2M181017683145246 | 4729 | 1.8 | 1.61 |
| ID | [C/Fe] | [N/Fe] | [O/Fe] | [Mg/Fe] | [Al/Fe] | [Si/Fe] | [Ca/Fe] | [Ti/Fe] | [Fe/H] | [Ni/Fe] | [Ce/Fe] |
|---|---|---|---|---|---|---|---|---|---|---|---|
| 2M181013543146216 | 0.42 | 1.31 | 0.36 | 0.24 | 0.05 | 0.21 | 0.31 | 0.16 | 1.09 | 0.07 | 0.18 |
| AP181023423146515 | 0.40 | 1.13 | 0.29 | 0.23 | 0.29 | 0.22 | 0.35 | 0.20 | 1.18 | 0.10 | 0.13 |
| 2M181011173144580 | 0.12 | 0.99 | 0.37 | 0.22 | 0.04 | 0.27 | 0.28 | 0.13 | 1.22 | 0.14 | 0.25 |
| 2M181017683145246 | … | … | 0.63 | 0.22 | 0.08 | 0.25 | 0.30 | 0.14 | 1.10 | 0.08 | … |
| … | … | (0.62) | (0.40) | (0.05) | (0.19) | (0.16) | (0.16) | (1.10) | … | … | |
| Mean | 0.31 | 1.14 | 0.41 | 0.23 | 0.09 | 0.24 | 0.31 | 0.16 | 1.15 | 0.01 | 0.19 |
4 Atmospheric Parameters
The atmospheric parameters (Teff and ) were derived using the same methodology as described in Fernández-Trincado et al. (2022a), that is, the vs. CMD shown in Fig. 1 (bottom-right panel) was reddening corrected by using giant stars and adopting the reddening law of Cardelli et al. (1989) and O’Donnell (1994) and a total-to-selective absorption ratio RV 3.1 (see, Barbuy et al., 2018b; Cohen et al., 2021).
We chose the RGB stars located within a 10 radius from the cluster, ensuring that their proper motions closely matched those of NGC 6558 within a margin of 0.5 mas yr-1. Subsequently, following the reddening slope, we proceeded to determine the separation between these selected stars and a previously defined reference line, which outlines the RGB. The vertical and horizontal separation yields the differential absorption A and reddening E(BP Ks) values of each individual star, respectively. Our next step involved the selection of the three closest RGB stars within the field to calculate the average absorption and reddening values. We then corrected the Ks magnitude and BP Ks colour index based on these averages, respectively. The selection of this number of stars represents an arbitrary decision aimed at minimizing the impact of photometric random errors while maximizing spatial resolution to the greatest extent possible. After these corrections the photometric and g were determined by fitting a PARSEC isochrone (Bressan et al., 2012), chosen to have an age of 12.3 Gyr (Cohen et al., 2021), and an overall metallicity of [M/H]=0.90 (this work), and assumed and g to be the effective temperature and gravity at the point of the isochrones that has the same Ks magnitude as the star. Finally, microturbulence velocities were determined using the relation from Gratton et al. (1996). Table 2 lists the determined photometric atmospheric parameters, microturbulence velocity, and S/N for the four stars in our sample for which elemental abundances are provided in this study.
| Abundance | Mean | ()1/2 | |||
|---|---|---|---|---|---|
| (K) | (dex) | (km s-1) | (dex) | (dex) | |
| 2M181013543146216 | |||||
| [C/Fe] | 0.08 | 0.07 | 0.02 | 0.07 | 0.13 |
| [N/Fe] | 0.14 | 0.03 | 0.01 | 0.07 | 0.16 |
| [O/Fe] | 0.17 | 0.04 | 0.01 | 0.06 | 0.18 |
| [Mg/Fe] | 0.04 | 0.02 | 0.01 | 0.11 | 0.12 |
| [Al/Fe] | 0.09 | 0.01 | 0.01 | 0.07 | 0.12 |
| [Si/Fe] | 0.01 | 0.04 | 0.02 | 0.05 | 0.07 |
| [Ca/Fe] | 0.03 | 0.04 | 0.01 | 0.05 | 0.07 |
| [Ti/Fe] | 0.12 | 0.01 | 0.00 | 0.07 | 0.14 |
| [Fe/H] | 0.05 | 0.03 | 0.01 | 0.06 | 0.08 |
| [Ni/Fe] | 0.01 | 0.01 | 0.00 | 0.06 | 0.06 |
| AP181023423146515 | |||||
| [C/Fe] | 0.06 | 0.07 | 0.00 | 0.10 | 0.13 |
| [N/Fe] | 0.15 | 0.07 | 0.00 | 0.07 | 0.18 |
| [O/Fe] | 0.15 | 0.03 | 0.00 | 0.07 | 0.17 |
| [Mg/Fe] | 0.01 | 0.02 | 0.00 | 0.13 | 0.13 |
| [Al/Fe] | 0.04 | 0.01 | 0.00 | 0.08 | 0.09 |
| [Si/Fe] | 0.02 | 0.03 | 0.01 | 0.07 | 0.07 |
| [Ca/Fe] | 0.03 | 0.04 | 0.01 | 0.05 | 0.07 |
| [Ti/Fe] | 0.12 | 0.02 | 0.00 | 0.08 | 0.14 |
| [Fe/H] | 0.03 | 0.03 | 0.00 | 0.07 | 0.08 |
| [Ni/Fe] | 0.05 | 0.06 | 0.00 | 0.05 | 0.09 |
| 2M181011173144580 | |||||
| [C/Fe] | 0.03 | 0.06 | 0.02 | 0.07 | 0.10 |
| [N/Fe] | 0.11 | 0.02 | 0.00 | 0.07 | 0.13 |
| [O/Fe] | 0.19 | 0.02 | 0.01 | 0.06 | 0.19 |
| [Mg/Fe] | 0.03 | 0.01 | 0.00 | 0.11 | 0.12 |
| [Al/Fe] | 0.07 | 0.02 | 0.00 | 0.07 | 0.10 |
| [Si/Fe] | 0.02 | 0.05 | 0.01 | 0.05 | 0.07 |
| [Ca/Fe] | 0.03 | 0.04 | 0.00 | 0.05 | 0.08 |
| [Ti/Fe] | 0.13 | 0.02 | 0.00 | 0.07 | 0.15 |
| [Fe/H] | 0.05 | 0.04 | 0.00 | 0.06 | 0.08 |
| [Ni/Fe] | 0.00 | 0.01 | 0.00 | 0.06 | 0.06 |
| 2M181017683145246 | |||||
| [C/Fe] | … | … | … | … | … |
| [N/Fe] | … | … | … | … | … |
| [O/Fe] | 0.17 | 0.07 | 0.01 | 0.06 | 0.19 |
| [Mg/Fe] | 0.01 | 0.05 | 0.01 | 0.11 | 0.12 |
| [Al/Fe] | 0.02 | 0.02 | 0.00 | 0.07 | 0.08 |
| [Si/Fe] | 0.04 | 0.03 | 0.01 | 0.05 | 0.07 |
| [Ca/Fe] | 0.02 | 0.04 | 0.01 | 0.06 | 0.08 |
| [Ti/Fe] | 0.10 | 0.02 | 0.00 | 0.09 | 0.13 |
| [Fe/H] | 0.04 | 0.04 | 0.01 | 0.06 | 0.08 |
| [Ni/Fe] | 0.01 | 0.03 | 0.01 | 0.06 | 0.07 |
5 Elemental Abundances
Elemental abundances were derived from a local thermodynamic equilibrium (LTE) analysis for the four stars listed in Table 2 using the Brussels Automatic Code for Characterizing High accuracy Spectra (Masseron et al., 2016), which relies on the radiative code Turbospectrum (Alvarez & Plez, 1998; Plez, 2012) and the MARCS model atmosphere grid Gustafsson et al. (2008). With the atmospheric parameters determined in Section 4, the first step consisted in determining the metallicity ([Fe/H]) from selected Fe I lines and broadening parameters.
With the [Fe/H] and main atmospheric parameters fixed, we then computed the elemental abundance of each chemical species following the same methodology as described in Fernández-Trincado et al. (2020c), Fernández-Trincado et al. (2021b), Fernández-Trincado et al. (2021c), and Fernández-Trincado et al. (2022a), and summarized here for guidance. We performed a synthesis using the full set of atomic line lists described in Smith et al. (2021), which is used to fit the local continuum. Subsequently, the cosmic rays and the telluric lines are removed, and the local S/N is estimated. After that, we follow the description given in Hawkins et al. (2016). We used four different abundance determination methods, namely, line-profile fitting, core line-intensity comparison, global goodness-of-fit estimate, and an equivalent-width comparison. For each method, we used a set of synthetic spectra of different abundances to compute the observed abundance. Only the lines with the best fit of the individual abundances are kept. We chose the diagnostic for abundance determination due to its reliability. Nevertheless, we preserved data from the other diagnostic methods, including the standard deviation obtained from all four approaches to estimate the uncertainties.
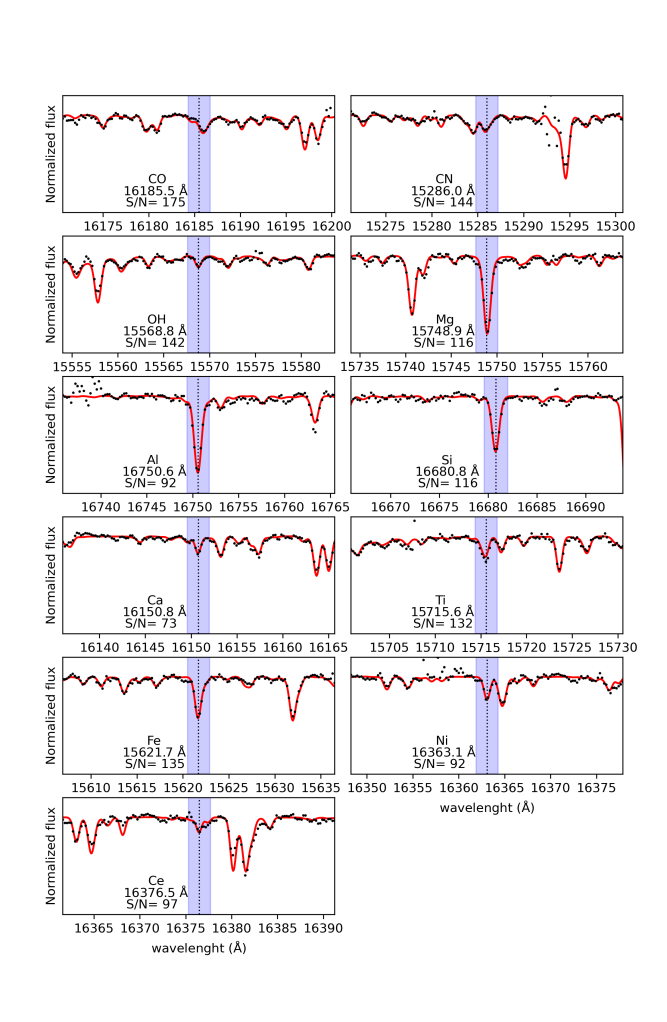
To determine the C, N, and O elemental abundances, a mix of heavily CN-cycled and poor MARCS models were used, as well as the same molecular lines adopted by Smith et al. (2021). The oxygen abundances are first estimated from the hydroxide molecular lines (16OH). With this abundance known, we derived the carbon abundances from the carbon monoxide molecular lines (12C16O), and finally, the nitrogen abundances are obtained from the cyanogen molecular lines (12C14N). This process is repeated multiple times to eliminate any dependence on OH, CO, and CN lines.
An illustration of the quality of the model fit obtained in this study is presented in Fig. 2, where we show the observed (black dotted line) and synthetic (red line) spectra for the APOGEE-2 region around selected atomic and molecular lines obtained for our target giant star AP181023423146515.
Eleven chemical species were investigated for NGC 6558 from the APOGEE-2 spectra, including the Fe-peak (Fe, Ni), (O, Mg, Si, Ca, Ti), light- (C, N), odd-Z (Al), and the -process element (Ce). Our study provides a number of elements in common with optical studies carried out by Barbuy et al. (2007) and Barbuy et al. (2018b), as well as complementary elements not previously examined. The resulting abundance derivations are listed in Table 3.
Uncertainties in spectroscopic parameters are listed in Table 4 for our four cluster stars. The reported uncertainties were obtained by once again calculating the abundances by varying one by one the mean value of the effective temperature, surface gravity, and microturbulence velocity by T K, g dex, km s-1, respectively. These values represent the usual uncertainties for the stellar parameters in GCs (see, e.g., Barbuy et al., 2018b; Fernández-Trincado et al., 2019b). The final uncertainty of each chemical abundance is the quadratic sum of the individual uncertainties: ; where is the standard deviation of the abundances computed for each line of a given element. Table 4 also shows the characteristic uncertainties for each abundance due to variations in the stellar parameters.
We derived a mean spectroscopic metallicity [Fe/H] = for NGC 6558, only 0.02 dex above of the results from Barbuy et al. (2018b) ([Fe/H] = ), who used UVES spectra. These authors investigated a star in common with our data set, namely, the star 2M181017683145246, with [Fe/H] = 1.15 computed from both Fe I and Fe II lines. This value differs by 0.05 dex from ours (see Table 3). Barbuy et al. (2018b) adopted a Solar iron abundance of (Fe)⊙ = 7.50 from Grevesse & Sauval (1998) for computing [X/Fe] abundances, in contrast to our study, which adopted that from Asplund et al. (2005), (Fe)⊙= 7.45. In order to analyse the entire set of data available for NGC 6558, we re-calibrated the values of those authors to be at the same relative Solar iron abundances as this work. Re-calibrated values to Asplund’s Solar abundances for the star in common with Barbuy et al. (2018b) are listed in parentheses in Table 3. In this way, the star in common now shows the same Fe abundance, and a mean value for GC NGC 6558 of [Fe/H] = 1.12 was obtained from Barbuy et al. (2018b). This value is in excellent agreement with our work.
We report for the first time for NGC 6558 abundances in the iron-peak nickel (Ni) and the -process element cerium (Ce). The former shows an average abundance essentially Solar [Ni/Fe] = 0.01, and even deficient in two stars, with a clear separation of 0.2 dex, which is greater than their individual errors. The latter shows an average abundance slightly super-Solar, [Ce/Fe] = 0.19.
We also found strong enrichment for nitrogen, [N/Fe] 1.14, well above typical Galactic field star levels (see, e.g., Fernández-Trincado et al., 2022c) for the 3 stars for which the spectra allowed us to measure CNO abundances, as well as carbon-deficient levels of [C/Fe] = 0.31. These high values for N agree with the average value of [N/Fe] = 1.01 reported by Ernandes et al. (2018), who analysed the same sample of stars as in Barbuy et al. (2018b), but it strongly disagrees with their average value for carbon, [C/Fe] = 0.23, which is 0.54 dex greater than our measures when their values are re-calibrated to Asplund et al. (2005). Although our data use the -band, where molecular lines permit us to achieve what we believe to be a more accurate determination of C, N, and O together, both the C and N are affected not only by stellar evolution but also by multiple populations. We did not obtain reliable measurements for C and N for our star in common, so a good agreement between the two samples is not necessarily expected.
The star 2M181017683145246 exhibits clear differences, about 0.18 dex lower in our measurement for [Mg/Fe] with respect to Barbuy et al. (2018b), and 0.14 dex higher in [Ca/Fe], which fall outside our error bars, in contrast with the much smaller differences of only 0.01 and 0.03 dex for [O/Fe] and [Al/Fe] abundances, respectively, which together with Si and Ti are in agreement within the error bars.
We found an average enhancement for the -element [O/Fe] of 0.41, and very similar but lower values for the -elements [Mg/Fe], [Si/Fe], and [Ca/Fe] of 0.23, 0.24, and 0.31 respectively. The O and Mg are thought to be produced in the hydrostatic phases of massive stars, while Si and Ca are formed in a SN type II (Heger et al., 2003; Janka, 2012). In comparison, Barbuy et al. (2018b) found high [O/Fe] and [Mg/Fe], but lower [Ca/Fe], [Si/Fe] and [Ti/Fe].
| Cluster | [C/Fe] | [N/Fe] | [O/Fe] | [Mg/Fe] | [Al/Fe] | [Si/Fe] | [Ca/Fe] | [Fe/H] | [Ce/Fe] |
|---|---|---|---|---|---|---|---|---|---|
| NGC 6558 | 0.31 | 1.14 | 0.41 | 0.23 | 0.09 | 0.24 | 0.31 | 1.15 | 0.19 |
| NGC 6522 | 0.34 | 1.19 | 0.33 | 0.13 | 0.57 | 0.30 | — | 1.04 | 0.16 |
| Djorg 2 | 0.27 | 0.94 | 0.43 | 0.27 | 0.17 | 0.26 | 0.26 | 1.13 | 0.13 |
| HP 1 | 0.37 | 1.11 | 0.36 | 0.17 | 0.27 | 0.25 | 0.22 | 1.19 | 0.11 |
| NGC 6540 | 0.28 | 1.03 | 0.34 | 0.19 | 0.14 | 0.24 | 0.26 | 1.06 | 0.05 |
| NGC 6642 | 0.14 | 0.78 | 0.45 | 0.28 | 0.16 | 0.32 | 0.25 | 1.13 | 0.17 |
6 Discussion
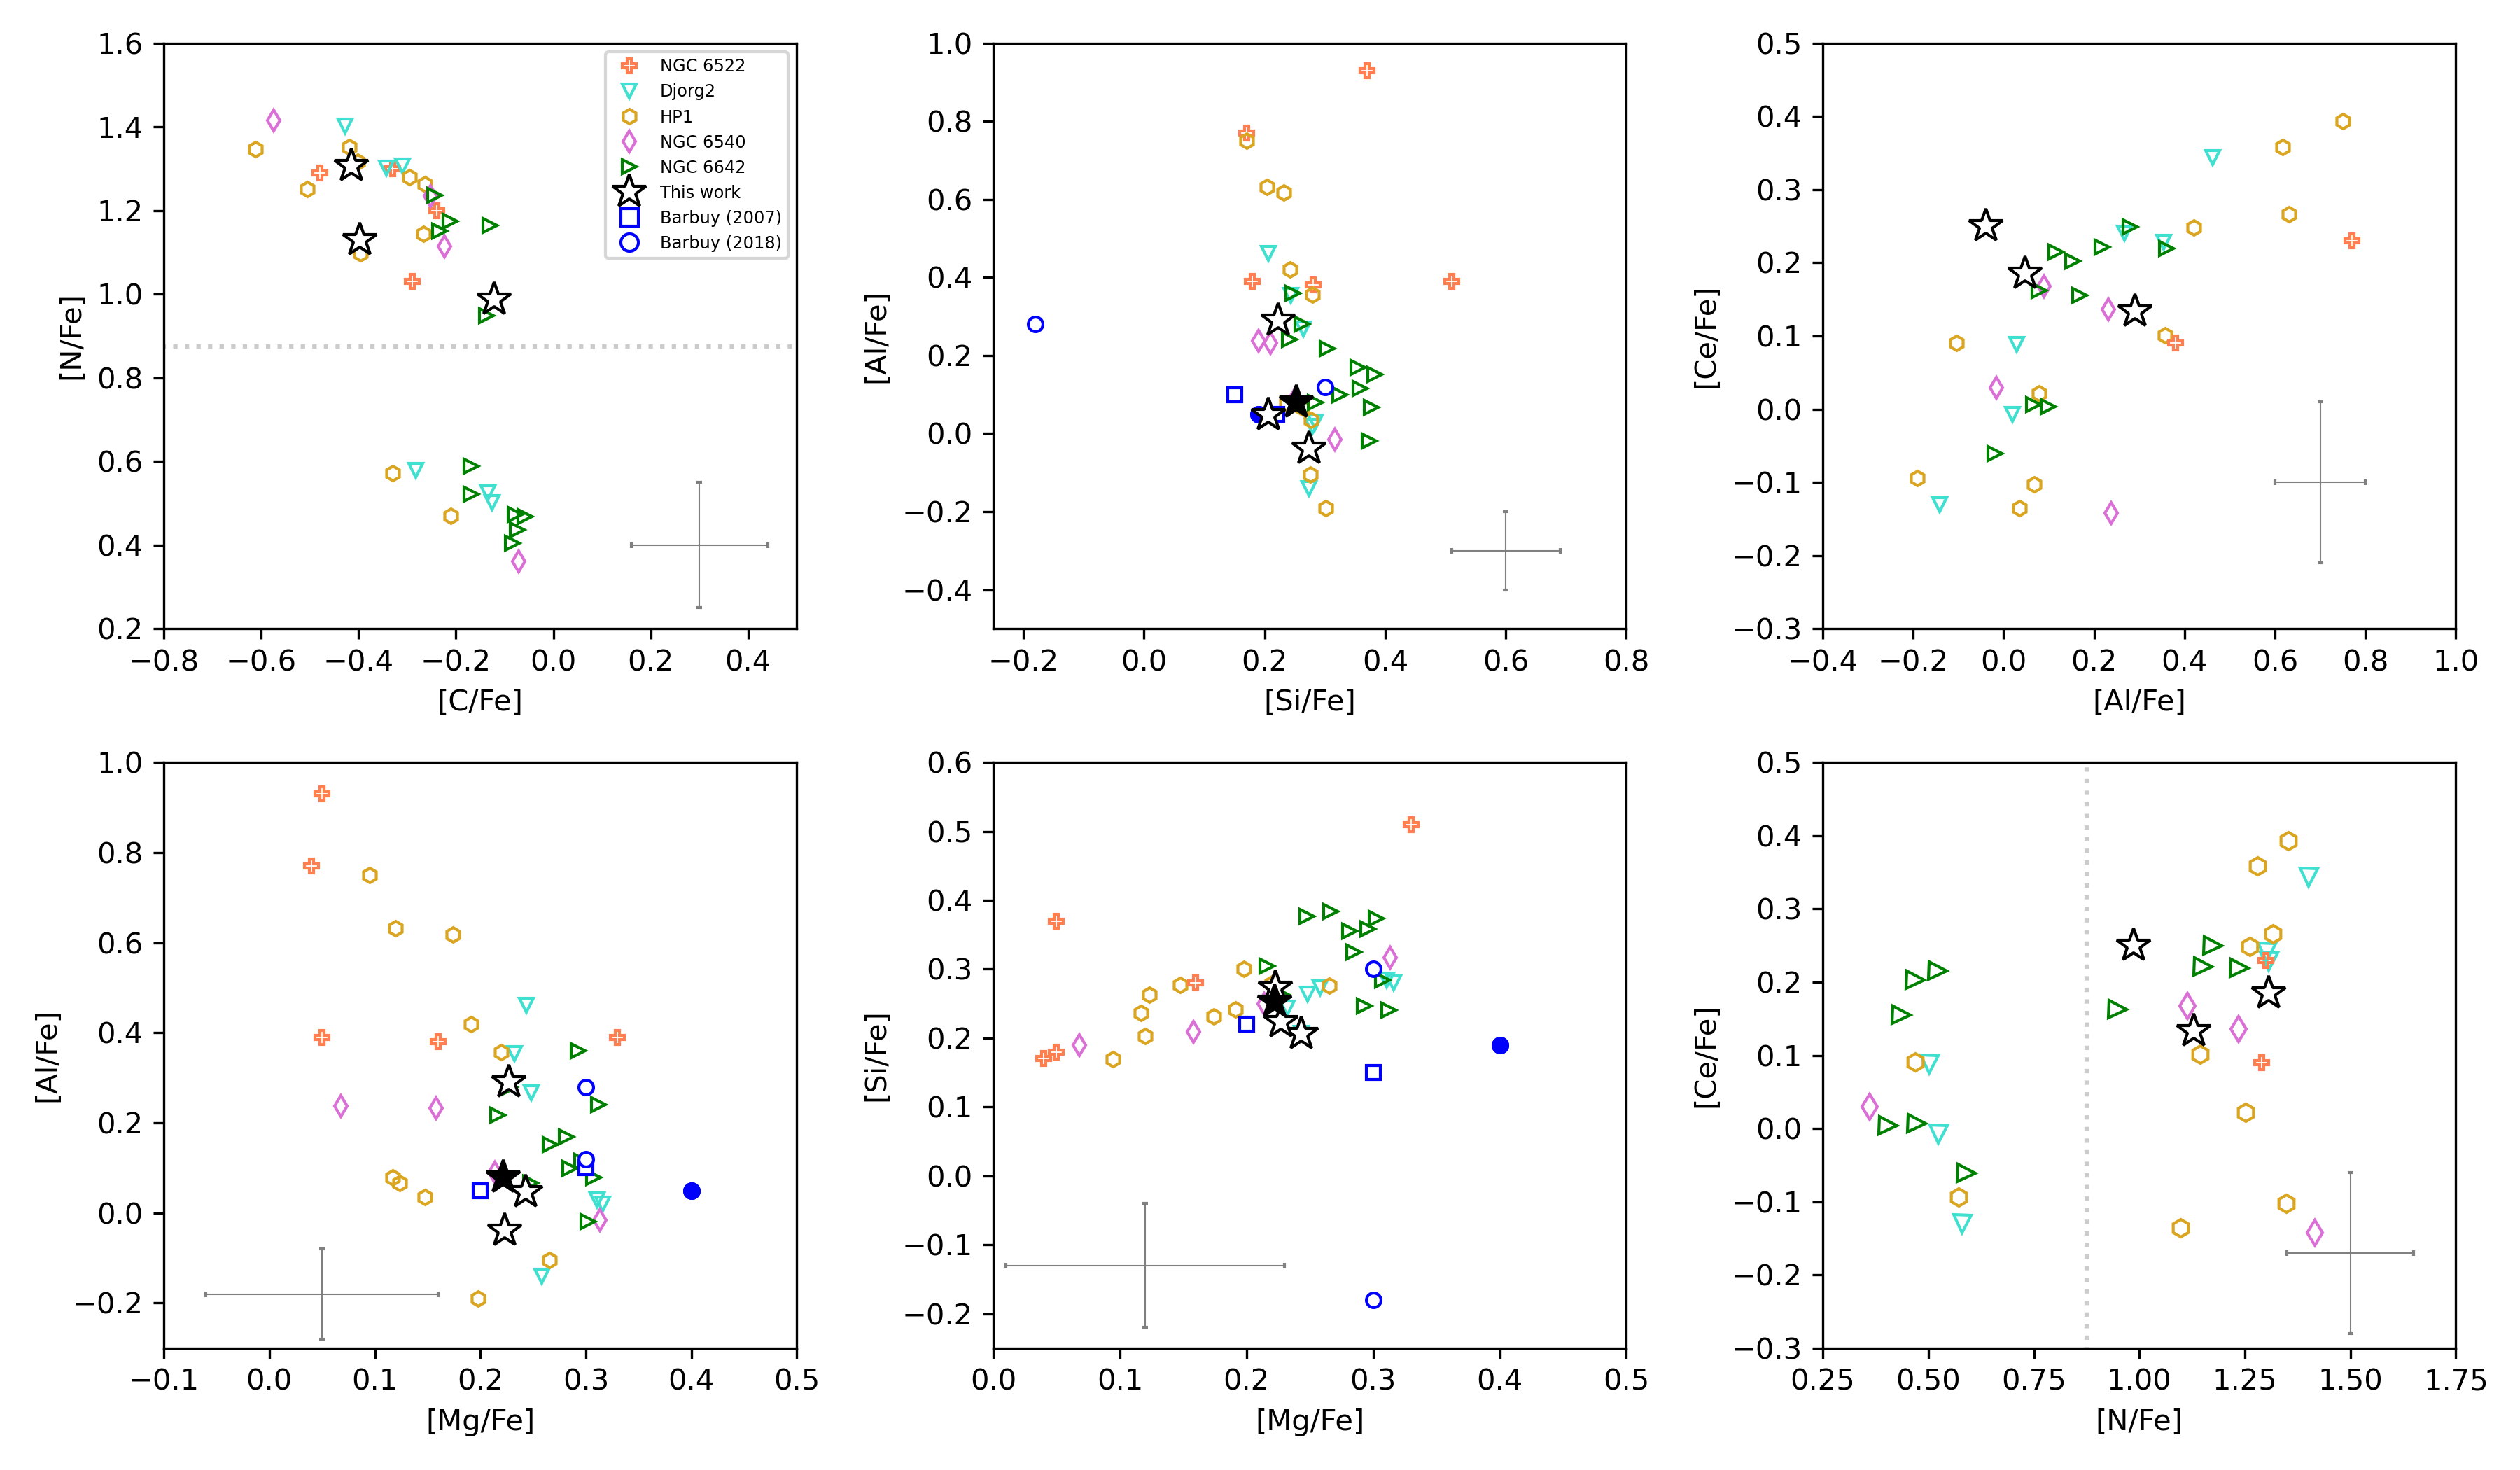
Fig. 3 plots [N/Fe] vs [C/Fe], [Al/Fe] vs [Si/Fe], [Ce/Fe] vs [Al/Fe], [Al/Fe] vs [Mg/Fe], [Si/Fe] vs [Mg/Fe], and [Ce/Fe] vs [N/Fe] diagrams for the sample stars, in order to check the expected anti-correlations for N-C and Al-Mg, correlations for Al-Si and Si-Mg (Carretta et al., 2009; Renzini et al., 2015; Mészáros et al., 2020), and potential correlations for Ce-Al and Ce-N (see, e.g., Fernández-Trincado et al., 2021d, 2022b). We also show the re-calibrated abundances for 2 stars from Barbuy et al. (2007) and 4 stars from Barbuy et al. (2018b) (open squares and circles, respectively). Our star in common with Barbuy et al. (2018b) (filled circle) is depicted as a filled star symbol. The results appear to be consistent with each other, except for one star from Barbuy et al. (2018b) in the Mg and Si abundances relative to Fe, which shows an evident shift in the Al-Si, Al-Mg, and Si-Mg diagrams. Despite the relatively few stars in our sample, anti-correlations for NGC 6558 might be present in the N-C, but the anti-correlations in Al-Mg, as well as the correlations in the Al-Si, Si-Mg, and Ce-N diagrams, are not clear. On the other hand, a weak anti-correlation between Ce and Al could be present, but the sample is too small to be definitive.
Fig. 3 also displays stars of the GCs NGC 6522, from (Fernández-Trincado et al., 2019c), as well as the CAPOS clusters Djorg 2, HP 1, NGC 6540, and NGC 6642. These clusters have similar metallicities to NGC 6558 (1.2<[Fe/H]<1.0), as reported in Geisler et al. (2021). Abundances derived from Geisler et al. (2021) are from the ASPCAP system. To avoid any systematic errors and ensure consistency with the abundances measured with BACCHUS, we applied the same correction in [Fe/H] determined for NGC 6558 (as indicated by the dashed circles in the zoomed box of the top-right panel in Fig. 1).
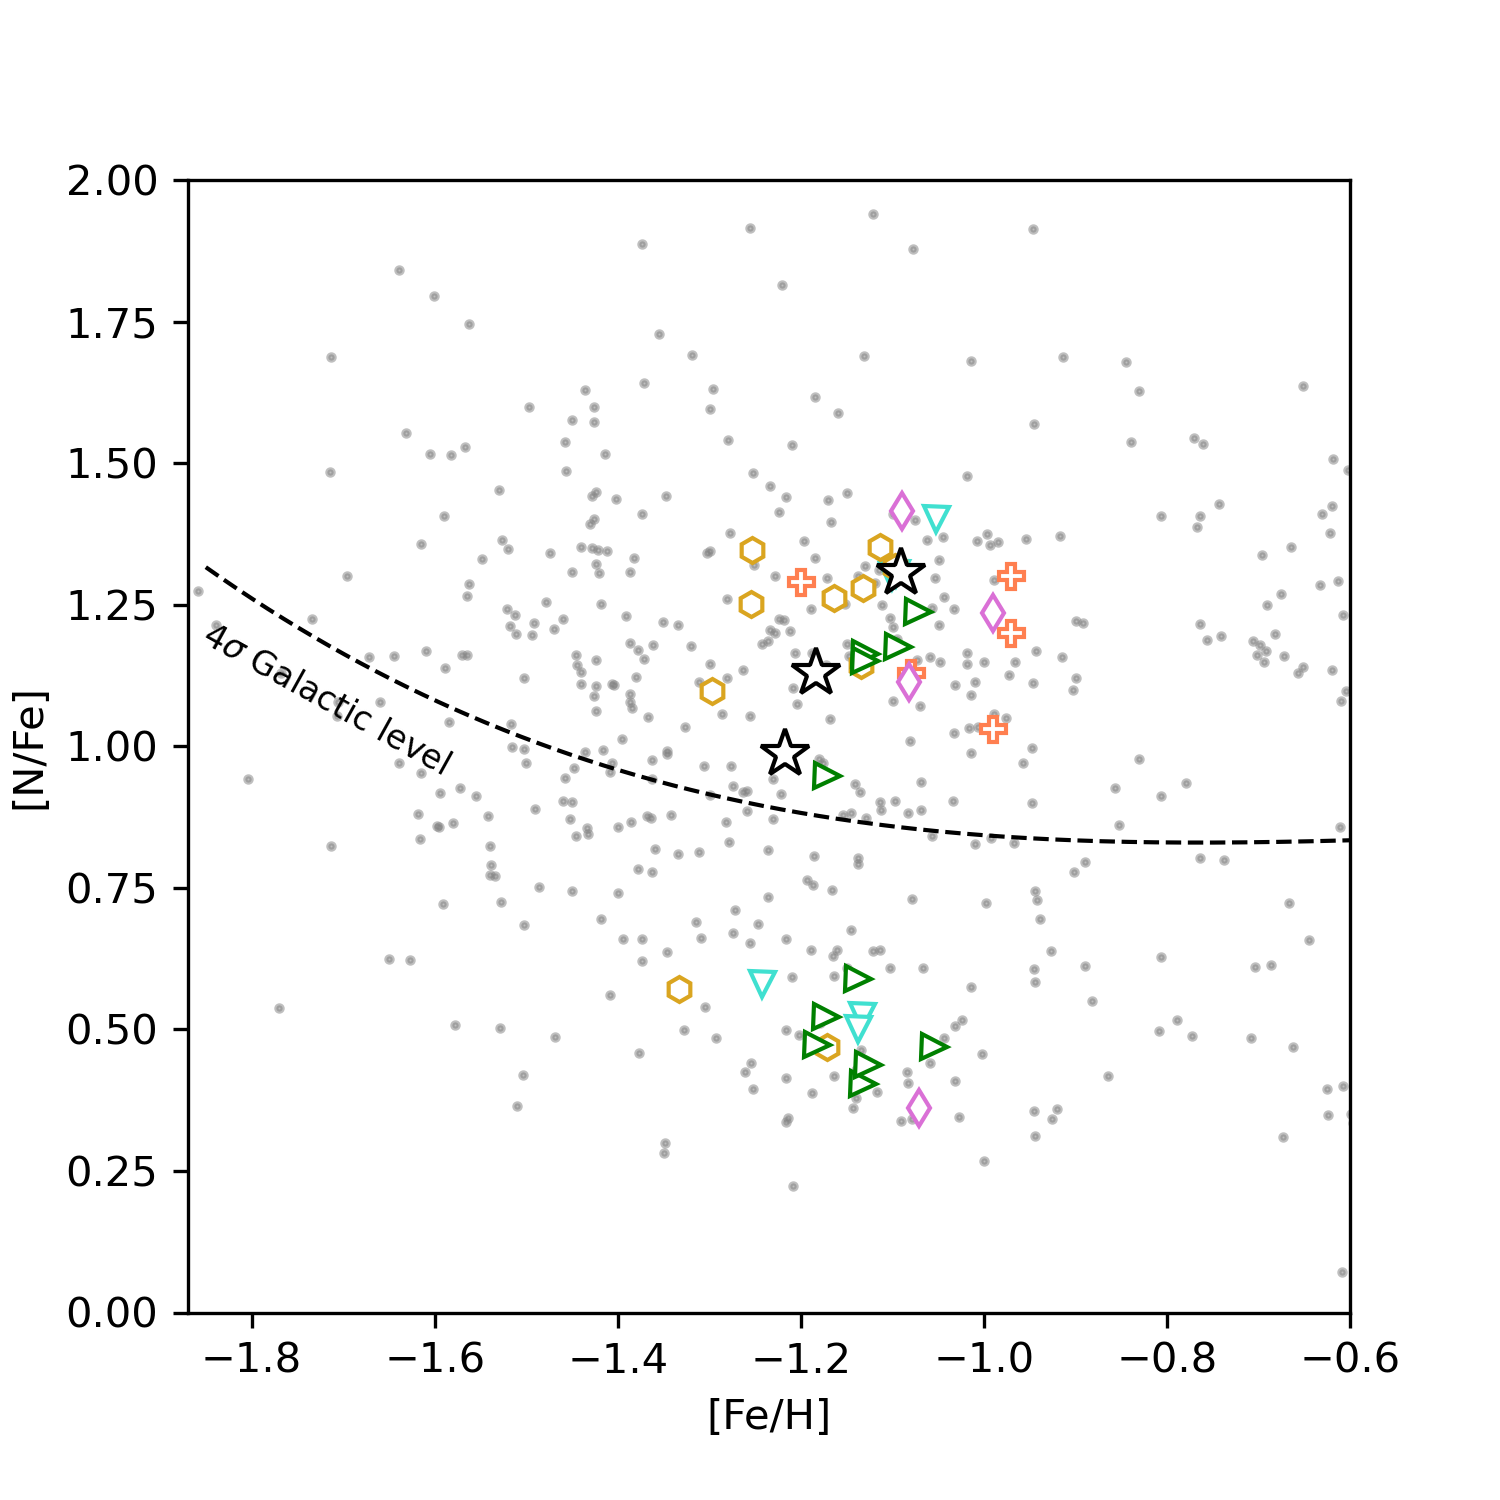
We found that the NGC 6558 stars do not extend over a large range in [Al/Fe], but instead lie within a confined zone below [Al/Fe]=0.3. This limit has been used as an easy and graphic marker between the first- and second-generation stars in GCs (Mészáros et al., 2015, 2020). In spite of that, the high values in N abundance for the stars of NGC 6558 in Fig. 3, and the low values in C, are together a good indicator of multiple-population stars. Thus, using only the Al abundance to distinguish between first- and second-generation stars may not be enough. Such enhanced N abundances exceed 4 above the typical Galactic level (dotted grey line at [N/Fe]0.81) at a metallicity of [Fe/H]=1.15), as is shown in Fernández-Trincado et al. (2022c), and represented as a dashed line in Fig. 4. This figure presents a 4 fourth-order polynomial fit above the mean behaviour of the nitrogen for the Galactic stars drawn from the APOGEE pipeline ASPCAP (Pérez et al., 2016), and corrected to BACCHUS abundances using the stars belonging to GCs in (Mészáros et al., 2020, grey dots). This polynomial fit was used by Fernández-Trincado et al. (2022c) to select the nitrogen-enriched red giant stars distributed across the bulge, metal-poor disk, and halo of our Galaxy, which exhibit elemental abundances comparable to those exclusively seen in GCs. These stars are thought to have been likely formed in the cluster and subsequently lost.
All the BGCs displayed in Fig. 3 exhibit a significant gap of approximately 0.3 dex in nitrogen abundance, with the exception of NGC 6558 and NGC 6522. The latter two clusters, due to the small sample, only presented stars with [N/Fe] values over the Galactic levels within this range of metallicities. When compared to Mészáros et al. (2020, their Fig. 17), this gap is solely observed in NGC 288, and barely indicated in NGC 5904. This suggests that the observed effect is likely due to the limited sample size in our clusters.
We could only measure the abundance of the -process element Ce relative to Fe for three stars, as well as to N. Despite this, [Ce/Fe] shows values that are slightly overabundant compared to the Sun, but as expected by other BGCs at the same metallicity, as can be seen in the Ce-Al and Ce-N diagrams.
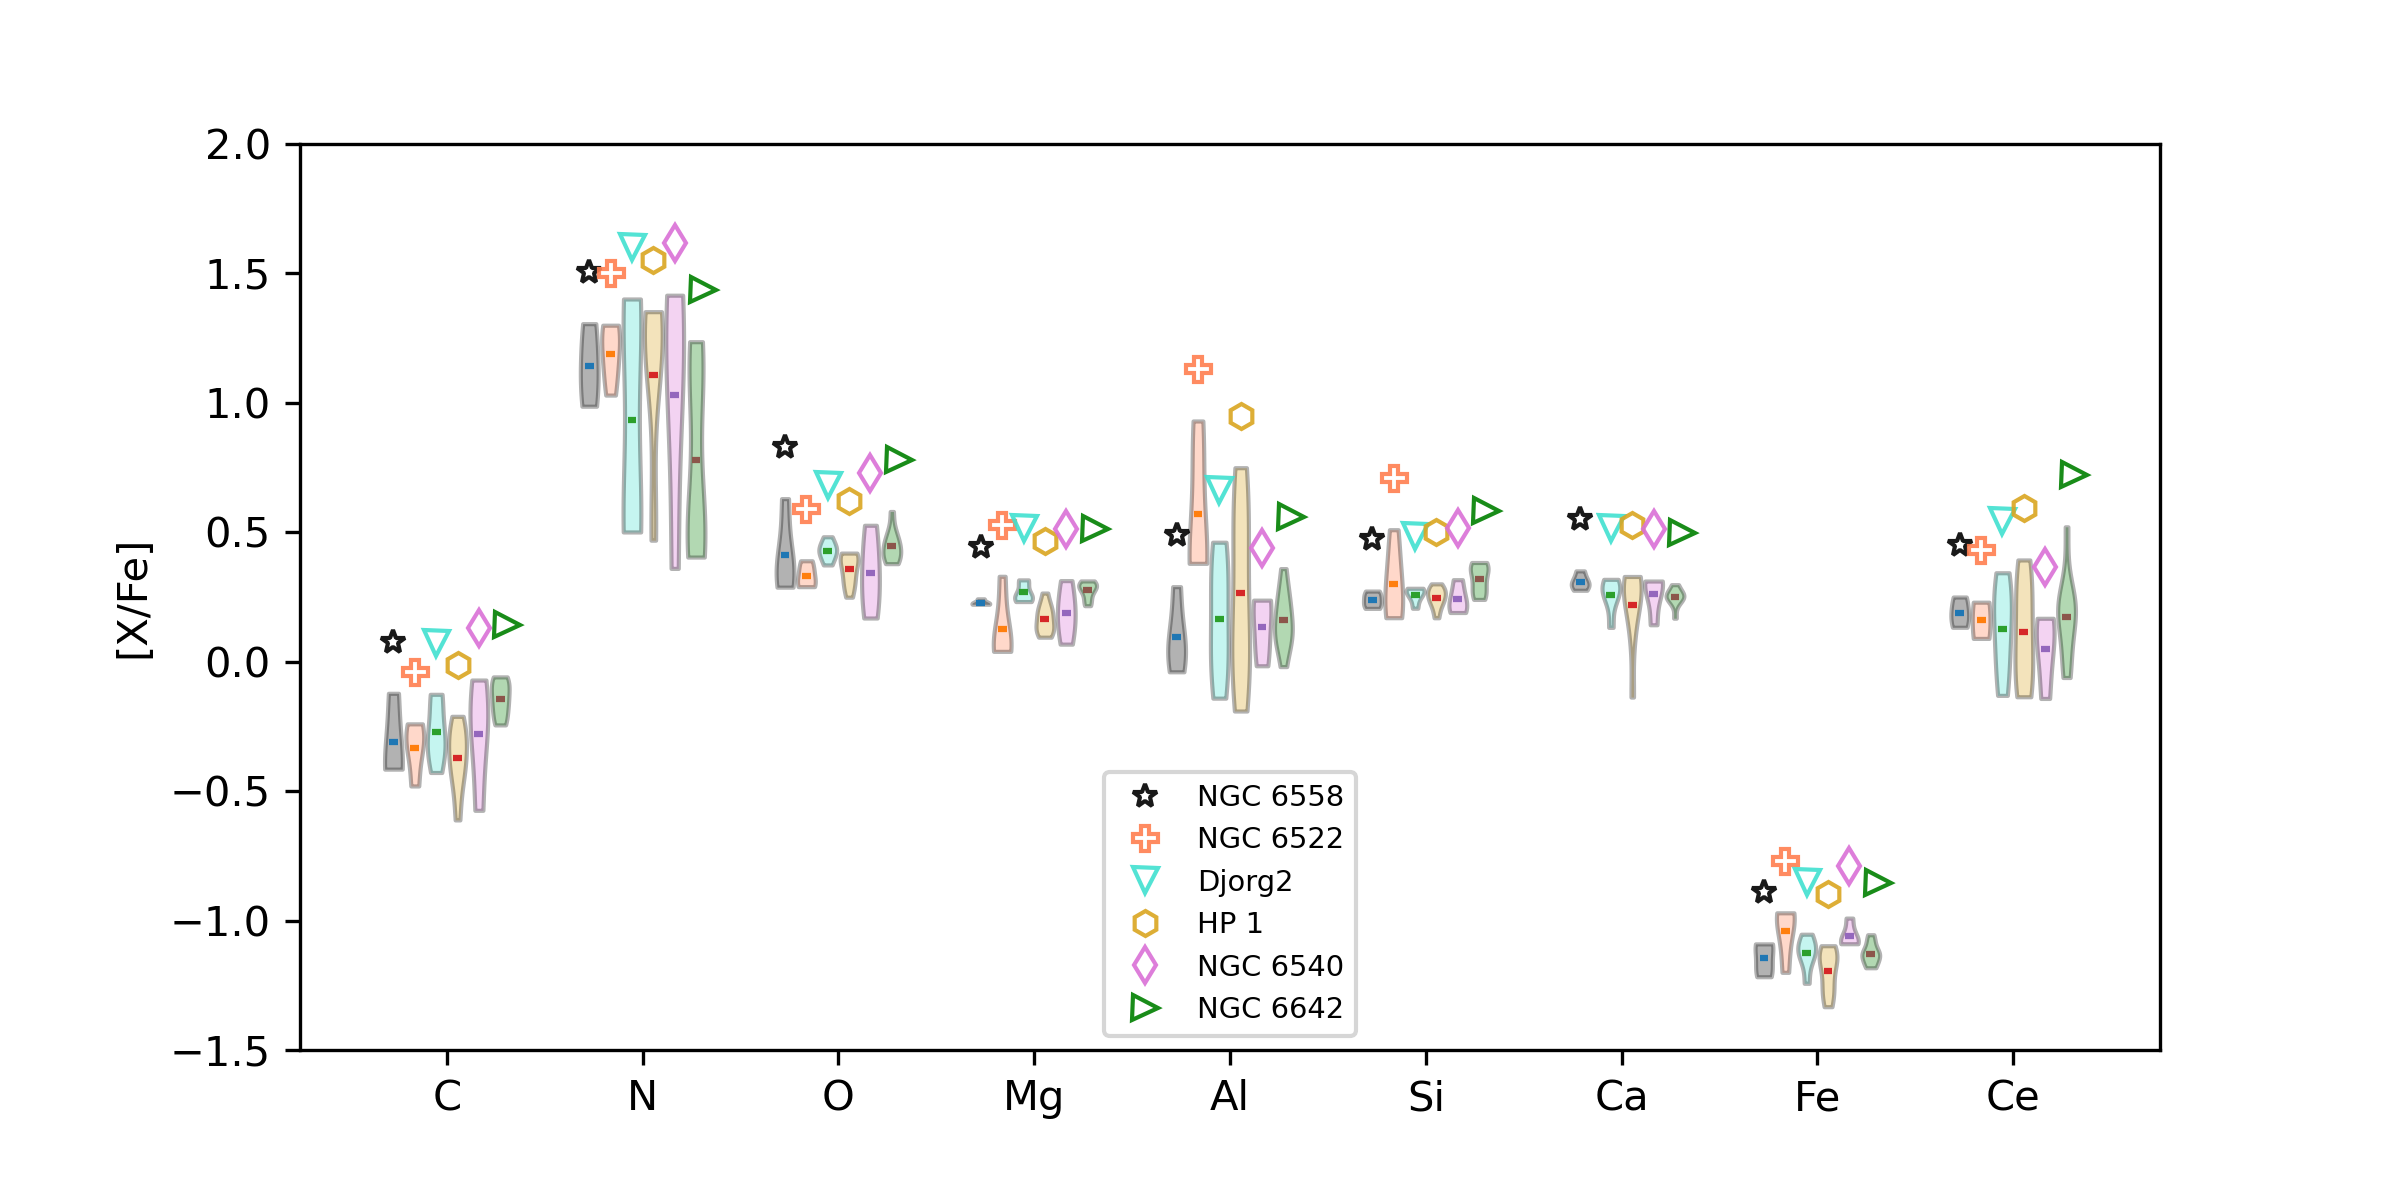
The remarkable similarities observed in the chemical behaviour between NGC 6558 and the other CAPOS BGCs with the same metallicity can be seen clearly in Fig. 5 and Table 5. Violin plots displaying the abundance distributions of NGC 6558 in comparison to NGC 6522, Djorg 2, HP 1, NGC 6540, and NGC 6642 are presented. All the BGC abundance distributions are strongly consistent with each other. The mean values of [N/Fe] for NGC 6558 and NGC 6522 are slightly greater than the others, primarily due to the small sample (5 stars for NGC 6522), which include only bona fide second-generation stars. On the other hand, NGC 6522 exhibits systematically higher Al abundances compared to other CAPOS clusters with the same metallicity. In fact, according to (Fernández-Trincado et al., 2019c), this cluster exhibits a significant scatter in [Al/Fe], with a variation of 1 dex when considering values from the literature.
Figs. 3 and 5 show that the [Mg/Fe] abundances for all these bulge clusters, including NGC 6558, do not exceed the value 0.4. This observation is consistent with the values observed for the APOGEE bulge field stars (see, for example, Rojas-Arriagada et al., 2020; Geisler et al., 2021). However, they differ from M 4, M 12, and NGC 288, whose average [Mg/Fe] values are around 0.5 (Mészáros et al., 2020). These latter GCs share similar metallicities to NGC 6558, but they are not associated with the GB; instead, they are associated with disk formation (M 4 and M 12) or Gaia-Enceladus (NGC 288, Massari et al., 2019).
7 Concluding remarks
We have presented a new high-resolution (R22,000) spectral analysis in the -band for six members of the relatively old, moderately metal-poor BGC NGC 6558, obtained as part of the CAPOS survey. The memberships are very likely, due to their spatial distribution, Gaia DR3 proper motions, and our own RV and metallicity from APOGEE spectra. We found a mean heliocentric RV of = 193.4 0.9 km s-1, where the error is the standard error of the mean, in good agreement with Barbuy et al. (2018b). Out of the six stars, four presented spectral S/N greater than 70 per pixel, which allowed us to determine their abundance ratios [C/Fe], [N/Fe], [O/Fe], [Mg/Fe], [Al/Fe], [Si/Fe], [Ca/Fe], [Ti/Fe], [Fe/H], [Ni/Fe], and [Ce/Fe] in a reliable way, through use of the BACCHUS code.
We found a mean metallicity of [Fe/H] = for NGC 6558, in good agreement with Barbuy et al. (2018b) when their value is scaled to the same Solar iron abundance as ours. We also found mean values of the -(O, Mg, Si, Ca, Ti) elements that are slightly enhanced, iron-peak (Ni) essentially Solar, and the -process element (Ce) slightly overabundant compared to the Sun. The high enrichment in nitrogen, together with the depleted carbon, indicates the presence of the multiple-population phenomenon in this cluster, although the Al values are below the Mészáros et al. (2020) limit for second-generation stars. This is the first time that the phenomenon of multiple-populations is observed for this cluster. Such high nitrogen enrichment for NGC 6558 agrees with the nitrogen abundances for the CAPOS BGCs at the same metallicities, turning them into potential progenitors of the nitrogen-enhanced moderately metal-poor field stars identified in the inner bulge region (e.g., Fernández-Trincado et al., 2016, 2017; Schiavon et al., 2017; Fernández-Trincado et al., 2019a, 2020a, 2021a, 2022b).
Despite our small statistical sample, we have observed consistent abundance patterns in all chemical elements studied in this work for all CAPOS BGCs in the same metallicity range as NGC 6558 (1.2<[Fe/H]<1.0). However, NGC 6522 stands out due to its significant spread in [Al/Fe]. These clusters present nitrogen enhancement and carbon depletion, indicating the presence of multiple populations. Furthermore, the [Mg/Fe] abundances in these clusters remain within the range observed for bulge field stars, in contrast to some Galactic GCs outside the bulge at the same metallicities.
Acknowledgements
D.G-D and J.G.F-T gratefully acknowledge support from the Joint Committee ESO-Government of Chile 2021 (ORP 023/2021). J.G.F-T also acknowledges the financial support provided by Agencia Nacional de Investigación y Desarrollo de Chile (ANID) under the Proyecto Fondecyt Iniciación 2022 Agreement No. 11220340, and from ANID under the Concurso de Fomento a la Vinculación Internacional para Instituciones de Investigación Regionales (Modalidad corta duración) Agreement No. FOVI210020, and from Becas Santander Movilidad Internacional Profesores 2022, Banco Santander Chile, and from Vicerrectoría de Investigación y Desarrollo Tecnológico (VRIDT) at Universidad Católica del Norte (UCN) under resolución No 061/2022-VRIDT-UCN. D.G. gratefully acknowledges support from the ANID BASAL project ACE210002. D.G. also acknowledges financial support from the Dirección de Investigación y Desarrollo de la Universidad de La Serena through the Programa de Incentivo a la Investigación de Académicos (PIA-DIDULS). S.V. gratefully acknowledges the support provided by Fondcyt regular n. 1220264. S.V. gratefully acknowledges support by the ANID BASAL projects ACE210002 and FB210003. D.M. gratefully acknowledges support by the ANID BASAL projects ACE210002 and FB210003 and by Fondecyt project No. 1220724. DM Also acknowledges support from CNPq/Brazil through project 350104/2022-0. T.C.B. acknowledges partial support for this work from grant PHY 14-30152; Physics Frontier Center/JINA Center for the Evolution of the Elements (JINA-CEE), and from OISE-1927130: The International Research Network for Nuclear Astrophysics (IReNA), awarded by the U.S. National Science Foundation. B.T. gratefully acknowledges support from the Natural Science Foundation of Guangdong Province under grant No. 2022A1515010732, and the National Natural Science Foundation of China through grants No. 12233013. BB acknowledges partial financial support from FAPESP, CNPq and Capes Financial code 001. C.M. thanks the support provided by FONDECYT Postdoctorado No.3210144. A.M. gratefully acknowledges support by the ANID BASAL project FB210003, FONDECYT Regular grant 1212046, and funding from the Max Planck Society through a “PartnerGroup” grant.
Funding for the Sloan Digital Sky Survey IV has been provided by the Alfred P. Sloan Foundation, the U.S. Department of Energy Office of Science, and the Participating Institutions. SDSS-IV acknowledges support and resources from the Center for High-Performance Computing at the University of Utah. The SDSS website is www.sdss.org. SDSS-IV is managed by the Astrophysical Research Consortium for the Participating Institutions of the SDSS Collaboration including the Brazilian Participation Group, the Carnegie Institution for Science, Carnegie Mellon University, the Chilean Participation Group, the French Participation Group, Harvard-Smithsonian Center for Astrophysics, Instituto de Astrofìsica de Canarias, The Johns Hopkins University, Kavli Institute for the Physics and Mathematics of the Universe (IPMU) / University of Tokyo, Lawrence Berkeley National Laboratory, Leibniz Institut für Astrophysik Potsdam (AIP), Max-Planck-Institut für Astronomie (MPIA Heidelberg), Max-Planck-Institut für Astrophysik (MPA Garching), Max-Planck-Institut für Extraterrestrische Physik (MPE), National Astronomical Observatory of China, New Mexico State University, New York University, University of Notre Dame, Observatório Nacional / MCTI, The Ohio State University, Pennsylvania State University, Shanghai Astronomical Observatory, United Kingdom Participation Group, Universidad Nacional Autónoma de México, University of Arizona, University of Colorado Boulder, University of Oxford, University of Portsmouth, University of Utah, University of Virginia, University of Washington, University of Wisconsin, Vanderbilt University, and Yale University.
This work has made use of data from the European Space Agency (ESA) mission Gaia (http://www.cosmos.esa.int/gaia), processed by the Gaia Data Processing and Analysis Consortium (DPAC, http://www.cosmos.esa.int/web/gaia/dpac/consortium). Funding for the DPAC has been provided by national institutions, in particular, the institutions participating in the Gaia Multilateral Agreement.
Data Availability
All APOGEE DR 17 data upon which this study is based are publicly available and can be found at https://www.sdss4.org/dr17.
References
- Abdurro’uf et al. (2022a) Abdurro’uf et al., 2022a, ApJS, 259, 35
- Abdurro’uf et al. (2022b) Abdurro’uf et al., 2022b, ApJS, 259, 35
- Ahumada et al. (2020) Ahumada R., et al., 2020, ApJS, 249, 3
- Allende Prieto et al. (2006) Allende Prieto C., Beers T. C., Wilhelm R., Newberg H. J., Rockosi C. M., Yanny B., Lee Y. S., 2006, ApJ, 636, 804
- Alvarez & Plez (1998) Alvarez R., Plez B., 1998, A&A, 330, 1109
- Asplund et al. (2005) Asplund M., Grevesse N., Sauval A. J., 2005, in Barnes Thomas G. I., Bash F. N., eds, PASPVol. 336, Cosmic Abundances as Records of Stellar Evolution and Nucleosynthesis. p. 25
- Barbuy et al. (2007) Barbuy B., Zoccali M., Ortolani S., Minniti D., Hill V., Renzini A., Bica E., Gómez A., 2007, AJ, 134, 1613
- Barbuy et al. (2009) Barbuy B., Zoccali M., Ortolani S., Hill V., Minniti D., Bica E., Renzini A., Gómez A., 2009, A&A, 507, 405
- Barbuy et al. (2014) Barbuy B., et al., 2014, A&A, 570, A76
- Barbuy et al. (2018a) Barbuy B., Chiappini C., Gerhard O., 2018a, ARA&A, 56, 223
- Barbuy et al. (2018b) Barbuy B., et al., 2018b, A&A, 619, A178
- Baumgardt & Vasiliev (2021a) Baumgardt H., Vasiliev E., 2021a, MNRAS, 505, 5957
- Baumgardt & Vasiliev (2021b) Baumgardt H., Vasiliev E., 2021b, MNRAS, 505, 5957
- Beaton et al. (2021) Beaton R. L., et al., 2021, AJ, 162, 302
- Blanton et al. (2017) Blanton M. R., et al., 2017, AJ, 154, 28
- Bowen & Vaughan (1973) Bowen I. S., Vaughan A. H. J., 1973, Appl. Opt., 12, 1430
- Bressan et al. (2012) Bressan A., Marigo P., Girardi L., Salasnich B., Dal Cero C., Rubele S., Nanni A., 2012, MNRAS, 427, 127
- Cardelli et al. (1989) Cardelli J. A., Clayton G. C., Mathis J. S., 1989, ApJ, 345, 245
- Carretta et al. (2009) Carretta E., Bragaglia A., Gratton R., Lucatello S., 2009, A&A, 505, 139
- Cescutti (2008) Cescutti G., 2008, A&A, 481, 691
- Chiappini et al. (2011) Chiappini C., Frischknecht U., Meynet G., Hirschi R., Barbuy B., Pignatari M., Decressin T., Maeder A., 2011, Nature, 472, 454
- Cohen et al. (2021) Cohen R. E., Bellini A., Casagrande L., Brown T. M., Correnti M., Kalirai J. S., 2021, AJ, 162, 228
- Cunha et al. (2017) Cunha K., et al., 2017, ApJ, 844, 145
- Ernandes et al. (2018) Ernandes H., Barbuy B., Alves-Brito A., Friaça A., Siqueira-Mello C., Allen D. M., 2018, A&A, 616, A18
- Fernández-Trincado et al. (2016) Fernández-Trincado J. G., et al., 2016, ApJ, 833, 132
- Fernández-Trincado et al. (2017) Fernández-Trincado J. G., et al., 2017, ApJ, 846, L2
- Fernández-Trincado et al. (2019a) Fernández-Trincado J. G., Beers T. C., Tang B., Moreno E., Pérez-Villegas A., Ortigoza-Urdaneta M., 2019a, MNRAS, 488, 2864
- Fernández-Trincado et al. (2019b) Fernández-Trincado J. G., et al., 2019b, A&A, 627, A178
- Fernández-Trincado et al. (2019c) Fernández-Trincado J. G., et al., 2019c, A&A, 627, A178
- Fernández-Trincado et al. (2020a) Fernández-Trincado J. G., Chaves-Velasquez L., Pérez-Villegas A., Vieira K., Moreno E., Ortigoza-Urdaneta M., Vega-Neme L., 2020a, MNRAS, 495, 4113
- Fernández-Trincado et al. (2020b) Fernández-Trincado J. G., Beers T. C., Minniti D., Tang B., Villanova S., Geisler D., Pérez-Villegas A., Vieira K., 2020b, A&A, 643, L4
- Fernández-Trincado et al. (2020c) Fernández-Trincado J. G., et al., 2020c, A&A, 643, A145
- Fernández-Trincado et al. (2021a) Fernández-Trincado J. G., et al., 2021a, A&A, 647, A64
- Fernández-Trincado et al. (2021b) Fernández-Trincado J. G., et al., 2021b, A&A, 648, A70
- Fernández-Trincado et al. (2021c) Fernández-Trincado J. G., et al., 2021c, ApJ, 908, L42
- Fernández-Trincado et al. (2021d) Fernández-Trincado J. G., et al., 2021d, ApJ, 918, L9
- Fernández-Trincado et al. (2022a) Fernández-Trincado J. G., Minniti, Dante Garro, Elisa R. Villanova, Sandro 2022a, A&A, 657, A84
- Fernández-Trincado et al. (2022b) Fernández-Trincado J. G., et al., 2022b, A&A, 658, A116
- Fernández-Trincado et al. (2022c) Fernández-Trincado J. G., et al., 2022c, A&A, 663, A126
- Frischknecht et al. (2016) Frischknecht U., et al., 2016, MNRAS, 456, 1803
- Gaia Collaboration et al. (2018) Gaia Collaboration et al., 2018, A&A, 616, A1
- Gaia Collaboration et al. (2022) Gaia Collaboration et al., 2022, arXiv e-prints, p. arXiv:2208.00211
- García Pérez et al. (2016) García Pérez A. E., et al., 2016, AJ, 151, 144
- Geisler et al. (2021) Geisler D., et al., 2021, A&A, 652, A157
- Goriely et al. (2011) Goriely S., Bauswein A., Janka H.-T., 2011, ApJ, 738, L32
- Gratton et al. (1996) Gratton R. G., Carretta E., Castelli F., 1996, A&A, 314, 191
- Grevesse & Sauval (1998) Grevesse N., Sauval A. J., 1998, Space Sci. Rev., 85, 161
- Gunn et al. (2006) Gunn J. E., et al., 2006, AJ, 131, 2332
- Gustafsson et al. (2008) Gustafsson B., Edvardsson B., Eriksson K., Jørgensen U. G., Nordlund Å., Plez B., 2008, A&A, 486, 951
- Hansen et al. (2017) Hansen T. T., et al., 2017, ApJ, 838, 44
- Harris (1996) Harris W. E., 1996, AJ, 112, 1487
- Harris (2010) Harris W. E., 2010, arXiv e-prints, p. arXiv:1012.3224
- Hasselquist et al. (2016) Hasselquist S., et al., 2016, ApJ, 833, 81
- Hawkins et al. (2016) Hawkins K., Masseron T., Jofré P., Gilmore G., Elsworth Y., Hekker S., 2016, A&A, 594, A43
- Heger et al. (2003) Heger A., Fryer C. L., Woosley S. E., Langer N., Hartmann D. H., 2003, ApJ, 591, 288
- Holtzman et al. (2018) Holtzman J. A., et al., 2018, AJ, 156, 125
- Janka (2012) Janka H.-T., 2012, Annual Review of Nuclear and Particle Science, 62, 407
- Ji et al. (2016) Ji A. P., Frebel A., Simon J. D., Chiti A., 2016, ApJ, 830, 93
- Jönsson et al. (2018) Jönsson H., et al., 2018, AJ, 156, 126
- Jönsson et al. (2020) Jönsson H., et al., 2020, AJ, 160, 120
- Majewski et al. (2017) Majewski S. R., et al., 2017, AJ, 154, 94
- Malhan et al. (2022) Malhan K., et al., 2022, ApJ, 926, 107
- Massari et al. (2019) Massari D., Koppelman H. H., Helmi A., 2019, A&A, 630, L4
- Masseron et al. (2016) Masseron T., Merle T., Hawkins K., 2016, BACCHUS: Brussels Automatic Code for Characterizing High accUracy Spectra (ascl:1605.004)
- Mészáros et al. (2015) Mészáros S., et al., 2015, AJ, 149, 153
- Mészáros et al. (2020) Mészáros S., et al., 2020, MNRAS, 492, 1641
- Minniti (1995) Minniti D., 1995, AJ, 109, 1663
- Minniti et al. (2010) Minniti D., et al., 2010, New Astron., 15, 433
- Moreno et al. (2022) Moreno E., Fernández-Trincado J. G., Pérez-Villegas A., Chaves-Velasquez L., Schuster W. J., 2022, MNRAS, 510, 5945
- Nidever et al. (2015) Nidever D. L., et al., 2015, AJ, 150, 173
- O’Donnell (1994) O’Donnell J. E., 1994, ApJ, 422, 158
- Pérez-Villegas et al. (2020) Pérez-Villegas A., Barbuy B., Kerber L. O., Ortolani S., Souza S. O., Bica E., 2020, MNRAS, 491, 3251
- Pérez et al. (2016) Pérez A. E. G., et al., 2016, AJ, 151, 144
- Plez (2012) Plez B., 2012, Turbospectrum: Code for spectral synthesis, Astrophysics Source Code Library, record ascl:1205.004 (ascl:1205.004)
- Reichert et al. (2020) Reichert M., Hansen C. J., Hanke M., Skúladóttir Á., Arcones A., Grebel E. K., 2020, A&A, 641, A127
- Renzini et al. (2015) Renzini A., et al., 2015, MNRAS, 454, 4197
- Rich et al. (1998) Rich R. M., Ortolani S., Bica E., Barbuy B., 1998, AJ, 116, 1295
- Roederer et al. (2016) Roederer I. U., et al., 2016, AJ, 151, 82
- Rojas-Arriagada et al. (2020) Rojas-Arriagada A., et al., 2020, MNRAS, 499, 1037
- Rossi et al. (2015) Rossi L. J., Ortolani S., Barbuy B., Bica E., Bonfanti A., 2015, MNRAS, 450, 3270
- Saito et al. (2012) Saito R. K., et al., 2012, A&A, 537, A107
- Santana et al. (2021) Santana F. A., et al., 2021, AJ, 162, 303
- Savino et al. (2020) Savino A., Koch A., Prudil Z., Kunder A., Smolec R., 2020, A&A, 641, A96
- Schiavon et al. (2017) Schiavon R. P., et al., 2017, MNRAS, 465, 501
- Shetrone et al. (2015) Shetrone M., et al., 2015, ApJS, 221, 24
- Simon (2019) Simon J. D., 2019, ARA&A, 57, 375
- Skrutskie et al. (2006) Skrutskie M., et al., 2006, The Astronomical Journal, 131, 1163
- Smith et al. (2021) Smith V. V., et al., 2021, arXiv e-prints, p. arXiv:2103.10112
- Trager et al. (1995) Trager S. C., King I. R., Djorgovski S., 1995, The Astronomical Journal, 109, 218
- Wanajo et al. (2021) Wanajo S., Hirai Y., Prantzos N., 2021, MNRAS, 505, 5862
- Wilson et al. (2019) Wilson J. C., et al., 2019, PASP, 131, 055001
- Zamora et al. (2015) Zamora O., et al., 2015, AJ, 149, 181
- Zasowski et al. (2013) Zasowski G., et al., 2013, AJ, 146, 81
- Zasowski et al. (2017) Zasowski G., et al., 2017, AJ, 154, 198