Clustering and physical properties of the star-forming galaxies and AGN: does assembly bias have a role in AGN activity?
Abstract
We compare the spatial clustering and physical properties of the active galactic nuclei (AGN) and star-forming galaxies (SFG) at fixed stellar mass using a volume limited sample from the Sloan Digital Sky Survey (SDSS). The analysis of the two-point correlation function shows that the AGN are more strongly clustered than the SFG. The closer proximity to the nearest neighbour for the AGN than that for the SFG indicates that AGN prefer the denser regions. We compare the distributions of the colour, star formation rate (SFR), D and concentration index () of the AGN and SFG after matching their stellar mass distributions. The analysis shows that the null hypothesis can be rejected at confidence level in each case. The comparisons are also carried out at different densities but fixed stellar mass. The differences persist at the same significance level in both the low and high density regions, implying that such differences do not originate from the variations in the density. Alternatively stated, the AGN activity can be triggered in both the high density regions (by interactions) and the low density regions (by secular processes). An analysis of the correlations between the different physical properties at fixed stellar mass reveals that the anticorrelations of SFR with morphology, colour and recent star formation history are times stronger for the AGN than for the SFG. It suggests that the presence of a bulge and the availability of gas are the two most crucial requirements for AGN activity. We propose a picture where the galaxies at fixed stellar mass may have widely different assembly histories, leading to significant variations in bulge properties and cold gas content. Whether a galaxy of a given stellar mass can acquire the suitable conditions for AGN activity remains uncertain due to a broad diversity of assembly history. We conclude that AGN are stochastic phenomena owing to an underlying role of the assembly bias.
1 Introduction
Active Galactic Nuclei (AGN) are one of the brightest astrophysical sources in the Universe. AGN emit radiation over the entire electromagnetic spectrum and have a bolometric luminosity of the order of erg/s [1, 2]. They are believed to be powered by the accretion of matter onto the supermassive black holes (SMBH) at the centres of massive galaxies. When the cloud of gas falls towards the SMBH after losing its angular momentum, the gravitational potential energy of the infalling materials is converted to electromagnetic radiation [3, 4]. The intense radiation can heat the surrounding gas, preventing its cooling and the subsequent star formation [5, 6, 7]. The energy and momentum carried by the radio jets and the AGN-driven outflows can also heat or expel gas [8, 9, 10], limiting the growth of the black hole and suppressing further star formation.
The AGN feedback is widely believed to play a fundamental role in the co-evolution of galaxies and their central black holes [11, 12, 13, 14]. The observations suggest that the star formation rate declines after [15, 16, 17]. The observed bimodality in the colour distribution [18, 19, 20, 21, 22] indicates that the galaxies are transitioning from the actively star-forming blue population to a passively evolving red sequence. The primary physical mechanisms driving the quenching of star formation in the transition valley are still unclear [23]. Several studies pointed out that the AGN feedback may play a crucial role in quenching star formation in the transitional green valley [24, 25, 26, 27, 28]. Most galaxy formation and evolution models require AGN feedback to reproduce many observable properties of the galaxy population. It has now become a key ingredient in theoretical, numerical, and semi-analytic models of galaxy formation and evolution [29, 30, 31].
Almost all massive galaxies host a SMBH at their centre. However, only a fraction of these galaxies show AGN activity at a given epoch. It is important to understand the triggering mechanisms of the AGN in the galaxies. Various internal and external factors influence the AGN activity in a galaxy. The internal properties like the availability of gas in the central region, kinematics, and morphology of the host galaxy play crucial roles in regulating the accretion of gas onto the central SMBH [32, 33, 34, 35]. Further, the mass of the dark matter halo influences the availability of gas reservoirs and the ability of the galaxy to accrete gas from its surroundings. More massive halos have deeper potential wells, making it easier for gas to be drawn toward the galactic centre, fueling AGN activity. Thus, more massive halos are more likely to host AGN [36, 37, 38]. Observations also indicate that AGN activity is more frequent in massive galaxies [39, 40, 41]. The mass of the central SMBH also has an important role in AGN activity. Larger black holes can gravitationally attract and accrete more matter, resulting in higher AGN luminosities. On the other hand, the AGN feedback can limit the growth of the black hole by regulating the gas supply. The more massive galaxies are hosted in dark matter halos with higher masses which live in dense environments, such as galaxy clusters and filaments in the cosmic web. So the cosmic web environments may have an indirect role in the life of AGN. Observations suggest that the colour and SFR of galaxies are sensitive to the cosmic web environments [42, 43, 44]. The inflow of gas along the filaments in the cosmic web can also trigger and sustain AGN activity in galaxies [45].
Numerous studies report that AGN tend to be more strongly clustered than the star-forming galaxies (SFG) [46, 47, 48, 49, 50]. Using SDSS data, [51] find increasing AGN fraction with decreasing distance to the neighbours. [28] show that AGN are surrounded by a larger number of neighbours compared to the SFG. A study of the Horizon Run 5 simulation [52] by [53] show that the AGN activity increases both with the higher background density and the proximity to a neighbour. It has been suggested that the physical mechanisms such as the major and minor mergers [30, 54, 55, 56], disc instability [57, 58, 59] and tidal effects [60] can enhance the supply of cold gas and the accretion rate onto the central SMBH promoting AGN activity. The interactions and mergers between galaxies are more frequent in clusters and filaments, which can induce gas inflows toward the central regions, triggering AGN activity [61, 29, 62].
While AGN activity tends to be more common in dense environments, the situation is more complex in extremely high density environments like galaxy clusters. The pressure from the hot intracluster medium (ICM) at the centers of massive galaxy clusters can cause ram pressure stripping of the cold gas that fuels the AGN activity [63, 64, 65]. Besides, the cluster halo captures the cold gas, preventing accretion towards the inner regions by strangulation [66, 67]. These phenomena can suppress the AGN activity at the centres of massive galaxy clusters. [68] find that the fraction of X-ray bright AGN increases with the distance from the centres of galaxy clusters. Using SDSS, [69] find that AGN are more frequently found in low mass groups, field environments and the cluster outskirts. [70] analyze data from the XXL survey [71] to find that the dependence of X-ray selected AGN on the environment is opposite in high and low mass clusters. [72] study the AGN fractions in the X-ray selected clusters from the ROSAT [73] and find a lower AGN fraction in clusters relative to the fields. [74] find a significantly stronger AGN activity in a void environment compared to the field. The low density regions like voids, contain the less evolved galaxies due to the absence of external processes, like gas stripping and mergers. Besides, these environments contain large amounts of pristine gas. The secular processes dominate the evolution of the galaxies in low density regions. The galaxies in voids are generally fainter and bluer with a higher star formation activity compared to the galaxies residing in average density environments [75, 76, 77, 78]. [79] find that moderately luminous AGN are more common in voids than walls, but the abundance of brighter AGN are comparable in the two environments. [80] find decreasing AGN fraction in massive galaxies as a function of density. Several other works find higher AGN occurrence in low and moderate density environments [81, 82, 83, 84, 85, 86]. It has been suggested that the galaxies in voids experience a higher level of one-on-one interaction, triggering AGN activity.
The environmental dependence of AGN activity at higher redshift is also studied in a number of works. [87] analyze the zCOSMOS spectroscopic survey data upto and find that the massive galaxies harbouring AGN prefer low density regions. [88] analyze the UKIDSS Ultra-deep Survey data in the redshift range to find that the AGN preferentially reside in high density environments.
Several other studies find no significant dependence of AGN activity on the environment. [89] find that the optical selected AGN fraction remains unchanged from the cores of galaxy clusters to the fields. Similar results are obtained by [90] for the X-ray selected AGN. [91] analyze the SDSS data to compare the filamentarity in the distributions of SFG and AGN and find no significant differences. [41] find that the optical selected AGN fraction does not depend on the cluster-centric distance. [92] find no statistically significant dependence of environment on the prevalence of optical AGN activity. [93] find that the local galaxy density weakly affects the AGN activity. [94] analyze the SDSS data and find little to no dependence of AGN activity on the environment. Several other studies find no significant difference between the clustering of AGN and galaxies [95, 96]. The seemingly contradictory results on the roles of the environment in AGN activity suggest that it is still an active area of research, and the issue is far from being settled.
The SDSS [97] provides high quality spectra and images of a large number of galaxies in the nearby universe. It remains one of the largest redshift surveys todate. The high fidelity classification of the SFG and the AGN using the emission lines allows a comparison between the two populations in a statistical manner. In the present work, we aim to study the clustering of the SFG and AGN using different statistical measures, such as the two-point correlation function and the nearest neighbour distribution. The mass of a galaxy is known to influence the AGN activity. The mass is also known to depend on the environment. To identify any additional dependence on the environment, we will compare the clustering and physical properties of the SFG and AGN after matching their stellar mass distributions. It would allow us to identify any residual impact of environments on the AGN activity. The comparison of the physical properties of the AGN and SFG at the same mass and different densities would also reveal the impact of the large-scale environment and the assembly bias [98, 99, 100, 101]. Dark matter halos with the same mass may have different merger histories. The assembly bias could influence the AGN activity by affecting the properties of the dark matter halos in which galaxies and AGN reside. For instance, different assembly histories can lead to variations in the halo concentration, merger rates, or gas accretion rates, potentially impacting AGN activity. We will explore the possible roles of assembly bias on the AGN activity in galaxies.
We use a CDM cosmological model with , and [102] throughout the present work.
The brief outline of our work is as follows. We describe our data and the method of analysis in section 2, explain the results in section 3 and present our conclusions in section 4.
2 Data and method of analysis
2.1 SDSS data
We use data from the data release (DR17)[103] of the SDSS. The SDSS is a multi-band imaging and spectroscopic redshift survey. It uses a optical telescope [104] at Apache Point Observatory, New Mexico, United States, to collect the photometric and spectroscopic information of galaxies over one-quarter of the entire sky. The SDSS DR17 covers square degrees in the sky and provides the spectroscopic information of galaxies. We utilise the Main Galaxy sample [105] of the SDSS for the present work. We download the data from the SDSS CasJobs 111https://skyserver.sdss.org/casjobs/ using Structured Query Language (SQL). A contiguous region of the sky, spanning and in equatorial coordinates is selected for our analysis. We download the spectroscopic information for all the galaxies in this contiguous region, which are lying in the redshift range and have r-band apparent Petrosian magnitude . These cuts provide us with a total galaxies. The stellar mass of the galaxies are estimated using the Flexible Stellar Population Synthesis (FSPS) technique [106], which are provided in the table stellarMassFSPSGranWideDust. We also obtain the specific star formation rates (sSFR) of the galaxies from the table stellarMassFSPSGranWideDust. The break measurements (D) [107] characterizing the mean age of the stellar population in the galaxy are downloaded from table galSpecIndx. We characterize the morphology of the galaxy using the concentration index [108] where and are respectively the radii containing and of the Petrosian flux. These are downloaded from the table PhotoObjAll.
We use the galSpecExtra table, derived from the MPA-JHU spectroscopic catalogue of galaxies to identify the AGN and SFG classified based on the BPT diagram [109]. In this table, the star-forming galaxies are flagged as and the AGN are flagged as .
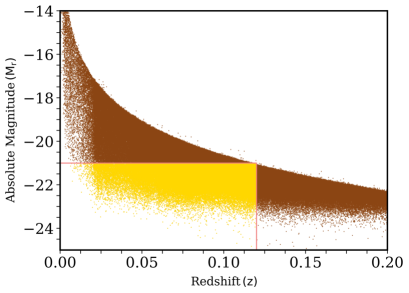
We prepare a volume limited sample by applying a cut in the K-corrected and extinction corrected r-band absolute magnitude , which corresponds to a redshift cut of . The resulting volume limited sample contains a total galaxies (Figure 1), among which are unclassified, are star-forming, are low SNR star-forming, are composite, are AGN and are low SNR Linear.
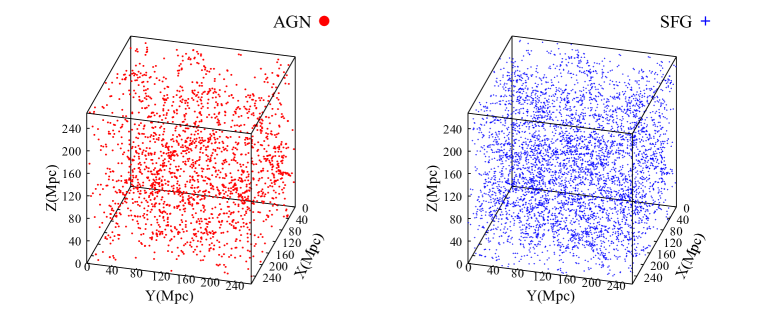
We extract the largest cube that can be fitted inside the volume limited sample. The extracted datacube has a side length . It contains a total galaxies, among which are SFG and are AGN. Our primary goal in this work is to compare the spatial clustering and the physical properties of the AGN and the actively star-forming galaxies. So, we consider only the AGN and the actively star forming galaxies in our analysis. We show the spatial distributions of AGN and SFG in the extracted datacube in Figure 2.
2.2 Methods of analysis
2.2.1 Matching the stellar mass distributions of the AGN and SFG
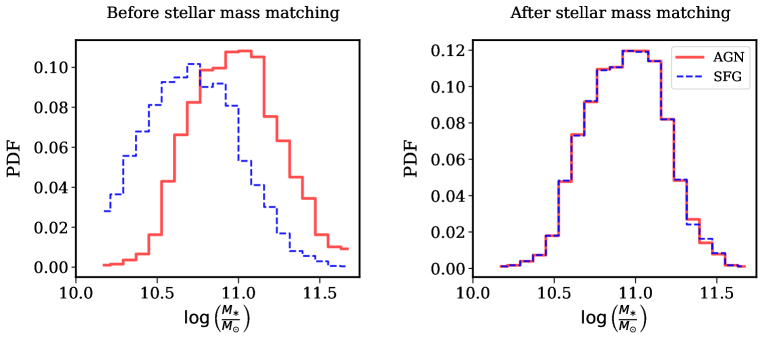
The mass of a galaxy is one of the most influential factors for triggering the AGN activity. The AGN abundance increases with the stellar mass of the host galaxy [80, 87]. The strong relation of the AGN activity with the galaxy mass can seriously bias our study unless we properly take this into account. We match the stellar mass distributions of the AGN and SFG in our sample by using the criterion . The stellar mass distributions for the AGN and SFG are shown together before and after the matching in the left and right panels of Figure 5 respectively. We use a KS-test to compare the two distributions after the matching and find that the null hypothesis can be rejected at a very low confidence level ().
We compare the clustering and the physical properties of the AGN and SFG after matching their stellar mass distributions. It would help us to identify other factors that can trigger the AGN activity in galaxies.
2.2.2 Two-point correlation function
The two-point correlation function measures the clustering strength at a given scale. It provides the excess probability of finding two galaxies at a given separation, compared to a random Poisson distribution. We separately calculate the two-point correlation function of the AGN and SFG samples before matching their stellar mass distributions. The datacube extracted from the volume limited sample contains AGN and SFG. We randomly select SFG out of to maintain the same number density. We prepare such randomly selected SFG samples to estimate the errorbars.
We estimate the two-point correlation function of the galaxies using the Landay and Szalay estimator [110]
| (2.1) |
where , and are normalized counts for data-data, random-random and data-random pairs at separation .
We also prepare separate samples for the AGN and SFG by matching their stellar mass distributions. We obtain AGN and SFG after the stellar mass matching. jackknife samples are prepared from these datasets to estimate the errorbars. The two-point correlation functions for these samples are calculated analogously.
2.2.3 Distribution of the nearest neighbour distance and the local density
The galaxies in the denser environments are expected to have closer neighbours. The distance to the nearest neighbour () can be used as a proxy for the local environment of a galaxy [111]. The value of specifies the number of neighbours around a galaxy. The analysis is carried out in three dimensions, and we choose for the present work.
We calculate the nearest neighbour distributions of the AGN and SFG using all the galaxies in our datacube. The same analyses are also repeated after matching the stellar mass distributions of AGN and SFG.
The local density around an AGN or SFG is defined as
| (2.2) |
where, .
2.2.4 Pearson Correlation coefficient
We measure the correlations between different physical properties of AGN and SFG after matching their stellar mass distributions. The linear association between a pair of galaxy properties can be easily quantified using the Pearson correlation coefficient (PCC). The PCC provides both the degree of correlation as well as its direction. If and are any two physical properties of AGN or SFG, then the PCC for the pair () is defined as,
| (2.3) |
Here is the average value of , is the average value of and is the total number. The value of PCC ranges between to . A value of indicates a perfect correlation between the two physical properties, whereas a value of indicates perfect anticorrelation.
3 Results and Discussions
3.1 The two-point correlation function and the nearest neighbour distribution of the AGN and SFG
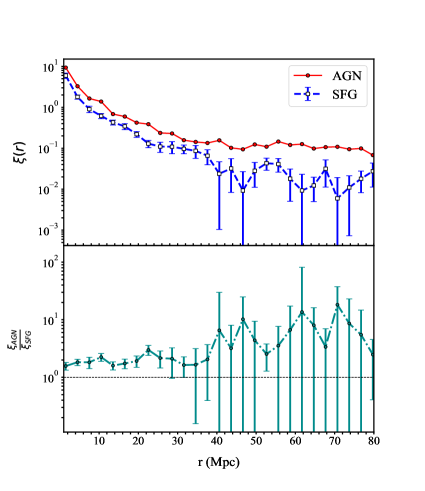
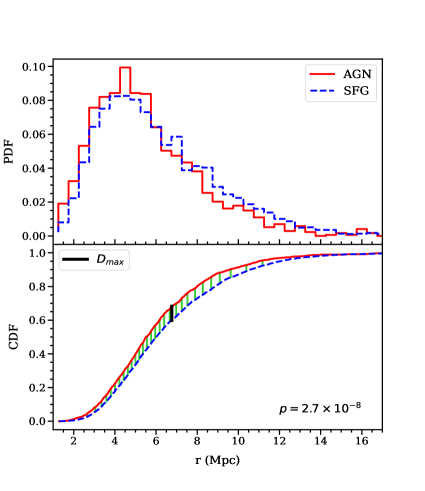
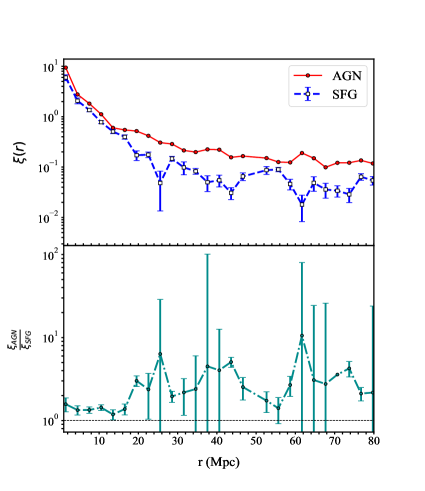
We show the two-point correlation functions of AGN and SFG as a function of separation in the top left panel of Figure 3. It shows that the AGN are more strongly clustered than the SFG. The ratio of the two-point correlation functions is shown in the bottom left panel of Figure 3. The clustering strength of the AGN is nearly twice that of SFG, at least upto a distance of 30 Mpc.
The distributions of the distance to the nearest neighbour for AGN and SFG are shown together in the top right panel of Figure 3. On average, the AGN have a smaller nearest neighbour distance compared to the SFG. We compare the two distributions using a Kolmogorov-Smirnov (KS) test. The result of the KS-test is shown in the bottom right panel of Figure 3. The test shows that the null hypothesis can be rejected at confidence level. It indicates that the AGN inhabit relatively denser regions than those occupied by the SFG.
These analyses are carried out before matching the stellar mass distributions of AGN and SFG.
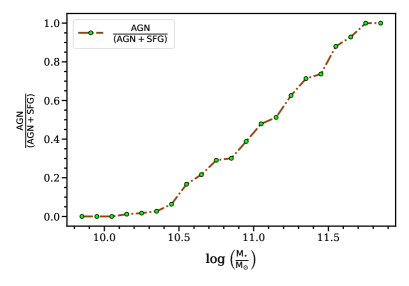
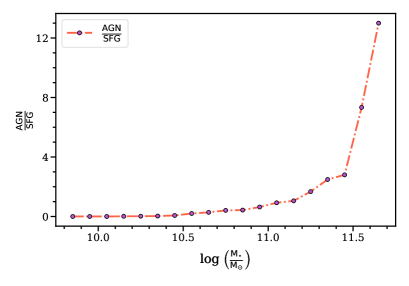
and the right panel shows as a function of stellar mass.
3.2 Stellar mass dependence of AGN fraction
We calculate the fraction of AGN as a function of stellar mass for the galaxies in our datacube and show the results in Figure 4. The left panel of Figure 4 shows that the AGN fraction steadily increases with stellar mass beyond a mass of . The sudden rise in at higher masses in the right panel of Figure 4 is related to the lower abundance of SFG at these masses. The majority of the galaxies with a mass above are known to be quiescent galaxies with bulge dominated morphology whereas those with masses lower than this critical value are actively star-forming galaxies with a disk-like morphology [112]. Multiple analysis with hydrodynamical simulations suggest that a transition from the cold mode to hot mode of accretion occur around this critical mass, leading to mass quenching in galaxies [113, 114, 115, 116]. The halo gas can eventually cool down and collapse again to form stars in these massive galaxies. However, an additional heating source like AGN feedback can prevent such cooling, maintaining the high temperature of the halo gas. The higher AGN fraction in more massive galaxies indicates that they provide a supportive environment for AGN activity. The more massive galaxies are strongly clustered and are generally found in the high density regions. So the results shown in Figure 3 may arise due to the mass dependence of clustering.
Keeping this in mind, we repeat our calculations of the two-point correlation function and the nearest neighbour distribution of the AGN and SFG populations after matching their stellar mass distributions.
| Class | Before mass matching | After mass matching |
|---|---|---|
| AGN | , | , |
| SFG | , | , |
3.3 The two-point correlation function and the nearest neighbour distribution of the mass-matched AGN and SFG
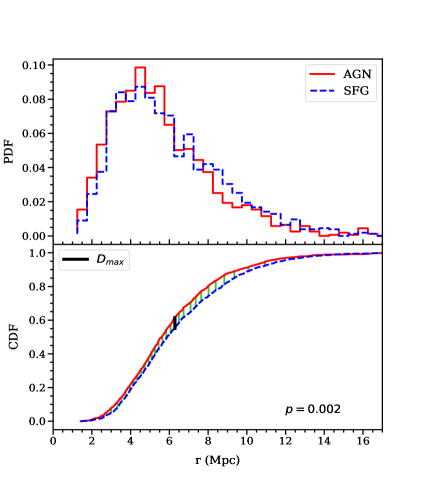
In the top left and right panels of Figure 6, we respectively show the two-point correlation function and the PDF of the nearest neighbour distance for the mass-matched AGN and SFG. The bottom left panel of Figure 6 shows that the AGN are strongly clustered than the SFG at fixed stellar mass. In other words, the clustering of galaxies depends on the AGN activity, with AGN host galaxies having a higher clustering amplitude. The differences between the clustering strengths of the two populations decrease marginally at smaller distances ( Mpc) after matching their stellar mass distributions.
We fit the two-point correlation functions to a powerlaw of the form using least square fitting and tabulate the fitted values of the correlation length () and the slope () in Table 1. The results show that the two-point correlation function of AGN have a larger correlation length and a shallower slope compared to the SFG even after matching their stellar mass distributions. It is worthwhile to mention here that these analyses are carried out in redshift space where the two-point function becomes anisotropic due to redshift space distortions. However, we analyze both the distributions in the redshift space and a statistically significant difference between the fitted parameters (Table 1) indicates that AGN are more strongly clustered than the SFG.
The bottom right panel of Figure 6 compares the nearest neighbour distributions for the AGN and SFG using a KS test. The KS test indicates that the null hypothesis can be rejected at confidence level. Even at fixed stellar mass, the distance to the nearest neighbour is smaller for the AGN than the SFG. The AGN are thus hosted in relatively higher density regions than the SFG.
These results are consistent with the findings reported in several earlier works [46, 47, 48, 49, 50]. We investigate whether the statistically significant differences in the clustering of the AGN host galaxies and the star forming galaxies at fixed stellar mass arise due to the assembly bias.
3.4 Comparing the distributions of different physical properties of the mass-matched AGN and SFG
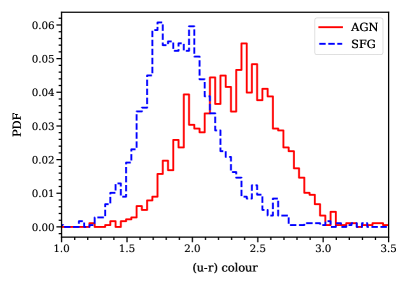
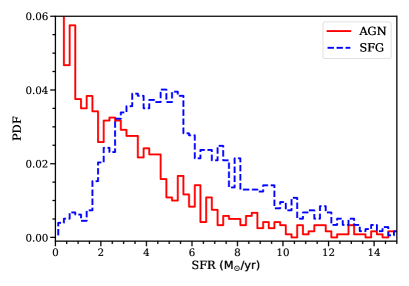
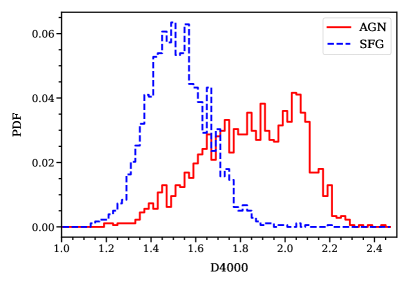
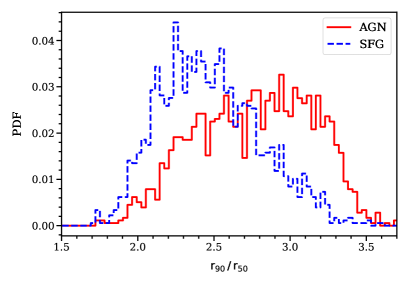
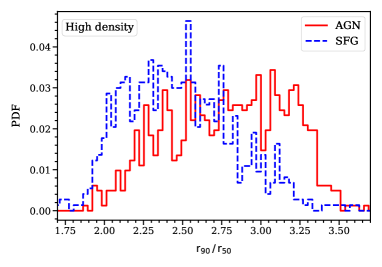
The triggering of AGN activity may require specific physical conditions in a galaxy. The onset of AGN activity can also modulate certain physical properties of the host galaxy. It is important to understand the differences between the physical properties of the AGN host galaxies and the star-forming galaxies. The mass of a galaxy is known to be the most influential factor determining its physical properties [117]. Further, the AGN fraction is strongly sensitive to the stellar mass of the galaxies (Figure 4). It would be interesting to compare the distributions of the different physical properties of the two populations after matching their stellar mass distributions. We compare the distributions of the colour, concentration index (), SFR and the break strength (D) for the AGN host and star-forming galaxies at fixed stellar mass. These distributions are compared in different panels of Figure 7. We use the KS-test to quantify the dissimilarity between the two distributions in each case. The results of these tests show that the null hypothesis can be rejected at confidence level in each case.
The different panels of Figure 7 show that the PDFs for the AGN and SFG cover similar ranges but are peaked at different values. In the top left panel of Figure 7, we find that most of the SFG are located in the blue cloud () [18]. On the other hand, the colour distribution of the AGN host galaxies peak in the green valley and extend into the blue cloud and the red sequence. The blue colours of the SFG arise from the presence of young, hot, and massive stars that dominate the emission from the galaxy. These stars emit significant ultraviolet and blue light, making the star-forming galaxies blue. In contrast, AGN have redder colours due to the presence of dust and gas surrounding the central black hole. The dust can absorb and scatter the blue and ultraviolet light emitted by the accretion disk, leading to a reddening. The redder colours can also arise from the thermal emission of dust heated by the radiation, contributing to the infrared part of the spectrum. An older stellar population in the AGN hosts can also make them redder.
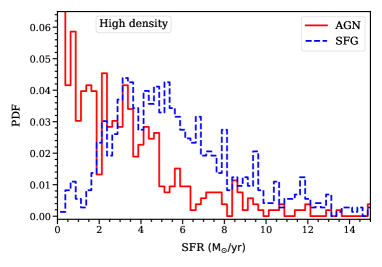
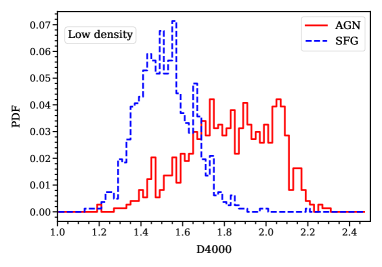
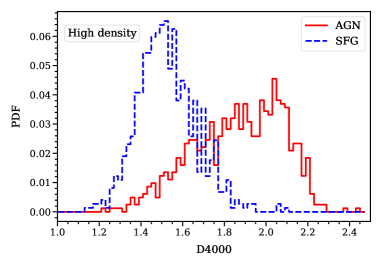
We compare the distributions of the star formation rate (SFR) of the AGN and SFG in the top right panel of Figure 7. The distributions of the SFR for SFG and AGN peak around yr and yr respectively. Both distributions are positively skewed and extend to higher SFR (yr). However, the abundance of AGN is significantly lower compared to SFG above an SFR of yr. The distributions of the break measurements for the AGN and SFG are shown together in the bottom left panel of Figure 7. The break measurement is strongly correlated with the ratio of the past average SFR to the present SFR in galaxies [112]. It characterizes the recent star formation history in galaxies. We see that the distribution for the AGN peaks at a higher value of D () and is negatively skewed. The distribution of D for the SFG is peaked around and is nearly symmetrical. The lower values of D () represent younger stellar populations and the higher values () correspond to older stellar populations [118]. The young stellar populations indicate a recently completed starburst. The starburst galaxies thus have weak break strengths. The larger break strengths in the AGN indicate the prevalence of predominantly old stellar populations in their host galaxies. However, we note that the AGN host galaxies can also have break strengths below . It suggests that the AGN activity can coexist in some starburst galaxies.
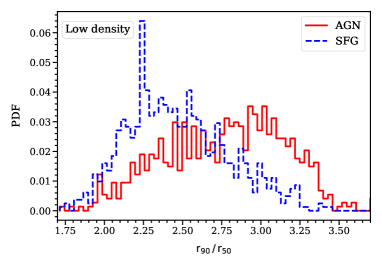
We compare the distributions of the concentration index for the AGN and SFG in the bottom right panel of Figure 7. The concentration index is tightly correlated with the morphology of galaxies [108]. It is well known that for a pure exponential profile [18] whereas describes a pure de-Vaucouleurs profile [119]. Thus, a higher concentration index can be associated with ellipticals and bulge-dominated systems. The disk-dominated spiral galaxies have lower values of concentration index () [18]. The distribution of the concentration index for the AGN and SFG peak around and , respectively. It implies that most of the star forming galaxies have disk-like morphology. Contrarily, the AGN prefer bulge-dominated systems. We note that the distribution for the AGN is negatively skewed, whereas the distribution for the SFG is positively skewed. It indicates that the AGN can also occur in disk-dominated galaxies and some star-forming galaxies can also have bulge-dominated morphology. These are consistent with the findings in the literature that barred spiral galaxies in groups show AGN activity [120], and some ellipticals are rejuvenated in isolated environments [121, 122].
3.5 Comparing the distributions of different physical properties of the mass-matched AGN and SFG in low and high density regions
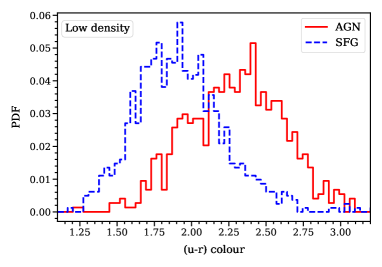
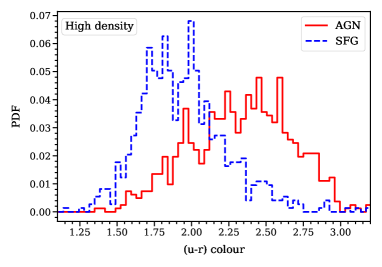
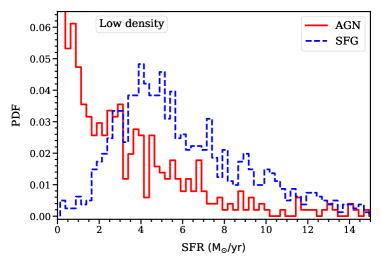
The Figure 7 shows that the physical properties of the AGN and SFG are significantly different at fixed stellar masses. The analyses of the two-point correlation function and the nearest neighbour distributions (Figure 6) at fixed stellar masses show that the clustering of AGN are stronger than SFG where AGN prefer denser regions compared to those occupied by the SFG. It implies that the local density may have a role in triggering the AGN activity. It would also be interesting to know whether the differences in the physical properties of the AGN and SFG observed in Figure 7 can be explained in terms of the variations in the local density. We divide the mass-matched AGN and SFG into two classes based on local density. The AGN and SFG residing in the regions with a density below/above the median density of the combined sample are classified as low/high density sample.
We calculate the PDFs of the four galaxy properties for the AGN and SFG from the low density and the high density regions. The comparison of the physical properties of the AGN and SFG in the low density regions are shown in the four left panels of Figure 8. The distributions are compared in the high density regions in four right panels of Figure 8. The differences between the PDFs in each panel are quantified using KS-test. The tests show that the null hypothesis can be rejected at confidence level in each case. It indicates that the differences between the physical properties of the AGN and SFG persist in both the low density and high density regions. The fact that the AGN show a preference for the denser regions is most likely related to the higher interaction probability in these regions. The interactions induce gas inflow towards the centre, triggering the AGN activity. However, the differences in the properties of the AGN and SFG can not be explained by the variations in the local density. The AGN can also occur in the galaxies residing in the low density environments.
3.6 Comparing the correlations between different physical properties of the mass-matched AGN and SFG
We study the correlations between different physical properties of the AGN and SFG after matching their stellar mass distributions. We first study the relations of the stellar mass with each of the four physical properties of the AGN and SFG.
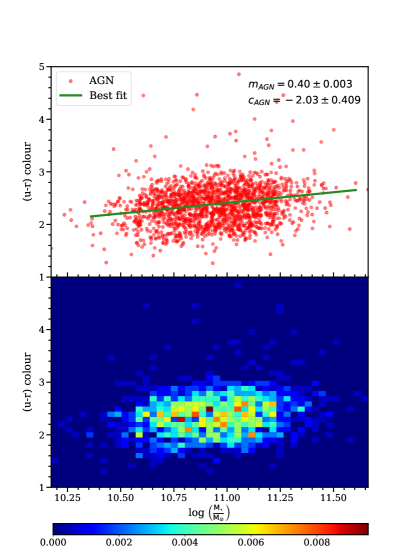
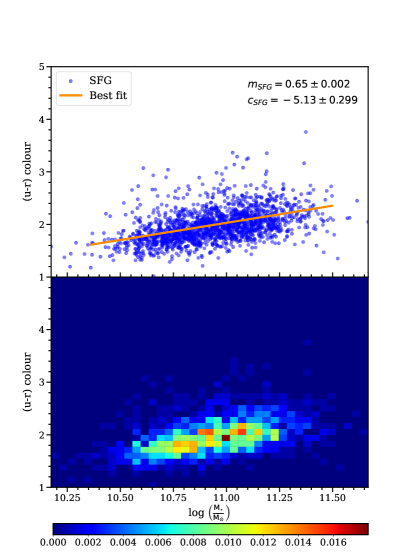
The top left and top right panels of Figure 9 show the colour as a function of the stellar mass for the mass-matched AGN and SFG, respectively. The data for the AGN and SFG are fitted with a straight line , where is the colour and is the stellar mass. The fitted lines and the best fit parameters and are shown in the respective panels. We find that the colour-stellar mass relation is steeper for the SFG than for the AGN. The joint probability distributions of the colour and stellar mass for the AGN and SFG are shown in the bottom left and right panels of Figure 9, respectively. We note that the AGN are concentrated around the green valley () at all masses. Most of the SFG are located in the blue cloud () in the mass range .
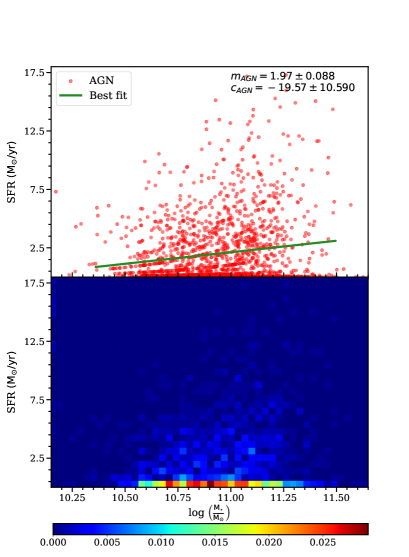
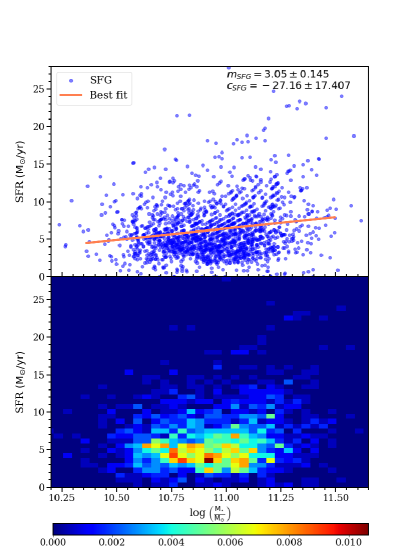
A similar analysis is carried out for the SFR-stellar mass relation in the Figure 10. The top two panels of Figure 10 show that the SFR-stellar mass relation for the AGN is noticeably flatter than that for the SFG. We also note that the SFR-stellar mass relations are significantly steeper than the colour-stellar mass relations for both AGN and SFG. The joint PDF for the SFR and stellar mass for the AGN is shown in the bottom left panel. It shows that AGN are mainly concentrated near yr, implying a possible suppression of star formation in their host galaxies. Given that most of the AGN reside in the transitional green valley (Figure 9), the AGN may have a role in the quenching of star formation in galaxies. The bottom right panel of Figure 10 shows that the SFG are concentrated over a broader range of SFR and occupy a larger area in the stellar mass-SFR plane. We observe a large scatter in the SFR-stellar mass relation for the AGN and SFG. The large scatter suggests that both the AGN and SFG in our sample are far from a homogeneous population. The degree of star formation rate in the SFG may vary for several different reasons other than their stellar mass. Similarly, the triggering of AGN and the suppression of SFR in their host galaxy may occur due to various physical processes.
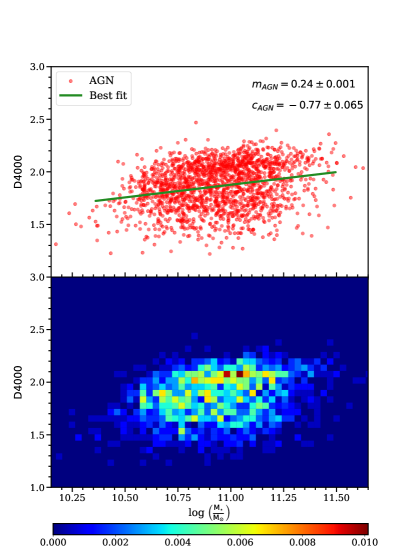
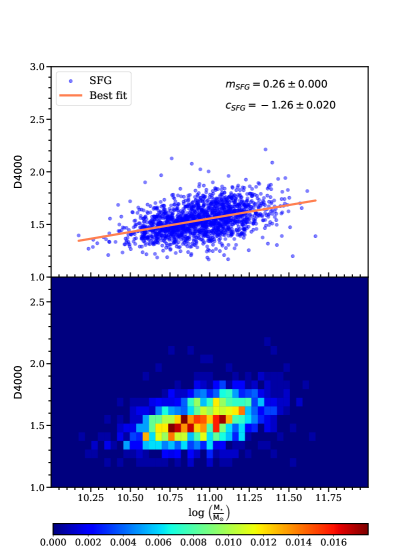
We study the relation between the break strength and the stellar mass for the AGN and SFG in the top two panels of Figure 11 respectively. The corresponding joint PDFs are shown in the bottom two panels of the same figure. We find that the D-stellar mass relations for the AGN and SFG have a similar slope. However, a diffuse distribution of the AGN in the stellar mass-D plane, shown in the bottom left panel of Figure 11, indicates that the mean stellar age of the AGN host galaxies can vary over a wide range at all masses. On the other hand, the bottom right panel of Figure 11 shows that the SFG are concentrated around D in the mass range . The lower mean stellar age of the SFG are indicative of a recently completed starburst in these galaxies. These results together hint that the AGN population is far more inhomogeneous than the population of SFG.
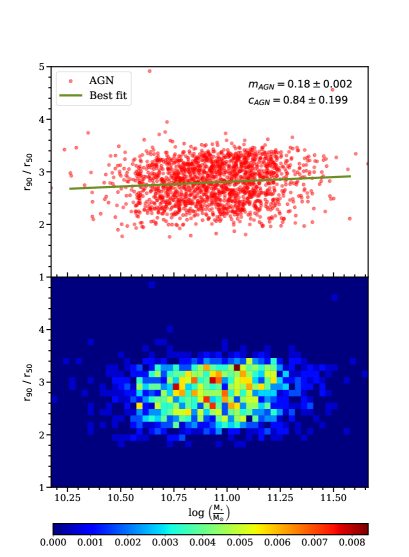
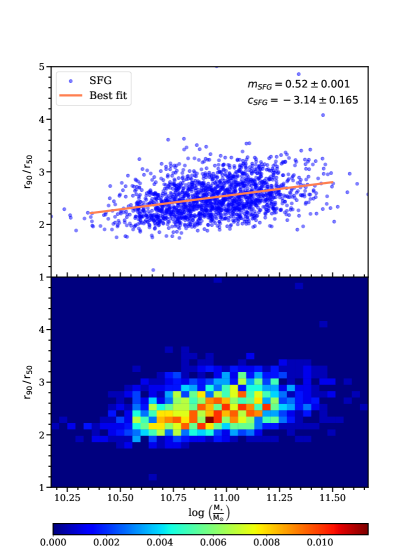
The relation between morphology and stellar mass for the AGN and SFG are shown in the Figure 12. The SFG and AGN are known to exhibit a preference for the disk-dominated and bulge-dominated systems respectively. The best fit line for the SFG is noticeably steeper than that for the AGN. It indicates a tighter correlation between concentration index and stellar mass for the SFG. The SFG with increasing stellar mass tends to be progressively bulge-dominated. The relatively flatter line for the AGN implies that the AGN activity preferably occurs in bulge-dominated galaxies. The joint PDF in the bottom left panel of Figure 12 also shows that the AGN have a preference for the bulge-dominated systems (>2.6). In the bottom right panel of Figure 12, we see that most of the SFG are disk dominated galaxies (<2.6).
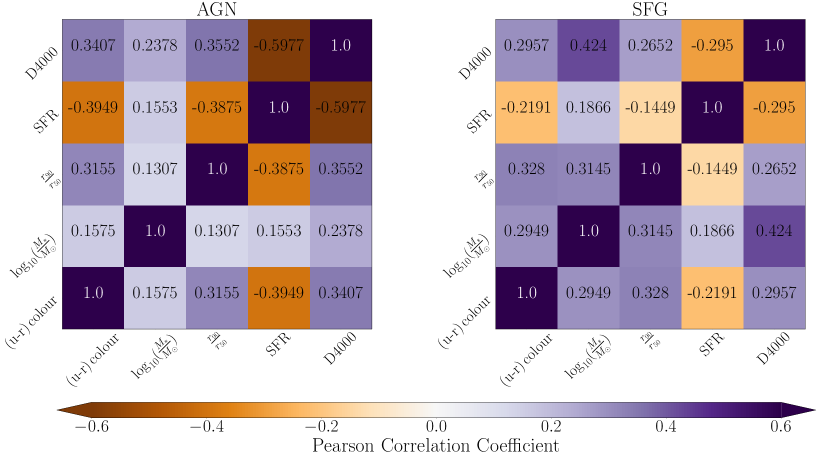
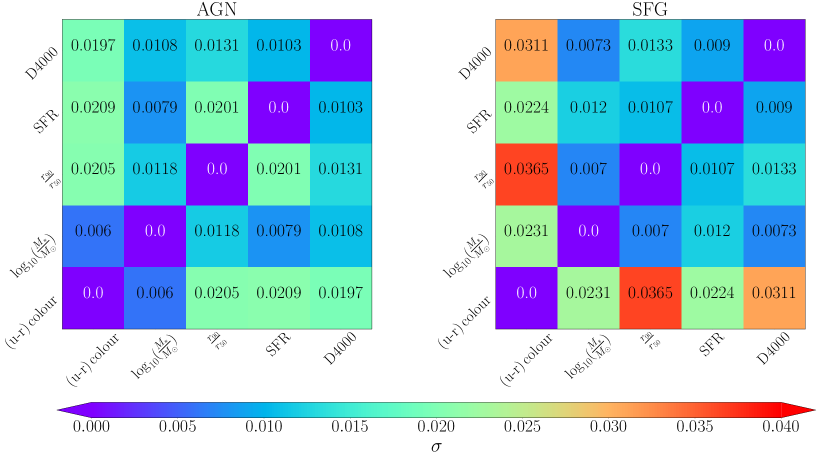
We analyze the mass dependence of colour, SFR, D and concentration index of the AGN and SFG in Figure 9, Figure 10, Figure 11 and Figure 12 respectively. Quantifying the correlations between all these properties would also be interesting. After matching their stellar mass distributions, we calculate the Pearson correlation coefficient (PCC) for the different pairs of physical properties of the AGN and SFG. The values of the PCC for different pairs of galaxy properties for the two populations are separately shown in the upper two panels of Figure 13. The 1 errors associated with these measurements are shown in the bottom two panels of Figure 13. The 1 errors are estimated using 10 jackknife samples drawn from the original datasets.
We find that the stellar mass has a positive correlation with colour, SFR, D and concentration index for both AGN and SFG. The stellar mass-colour, stellar mass-concentration index and stellar mass-D correlations are significantly stronger for the SFG than those observed for the AGN.
We now discuss the correlations between the four galaxy properties at fixed stellar mass. The colour and concentration index has a positive correlation of similar amplitude for both classes, implying that the change in colour with the morphology is not significantly different in the star-forming galaxies and the galaxies hosting AGN. The colour-D correlation is somewhat stronger for the AGN than SFG, indicating that the correlation between the recent star formation history and colour is tighter for the AGN. The colour and SFR are anticorrelated for both AGN and SFG, but the degree of anticorrelation is much stronger for the AGN. It suggests that the colour of the AGN are impacted by the suppression of SFR to a greater degree. The concentration index and D are positively correlated for both classes but the correlations are significantly stronger in AGN. Thus the morphology and the star formation history has a tighter relation in the AGN. The SFR is anticorrelated with the D and the concentration index for both AGN and SFG. Strikingly, the degree of anticorrelations for AGN are times higher than those observed for the SFG. The PCC values for each pair of properties are significantly larger than the associated 1 errors. The smaller values of the 1 errors indicate that the observed differences between the PCCs for the AGN and SFG are statistically significant in most cases. We find the strongest differences for the correlations/anticorrelations of the star formation rate and the recent star formation history with the other galaxy properties. We try to understand these differences in the context of our work.
The gas content is known to play a key role in both star formation and AGN activity [92, 123, 124, 125]. Galaxies consume their gas reservoir through star formation. They convert a fraction of their gas reservoir into stars over every dynamical time. The gas reservoir will eventually get depleted over a long time ( Gyr) depending on its size. The galaxies acquire gas for their growth through hot and cold modes of accretion. The gas inflow in galaxies can lead to rapid central black hole growth and subsequent onset of AGN activity. The AGN feedback can also deplete the surrounding cold gas reservoir, leading the galaxy to a gas-poor quiescent system. [118] analyze the black hole growth in the low-redshift galaxies and find that the growth is regulated by the supply of cold gas in the galaxy bulge. Once the gas in the bulge is exhausted, the growth is further sustained by the mass loss from the evolved stars in the bulge. They report that the accretion rate onto the black hole is proportional to the bulge mass, where the constant of proportionality depends on the age of the bulge stellar population. It is also well known that the mass of the central black hole is tightly correlated with the bulge mass and the properties of the stellar bulge [126, 127].
The anticorrelations of the SFR with the concentration index, D and colour are times stronger in the AGN host galaxies compared to those seen in SFG. The stronger anticorrelations suggest that the bulge size and the age of the stellar population in the host galaxy play crucial roles in the AGN activity and the subsequent quenching. Our results are consistent with the findings reported in the earlier works [32, 33, 34, 35]. Finally, the most critical factors required for the AGN activity are the stellar mass, the bulge mass, the age of the bulge stellar population and the availability of gas in the nuclear regions of the galaxies. The presence of bar, galaxy interactions and mergers can also indirectly affect the AGN activity by influencing the central gas supply [54, 128, 129, 130].
4 Conclusions
We analyze a volume limited sample from the SDSS to compare the clustering and the physical properties of the star-forming galaxies and the AGN host galaxies at fixed stellar mass. Our analysis shows that the AGN are more strongly clustered than SFG on smaller scales. A comparison of the nearest neighbour distributions for the AGN and SFG shows that the AGN resides in denser environments than SFG. These findings are consistent with several previous studies [46, 47, 48, 49, 50, 28, 53], reaffirming that the spatial distributions of the two populations are significantly different.
We compare the distributions of colour, concentration index, SFR and D for the AGN and SFG at fixed stellar mass and find that they are different in a statistically significant manner (at confidence level). The distributions are also compared at different densities and fixed stellar mass, showing that the differences persist in both the high and low density regions (Figure 8). The differences between the physical properties of the AGN and SFG can not be ascribed to the density of their locations. The density may play an indirect role through the increased likelihood of galaxy interactions. The gas in the relaxed systems would not be able to sink towards the central SMBH due to the conservation of angular momentum. The torques or the instabilities generated during the interactions funnel the gas towards the central SMBH, triggering the AGN activity [131, 132]. The distributions of the physical properties of the AGN and SFG differ statistically at the same significance level in high and low density regions. The differences in the low density regions suggest that AGN can be also fed via secular processes. Our results are consistent with earlier studies that show that AGN activity can occur in a wide variety of environments [61, 81, 29, 82, 83, 62, 84, 45, 85, 86].
The galaxies at fixed stellar mass may have widely different assembly histories. We note that the presence of a bulge and the gas availability are the two most essential requirements for the AGN activity, which agrees well with the earlier studies on the topic [32, 33, 34, 35]. The favourable conditions for the AGN activity will occur in only some galaxies at a given stellar mass. The fraction of galaxies having these favourable conditions would depend on both the stellar mass and the assembly history of the galaxies. Studies show that the frequency of the bulge increases with the stellar mass [133] and depends on the assembly history [134]. A study with hydrodynamical simulations shows that the assembly bias can lead to wide variations of the cold gas content in galaxies [135]. They find that the galaxies with high stellar masses tend to live in early-formed halos, which can accumulate large cold gas fractions. The amount of cold gas thus depends on both the stellar mass and the assembly history of the halos. The fact that the AGN fraction increases with the stellar mass is related to the availability of large amounts of gas and a higher likelihood of bulge-domination in more massive galaxies. Further, the more massive halos reside in the denser environments where they encounter frequent interactions.
A limitation of our clustering analysis is that the spatial distributions of the AGN and SFG are analyzed in redshift space. The redshift space distortions would affect the clustering of AGN and SFG. The two-point correlation function in redshift space is not well represented by a universal power law on all scales. However, a powerlaw fit is a reasonably good approximation on smaller scales [136]. We fitted the two-point correlation functions for the AGN and SFG on scales Mpc. The analysis are carried out in the redshift space for both classes. The two-point correlation function for AGN tends to have a larger correlation length and a shallower slope than the SFG at fixed stellar mass (Table 1). [101] show that the assembly bias can change the two-point correlation function by for the galaxies with different luminosity or colour. Several other works show that the galaxy morphology and colour are significantly impacted by the assembly bias and the large-scale environment [137, 138, 139]. We suggest that the differences in the spatial distributions of the AGN and SFG at fixed stellar mass may arise due to the assembly bias.
Due to a wide variation in the assembly history, whether a galaxy of a given stellar mass would provide suitable conditions for the AGN activity remains uncertain. These uncertainties could be responsible for the larger scatter in the physical properties of the AGN compared to the SFG (Figure 9-Figure 12). The assembly bias makes it difficult to single out the physical processes responsible for igniting the AGN activity in galaxies. Our analysis suggests that the assembly bias plays an important role in deciding the incidence of AGN activity in galaxies. However, the relationship between the assembly bias and the AGN activity is complex. One needs to disentangle the interplay between the formation history of the galaxies, the properties of their host dark matter halos, and the triggering and regulation of AGN activity to better understand the potential influence of assembly bias on the AGN activity. We plan to use hydrodynamical simulations such as EAGLE [140] and Illustris [141] to explore these issues in future works.
ACKNOWLEDGEMENT
BP would like to acknowledge financial support from the SERB, DST, Government of India through the project CRG/2019/001110. BP would also like to acknowledge IUCAA, Pune, for providing support through the associateship programme. AN acknowledges the financial support from the Department of Science and Technology (DST), Government of India through an INSPIRE fellowship. The authors thank Tapas Kumar Das for some interesting discussions.
Funding for the SDSS and SDSS-II has been provided by the Alfred P. Sloan Foundation, the Participating Institutions, the National Science Foundation, the U.S. Department of Energy, the National Aeronautics and Space Administration, the Japanese Monbukagakusho, the Max Planck Society, and the Higher Education Funding Council for England. The SDSS website is http://www.sdss.org/.
The SDSS is managed by the Astrophysical Research Consortium for the Participating Institutions. The Participating Institutions are the American Museum of Natural History, Astrophysical Institute Potsdam, University of Basel, University of Cambridge, Case Western Reserve University, University of Chicago, Drexel University, Fermilab, the Institute for Advanced Study, the Japan Participation Group, Johns Hopkins University, the Joint Institute for Nuclear Astrophysics, the Kavli Institute for Particle Astrophysics and Cosmology, the Korean Scientist Group, the Chinese Academy of Sciences (LAMOST), Los Alamos National Laboratory, the Max-Planck-Institute for Astronomy (MPIA), the Max-Planck-Institute for Astrophysics (MPA), New Mexico State University, Ohio State University, University of Pittsburgh, University of Portsmouth, Princeton University, the United States Naval Observatory, and the University of Washington.
References
- [1] A.C. Fabian, Active Galactic Nuclei, Proceedings of the National Academy of Science 96 (1999) 4749.
- [2] J.-H. Woo and C.M. Urry, Active Galactic Nucleus Black Hole Masses and Bolometric Luminosities, ApJ 579 (2002) 530 [astro-ph/0207249].
- [3] Y.-F. Jiang, J.M. Stone and S.W. Davis, On the Thermal Stability of Radiation-dominated Accretion Disks, ApJ 778 (2013) 65 [1309.5646].
- [4] S. Cielo, R. Bieri, M. Volonteri, A.Y. Wagner and Y. Dubois, AGN feedback compared: jets versus radiation, MNRAS 477 (2018) 1336 [1712.03955].
- [5] D. Kawata and B.K. Gibson, Self-regulated active galactic nuclei heating in elliptical galaxies, MNRAS 358 (2005) L16 [astro-ph/0409068].
- [6] V. Antonuccio-Delogu and J. Silk, Active galactic nuclei activity: self-regulation from backflow, MNRAS 405 (2010) 1303.
- [7] A.Y. Wagner, M. Umemura and G.V. Bicknell, Ultrafast Outflows: Galaxy-scale Active Galactic Nucleus Feedback, ApJ Letters 763 (2013) L18 [1211.5851].
- [8] R. Morganti, The many routes to AGN feedback, Frontiers in Astronomy and Space Sciences 4 (2017) 42 [1712.05301].
- [9] D. Baron, H. Netzer, J.X. Prochaska, Z. Cai, S. Cantalupo, D.C. Martin et al., Direct evidence of AGN feedback: a post-starburst galaxy stripped of its gas by AGN-driven winds, MNRAS 480 (2018) 3993 [1804.03150].
- [10] F. Santoro, C. Tadhunter, D. Baron, R. Morganti and J. Holt, AGN-driven outflows and the AGN feedback efficiency in young radio galaxies, A&A 644 (2020) A54 [2009.11175].
- [11] R.S. Somerville, P.F. Hopkins, T.J. Cox, B.E. Robertson and L. Hernquist, A semi-analytic model for the co-evolution of galaxies, black holes and active galactic nuclei, MNRAS 391 (2008) 481 [0808.1227].
- [12] J. Kormendy and L.C. Ho, Coevolution (Or Not) of Supermassive Black Holes and Host Galaxies, Annual Review of Astronomy and Astrophysics 51 (2013) 511 [1304.7762].
- [13] T.M. Heckman and P.N. Best, The Coevolution of Galaxies and Supermassive Black Holes: Insights from Surveys of the Contemporary Universe, Annual Review of Astronomy and Astrophysics 52 (2014) 589 [1403.4620].
- [14] C.M. Harrison, Impact of supermassive black hole growth on star formation, Nature Astronomy 1 (2017) 0165 [1703.06889].
- [15] P. Madau, H.C. Ferguson, M.E. Dickinson, M. Giavalisco, C.C. Steidel and A. Fruchter, High-redshift galaxies in the Hubble Deep Field: colour selection and star formation history to z~4, MNRAS 283 (1996) 1388 [astro-ph/9607172].
- [16] A.M. Hopkins, On the Evolution of Star-forming Galaxies, ApJ 615 (2004) 209 [astro-ph/0407170].
- [17] P.S. Behroozi, R.H. Wechsler and C. Conroy, The Average Star Formation Histories of Galaxies in Dark Matter Halos from z = 0-8, ApJ 770 (2013) 57 [1207.6105].
- [18] I. Strateva, Ž. Ivezić, G.R. Knapp, V.K. Narayanan, M.A. Strauss, J.E. Gunn et al., Color Separation of Galaxy Types in the Sloan Digital Sky Survey Imaging Data, AJ 122 (2001) 1861 [astro-ph/0107201].
- [19] M.R. Blanton, D.W. Hogg, N.A. Bahcall, I.K. Baldry, J. Brinkmann, I. Csabai et al., The Broadband Optical Properties of Galaxies with Redshifts 0.02<z<0.22, ApJ 594 (2003) 186 [astro-ph/0209479].
- [20] M.L. Balogh, I.K. Baldry, R. Nichol, C. Miller, R. Bower and K. Glazebrook, The Bimodal Galaxy Color Distribution: Dependence on Luminosity and Environment, ApJ Letters 615 (2004) L101 [astro-ph/0406266].
- [21] I.K. Baldry, K. Glazebrook, J. Brinkmann, Ž. Ivezić, R.H. Lupton, R.C. Nichol et al., Quantifying the Bimodal Color-Magnitude Distribution of Galaxies, ApJ 600 (2004) 681 [astro-ph/0309710].
- [22] B. Pandey, A method for classification of red, blue, and green galaxies using fuzzy set theory, MNRAS 499 (2020) L31 [2005.11678].
- [23] A. Das, B. Pandey and S. Sarkar, Do Minor Interactions Trigger Star Formation in Galaxy Pairs?, Research in Astronomy and Astrophysics 23 (2023) 095026 [2207.03968].
- [24] K. Nandra, A. Georgakakis, C.N.A. Willmer, M.C. Cooper, D.J. Croton, M. Davis et al., AEGIS: The Color-Magnitude Relation for X-Ray-selected Active Galactic Nuclei, ApJ Letters 660 (2007) L11 [astro-ph/0607270].
- [25] G. Hasinger, Absorption properties and evolution of active galactic nuclei, A&A 490 (2008) 905 [0808.0260].
- [26] J.D. Silverman, V. Mainieri, B.D. Lehmer, D.M. Alexander, F.E. Bauer, J. Bergeron et al., The Evolution of AGN Host Galaxies: From Blue to Red and the Influence of Large-Scale Structures, ApJ 675 (2008) 1025 [0709.3455].
- [27] A. Cimatti, M. Brusa, M. Talia, M. Mignoli, G. Rodighiero, J. Kurk et al., Active Galactic Nucleus Feedback at z ~2 and the Mutual Evolution of Active and Inactive Galaxies, ApJ Letters 779 (2013) L13 [1311.4401].
- [28] Z. Zhang, H. Wang, W. Luo, H.J. Mo, Z. Liang, R. Li et al., Hosts and triggers of AGNs in the Local Universe, A&A 650 (2021) A155 [2012.10640].
- [29] V. Springel, T. Di Matteo and L. Hernquist, Modelling feedback from stars and black holes in galaxy mergers, MNRAS 361 (2005) 776 [astro-ph/0411108].
- [30] T. Di Matteo, V. Springel and L. Hernquist, Energy input from quasars regulates the growth and activity of black holes and their host galaxies, Nature 433 (2005) 604 [astro-ph/0502199].
- [31] D. Eckert, M. Gaspari, F. Gastaldello, A.M.C. Le Brun and E. O’Sullivan, Feedback from Active Galactic Nuclei in Galaxy Groups, Universe 7 (2021) 142 [2106.13259].
- [32] I. Ruffa, T.A. Davis, I. Prandoni, R.A. Laing, R. Paladino, P. Parma et al., The AGN fuelling/feedback cycle in nearby radio galaxies - II. Kinematics of the molecular gas, MNRAS 489 (2019) 3739 [1908.09229].
- [33] J. Shangguan, L.C. Ho, F.E. Bauer, R. Wang and E. Treister, AGN Feedback and Star Formation of Quasar Host Galaxies: Insights from the Molecular Gas, ApJ 899 (2020) 112 [2007.11286].
- [34] S.L. Ellison, T. Wong, S.F. Sánchez, D. Colombo, A. Bolatto, J. Barrera-Ballesteros et al., The EDGE-CALIFA survey: central molecular gas depletion in AGN host galaxies - a smoking gun for quenching?, MNRAS 505 (2021) L46 [2105.02916].
- [35] V.M. Sampaio, A. Aragón-Salamanca, M.R. Merrifield, R.R. de Carvalho, S. Zhou and I. Ferreras, The co-evolution of strong AGN and central galaxies in different environments, MNRAS 524 (2023) 5327 [2307.10435].
- [36] A. Georgakakis, J. Comparat, A. Merloni, L. Ciesla, J. Aird and A. Finoguenov, Exploring the halo occupation of AGN using dark-matter cosmological simulations, MNRAS 487 (2019) 275 [1812.04025].
- [37] J. Aird and A.L. Coil, The AGN-galaxy-halo connection: the distribution of AGN host halo masses to z = 2.5, MNRAS 502 (2021) 5962 [2010.02957].
- [38] W. Luo, J.D. Silverman, S. More, A. Goulding, H. Miyatake, T. Nishimichi et al., Dark matter halos of luminous AGNs from galaxy-galaxy lensing with the HSC Subaru Strategic Program, arXiv e-prints (2022) arXiv:2204.03817 [2204.03817].
- [39] J.S. Dunlop, R.J. McLure, M.J. Kukula, S.A. Baum, C.P. O’Dea and D.H. Hughes, Quasars, their host galaxies and their central black holes, MNRAS 340 (2003) 1095 [astro-ph/0108397].
- [40] M. Brusa, F. Fiore, P. Santini, A. Grazian, A. Comastri, G. Zamorani et al., Black hole growth and starburst activity at z = 0.6-4 in the Chandra Deep Field South. Host galaxies properties of obscured AGN, A&A 507 (2009) 1277 [0910.1007].
- [41] K.A. Pimbblet, S.S. Shabala, C.P. Haines, A. Fraser-McKelvie and D.J.E. Floyd, The drivers of AGN activity in galaxy clusters: AGN fraction as a function of mass and environment, MNRAS 429 (2013) 1827 [1212.0261].
- [42] B. Pandey and S. Sarkar, Exploring galaxy colour in different environments of the cosmic web with SDSS, MNRAS 498 (2020) 6069 [2002.08400].
- [43] A. Das, B. Pandey and S. Sarkar, Galaxy Interactions in Filaments and Sheets: Effects of the Large-scale Structures Versus the Local Density, Research in Astronomy and Astrophysics 23 (2023) 025016 [2209.14194].
- [44] A. Das, B. Pandey and S. Sarkar, Galaxy interactions in filaments and sheets: insights from EAGLE simulations, arXiv e-prints (2023) arXiv:2303.16826 [2303.16826].
- [45] H. Umehata, M. Fumagalli, I. Smail, Y. Matsuda, A.M. Swinbank, S. Cantalupo et al., Gas filaments of the cosmic web located around active galaxies in a protocluster, Science 366 (2019) 97 [1910.01324].
- [46] R. Gilli, G. Zamorani, T. Miyaji, J. Silverman, M. Brusa, V. Mainieri et al., The spatial clustering of X-ray selected AGN in the XMM-COSMOS field, A&A 494 (2009) 33 [0810.4769].
- [47] R. Mandelbaum, C. Li, G. Kauffmann and S.D.M. White, Halo masses for optically selected and for radio-loud AGN from clustering and galaxy-galaxy lensing, MNRAS 393 (2009) 377 [0806.4089].
- [48] W. Kollatschny, A. Reichstein and M. Zetzl, The environment of AGNs and the activity degree of their surrounding galaxies, A&A 548 (2012) A37 [1210.6854].
- [49] E. Donoso, L. Yan, D. Stern and R.J. Assef, The Angular Clustering of WISE-selected Active Galactic Nuclei: Different Halos for Obscured and Unobscured Active Galactic Nuclei, ApJ 789 (2014) 44 [1309.2277].
- [50] C.L. Hale, M.J. Jarvis, I. Delvecchio, P.W. Hatfield, M. Novak, V. Smolčić et al., The clustering and bias of radio-selected AGN and star-forming galaxies in the COSMOS field, MNRAS 474 (2018) 4133 [1711.05201].
- [51] S. Satyapal, S.L. Ellison, W. McAlpine, R.C. Hickox, D.R. Patton and J.T. Mendel, Galaxy pairs in the Sloan Digital Sky Survey - IX. Merger-induced AGN activity as traced by the Wide-field Infrared Survey Explorer, MNRAS 441 (2014) 1297 [1403.7531].
- [52] J. Lee, J. Shin, O.N. Snaith, Y. Kim, C.G. Few, J. Devriendt et al., The Horizon Run 5 Cosmological Hydrodynamical Simulation: Probing Galaxy Formation from Kilo- to Gigaparsec Scales, ApJ 908 (2021) 11 [2006.01039].
- [53] A. Singh, C. Park, E. Choi, J. Kim, H. Jun, B.K. Gibson et al., On the Effects of Local Environment on Active Galactic Nucleus (AGN) in the Horizon Run 5 Simulation, ApJ 953 (2023) 64 [2308.01584].
- [54] M.S. Alonso, D.G. Lambas, P. Tissera and G. Coldwell, Active galactic nuclei and galaxy interactions, MNRAS 375 (2007) 1017 [astro-ph/0701192].
- [55] S.L. Ellison, D.R. Patton, J.T. Mendel and J.M. Scudder, Galaxy pairs in the Sloan Digital Sky Survey - IV. Interactions trigger active galactic nuclei, MNRAS 418 (2011) 2043 [1108.2711].
- [56] T. Storchi-Bergmann and A. Schnorr-Müller, Observational constraints on the feeding of supermassive black holes, Nature Astronomy 3 (2019) 48 [1904.03338].
- [57] P.F. Hopkins and L. Hernquist, Fueling Low-Level AGN Activity through Stochastic Accretion of Cold Gas, ApJS 166 (2006) 1 [astro-ph/0603180].
- [58] A. Dekel, R. Sari and D. Ceverino, Formation of Massive Galaxies at High Redshift: Cold Streams, Clumpy Disks, and Compact Spheroids, ApJ 703 (2009) 785 [0901.2458].
- [59] P.F. Hopkins, D.D. Kocevski and K. Bundy, Do we expect most AGN to live in discs?, MNRAS 445 (2014) 823 [1309.6321].
- [60] B. Moore, N. Katz, G. Lake, A. Dressler and A. Oemler, Galaxy harassment and the evolution of clusters of galaxies, Nature 379 (1996) 613 [astro-ph/9510034].
- [61] L. Hernquist, Tidal triggering of starbursts and nuclear activity in galaxies, Nature 340 (1989) 687.
- [62] D.M. Alexander and R.C. Hickox, What drives the growth of black holes?, New Astronomy Reviews 56 (2012) 93 [1112.1949].
- [63] J.E. Gunn and I. Gott, J. Richard, On the Infall of Matter Into Clusters of Galaxies and Some Effects on Their Evolution, ApJ 176 (1972) 1.
- [64] M.G. Abadi, B. Moore and R.G. Bower, Ram pressure stripping of spiral galaxies in clusters, MNRAS 308 (1999) 947 [astro-ph/9903436].
- [65] A. Boselli, M. Fossati and M. Sun, Ram pressure stripping in high-density environments, The Astronomy and Astrophysics Review 30 (2022) 3 [2109.13614].
- [66] R.B. Larson, B.M. Tinsley and C.N. Caldwell, The evolution of disk galaxies and the origin of S0 galaxies, ApJ 237 (1980) 692.
- [67] Y. Peng, R. Maiolino and R. Cochrane, Strangulation as the primary mechanism for shutting down star formation in galaxies, Nature 521 (2015) 192 [1505.03143].
- [68] S. Ehlert, A. von der Linden, S.W. Allen, W.N. Brandt, Y.Q. Xue, B. Luo et al., X-ray bright active galactic nuclei in massive galaxy clusters - II. The fraction of galaxies hosting active nuclei, MNRAS 437 (2014) 1942 [1310.5711].
- [69] P.A.A. Lopes, A.L.B. Ribeiro and S.B. Rembold, NoSOCS in SDSS - VI. The environmental dependence of AGN in clusters and field in the local Universe, MNRAS 472 (2017) 409 [1708.02242].
- [70] E. Koulouridis, M. Ricci, P. Giles, C. Adami, M. Ramos-Ceja, M. Pierre et al., The XXL Survey. XXXV. The role of cluster mass in AGN activity, A&A 620 (2018) A20 [1809.00683].
- [71] M. Pierre, F. Pacaud, C. Adami, S. Alis, B. Altieri, N. Baran et al., The XXL Survey. I. Scientific motivations - XMM-Newton observing plan - Follow-up observations and simulation programme, A&A 592 (2016) A1 [1512.04317].
- [72] H.D. Mishra and X. Dai, Lower AGN Abundance in Galaxy Clusters at z < 0.5, AJ 159 (2020) 69 [1912.10342].
- [73] H. Böhringer, W. Voges, J.P. Huchra, B. McLean, R. Giacconi, P. Rosati et al., The Northern ROSAT All-Sky (NORAS) Galaxy Cluster Survey. I. X-Ray Properties of Clusters Detected as Extended X-Ray Sources, ApJS 129 (2000) 435 [astro-ph/0003219].
- [74] L. Ceccarelli, F. Duplancic and D. Garcia Lambas, The impact of void environment on AGN, arXiv e-prints (2021) arXiv:2111.11488 [2111.11488].
- [75] N.A. Grogin and M.J. Geller, An Imaging and Spectroscopic Survey of Galaxies within Prominent Nearby Voids. II. Morphologies, Star Formation, and Faint Companions, AJ 119 (2000) 32 [astro-ph/9910096].
- [76] F. Hoyle, R.R. Rojas, M.S. Vogeley and J. Brinkmann, The Luminosity Function of Void Galaxies in the Sloan Digital Sky Survey, ApJ 620 (2005) 618 [astro-ph/0309728].
- [77] E. Ricciardelli, A. Cava, J. Varela and V. Quilis, The star formation activity in cosmic voids, MNRAS 445 (2014) 4045 [1410.0023].
- [78] S.T. Bruton, X. Dai, E. Guerras and F.A. Munshi, Deficit of luminous and normal red galaxies in cosmic voids, MNRAS 491 (2020) 2496 [1910.04750].
- [79] A. Constantin, F. Hoyle and M.S. Vogeley, Active Galactic Nuclei in Void Regions, ApJ 673 (2008) 715 [0710.1631].
- [80] G. Kauffmann, T.M. Heckman, C. Tremonti, J. Brinchmann, S. Charlot, S.D.M. White et al., The host galaxies of active galactic nuclei, MNRAS 346 (2003) 1055 [astro-ph/0304239].
- [81] G. Kauffmann, S.D.M. White, T.M. Heckman, B. Ménard, J. Brinchmann, S. Charlot et al., The environmental dependence of the relations between stellar mass, structure, star formation and nuclear activity in galaxies, MNRAS 353 (2004) 713 [astro-ph/0402030].
- [82] R. Gilmour, M.E. Gray, O. Almaini, P. Best, C. Wolf, K. Meisenheimer et al., Environmental dependence of active galactic nuclei activity in the supercluster A901/2, MNRAS 380 (2007) 1467 [0707.1517].
- [83] Y.-Y. Choi, J.-H. Woo and C. Park, Environmental Dependence of Active Galactic Nucleus Activity. I. The Effects of Host Galaxy, ApJ 699 (2009) 1679 [0904.2579].
- [84] J. Sabater, P.N. Best and M. Argudo-Fernández, Effect of the interactions and environment on nuclear activity, MNRAS 430 (2013) 638 [1212.4836].
- [85] H. Miraghaei, The Effect of Environment on AGN Activity: The Properties of Radio and Optical AGN in Void, Isolated, and Group Galaxies, AJ 160 (2020) 227 [2102.11331].
- [86] H.D. Mishra, X. Dai and E. Guerras, Active Galactic Nuclei Abundance in Cosmic Voids, ApJ Letters 922 (2021) L17 [2111.05503].
- [87] J.D. Silverman, K. Kovač, C. Knobel, S. Lilly, M. Bolzonella, F. Lamareille et al., The Environments of Active Galactic Nuclei within the zCOSMOS Density Field, ApJ 695 (2009) 171 [0812.3402].
- [88] E.J. Bradshaw, O. Almaini, W.G. Hartley, R.W. Chuter, C. Simpson, C.J. Conselice et al., Environments of active galactic nuclei at z < 1.5 in the UKIDSS Ultra-Deep Survey, MNRAS 415 (2011) 2626 [1104.2904].
- [89] C.J. Miller, R.C. Nichol, P.L. Gómez, A.M. Hopkins and M. Bernardi, The Environment of Active Galactic Nuclei in the Sloan Digital Sky Survey, ApJ 597 (2003) 142 [astro-ph/0307124].
- [90] P. Martini, J.S. Mulchaey and D.D. Kelson, The Distribution of Active Galactic Nuclei in Clusters of Galaxies, ApJ 664 (2007) 761 [0704.3455].
- [91] B. Pandey and S. Bharadwaj, Exploring star formation using the filaments in the Sloan Digital Sky Survey Data Release Five, MNRAS 387 (2008) 767 [0804.0072].
- [92] J. Sabater, P.N. Best and T.M. Heckman, Triggering optical AGN: the need for cold gas, and the indirect roles of galaxy environment and interactions, MNRAS 447 (2015) 110 [1411.5031].
- [93] A. Amiri, S. Tavasoli and G. De Zotti, Role of Environment on Nuclear Activity, ApJ 874 (2019) 140 [1902.08757].
- [94] Z.-y. Man, Y.-j. Peng, X. Kong, K.-x. Guo, C.-p. Zhang and J. Dou, The dependence of AGN activity on environment in SDSS, MNRAS 488 (2019) 89 [1907.01563].
- [95] N. Porqueres, J. Jasche, T.A. Enßlin and G. Lavaux, Imprints of the large-scale structure on AGN formation and evolution, A&A 612 (2018) A31 [1710.07641].
- [96] L. Wang and C. Li, Revisiting the clustering of narrow-line AGN in the local Universe: Joint dependence on stellar mass and colour, MNRAS 483 (2019) 1452 [1807.06395].
- [97] C. Stoughton, R.H. Lupton, M. Bernardi, M.R. Blanton, S. Burles, F.J. Castander et al., Sloan Digital Sky Survey: Early Data Release, AJ 123 (2002) 485.
- [98] L. Gao, V. Springel and S.D.M. White, The age dependence of halo clustering, MNRAS 363 (2005) L66 [astro-ph/0506510].
- [99] R.H. Wechsler, A.R. Zentner, J.S. Bullock, A.V. Kravtsov and B. Allgood, The Dependence of Halo Clustering on Halo Formation History, Concentration, and Occupation, ApJ 652 (2006) 71 [astro-ph/0512416].
- [100] L. Gao and S.D.M. White, Assembly bias in the clustering of dark matter haloes, MNRAS 377 (2007) L5 [astro-ph/0611921].
- [101] D.J. Croton, L. Gao and S.D.M. White, Halo assembly bias and its effects on galaxy clustering, MNRAS 374 (2007) 1303 [astro-ph/0605636].
- [102] Planck Collaboration, N. Aghanim, Y. Akrami, M. Ashdown, J. Aumont, C. Baccigalupi et al., Planck 2018 results. VI. Cosmological parameters, A&A 641 (2020) A6 [1807.06209].
- [103] Abdurro’uf, K. Accetta, C. Aerts, V. Silva Aguirre, R. Ahumada, N. Ajgaonkar et al., The Seventeenth Data Release of the Sloan Digital Sky Surveys: Complete Release of MaNGA, MaStar, and APOGEE-2 Data, ApJS 259 (2022) 35 [2112.02026].
- [104] J.E. Gunn, W.A. Siegmund, E.J. Mannery, R.E. Owen, C.L. Hull, R.F. Leger et al., The 2.5 m Telescope of the Sloan Digital Sky Survey, AJ 131 (2006) 2332 [astro-ph/0602326].
- [105] M.A. Strauss, D.H. Weinberg, R.H. Lupton, V.K. Narayanan, J. Annis, M. Bernardi et al., Spectroscopic Target Selection in the Sloan Digital Sky Survey: The Main Galaxy Sample, AJ 124 (2002) 1810 [astro-ph/0206225].
- [106] C. Conroy, J.E. Gunn and M. White, The Propagation of Uncertainties in Stellar Population Synthesis Modeling. I. The Relevance of Uncertain Aspects of Stellar Evolution and the Initial Mass Function to the Derived Physical Properties of Galaxies, ApJ 699 (2009) 486 [0809.4261].
- [107] G. Bruzual A., Spectral evolution of galaxies. I. Early-type systems., ApJ 273 (1983) 105.
- [108] K. Shimasaku, M. Fukugita, M. Doi, M. Hamabe, T. Ichikawa, S. Okamura et al., Statistical Properties of Bright Galaxies in the Sloan Digital Sky Survey Photometric System, AJ 122 (2001) 1238 [astro-ph/0105401].
- [109] J. Brinchmann, S. Charlot, S.D.M. White, C. Tremonti, G. Kauffmann, T. Heckman et al., The physical properties of star-forming galaxies in the low-redshift Universe, MNRAS 351 (2004) 1151 [astro-ph/0311060].
- [110] S.D. Landy and A.S. Szalay, Bias and Variance of Angular Correlation Functions, ApJ 412 (1993) 64.
- [111] S. Casertano and P. Hut, Core radius and density measurements in N-body experiments Connections with theoretical and observational definitions, ApJ 298 (1985) 80.
- [112] G. Kauffmann, T.M. Heckman, S.D.M. White, S. Charlot, C. Tremonti, E.W. Peng et al., The dependence of star formation history and internal structure on stellar mass for 105 low-redshift galaxies, MNRAS 341 (2003) 54 [astro-ph/0205070].
- [113] Y. Birnboim and A. Dekel, Virial shocks in galactic haloes?, MNRAS 345 (2003) 349 [astro-ph/0302161].
- [114] A. Dekel and Y. Birnboim, Galaxy bimodality due to cold flows and shock heating, MNRAS 368 (2006) 2 [astro-ph/0412300].
- [115] D. Kereš, N. Katz, D.H. Weinberg and R. Davé, How do galaxies get their gas?, MNRAS 363 (2005) 2 [astro-ph/0407095].
- [116] J.M. Gabor, R. Davé, K. Finlator and B.D. Oppenheimer, How is star formation quenched in massive galaxies?, MNRAS 407 (2010) 749 [1001.1734].
- [117] A. Cooray and R. Sheth, Halo models of large scale structure, Physics Reports 372 (2002) 1 [astro-ph/0206508].
- [118] G. Kauffmann and T.M. Heckman, Feast and Famine: regulation of black hole growth in low-redshift galaxies, MNRAS 397 (2009) 135 [0812.1224].
- [119] M.R. Blanton, J. Dalcanton, D. Eisenstein, J. Loveday, M.A. Strauss, M. SubbaRao et al., The Luminosity Function of Galaxies in SDSS Commissioning Data, AJ 121 (2001) 2358 [astro-ph/0012085].
- [120] S. Alonso, G. Coldwell and D.G. Lambas, AGN spiral galaxies in groups: effects of bars, A&A 572 (2014) A86 [1410.0902].
- [121] A. Zezas, L. Hernquist, G. Fabbiano and J. Miller, NGC 4261 and NGC 4697: Rejuvenated Elliptical Galaxies, ApJ Letters 599 (2003) L73 [astro-ph/0310567].
- [122] I. Lacerna, H.M. Hernández-Toledo, V. Avila-Reese, J. Abonza-Sane and A. del Olmo, Isolated elliptical galaxies in the local Universe, A&A 588 (2016) A79 [1511.08809].
- [123] S.L. Ellison, T. Brown, B. Catinella and L. Cortese, Atomic gas fractions in active galactic nucleus host galaxies, MNRAS 482 (2019) 5694 [1811.08448].
- [124] H.M. Yesuf and L.C. Ho, Gas Content Regulates the Life Cycle of Star Formation and Black Hole Accretion in Galaxies, ApJ 901 (2020) 42 [2007.12026].
- [125] H. Guo, M.G. Jones and J. Wang, Cold Gas Reservoirs of Low- and High-mass Central Galaxies Differ in Response to Active Galactic Nucleus Feedback, ApJ Letters 933 (2022) L12 [2206.08399].
- [126] N. Häring and H.-W. Rix, On the Black Hole Mass-Bulge Mass Relation, ApJ Letters 604 (2004) L89 [astro-ph/0402376].
- [127] L. Ferrarese and D. Merritt, A Fundamental Relation between Supermassive Black Holes and Their Host Galaxies, ApJ Letters 539 (2000) L9 [astro-ph/0006053].
- [128] M.S. Alonso, G. Coldwell and D.G. Lambas, Effect of bars in AGN host galaxies and black hole activity, A&A 549 (2013) A141 [1211.5156].
- [129] M. Kim and Y.-Y. Choi, The Relative Role of Bars and Galaxy Environments in AGN Triggering of SDSS Spirals, ApJ Letters 901 (2020) L38 [2008.13100].
- [130] J.L. Steffen, H. Fu, J.R. Brownstein, J.M. Comerford, I. Cruz-González, Y. Sophia Dai et al., SDSS-IV MaNGA: How Galaxy Interactions Influence Active Galactic Nuclei, ApJ 942 (2023) 107 [2212.02677].
- [131] D.F. Woods and M.J. Geller, Minor Galaxy Interactions: Star Formation Rates and Galaxy Properties, AJ 134 (2007) 527 [astro-ph/0703729].
- [132] B. Rogers, I. Ferreras, S. Kaviraj, A. Pasquali and M. Sarzi, Star formation and nuclear activity in close pairs of early-type galaxies, MNRAS 399 (2009) 2172 [0905.3386].
- [133] P. Erwin and V.P. Debattista, The frequency and stellar-mass dependence of boxy/peanut-shaped bulges in barred galaxies, MNRAS 468 (2017) 2058 [1703.01602].
- [134] S.J. Kruk, P. Erwin, V.P. Debattista and C. Lintott, Revealing the cosmic evolution of boxy/peanut-shaped bulges from HST COSMOS and SDSS, MNRAS 490 (2019) 4721 [1910.04768].
- [135] W. Cui, R. Davé, J.A. Peacock, D. Anglés-Alcázar and X. Yang, The origin of galaxy colour bimodality in the scatter of the stellar-to-halo mass relation, Nature Astronomy 5 (2021) 1069 [2105.12145].
- [136] E. Hawkins, S. Maddox, S. Cole, O. Lahav, D.S. Madgwick, P. Norberg et al., The 2dF Galaxy Redshift Survey: correlation functions, peculiar velocities and the matter density of the Universe, MNRAS 346 (2003) 78 [astro-ph/0212375].
- [137] B. Pandey and S. Sarkar, How much a galaxy knows about its large-scale environment?: An information theoretic perspective, MNRAS 467 (2017) L6 [1611.00283].
- [138] S. Sarkar and B. Pandey, A study on the statistical significance of mutual information between morphology of a galaxy and its large-scale environment, MNRAS 497 (2020) 4077 [2003.13974].
- [139] S. Sarkar, B. Pandey and A. Das, On the origin of red spirals: does assembly bias play a role?, JCAP 2022 (2022) 024 [2111.11252].
- [140] J. Schaye, R.A. Crain, R.G. Bower, M. Furlong, M. Schaller, T. Theuns et al., The EAGLE project: simulating the evolution and assembly of galaxies and their environments, MNRAS 446 (2015) 521 [1407.7040].
- [141] D. Nelson, V. Springel, A. Pillepich, V. Rodriguez-Gomez, P. Torrey, S. Genel et al., The IllustrisTNG simulations: public data release, Computational Astrophysics and Cosmology 6 (2019) 2 [1812.05609].