[datatype=bibtex, overwrite] \map \step[fieldset=note, null] \step[fieldset=file, null] \step[fieldset=keywords, null] \step[fieldset=language, null] \step[fieldset=editor, null] \step[fieldset=annotation, null] \step[fieldset=abstract, null] \step[fieldset=location, null] \step[fieldset=urldate, null] \step[fieldset=url, null] \step[fieldset=publisher, null] \step[fieldset=booktitle, null] \step[fieldset=pages, null] \step[fieldset=issn, null] \step[fieldset=isbn, null] \step[fieldset=eventtitle, null] \step[fieldset=institution, null] \step[fieldset=eprint, null] \step[fieldset=eprinttype, null] \step[fieldset=eprintclass, null] \step[fieldset=edition, null] \step[fieldset=pagetotal, null] \map[overwrite] \step[fieldsource=shortjournal] \step[fieldset=journaltitle,origfieldval] \NewDocumentCommand\todocite[todo] \NewDocumentCommand\imarior m author=MK,color=ACMPurple!20,bordercolor=ACMPurple!50author=MK,color=ACMPurple!20,bordercolor=ACMPurple!50todo: author=MK,color=ACMPurple!20,bordercolor=ACMPurple!50#1 \NewDocumentCommand\marior m author=MK,color=ACMPurple!20,bordercolor=ACMPurple!50,inlineauthor=MK,color=ACMPurple!20,bordercolor=ACMPurple!50,inlinetodo: author=MK,color=ACMPurple!20,bordercolor=ACMPurple!50,inline#1 \NewDocumentCommand\ipatrickr m author=PK,color=ACMOrange!20,bordercolor=ACMOrange!50author=PK,color=ACMOrange!20,bordercolor=ACMOrange!50todo: author=PK,color=ACMOrange!20,bordercolor=ACMOrange!50#1 \NewDocumentCommand\patrickr m author=PK,color=ACMOrange!20,bordercolor=ACMOrange!50,inlineauthor=PK,color=ACMOrange!20,bordercolor=ACMOrange!50,inlinetodo: author=PK,color=ACMOrange!20,bordercolor=ACMOrange!50,inline#1 \NewDocumentCommand\istefanr m author=SR,color=ACMBlue!40,bordercolor=ACMBlue!50author=SR,color=ACMBlue!40,bordercolor=ACMBlue!50todo: author=SR,color=ACMBlue!40,bordercolor=ACMBlue!50#1 \NewDocumentCommand\stefanr m author=SR,color=ACMBlue!40,bordercolor=ACMBlue!50,inlineauthor=SR,color=ACMBlue!40,bordercolor=ACMBlue!50,inlinetodo: author=SR,color=ACMBlue!40,bordercolor=ACMBlue!50,inline#1 \ulposdef\bluehighlight \NewDocumentCommand\tip\bluehighlight Recommendation 1
Benchmarking Function Hook Latency in Cloud-Native Environments
Abstract
Researchers and engineers are increasingly adopting cloud-native technologies for application development and performance evaluation. While this has improved the reproducibility of benchmarks in the cloud, the complexity of cloud-native environments makes it difficult to run benchmarks reliably. Cloud-native applications are often instrumented or altered at runtime, by dynamically patching or hooking them, which introduces a significant performance overhead. Our work discusses the benchmarking-related pitfalls of the dominant cloud-native technology, Kubernetes, and how they affect performance measurements of dynamically patched or hooked applications. We present recommendations to mitigate these risks and demonstrate how an improper experimental setup can negatively impact latency measurements.
1 Introduction
Cloud-native technologies aim to build loosely coupled, resilient, observable, and secure systems [3]. Observability and security are typically achieved by dynamically instrumenting or altering already built applications with function hooks [2]. These are small pieces of code added to an application’s functions. In particular, security tools need to dynamically modify, redirect, or block specific execution patterns, which often results in significant performance penalties [7].
Careful benchmarking is required to measure the performance impact of such changes. Besides empirical standards for software benchmarking [9] and methodological principles for performance evaluation in cloud computing [6], we address benchmarking-related pitfalls of cloud-native environments with:
-
1.
Recommendations on how to measure the latency of function hooks in cloud-native environments.
-
2.
A demonstration of an improper experimental setup that makes hypothesis testing harder.
2 Cloud-Native Benchmark Suite
Cloud environments are frequently used to build complete benchmark suites, as they provide a well-reproducible environment [8]. A typical benchmark suite (Figure 1) consists of a system under test (SUT), e.g., the patched application, a load generator sending requests to that application, and a monitoring tool measuring performance metrics. Latency is often measured directly by the load generator.
In Kubernetes, workloads are organized into pods of one or more containers which share storage and networking resources. Physical or virtual machines that run these pods are called nodes.
When measuring latency, ensure that the load generator and the SUT are in separate containers within the same pod. Otherwise, additional network hops may distort the measurements.
If components of the benchmark suite need to be in separate pods, ensure that both pods are deployed on the same physical node, e.g., by specifying node restrictions in Kubernetes.
Weigh the benefits of a service mesh against its additional network overhead. Service meshes wrap each application behind a reverse proxy and make it easier to monitor and control inbound and outbound network traffic [10].
Generally avoid benchmarking in multi-tenancy clusters, i.e., clusters that are shared across teams, either physically or virtually.
3 Function Hook Granularity
-
•
Application-level hooks use methods implemented by the application’s developers, e.g., a plugin system. Since such systems are not widely available, this layer cannot be used for general-purpose hooks on already built applications.
-
•
Runtime-level hooks use native capabilities of language runtimes to modify applications, e.g., the JVM Tool Interface (JVM TI), the .NET Profiling API, or Node.js module preloading.
-
•
Library-level hooks override symbols in shared libraries, e.g., by the “LD_PRELOAD trick” [2].111https://man7.org/linux/man-pages/man8/ld.so.8.html
-
•
Kernel-level hooks use native capabilities of the operating system to modify application behavior, e.g., kernel modules or eBPF programs.
The monitoring tool should be placed as close as possible to the layer where the hook is injected. Testing farther away pollutes measurements with noise from other layers (Section 4.2).
To achieve optimal results, hooking and monitoring should be done at the “same layer”, i.e., by embedding monitoring functionality into the hook itself, e.g., by recording timestamps before and after the hook is executed, directly in the hook’s code.
Moving the monitoring tool further away from the hook is justifiable when one wants to more accurately represent real-world behavior instead.
Describe if the benchmark measures the specific hooking overhead in isolation (micro benchmark), or rather represents a real-world application with a hook injected into it (macro benchmark) [1]. Benchmarking both cases and discussing the differences is recommended.
4 Demonstration
We first build a Java application that simply responds with “Hello World” to any HTTP request. We then implement a library-level LD_PRELOAD hook that blocks all requests that contain specific keywords (Listing 1). The hook changes the read222https://man7.org/linux/man-pages/man2/read.2.html system call by overriding the corresponding symbol in the C standard library.333The full source code can be found at https://github.com/dynatrace-research/function-hook-latency-benchmarking We then measure our application’s network performance with and without the hook.
Low-level function hooks carry the risk that the hooked function is used by high-level functionality for a purpose other than the one originally intended. For example, the read call that we override here is also used to read regular files, not just network packets.
Therefore, describe how the hooked function is typically used by applications and ensure that the benchmarks reflect their proper use, e.g., with synthetic micro benchmarks [1], but also real-world behavior. Suitable cloud-native, real-world reference applications are TeaStore [4], DeathStarBench [5], or Unguard [11] for security use cases.
4.1 Experimental Setup
Our experiment consists of two containers: Locust (a performance testing tool) as the load generator with embedded monitoring, and the SUT. With containers, we not only represent cloud-native paradigms, but also isolate concerns between the benchmark owner and the SUT owner. We compare four conditions:
-
1.
In Docker (a popular container runtime): Both containers run on a single server, communicating through the host network.
-
2.
In Kind (a tool for running Kubernetes using Docker containers): Both containers run inside a single pod on a local, single-node Kind cluster.
The remaining two conditions use the AWS EKS service (a popular enterprise-grade cloud provider).
-
3.
In EKS pod: Both containers run inside a single pod in a managed, single-node AWS EKS cluster.
-
4.
Across EKS nodes: Both containers run in separate pods, each pod on a different node, in a managed AWS EKS cluster with two nodes.
Docker and Kind are running on a 24-core (Intel Xeon E5-2680 v3) Ubuntu 22.04 server with 64 GB memory. EKS nodes are t3.medium EC2 instances (2 vCPUs, Intel Xeon Platinum 8000, 4 GB memory).
Ensure that the servers do not hit any resource limits during the experiment to avoid performance degradations due to resource contention.
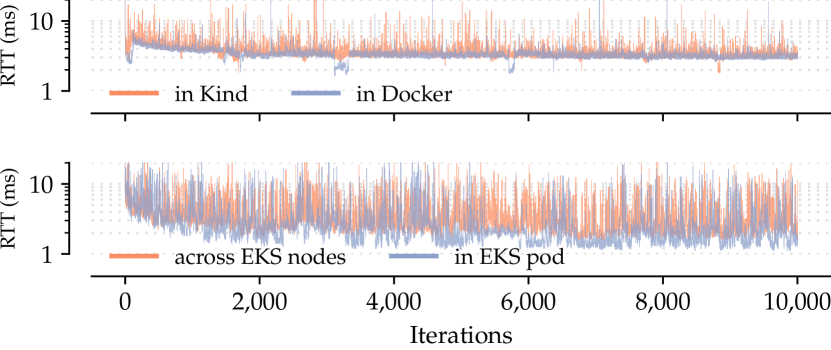
We measure the round-trip time (RTT) of HTTP request-response interchanges between Locust and the SUT. We empirically observed that the RTT definitely stabilizes under all four conditions after warm-up requests (Figure 3).
4.2 Hypothesis Testing and Results
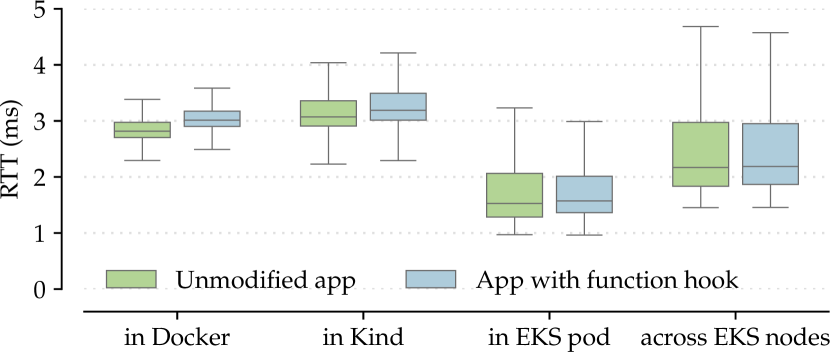
Figure 4 shows the RTT distribution per condition, with and without the hook, after warm-up requests.
Our function hook must introduce a performance overhead: To test the null hypothesis that the mean RTT is the same with and without the hook, we use an independent two-sample -test, assuming equal but unknown variances and equal sample sizes.444We use the stats.ttest_ind test from the SciPy package. Let and be the sample means, be the sample size per condition, and the pooled standard deviation555 With sample variances and and equal sample sizes, the pooled variance is defined by . , then the test statistic is given by: .
With samples left per condition after removing warm-up requests, the hooking overhead is significant () in three of four conditions (all ). The across EKS nodes condition is not significant () since we lose a lot of statistical power in EKS due to the higher RTT variance.
As expected and in line with related work [6], measurements taken in EKS generally exhibit a much higher variance than measurements on our own server, due to diverse factors that can hardly be controlled for. We expected the Docker condition, being the most minimal setup, to show the lowest variance (), and the Kind condition, which just adds a few Kubernetes components, to show the second-lowest variance (). We also expected that the network latency across EKS nodes shows the highest variance (; 3.9 times higher than in Docker). Packets in that condition traverse the origin container, pod, and node, some intermediate network that interconnects nodes, until they reach the target node, pod, and container again. In a multi-cluster environment, a communication path with that many hops is common. Kubernetes services, which are widely used abstractions on top of pods, would add even more hops to that route. Perhaps surprising is that the variance of the EKS pod condition was still relatively high (). Keeping network communication within the same pod decreased the variance, but it seems that the background noise of our EKS cluster is still relatively high and affecting inter-pod traffic.
As shown, measurements in cloud-native environments tend to have a higher variance than in local environments [6]. To regain statistical power, the sample size must be increased.
Conducting experiments in differently configured environments is a general principle [6, P2] that is especially relevant for cloud-native environments. Different cloud providers, service meshes, or network setups help increase diversity.
5 Conclusion
This work provides 1 practical recommendations for researchers and engineers who benchmark function hook latency in cloud-native environments, but want to reduce the measurement bias introduced by these environments. We have shown that function hook latency measurements can be easily contaminated by noise, without doing anything obviously wrong. We hope to raise awareness while providing practical guidance for similar latency-based benchmarks, as some of our recommendations are also broadly applicable.
References
- [1] Jan Waller and Wilhelm Hasselbring “Performance Benchmarking of Application Monitoring Frameworks”, KCSS 2014/5, 2014
- [2] Juan Lopez, Leonardo Babun, Hidayet Aksu and A. Uluagac “A Survey on Function and System Call Hooking Approaches” In HaSS 1.2, 2017 DOI: 10.1007/s41635-017-0013-2
- [3] CNCF “Cloud Native Definition”, 2018
- [4] Jóakim Kistowski et al. “TeaStore: A Micro-Service Reference Application for Benchmarking, Modeling and Resource Management Research”, MASCOTS ’18, 2018 DOI: 10.1109/MASCOTS.2018.00030
- [5] Yu Gan et al. “An Open-Source Benchmark Suite for Microservices and Their Hardware-Software Implications for Cloud & Edge Systems”, ASPLOS ’19, 2019 DOI: 10/ghbm8r
- [6] Alessandro Vittorio Papadopoulos et al. “Methodological Principles for Reproducible Performance Evaluation in Cloud Computing” In TSE 47.8, 2019 DOI: 10.1109/TSE.2019.2927908
- [7] William Viktorsson, Cristian Klein and Johan Tordsson “Security-Performance Trade-offs of Kubernetes Container Runtimes”, MASCOTS ’20, 2020 DOI: 10.1109/MASCOTS50786.2020.9285946
- [8] Sören Henning, Benedikt Wetzel and Wilhelm Hasselbring “Reproducible Benchmarking of Cloud-Native Applications with the Kubernetes Operator Pattern”, SSP ’21, 2021
- [9] Paul Ralph et al. “Empirical Standards for Software Engineering Research”, 2021 DOI: 10.48550/arXiv.2010.03525
- [10] Sören Henning, Benedikt Wetzel and Wilhelm Hasselbring “Cloud-Native Scalability Benchmarking with Theodolite Applied to the TeaStore Benchmark”, SSP ’22, 2022
- [11] Dynatrace LLC “Unguard: An Insecure Cloud-Native Microservice-Based Application”, 2023
- [12] Chadni Islam, Victor Prokhorenko and M. Babar “Runtime Software Patching: Taxonomy, Survey and Future Directions” In JSS 200, 2023 DOI: 10.1016/j.jss.2023.111652