AGN Selection and Demographics: A New Age with JWST/MIRI
Abstract
Understanding the co-evolution of supermassive black holes (SMBHs) and their host systems requires a comprehensive census of active galactic nuclei (AGN) behavior across a wide range of redshift, luminosity, obscuration level and galaxy properties. We report significant progress with JWST towards this goal from the Systematic Mid-infrared Instrument Legacy Extragalactic Survey (SMILES). Based on comprehensive SED analysis of 3273 MIRI-detected sources, we identify 217 AGN candidates over a survey area of 34 arcmin2, including a primary sample of 111 AGNs in normal massive galaxies () at 0–4, an extended sample of 86 AGN candidates in low-mass galaxies () and a high- sample of 20 AGN candidates at 4–8.4. Notably, about 80% of our MIRI-selected AGN candidates are new discoveries despite the extensive pre-JWST AGN searches. Even among the massive galaxies where the previous AGN search is believed to be thorough, 34% of the MIRI AGN identifications are new, highlighting the impact of obscuration on previous selections. By combining our results with the efforts at other wavelengths, we build the most complete AGN sample to date and examine the relative performance of different selection techniques. We find the obscured AGN fraction increases from to and then drops towards higher luminosity. Additionally, the obscured AGN fraction gradually increases from to with most high- AGNs obscured. We discuss how AGN obscuration, intrinsic SED variations, galaxy contamination, survey depth and selection techniques complicate the construction of a complete AGN sample.
1 Introduction
Supermassive black holes (SMBHs) are found at the centers of most, if not all, galaxies and are thought to be intimately linked to the evolution of galaxies across cosmic time (see reviews by e.g., Alexander & Hickox, 2012; Kormendy & Ho, 2013). The formation and growth of SMBHs are regulated by the supply of accreting material with the efficiency influenced by various host galaxy properties at a wide range of physical scales (e.g., Hopkins et al., 2008; Hopkins & Quataert, 2010; Inayoshi et al., 2020). As SMBHs accrete matter, they release enormous amounts of energy in the form of radiation and powerful outflows that shape the host systems through feedback mechanisms (e.g., Fabian, 2012; Heckman & Best, 2014). How to unravel the nature of this SMBH-galaxy connection has been a major quest in extragalactic astronomy. The growing phase of SMBHs, commonly known as Active Galactic Nuclei (AGNs), is particularly interesting, as they represent the most active phase of the SMBH-galaxy interaction and have distinctive observational characteristics to separate them out from other objects.
Since the original identifications through optical spectroscopy by Seyfert (1943), extensive ground-based optical surveys have successfully yielded statistical samples of AGN over wide ranges of galaxy properties and cosmic time (e.g., Adams, 1977; Filippenko & Sargent, 1985; Ho et al., 1997; Richards et al., 2002; Kauffmann et al., 2003; Hao et al., 2005). Meanwhile, a large number of AGNs missed in the optical have been revealed by new techniques developed at other wavelengths such as radio (e.g., Edge et al., 1959), X-rays (e.g., Gursky et al., 1971) and ultraviolet excess (e.g., Markarian, 1977). Nevertheless, all these methods have limitations — only a minority of AGNs are prominent in the radio and the other techniques are significantly hampered by absorption by the dust and gas surrounding the AGN. Luckily, most of the luminosity of obscured AGNs emerges in the mid-IR, producing SEDs dominated by emission by warm dust. To mitigate the deficiencies of AGN selections at other wavelengths, various AGN infrared selection techniques, particularly mid-IR color diagnostics with Spitzer and WISE data have been developed (e.g., Lacy et al., 2004; Stern et al., 2005; Alonso-Herrero et al., 2006; Padovani et al., 2017; Hickox & Alexander, 2018; Hviding et al., 2018), However, these methods are mostly effective on power law SEDs (Donley et al., 2012), i.e., on lightly obscured sources, and they leave the heavily obscured population only partially explored (see reviews by Hickox & Alexander 2018; Lyu & Rieke 2022a). In addition, the high- obscured and faint AGN population (e.g., ) is even less explored given the very limited wavelength coverage and sensitivity beyond 8 m. Consequently, there is wide disagreement in estimates of the fraction of the AGN population that has been overlooked due to strong obscuration, from 10% (Mendez et al., 2013) to 30% (Del Moro et al., 2016) to much more (Ananna et al., 2019), and how it evolves with AGN and/or galaxy properties. It is a bit embarrassing to admit that despite an odyssey of 80 years, our current AGN census is still patchy and incomplete, resulting in a major challenge to reach a comprehensive picture of SMBH evolution, and its connections with the host galaxy and surrounding environment.
With the successful launch and operation of JWST, we have entered a new era. Notably, from NIRSpec and NIRCam spectral observations at , people have found a number of high- AGNs or AGN candidates through rest-frame UV-optical emission line properties (e.g., Harikane et al., 2023; Kocevski et al., 2023; Larson et al., 2023; Übler et al., 2023) with the highest records at (Maiolino et al., 2023; Goulding et al., 2023). Since most of these searches target preferentially the broad-line systems that do not represent the whole AGN population, it is unclear how many AGNs have been missed. Previous systematic searches of obscured AGNs in the IR have been handicapped because of the very limited number of spectral bands with relevant data past 8 m, leaving the SED models under-constrained. This obstacle has been lifted by the Mid-Infrared Instrument (MIRI; Wright et al. 2023) on JWST, which provides nine photometric bands from 5 to 26 m that continuously sample the AGN hot dust emission features (m) up to redshift . Compared to the Spitzer mission, the MIRI sensivities are about 10–100 times higher with about eight times better spatial resolution at similar wavelengths, allowing the search and characterization of the AGN population in unprecedented precision, depth and redshift range (e.g., Yang et al., 2023)
In this paper, we present the first results of AGN selection and demographics using the Systematic Mid-infrared Instrument Legacy Extragalactic Survey (SMILES; Rieke et al. 2017) led by the US MIRI Science Team. This survey is composed of 35 MIRI pointings in 8 imaging bands at 5–27 over the central region of the Great Observatories Origins Deep Survey–South (GOODS-S; Giavalisco et al. 2004), including the Hubble Ultra Deep Field (HUDF; Beckwith et al. 2006) (see Figure 1 for the survey footprint and sensitivities). In the pre-JWST era, this field was extensively observed across the electromagnetic spectrum, often with the deepest observations anywhere in the whole sky, offering the best ancillary dataset for AGN study. In the UV to the near-IR, it has been visited multiple times by the Hubble Space Telescope (HST) as well as many ground-based facilities that include both imaging and spectral observations. AGNs have been identified through emission line features (e.g., Santini et al., 2009; Silverman et al., 2010) or time variability (e.g., Pouliasis et al., 2019). In the X-ray, this field is covered as part of the Chandra Deep Field South (CDF-S; Giacconi et al. 2002) with a total exposure time about 7 Ms at 0.5–7 keV, enabling the identification of many X-ray detected AGNs (Luo et al., 2017). In the radio-band, super deep data at 3 GHz and 6 GHz with the Jansky Very Large Array (JVLA) have also been obtained and used in AGN searches (Alberts et al., 2020). In the infrared, very deep IRAC and confusion-limited MIPS 24 m images from Spitzer are available and have been utilized to identify AGNs by mid-IR colors (e.g., Donley et al., 2008) and through SED fitting (Alberts et al., 2020; Lyu et al., 2022a). These multi-wavelength datasets and the corresponding results provide the best benchmark to show the advances brought by JWST and to characterize the relative performance of the MIRI AGN selection.


Besides the pre-JWST multi-wavelength dataset, our MIRI survey also has almost full overlap with the deep NIRCam imaging observations from the JWST Advanced Deep Extragalactic Survey (JADES; Eisenstein et al. 2023) and a large overlap with spectroscopic data from the First Reionization Epoch Spectrosopic COmplete Survey (FRESCO; Oesch et al. 2023), which can help to reveal the nature of these MIRI sources and characterize their properties. Compared to other MIRI imaging surveys in JWST cycles 1 and 2 (e.g., CEERS, COSMOS-Web), SMILES has larger sky coverage and/or more complete wavelength coverage. Combined with very deep JWST/NIRCam and HST data, this MIRI dataset provides a unique opportunity for AGN study over a wide range of redshifts and properties.
Taking advantage of the deep JWST (and HST) photometric data that continuously covers from 0.4 to 26 m, we will conduct comprehensive SED analyses to identify AGNs with a wide range of luminosity and obscuration levels from to . We will demonstrate the new discovery space offered by MIRI and present a major leap in AGN selection compared to all the previous IR missions. Combined with the super deep X-ray and radio data in the same field, we are able to build the most complete AGN sample in terms of bolometric luminosity and discuss the limits of different wavelengths and selection techniques. These results can establish the foundation of a number of follow-up investigations on AGN-related science such as AGN obscuration, luminosity functions, AGN duty cycles, host galaxy properties and AGN-galaxy relations.
This paper is structured as follows. Section 2 describes the observations, data reduction and photometry measurements. In Section 3, we introduce the AGN selection methods and present the results, which include SED identifications and other techniques with and without using the JWST data. In Section 4, we report the AGN number densities from MIRI, compare them to the AGN selected at other wavelengths and characterize the relative performance of different selection techniques across the electromagnetic spectrum. Section 5 characterizes the obscured AGN fraction from SED analysis and studies its possible evolution. The nature of AGNs missed at different wavelengths is also explored. In Section 6, we discuss various issues that can complicate the construction of a complete AGN sample. A summary is provided in Section 7.
Throughout this work, we assume a flat CDM cosmology with and km s-1Mpc-1(Hinshaw et al., 2013).
2 Data and Measurements
2.1 JWST/MIRI Observations and Image Reduction
Our JWST MIRI imaging observations (JWST ID 1207; PI: George Rieke) comprise 15 separate pointings that produce a 35 mosaic at the central 34 square arcminutes of the GOODS-S/HUDF sky area. To improve the PSF sampling, and mitigate cosmic rays and detector artifacts, we used the 4-Point-Sets Dither optimized for point sources with the SMALL pattern. The full MIRI field was used with the FASTR1 readout pattern. For each pointing, the total science exposure was about 2.17 hours with the time spread over 8 MIRI filters: F560W, F770W, F1000W, F1280W, F1500W, F1800W, F2100W and F2550W with the shortest integrations lasting 10.7 min (F1000W) and the longest 36.4 min (F2100W). The exposure time per band was aimed at optimizing detection of a typical AGN or star-forming galaxy at , except for F2550W which has a shorter exposure time aimed at galaxies. Most of these observations were successfully carried out during the scheduled Dec 7–14, 2022 time window with the same position angle (PA), but 2 pointings failed due to telescope guiding failures and the relevant data was re-taken on Jan 1 and 28, 2023. The different observing visits introduce position angle rotations of 26.6 and 48.2 degrees for these two pointings relative to the others and cause some irregularity in the final MIRI mosaic layout.
The data reduction used the JWST Calibration Pipeline v1.10.0 (Bushouse et al., 2022) and JWST Calibration Reference System (CRDS) context jwst_1084.pmap. Starting from the raw (“uncal”) data files obtained from MAST111https://mast.stsci.edu/portal/Mashup/Clients/Mast/Portal.html, the pipeline module calwebb_detector1 was used with default parameters to apply detector-level corrections, including linearity, dark current, first and last frame effects, and jump detection. For the latter, we implemented newly introduced algorithms with default parameters to correct for cosmic ray showers, i.e., large cosmic ray events that can have an impact over a large number of pixels.
Next, the default step calwebb_image2 was run to apply instrumental corrections and calibrations to produce “cal” files. Given that MAST data products can still suffer from strong background noise structures, at this point we apply a custom, external background subtraction from the Rainbow Database (Pérez-González et al., 2005, 2008; Barro et al., 2011a, b) JWST pipeline. Briefly, as explained in more detail in Álvarez-Márquez et al. (2023), we use an iterative process that progressively masks sources and median filters out large gradients and striping along detector columns and rows to produce “clean” cal files. For each (unfiltered) cal file, a “super background” is then constructed by median combining and scaling all other clean cal files. We found that better results are achieved by using all (relatively contemporaneous) cal files to construct a super background as opposed to constructing a background per visit. The latter can result in over-subtraction around extended sources due to inadequate availability of background pixels at the source location in detector space. The final super backgrounds were then subtracted from each cal file and an additional 265x265 pix2 box median subtraction is applied to remove any remaining varying background, mainly caused by cosmic ray showers.
The background-subtracted cal files were then astrometrically-corrected on a per visit and per filter basis using tweakreg222https://jwst-pipeline.readthedocs.io/en/latest/jwst/tweakreg/README.html with custom routines external to the JWST pipeline. The F560W image is first registered to the JADES image mosaic (which is registered to GAIA DR3) by creating matched catalogs of high S/N F444W and F560W sources, which will have similar morphologies and therefore centroids. The corrected F560W positions were then used to correct the next longer wavelength image and so on, so as to minimize the effects of morphological changes333Due to the decreasing number of high S/N sources, the astrometrically-corrected F1500W catalog was used to correct the F1800W, F2100W, and F2550W images.. The astrometric accuracy achieved by this process is 0.01–0.02′′ () for all filters except F2550W, which has a low number of high S/N sources and an astrometric accuracy of . Finally, the astrometry-corrected and background-subtracted cal files were processed through calwebb_image3, which produced the final mosaics with a pixel scale of 0.06′′. The final 5 point source sensitivities are 0.21, 0.21, 0.44, 0.60, 0.68, 1.7, 2.8, and 15 Jy in F560W, F770W, F1000W, F1280W, F1500W, F1800W, F2100W, and F2550W respectively, for apertures encompassing of the encircled energy of the PSFs (see below). Compared to the JWST ETC predictions, our measured detection limits have been improved by a factor of 1.6–2 for F770W-F1800W.
Figure 2 shows a representative cutout of our JWST/MIRI images together with JWST/NIRCam, Chandra X-ray, and JVLA radio data in the same region. Almost all of the X-ray and radio sources have been detected in the well-resolved MIRI images (see Section 2.5). The MIRI image resolutions are at 0.2–0.8 (PSF FWHM) while Chandra is at 0.5 (field center), JVLA at 0.3–1 and JWST/NIRCam at 0.02–0.16, allowing reliable associations and accurate photometry across the full wavelength range.

2.2 MIRI Source Identification and Photometry Measurements
Source detection and photometric catalogs were produced using a modified version of the JADES photometric pipeline (M. Rieke et al. 2023). The object detection uses stacked MIRI F560W and F770W high S/N images and a series of iterative steps, starting with the creation of a low S/N threshold blended segmentation map which is then processed to remove spurious noise detections and deblend sources (see M. Rieke et al. 2023 for details). The final segmentation map is used to define source centroids and 2.5x scaled Kron apertures, which are then used to measure photometry in all filters. Aperture corrections are applied by determining the fraction of flux outside a given Kron aperture using a model PSF for each filter. Model PSFs are created using WebbPSF (Perrin et al., 2014)444https://github.com/spacetelescope/webbpsf for the F1000W-F2550W filters. The F560W and F770W PSFs include an extended cross-like imaging artifact known as a “cruciform” (Gáspár et al., 2021) which is not yet adequately modeled by WebbPSF. As such, we constructed empirical PSFs using high dynamic range imaging of stars taken during commissioning (Gaspar, private communication). Photometric uncertainties are determined by placing random apertures across the mosaics to account for correlated pixel noise (e.g., Whitaker et al., 2011; M. Rieke et al., 2023).
The nature of our source detection does not impose a hard S/N threshold and our resulting catalog contains both real and spurious detections down to faint limits. We conduct visual inspections with the aid of deep NIRCam and HST images to throw out spurious sources. Finally, we have 3273 MIRI sources with 3- detection in at least one band.
By comparing with previous Spitzer photometry of the same sources, we found that our flux measurements in the F560W and F770W bands are systematically higher and concluded the origin is likely due to an underestimation of the cruciform during the flux calibration step. To mitigate the problem, we derived the correction factors as follows. We fitted the ASTRODEEP photometry up to IRAC band-2555The IRAC bands 3 and 4 are also affected by the same “cruciform” problem because of the same detector architecture as in MIRI, so they are not used in the calibration. of 25 isolated stars with single stellar population models from the Flexible Stellar Population Synthesis (FSPS) code666Although designed for fitting galaxies, at the wavelengths of interest these models are dominated by the output of red giants, and thus represent a typical average over the expected behavior of the stars. and computed the synthetic MIRI fluxes in F560W and F770W. The median offsets between the observed (aperture-corrected) Kron flux and the model flux were then computed; the values are 1.26 for F560W and 1.04 for F770W. Finally, we divide the F560W and F770W fluxes by these factors during the SED fitting in Section 3. The photometry is archived in the v0.4.2 MIRI photometry catalog.
2.3 JWST/NIRCam, HST/ACS, HST/WFC3 Photometry and SED Constructions
Most of the SMILES survey area overlaps with the NIRCam image footprint from JADES (Eisenstein et al., 2023). This includes the JADES GOODS-S NIRCam/Deep (ID: 1180; PI: Daniel Eisenstein), partly taken from September 29 to October 10, 2022 and already publicly released (M. Rieke et al., 2023), and the JADES GOODS-S NIRCam/Medium (ID 1210; PI: Nora Luetzgendorf), taken from October 20 to 24, 2023. All these datasets include deep F090W, F115W, F150W, F200W, F277W, F335M, F356W, F410M, F444W images, offering critical insights into the nature and properties of the MIRI sources. In addition, these NIRCam observations were carried out no more than 3 months earlier than the MIRI data, which together with the time dilation (typical redshifts are =1–3), greatly mitigates the possible influence from AGN variability on the source SEDs.
Although the previous HST data is not as deep as JADES NIRCam data at the same wavelength, it is still indispensable as HST provides measurements at that are missed by NIRCam. The addition of HST bands also improves the SED analysis such as constraining the photo-. The HST/ACS F435W, F606W, F775W, F814W, F850LP and HST/WFC3 F105W, F125W, F140W, F160W images of this field have been reprocessed by the JADES team, including registering the astrometry against JWST/NIRCam images and measuring the HST and NIRCam fluxes in a consistent way.
For the NIRCam and HST photometry in the JADES field, we have adopted the PSF-convolved KRON flux from the JADES v0.8.1 catalog. We searched for the NIRCam counterparts for all the MIRI sources within a radius of 0.3 arcsec. For MIRI sources outside the current JADES footprint, we searched for the nearest CANDELS source within a radius of 0.6 arcsec and adopted the corresponding ASTRODEEP (Merlin et al., 2021) photometry up to IRAC band 2 (4.5 m).
We have verified the quality of the JADES+MIRI photometry measurements with synthetic JWST photometry based on the SED fittings of the same sources with the ASTRODEEP+Spitzer IRS 16 and MIPS 24 data. On a statistical level, they agree with each other within 1-4%.
2.4 Redshift Constraints for MIRI Sources
To aid the SED analysis, redshifts of the MIRI sources are collected from various sources that can be grouped into three categories:
-
•
spectroscopic redshifts: These include high confidence spectroscopic redshift measurements published in the literature over last twenty years (Kodra et al. 2023; H. Hathi, private communication), the redshift catalog of the MUSE HUDF surveys published this year (Bacon et al., 2023), and also the recently released redshifts from JADES NIRSpec data release 1 (Bunker et al., 2023).
-
•
grism redshifts: Most of the MIRI field has also been covered by FRESCO grism spectral observations with NIRCam/F444W (3.8–5.0 m) at R1600 (Oesch et al., 2023). Since many objects only show a single emission line, we need to guide the redshift measurements with photo- from JADES NIRCam as priors. Typically, the confidence level of the prism redshift is the same as the spectroscopic ones above given the spectral resolution and depth of the NIRCam grism observations. When a FRESCO grism redshift is not available, we search for the 3D-HST grism redshift from WFSC3/G141 (1.1–1.65 ) at R130. Given the shorter wavelength coverage and poorer resolution, the latter is mostly only useful for objects at low redshifts.
-
•
photometric redshifts: Thanks to the extensive multi-band HST and JWST/NIRCam image coverage of the JADES, reasonably accurate photo-z measurements are possible for objects without spectroscopic observations. The JADES team has updated EAZY (Brammer et al., 2008) configurations and provided the photo-z measurements based on fitting HST and JWST/NIRCam photometry (see details in Hainline et al., 2023). We adopt this product by default. For objects outside the JADES/NIRCam coverage, we adopt the optimized photometric redshifts for CANDELS published in Kodra et al. (2023).
Figure 3 gives a summary of the redshift distribution of the MIRI sources. Despite the rather short exposure times of these MIRI bands, we detected over 30 objects at . About 45% of the sample have spectroscopic or grism redshifts. The EAZY-based photometric redshifts based on NIRCam data alone have 5% outliers and a scatter (excluding outliers) of of 0.024, 1 (M. Rieke et al., 2023). With the combination of MIRI photometry at longer wavelength, we expect the updated photo- computed from our SED fitting with Prospector (see Section 3.1) to be improved further with even less outliers.

2.5 Other Supporting Datasets and Catalogs
Following the strategies in Lyu et al. (2022a), we cross-matched our MIRI sources with the CDF-S and JVLA catalogs to look for AGN signatures within a search radius of 3.0. As the astrometry of the Chandra data was registered in the pre-Gaia era, we investigated the coordinate differences between the closest-matched MIRI and X-ray sources and applied a systematic shift of RA=0.128 and Dec=0.288 to all the CDF-S sources to remove the relative astrometric offsets. There are 202 X-ray sources within the MIRI footprint but four of them do not have MIRI counterparts. Upon visual inspection, their X-ray detections are below 3-. For the radio sources, there are 183 objects but one does not have a MIRI counterpart. The nature of this radio source will be explored in the future.
In Section 3.4, we will discuss AGN selections for sources detected in X-ray or radio.
3 AGN Identifications
With the data described above, we conducted SED analysis to search for AGNs. Section 3.1 introduces the semi-empirical SED models used for AGN identifications. In Section 3.2, we conduct the initial round of SED analysis to get an overview of the sample properties of all the MIRI sources and check the performance of our models. Section 3.3 describes how the AGNs are identified from SED analysis with the removal of possible false positives. In Section 3.4, we summarize the AGN samples selected by other methods in the same field, including those utilizing the JWST data and those in the pre-JWST era.
3.1 SED Models and Fitting Setup
As discussed in detail in Lyu & Rieke (2022a), reliable AGN identification through SED fitting requires careful minimization of the free parameters of the models while achieving accurate fits to the data. To meet this requirement, we introduced a fitting package for AGN SED selection and analysis in Lyu et al. (2022a) that features a modified version of the Prospector code (Johnson et al., 2021) with the Flexible Stellar Population Synthesis (FSPS; Conroy et al. 2009; Conroy & Gunn 2010) model for the stellar component; semi-empirical SED models for the AGN component (Lyu et al., 2017; Lyu & Rieke, 2017, 2018, 2022a); and a well-proven template for dust emission from the star-forming galaxies (Rieke et al., 2009; Lyu et al., 2022a). The same tool is also used for this work with a few updates described below. In Figure 4, we show the SEDs of different components and illustrate some of their variations.
The configuration of the stellar component is very similar to Lyu et al. (2022a) — we assumed the same Kroupa initial mass function and delayed-tau star-formation history but adopted the Calzetti attenuation curve with a flexible slope as in Kriek & Conroy (2013). Since there are objects at very high redshifts, IGM absorption is also included. In total, there are seven free parameters to describe the stellar component: (1) stellar mass formed (); (2) stellar metallicity (); (3) stellar age (); (4) -folding time of the star formation history (); (5) the attenuation level at 5500 Å (); (6) the power law index of the attenuation (); (7) the IGM absorption factor (). For stellar populations older than 10 Myr, regardless of the metallicity and star formation history, the near-to-mid-IR infrared photospheric emission is dominated by red giants and supergiants with very similar spectra, so any degeneracy of the parameters (2)–(4) will not influence the AGN identification.

For the star forming galaxy (SFG) dust emission component, by default we also adopt the template for , which is the best description of the average properties of normal SFGs at a wide range of redshifts that constitute our primary sample (see Appendix A in Lyu et al. 2022a for details). Furthermore, as shown later, our MIRI data is deep enough to probe the dwarf galaxy regime, where the systems can be low-metallicity and their dust emission SEDs likely behave differently from those of more luminous SFGs. These galaxies constitute our extended sample. We therefore adopt the Haro 11 SED template developed in Lyu et al. (2016) as the choice to match the dust emission SED for dwarf galaxies. This object has been selected from the Dwarf Galaxy Survey (Rémy-Ruyer et al., 2013) to represent the extreme SED behavior for low-metallicity star-forming galaxies and it features a much higher dust temperature (=46.5 K) than normal dust SFGs (20–30K) with a warmer mid-IR SED and weak PAH features. De Rossi et al. (2018) have also shown that the Haro 11 SED template is the best choice among other options for young, presumably sub-solar metallicity, galaxies undergoing extremely vigorous episodes of star formation. In Section 3.2, we will test the performance of these two sets of galaxy dust emission templates with MIRI data and explore the situation where the Haro 11 template is preferred for our SED fits. Once the template is decided, there is only one free parameter to scale it to match the data together with other components.
Compared to Lyu et al. (2022a), several improvements have been made for the AGN component:
-
•
Based on the SDSS DR7 optical spectral archive (Abazajian et al., 2009) and near-IR AGN templates in the literature (Glikman et al., 2006; Hernán-Caballero et al., 2016), we increased the resolution of the AGN template from the UV to the near-IR and added AGN emission lines to the model. These emission lines are further decomposed into narrow and broad components with the separation at FWHM=1200 km/s and these two groups of lines can be modified in different ways (e.g., obscuration at different physical scales).
-
•
We introduced a hybrid extinction configuration for the AGN component that considers the possibly different dust grain properties at different scales or angular directions. This setup features a Small Magellanic Cloud (SMC) curve for the commonly seen UV-optical extinction in type-1 AGNs and an empirical attenuation law constructed for the AGN IR obscuration. The former extinction law is associated with small dust grains at large physical scales far away from the central engine and the latter is for the circumnuclear obscuration, such as the dusty torus, which is likely to be dominated by larger dust grains because of the harsh environment (Baskin & Laor, 2018).
Figure 4 presents this updated AGN model with various emission lines and shows how the SED can be modified by the different levels of extinction characterized by the two attenuation laws parameterized by and . In our fitting, the AGN continuum and broad emission line component are bound together and can be obscured by both attenuation laws (i.e., and ) while the relative strength of the narrow line component can be only changed by the SMC extinction (). We adopt a uniform prior for = [0, 3.0] and = [0, 20.0] as these ranges cover the majority of AGN obscuration without too much redundancy. For the purpose of AGN selections, we also adopt the normal AGN template following Lyu et al. (2022a); Lyu & Rieke (2022b). In total, there are three parameters for the AGN component: (1) AGN luminosity (), (2) AGN SMC extinction level () and (3) AGN IR extinction level ().
During the SED fittings, we fix the redshift if the object has a spectroscopic or grism redshift (from FRESCO or 3D-HST). For objects that only have JADES or 3D-HST photo-z, we will re-compute the photo-z with the new SED fittings that include the MIRI data points. Accordingly, we have up to 12 (11 if the redshift is fixed) free parameters for the SED fitting. We use Dynamic Nested Sampling to find the best-fitting results and assess the model degeneracies. Readers are highly encouraged to read the relevant sections in Lyu et al. (2022a) for details.
Our approach has a number of advantages. First, our models for the AGN component and the SFG dust component are derived from empirical observations and have been extensively tested, as elaborated in detail in Lyu et al. (2022a); Lyu & Rieke (2022a). This allows us to narrow the number and range of free parameters while retaining realistic fits, in contrast to approaches that are more strongly based on theoretical models. In addition, the SED model of our AGN component not only provides a good fit to the AGN observations, but can change continuously from the unobscured phase to the most heavily obscured phase, offering an unbiased view on the distribution of AGN obscuration properties. Moreover, compared to most other tools, our AGN model includes broad and narrow emission lines, a typically over-looked but now very needed feature for the much improved photometric data in the JWST era. Finally, although preliminary, our SED fittings have the option to use an empirical low-metallicity galaxy template to fit the IR SEDs of the dwarf galaxy population.
More details of this SED fitting package, including its public release, will be presented in a separate paper in the future.
3.2 SED Fitting of MIRI Sources
We fit the SEDs for all the MIRI sources with the redshift priors described in Section 2.4. Within the current JADES footprint, the fits can utilize a maximum of 27 photometric bands that include five HST/ACS bands at 0.44 – 0.9 m, fourteen JWST/NIRCam bands at 0.9 – 4.4 m and eight JWST/MIRI bands at 5.6 – 25.5 m. For the 89 MIRI sources outside the current JADES NIRCam catalog footprint, besides the MIRI photometry, we have 23 bands from the ASTRODEEP catalog at 0.3 – 4.5 m, which includes HST ACS and WFC3, ground-based deep optical and near-IR observations and Spitzer/IRAC bands 1 and 2. In the first round, we adopted the normal luminous SFG dust template for the fitting to get an overall picture of the sample properties and to test the performance of our SED models.
3.2.1 Testing the SED Models for the Massive Galaxy Population
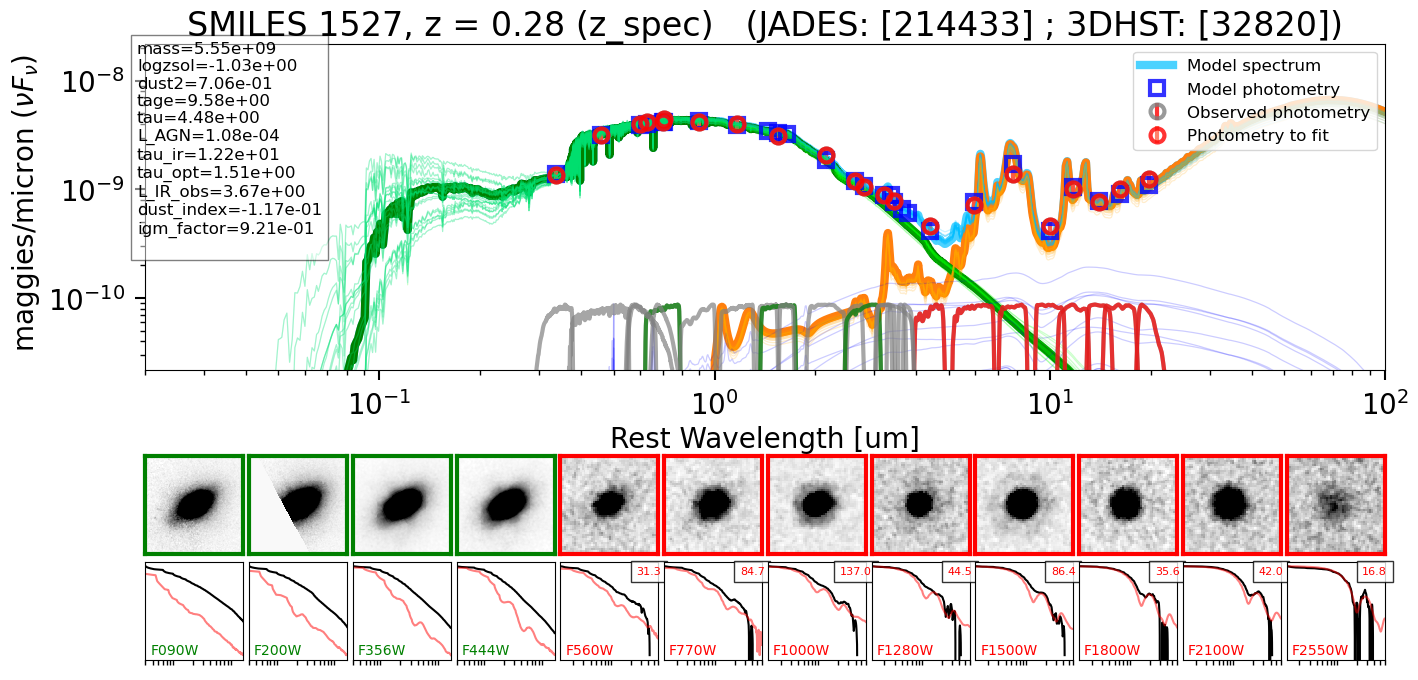
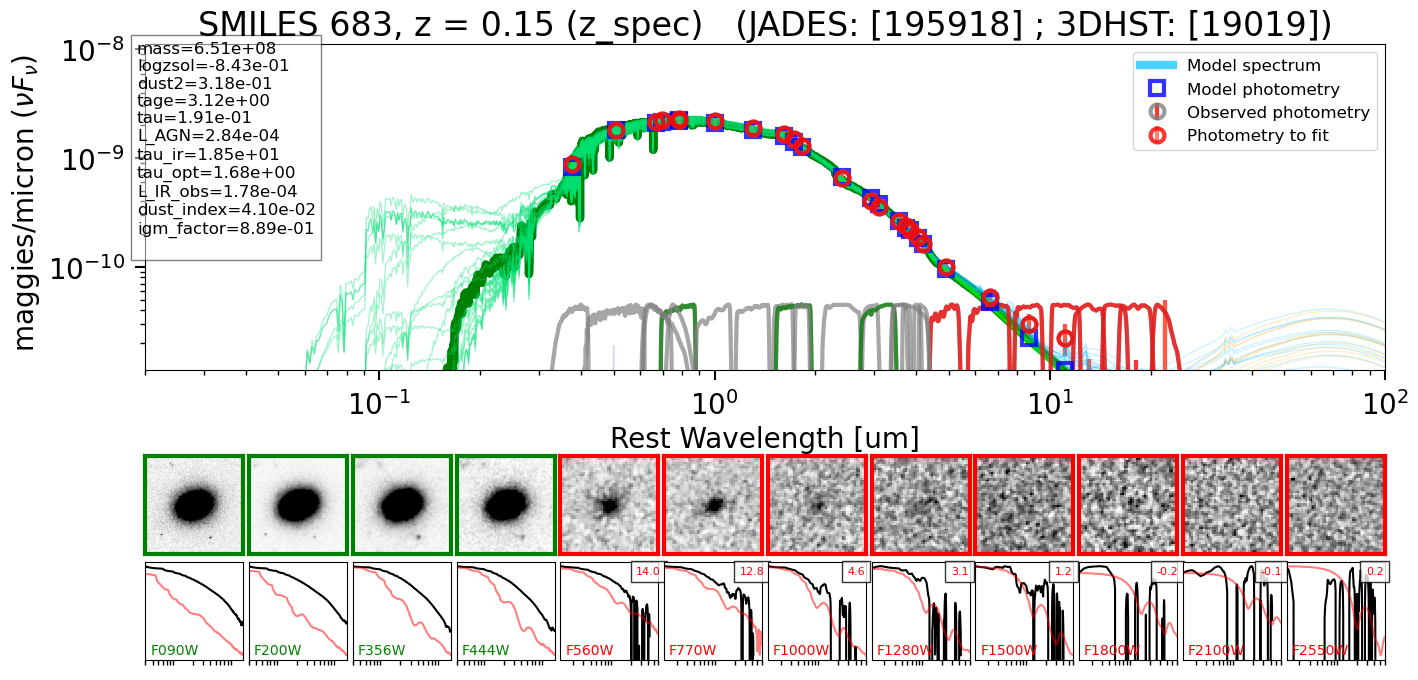
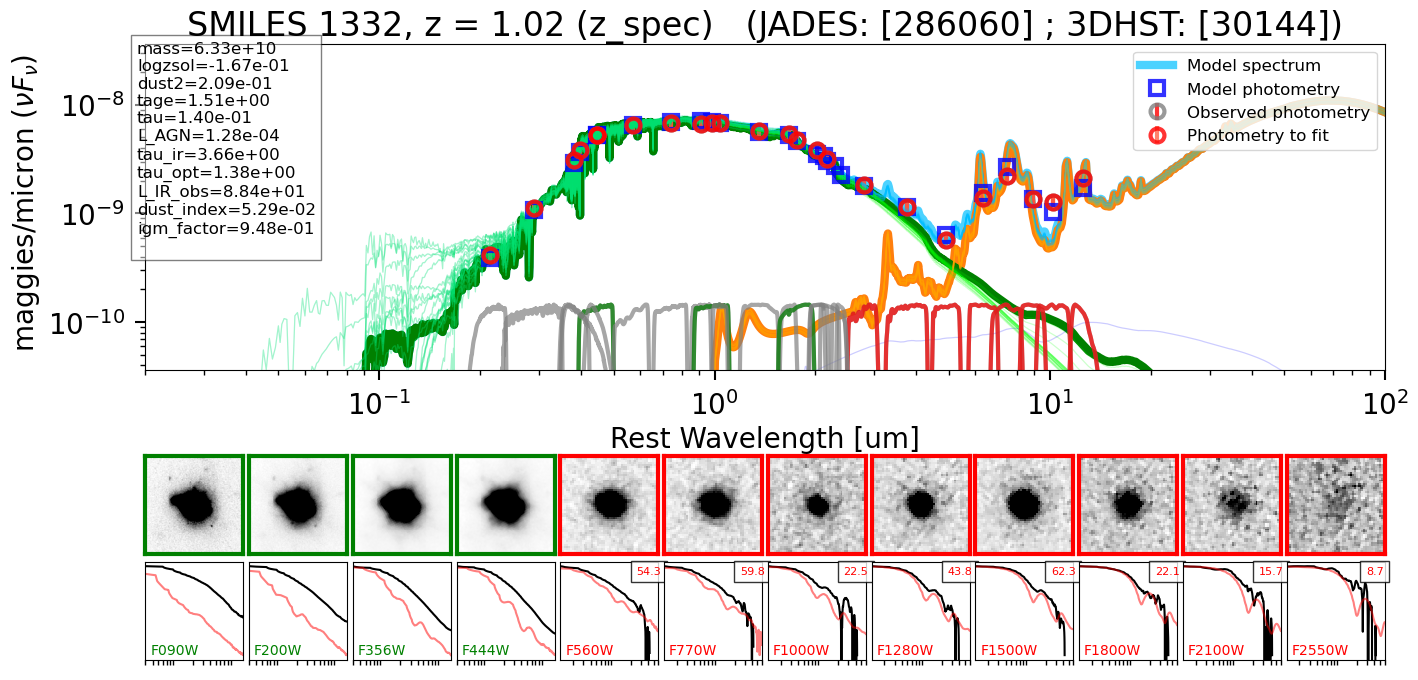
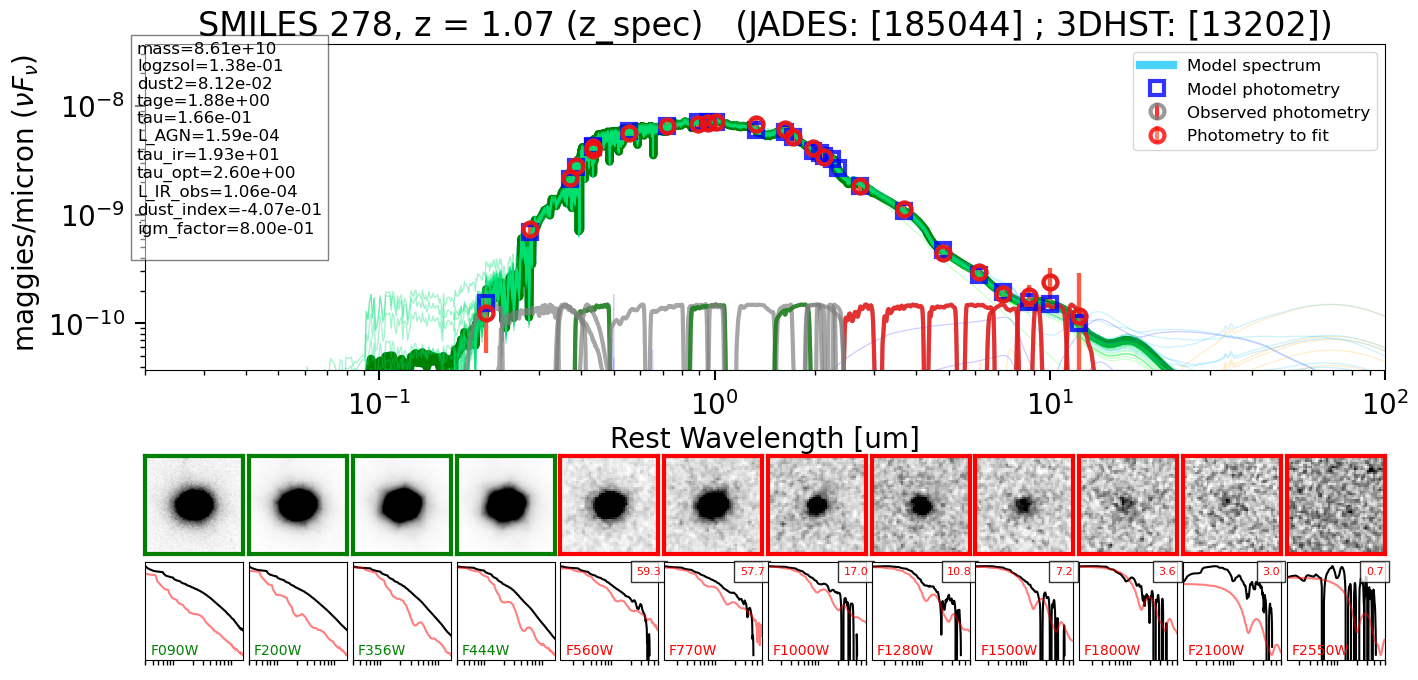
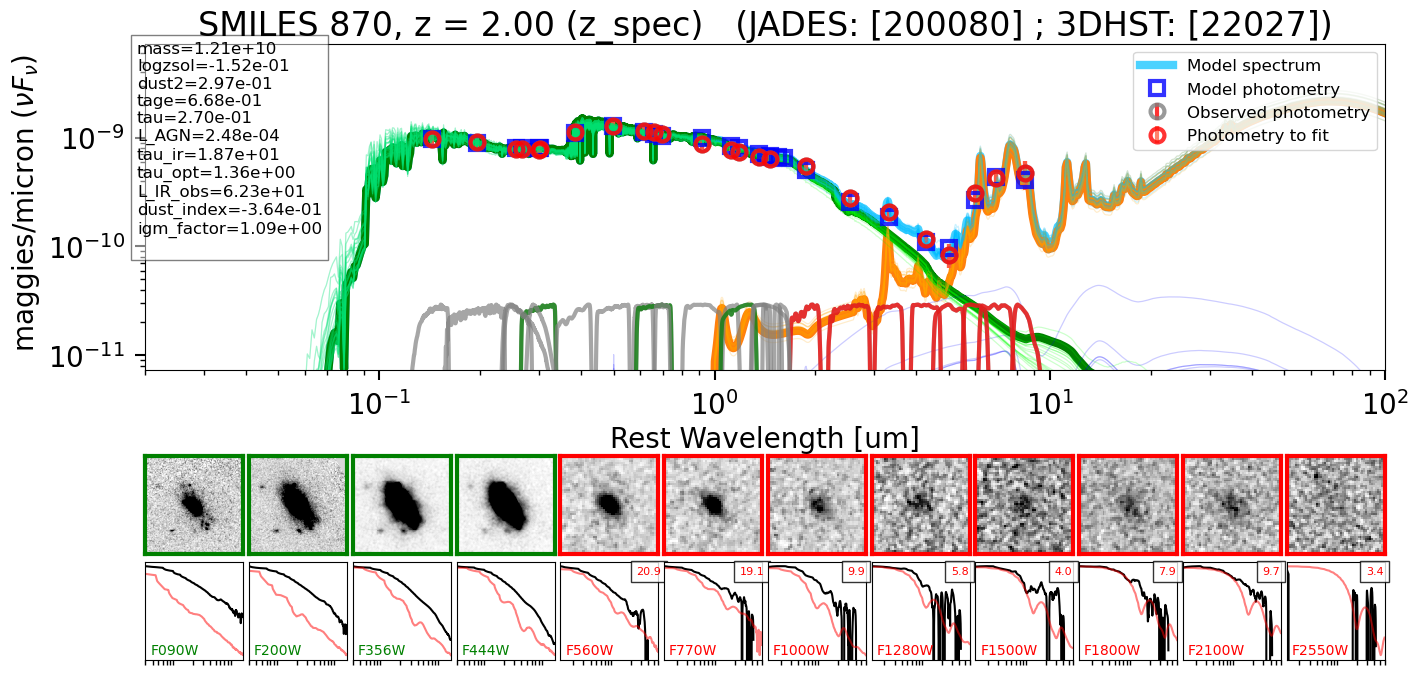
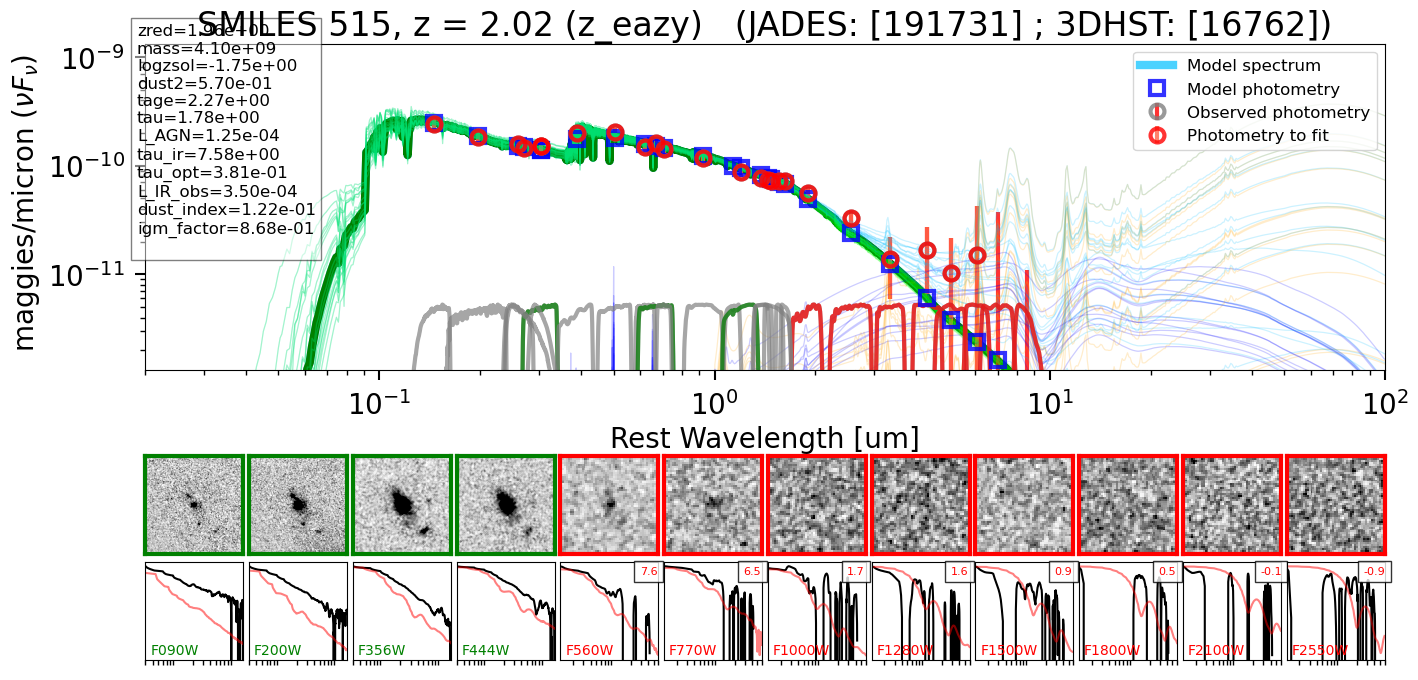
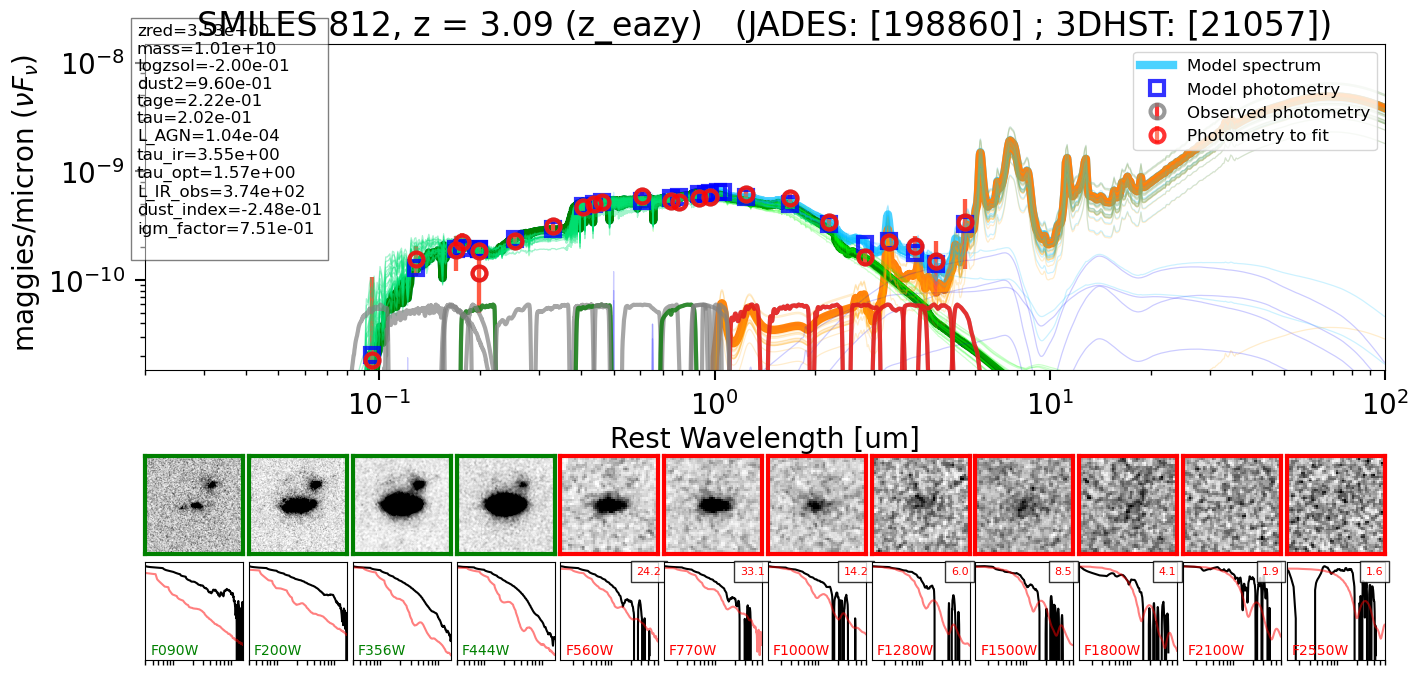
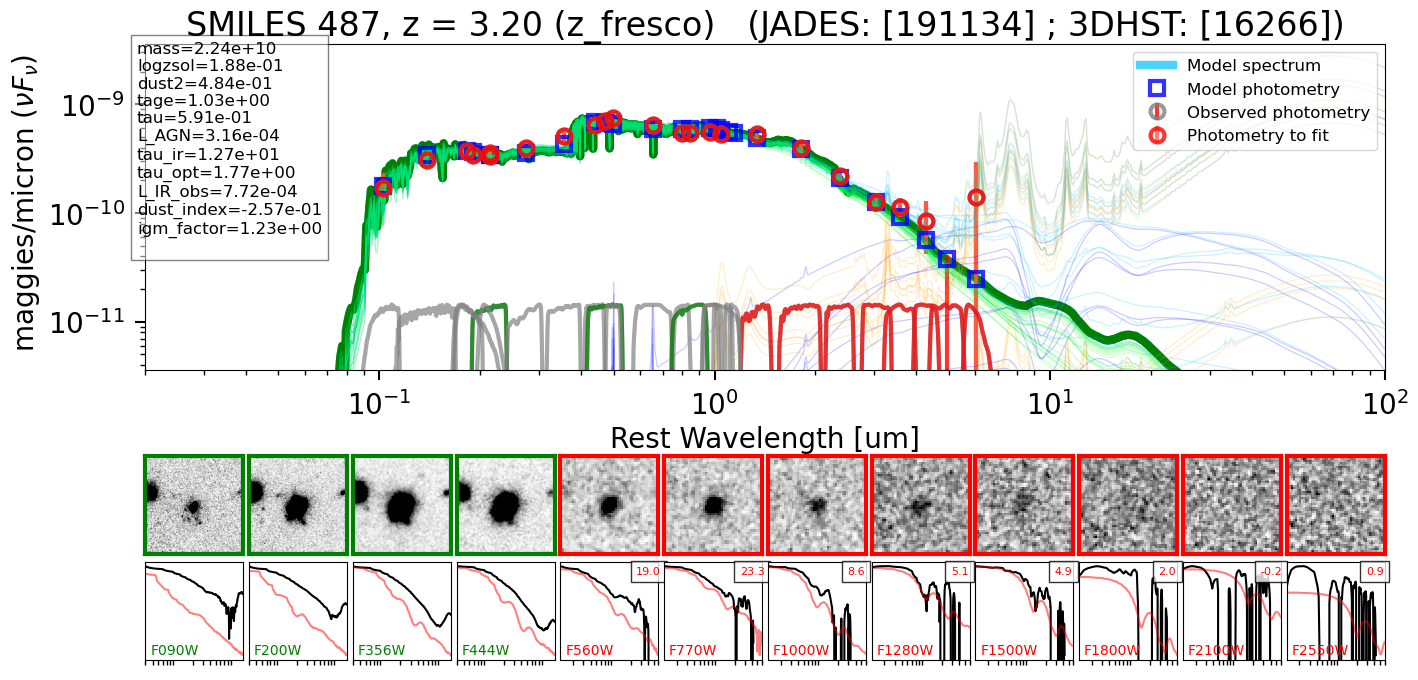
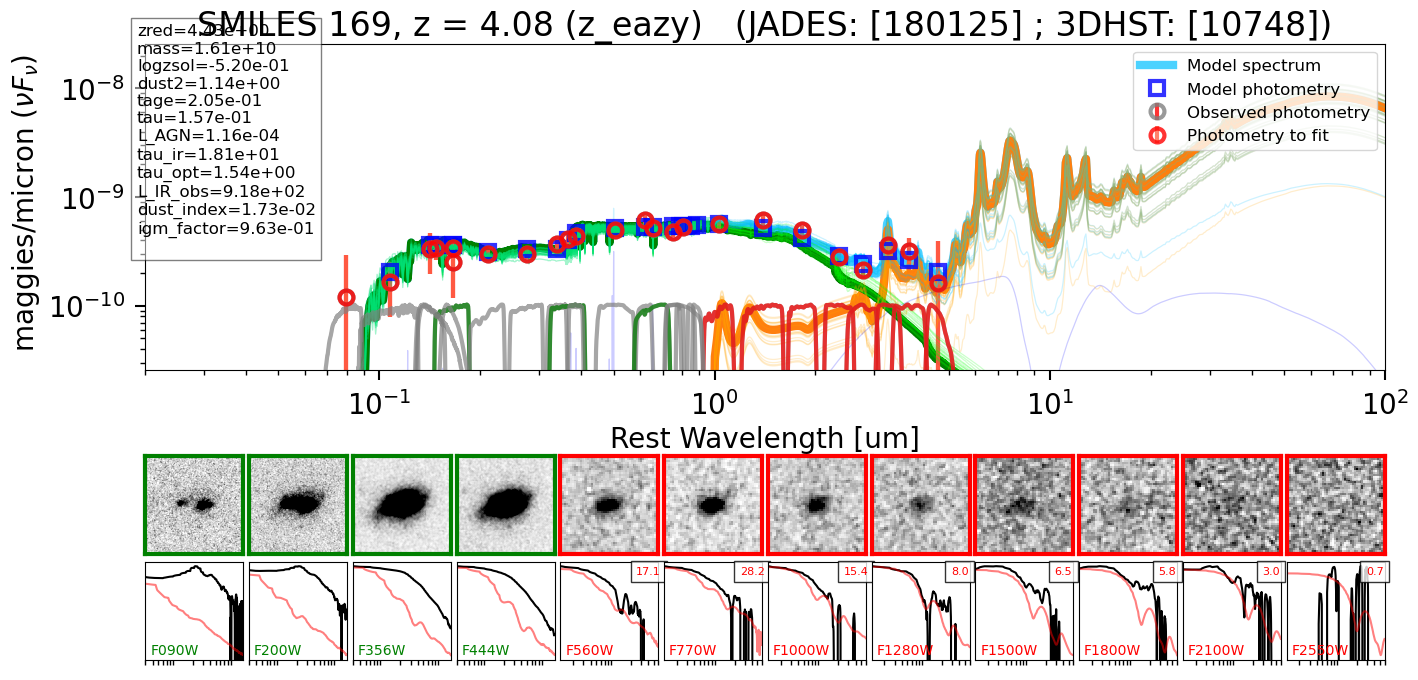
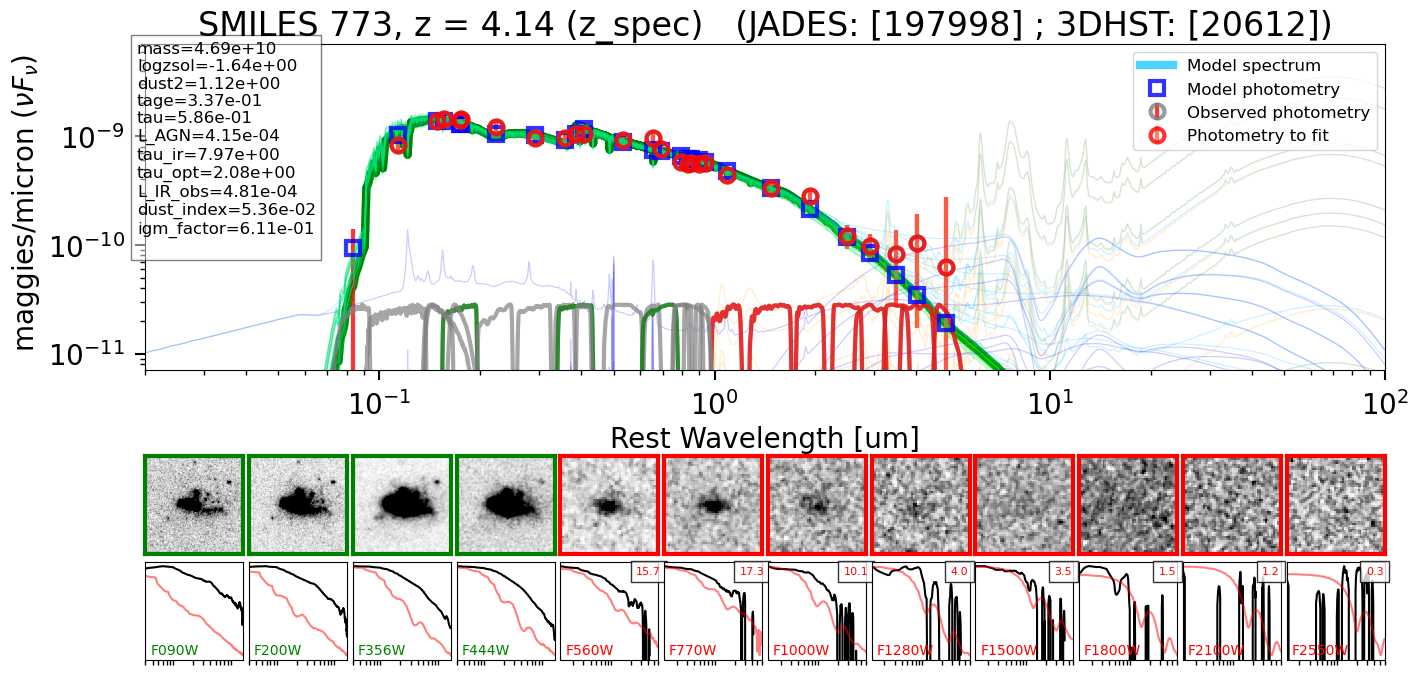
To demonstrate the robustness of our SED models, we present some representative SED fittings of dusty star-forming galaxies (DSFGs) and quiescent galaxies (QGs) from –4 in Figure 5. As we require good MIRI coverage to test our SED templates, most of these galaxies are relatively massive for their redshifts, by selection (i.e., ) and they form our primary sample. For DSFGs, various SED features are successfully matched by our templates, showing that the MIRI bands can be used to trace the various PAH features at e.g., 3.3, 6.2, 8.6, 11.3 m. For the QG population, the MIRI photometry is deep enough to constrain the stellar Rayleigh-Jeans tail at rest-frame 5 m even for galaxies at , as shown in the bottom-right panels of Figure 5.
The high-quality MIRI photometry as well as the satisfactory performance of our SED models for massive DSFGs and QGs establish a solid foundation for identifying AGN signatures through SED analysis in such systems.
3.2.2 Testing the SED Models for the AGN Population
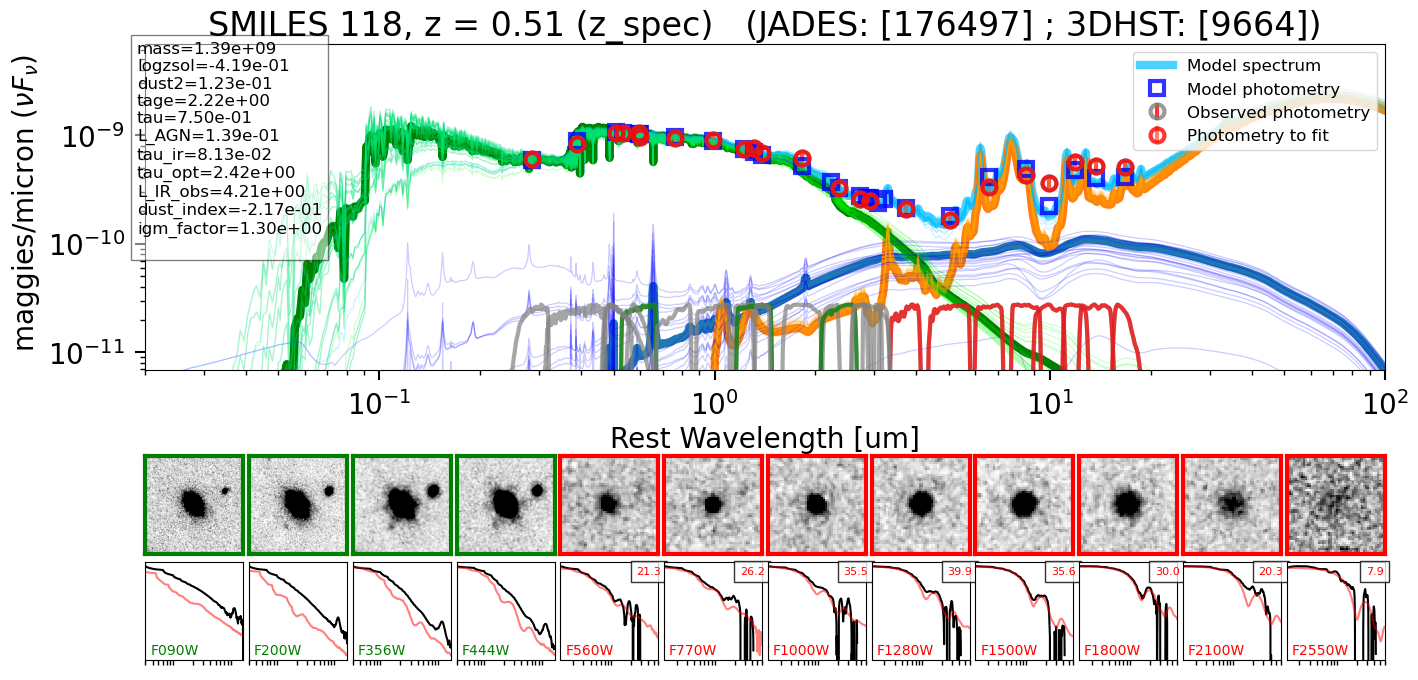
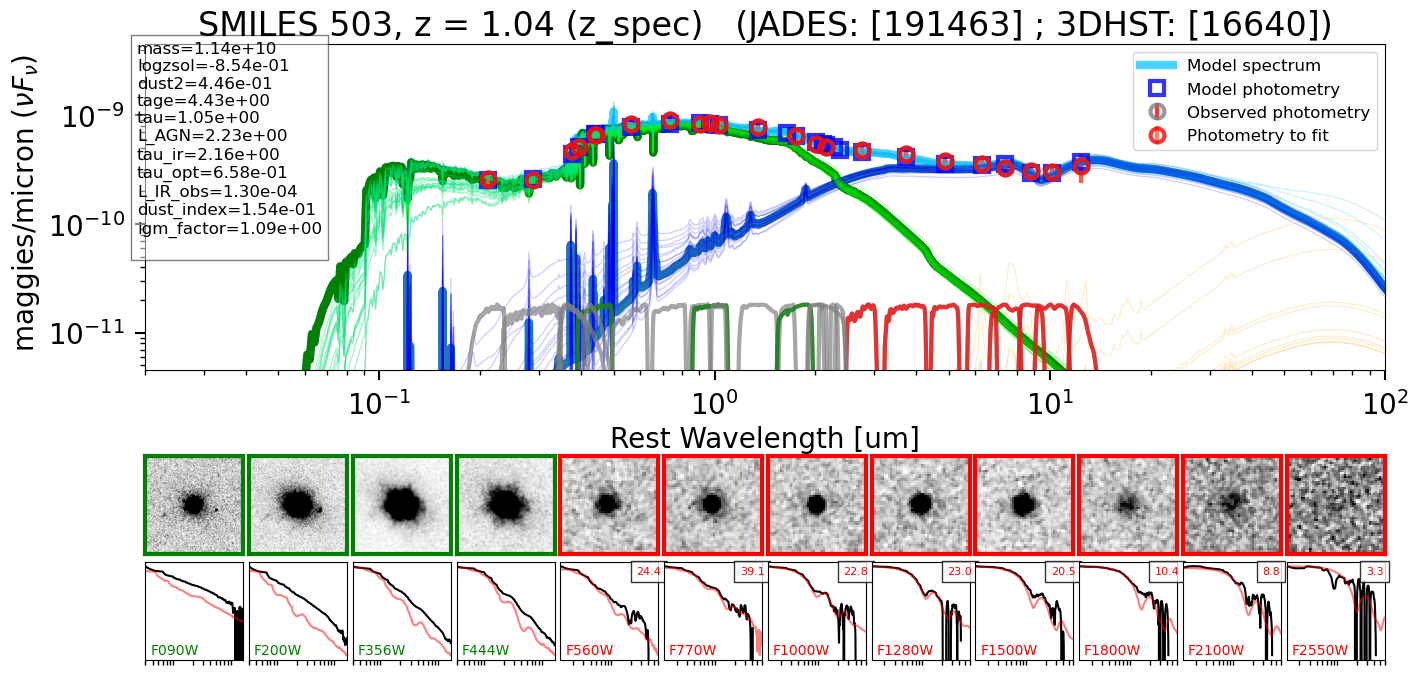
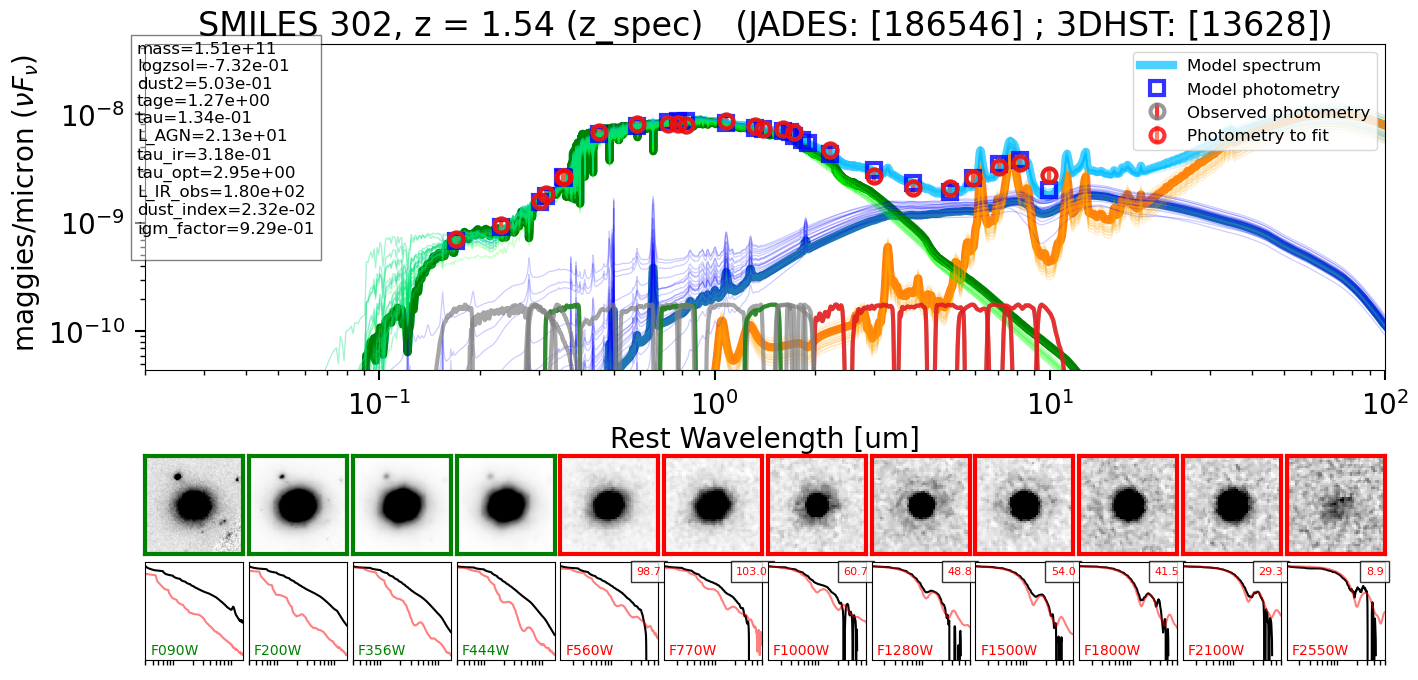
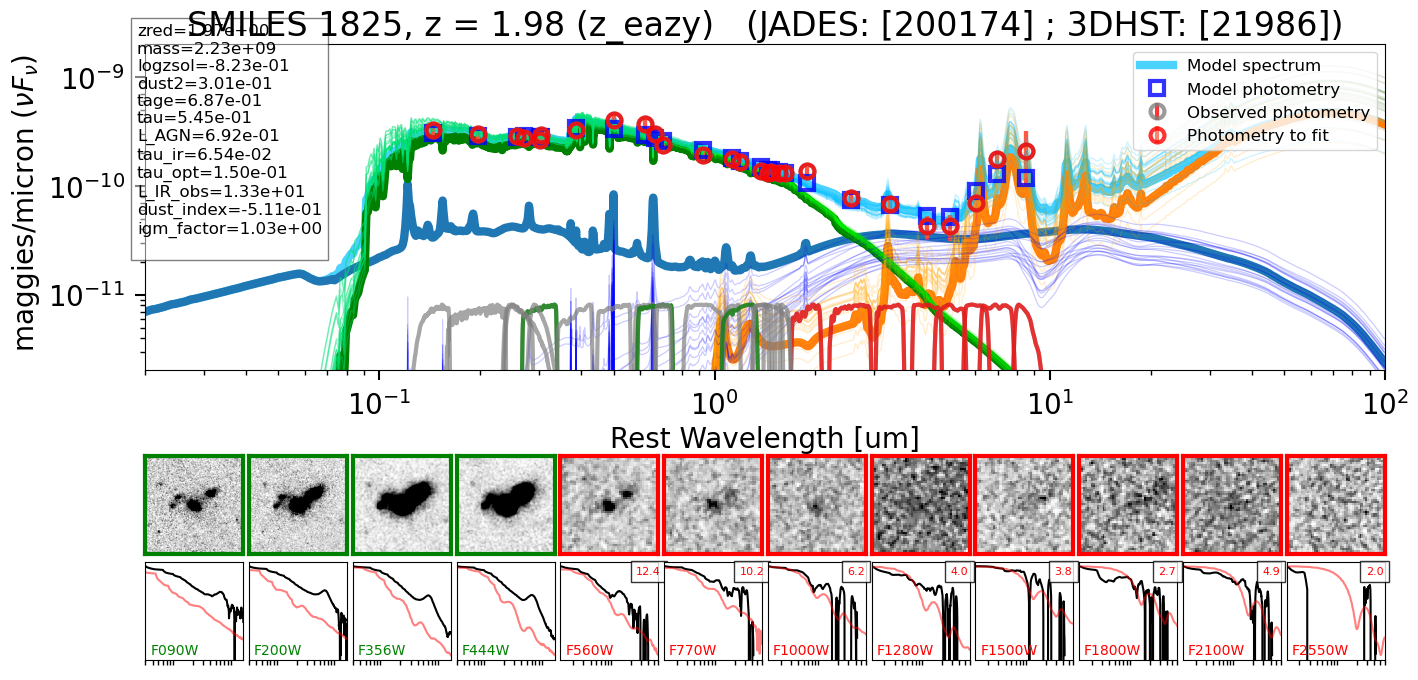
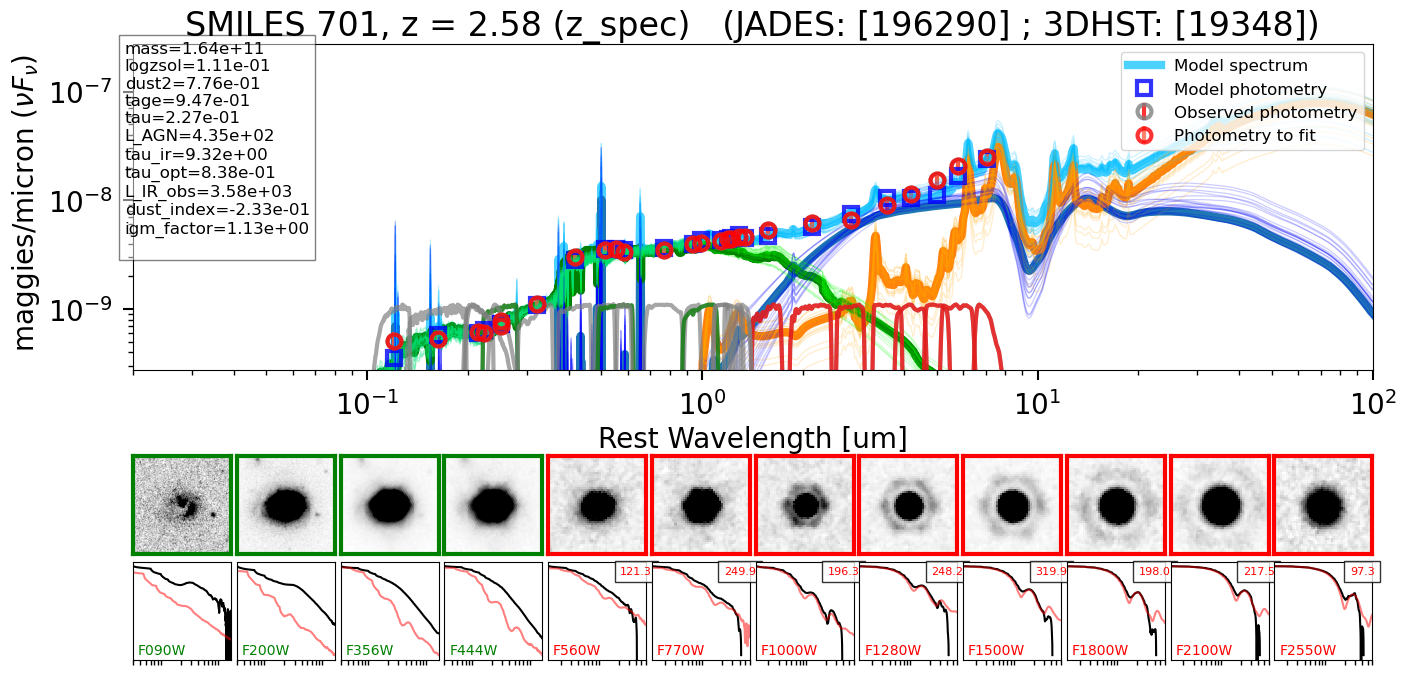
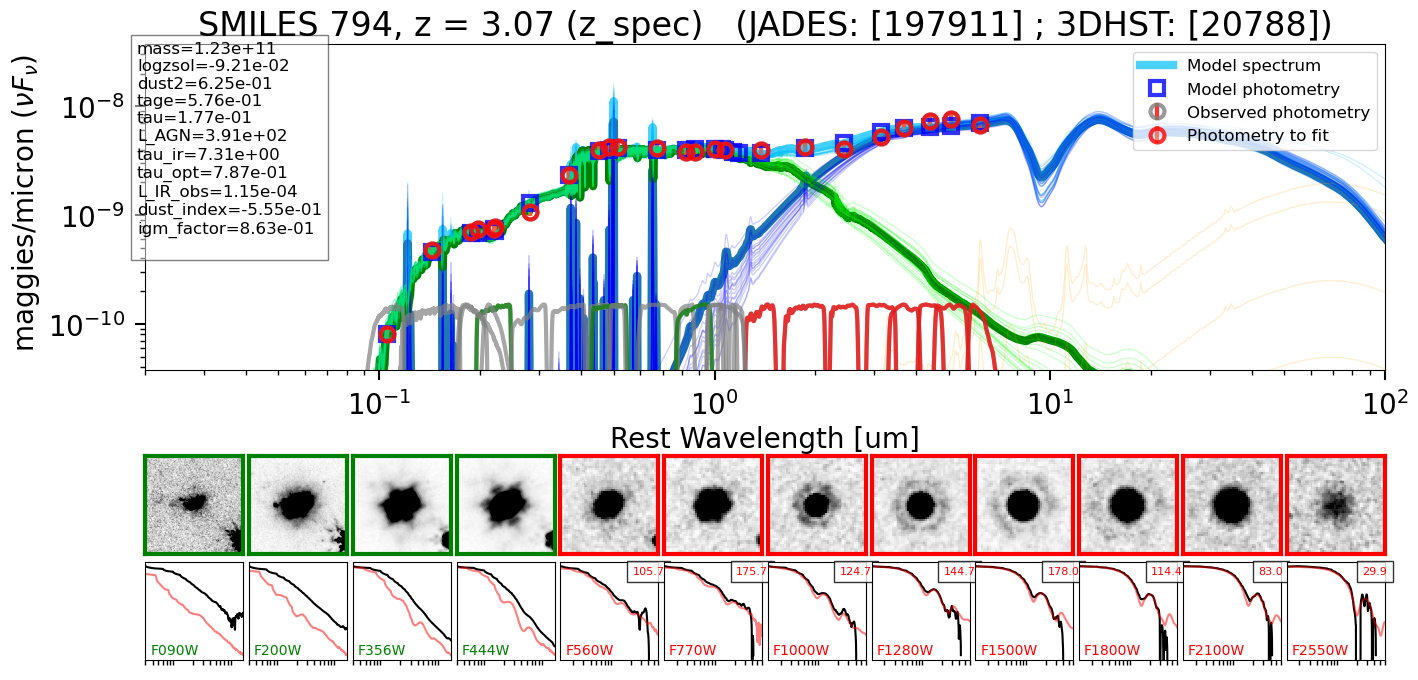
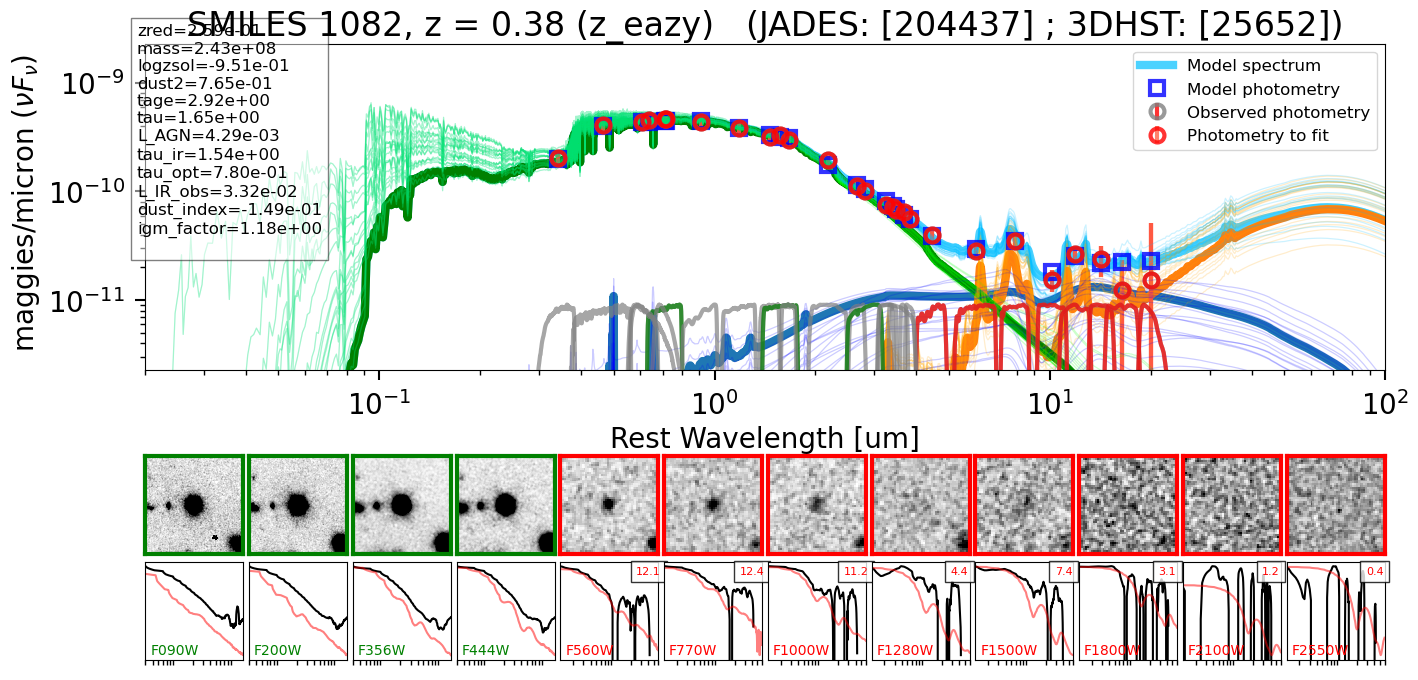
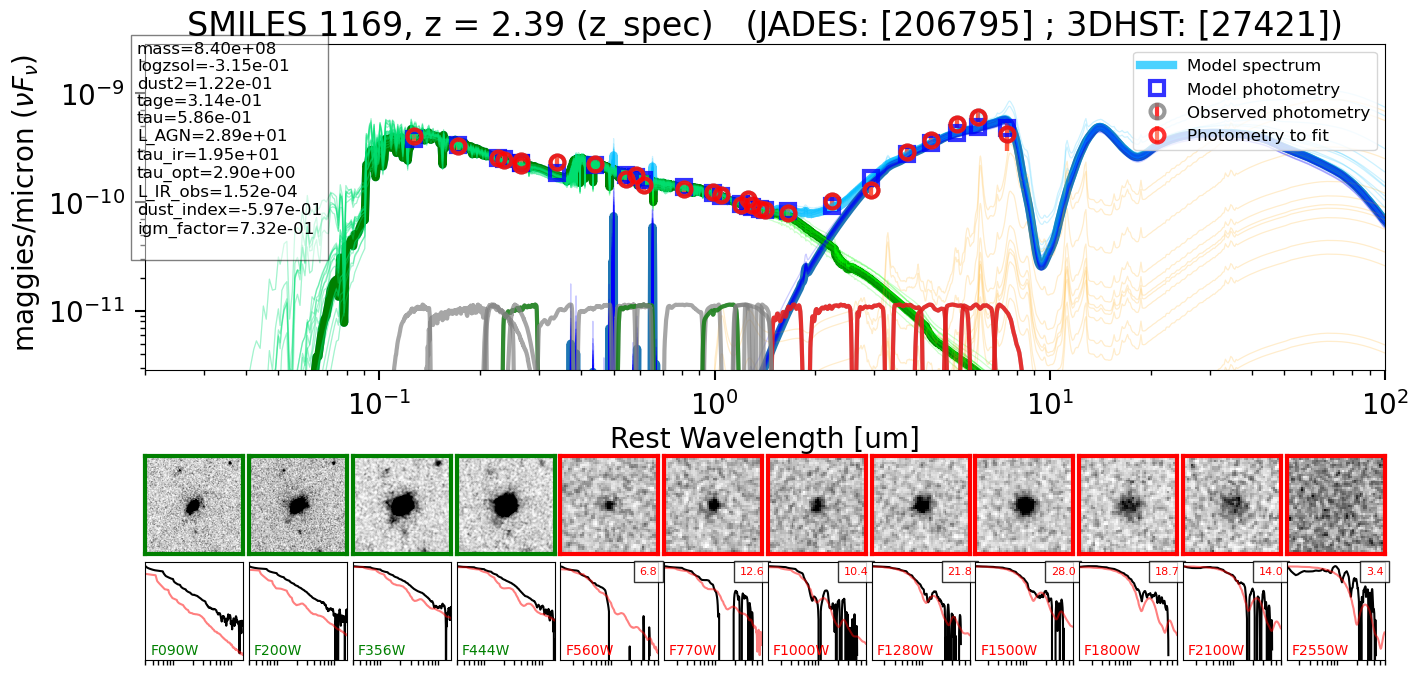
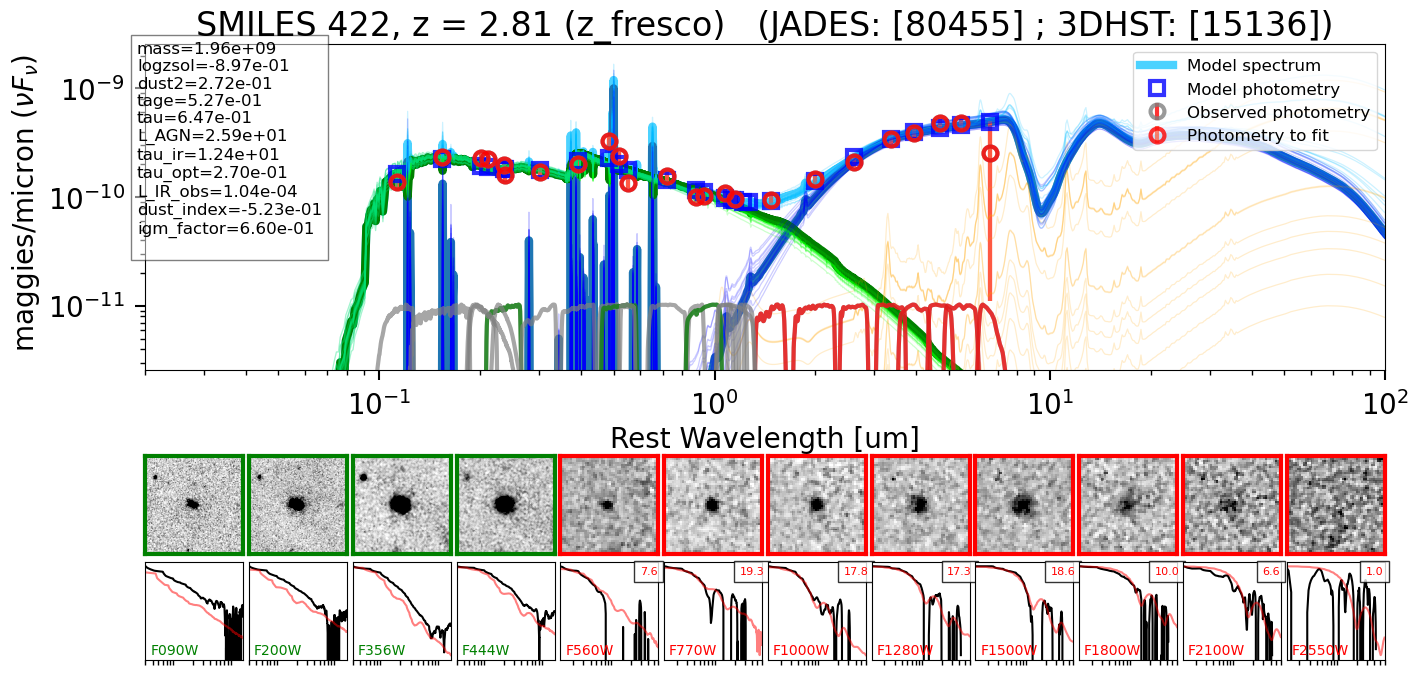
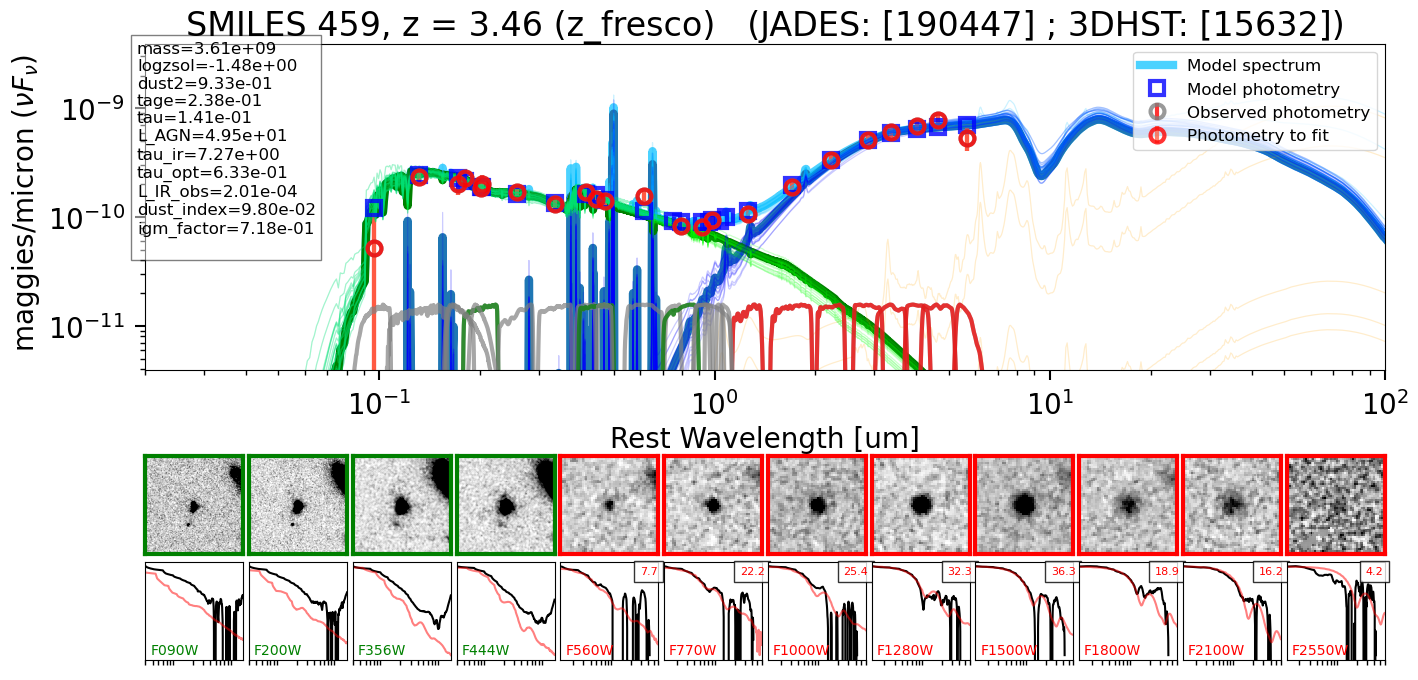
Figure 6 shows some representative examples of MIRI sources with AGN evidence revealed by SED fittings. Compared to galaxies without AGNs shown in Figure 5, the SEDs of these objects present much larger variations that can be explained by the different level of AGN-galaxy contrast and the SED variations of the AGN component itself. Our examples include AGNs with a wide range of redshift, obscuration level and galaxy contamination as revealed by the very successful SED decompositions.
3.2.3 The Complicated Situation of the Dwarf Galaxy Population
Besides reproducing the photometric SEDs, our fittings provide measurements of the galaxy stellar mass. As shown in Figure 7, this MIRI sample includes a considerable number of dwarf galaxies (), where our templates for normal SFGs may not work. To determine where this may become an issue, we visually inspected the fittings of all the MIRI sources and picked out those pure SFGs where the updated Rieke et al. (2009) template gives a good match (orange crosses). These “normal” SFGs have a stellar mass distribution peaked between and , which is about 0.5 dex above the median stellar mass of the whole MIRI galaxy population. However, we found that the IR SED features (e.g., PAH strength) of many low-mass galaxies are not captured by these “normal” SFG templates. Compared to the normal galaxy populations, these low-mass galaxies could have different IR SED behavior associated with low-metallicity ISMs (e.g., Rémy-Ruyer et al., 2013; Shivaei et al., 2020, 2022). In particular, the reduced PAH emission strengths and warmer dust continuum emission associated with the dwarf galaxy component can mimic the mid-IR colors of obscured AGNs to some level (e.g., Hainline et al., 2016), making the AGN identification with classical SED models not convincing. Thus, we need to introduce a method to remove most, if not all, false positives of AGN candidates in this extended sample.
Based on empirical observations, a correlation between PAH strength and metallicity has been revealed from the low- Universe (e.g., Engelbracht et al., 2005, 2008; Madden et al., 2006) to cosmic noon at (Shivaei et al., 2017). While the PAH intensity and relative strength of different bands stay almost the same at higher metallicity, below 12 + log(O/H) = 8.2 the PAH strength drops suddenly (Engelbracht et al., 2005, 2008; Marble et al., 2010; Aniano et al., 2020).777The behavior at z 2 is not clear. Shivaei et al. (2017) indicate a drop below log(O/H)8.3 for O3N2 metallicities, but a drop at a higher level for N2 metallicities. The physical basis for a large change with metallicity at redshift 2 is not clear, so we assume the local (and O3N2) behavior. Given the correlation between the galaxy stellar mass and metallicity observed over a wide range of stellar mass and redshift (e.g., Tremonti et al., 2004; Lee et al., 2006; Zahid et al., 2013), we use the stellar mass from our SED fittings to approximate the gas metallicity 12 + log(O/H) following the empirical fittings in Ma et al. (2016), and adopt the dwarf galaxy dust template (see Section 3.1) when the metallicity (or stellar mass) threshold is not met. According to fittings in Ma et al. (2016), the corresponding mass threshold as a function of redshift for 12 + log(O/H) 8.2 is
| (1) |
This curve is shown as the red solid line in Figure 7. To account for the uncertainties of e.g., stellar mass measurements and the dispersion of the mass-metallicity relation, we will compare the normal and dwarf galaxy dust template fittings for all objects within 0.3 dex of (dashed red lines), and use the normal galaxy dust model results for galaxies above +0.3 dex of this mass threshold and use the dwarf model below -0.3 dex of it. In addition, this threshold is not a hard cut as we will compare the fittings with the normal SFG and Haro 11 templates for objects within 0.3 dex of the mass cut, corresponding to a 12+(O/H) range from 8.3 to 8.1.


Despite these steps, it is possible that the AGN selections in our primary sample are mildly contaminated by cases with stellar-heated hot dust. In the case of our extended sample, Haro 11 is one of the most extreme cases with significant warm dust emission and weak PAH strength among the Dwarf Galaxy Survey (Rémy-Ruyer et al., 2013). The usage of this template therefore may have biased our results against AGN identifications in this sample, as discussed in Section 3.3.2.
3.3 AGN Identifications through SED Analysis
We now describe our AGN identifications through SED analysis for the three sub-samples of our full object list. Following the same strategies in Lyu et al. (2022a), we picked out AGN candidates by analyzing the quality of the SED fittings, including inspections of any degenerate models from the posterior distributions of the fitted parameters. Typically, the AGN solution will be accepted if the distribution of the fitted AGN luminosity parameter L_AGN has one single isolated peak and the AGN-dominated bands are not all noisy (i.e., S/N3.0). In addition, the high spatial resolution provided by NIRCam and MIRI allows us to further check if the AGN evidence inferred from the SED analysis is supported by the galaxy having a point-like core. Depending on galaxy stellar mass and redshift, the AGN identifications have some additional considerations described below.
3.3.1 AGNs in Massive Galaxies (Primary Sample)
For typical massive galaxies () at 0–4, the MIRI data has good coverage of the AGN warm dust features and our templates are well-tested. As a result, we treat the selected objects as SED-identified AGNs. In total, we identify 111 AGNs under this category.
In the top six panels of Figure 6, we show some representative SED fittings together with some NIRCam and MIRI images at the source location. In general, once the AGN emission dominates in a spectral band according to our SED decomposition, the corresponding radial profile of the source in that band is consistent with the instrument PSF, supporting the validity of our SED interpretation.
3.3.2 AGNs in Dwarf Galaxies (Extended Sample)
As discussed in Section 3.2.3, low-metallicity dwarf galaxies have IR SED shapes that can mimic the relatively hot dust emission features of AGN (see one example in Figure 8). For such galaxies, we replace the massive “normal” SFG template with a dwarf galaxy template based upon Haro 11 to fit the SEDs and look for AGN candidates. An additional challenge is the reduction of MIRI coverage at longer wavelengths at the lower infrared luminosities of these objects. These two effects restrict our identification of AGNs in these galaxies to cases with SEDs significantly bluer (hotter) than that of Haro 11. Our selection is probably missing some obscured AGNs with SEDs similar to that of Haro 11.
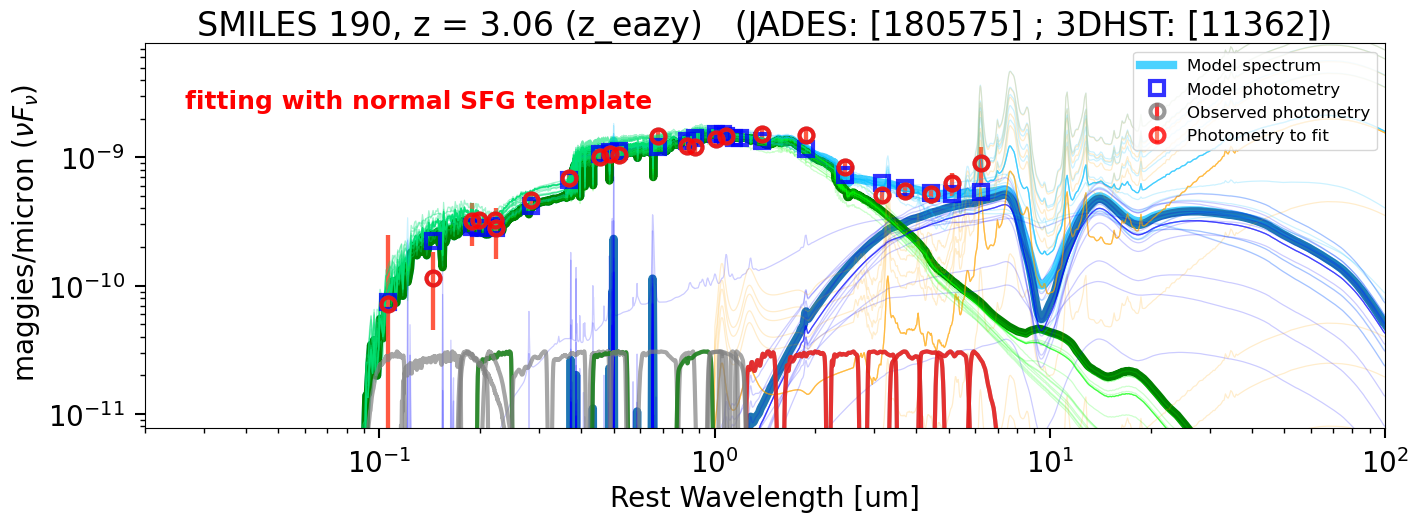
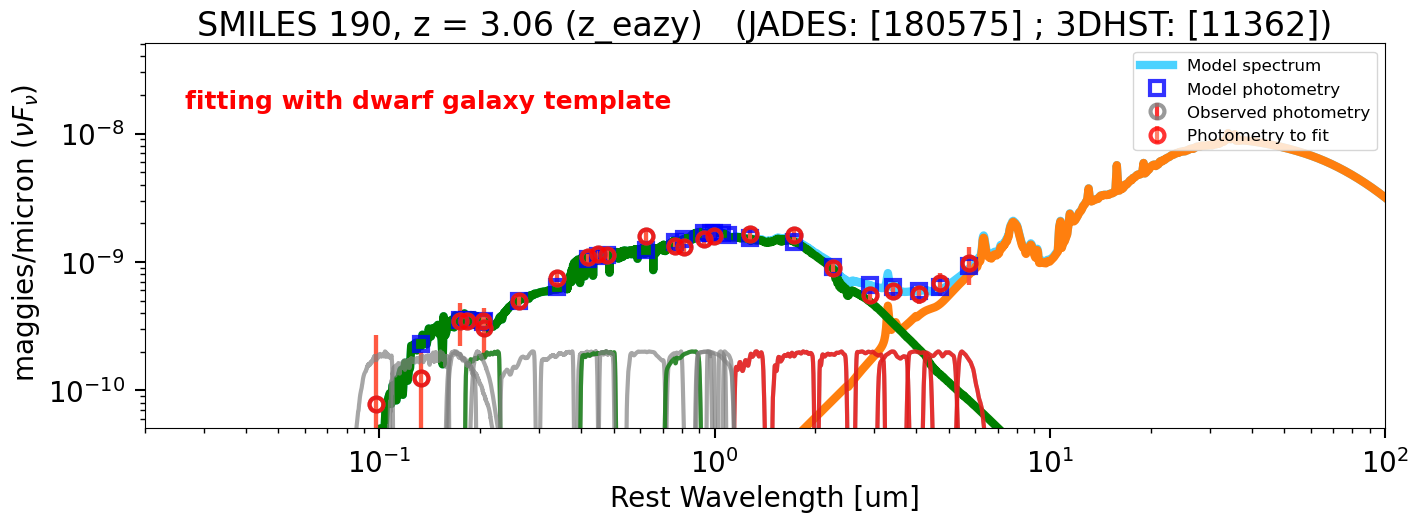
However, using the Haro 11 template greatly reduces the chance of a source being mis-classified as an AGN, especially for SF-AGN composite systems. We have shifted the mass threshold to test whether the value of our adopted mass threshold is reasonable. If we shift it upward by 0.3 dex (corresponding to higher gas metallicity), some previous AGNs selected with the normal SFG template are re-classified as pure star-forming (dwarf) galaxies as expected. However, most such objects are either X-ray sources or show point-like morphology in the NIRCam or MIRI images, indicating that they are probably real AGNs and the additional shift of the threshold is not desirable. As a result, we think the current mass threshold in Equation 1 is valid.
We adopted the definition of dwarf galaxies to be , regardless of the object redshift. In the first round, 187 AGN candidates that belong to this category are picked out. We have visually inspected all of these fits and rejected cases where the results are ambiguous due to low signal to noise, inconsistencies in the photometry from band to band, etc. Finally, 86 convincing AGN detections are left. This value is a lower limit given the limitations discussed above, particularly if AGNs with SEDs similar to that of Haro 11 have been overlooked. Methods to improve the AGN identifications throughout this extended sample need further development.
In Figure 6, the second row from the bottom shows two example dwarf galaxies where the AGN revealed by the MIRI SEDs is consistent with the obscured AGN template. The SED of MIRI 431 even shows evidence of strong silicate absorption, a typical IR tracer for a heavily embedded nucleus.
3.3.3 AGNs at (High- Sample)
For galaxies at 4, the MIRI data at the longest wavelengths are typically not deep enough to constrain the AGN hot dust SED shape well and the other MIRI bands are probing the rest-frame near infrared (or even optical) bands where some of the signatures of obscured AGNs are no longer accessible. Therefore, the identification of high- AGNs is relatively less robust and likely only yields a subset. In total, we identify 20 AGN candidates at z 4 with the highest redshift at 8.4.
Figure 9 presents six examples of AGNs identified at 4. All of these galaxies have spectroscopic redshifts and the AGN nature of MIRI 1104 is confirmed by the broad H emission revealed by the FRESCO spectrum (Matthee et al., 2023). The infrared excesses in all of these cases extend to wavelengths significantly shorter than the excesses of star-forming galaxies. These examples demonstrate that MIRI observations can find obscured AGNs at , although the samples will be incomplete.
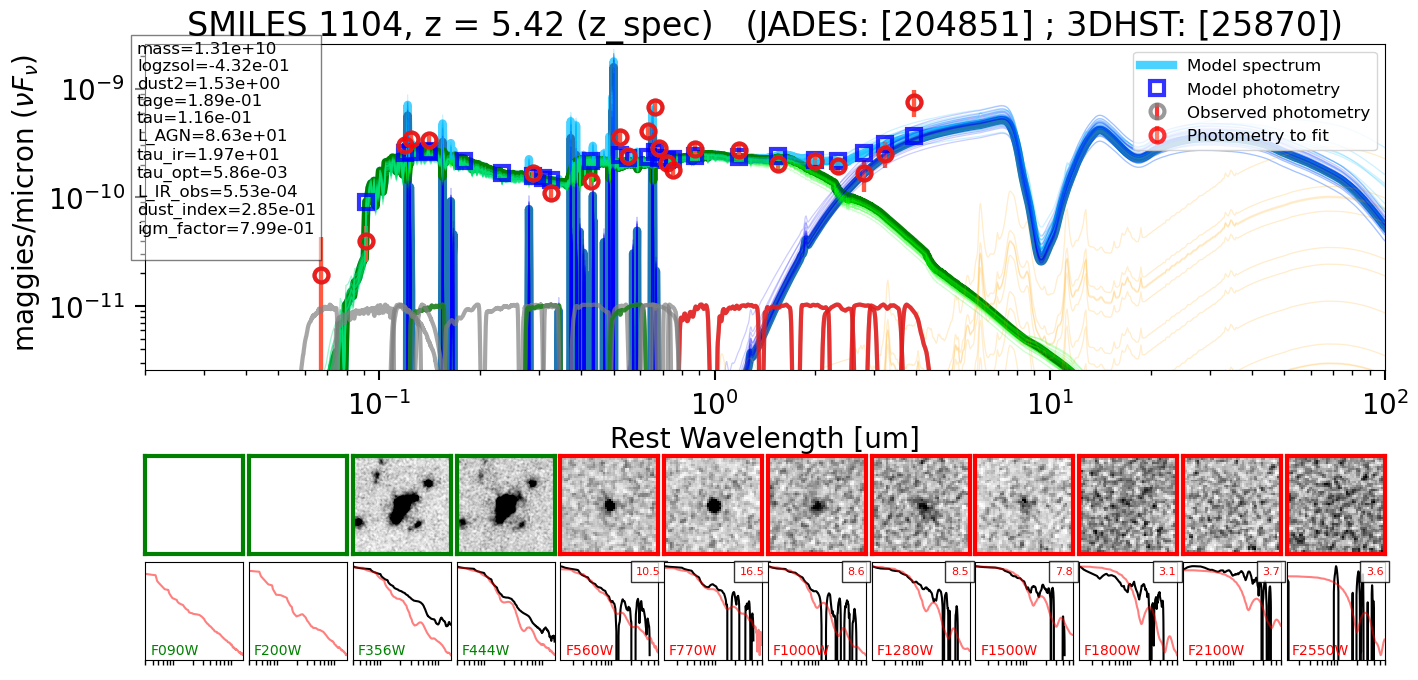
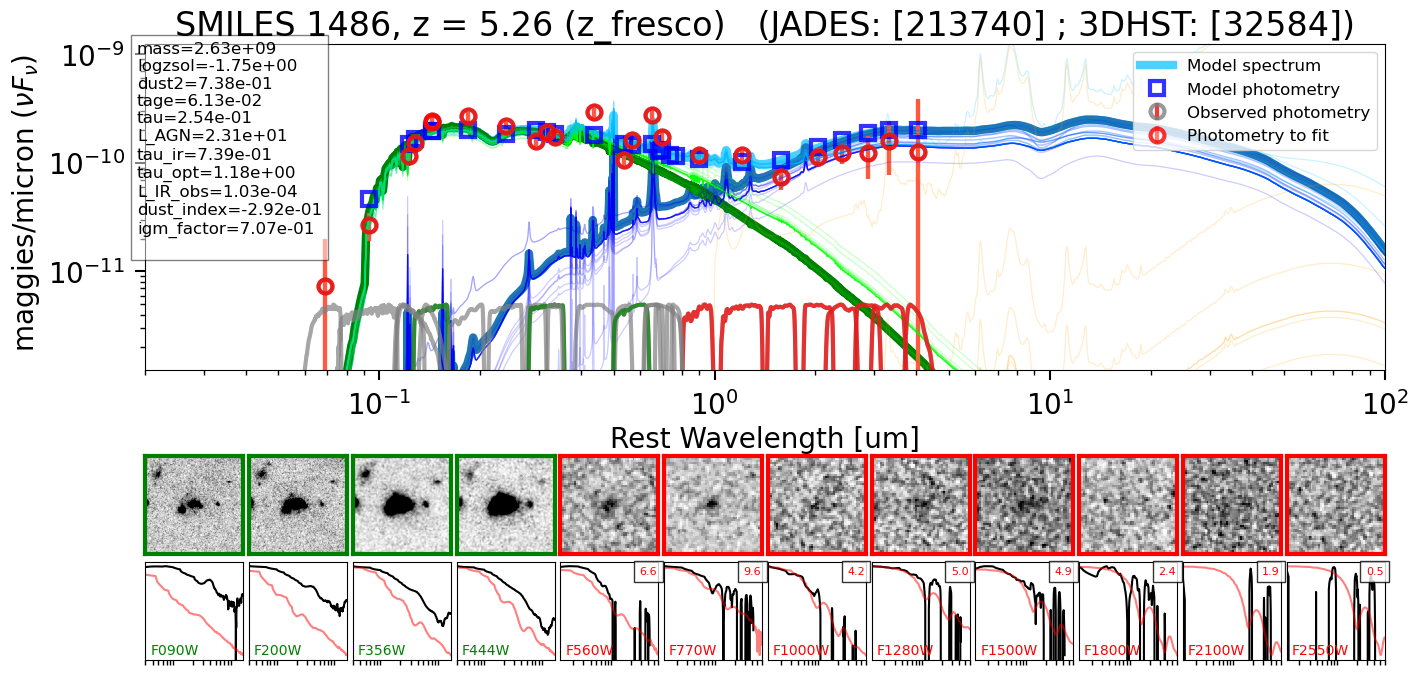
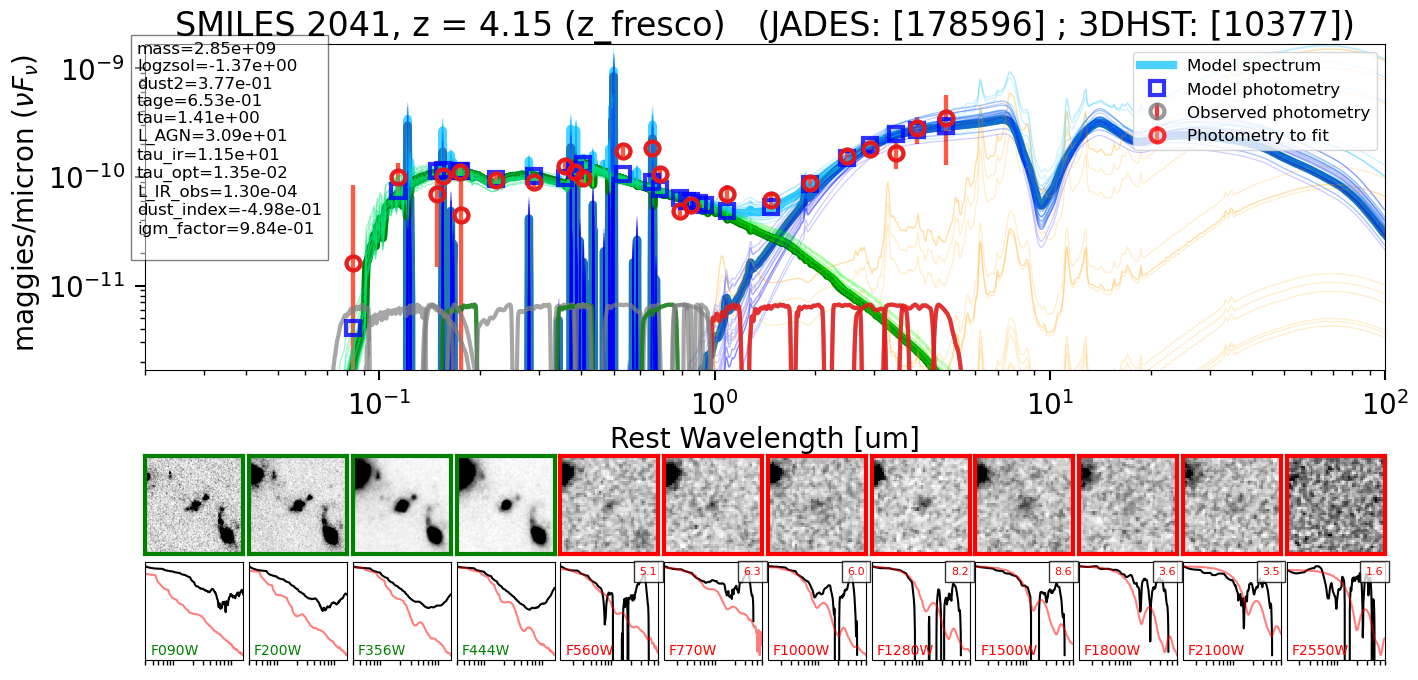
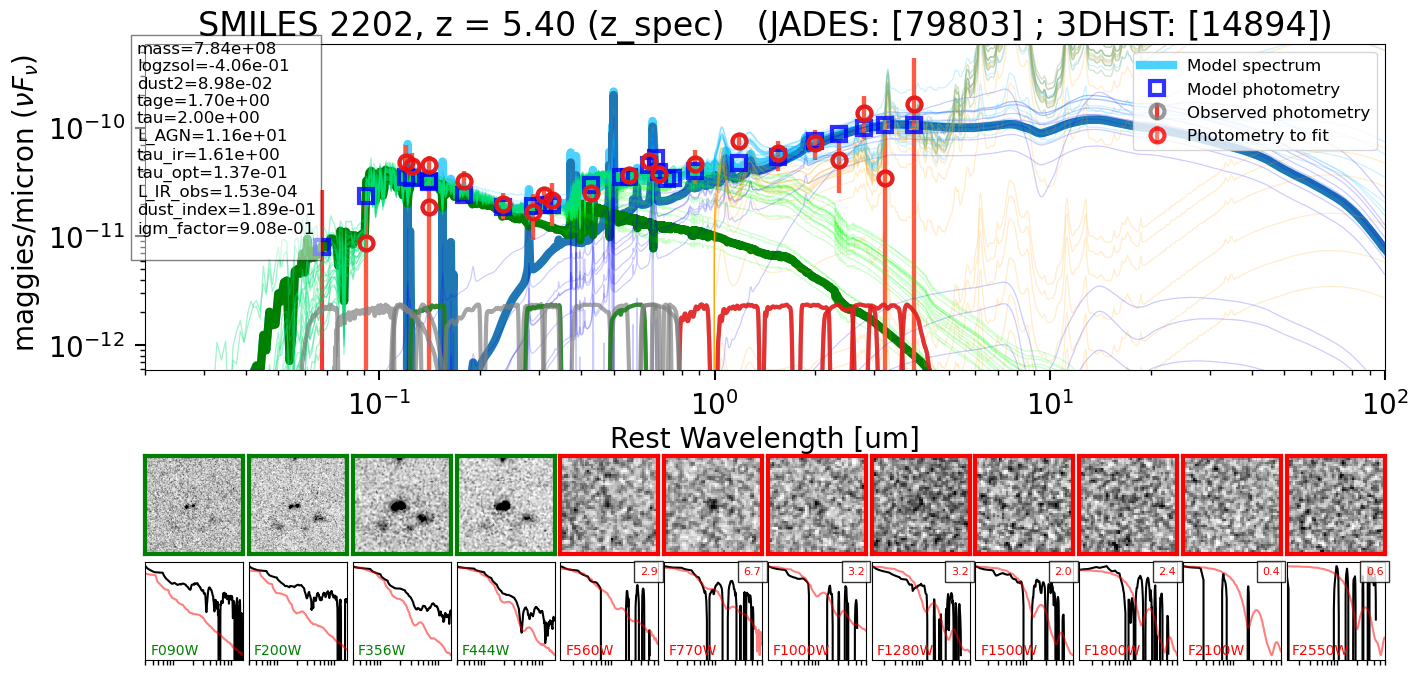
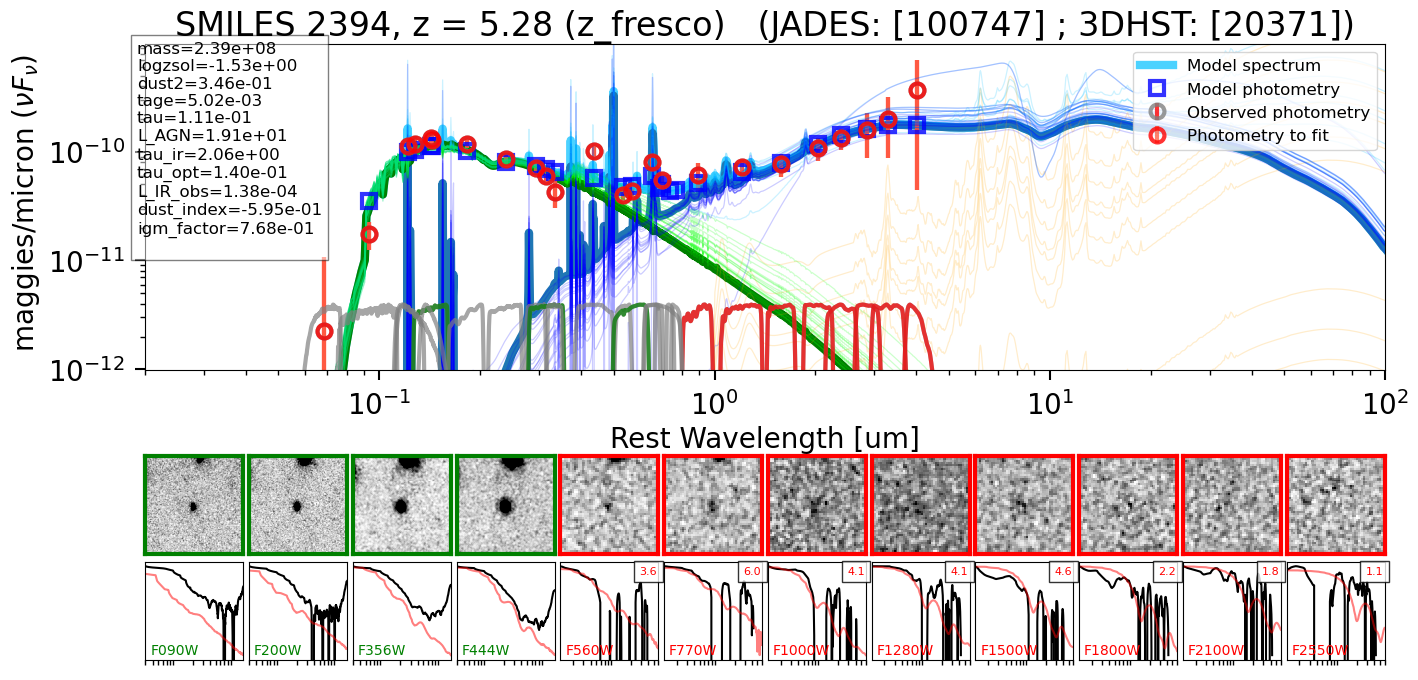
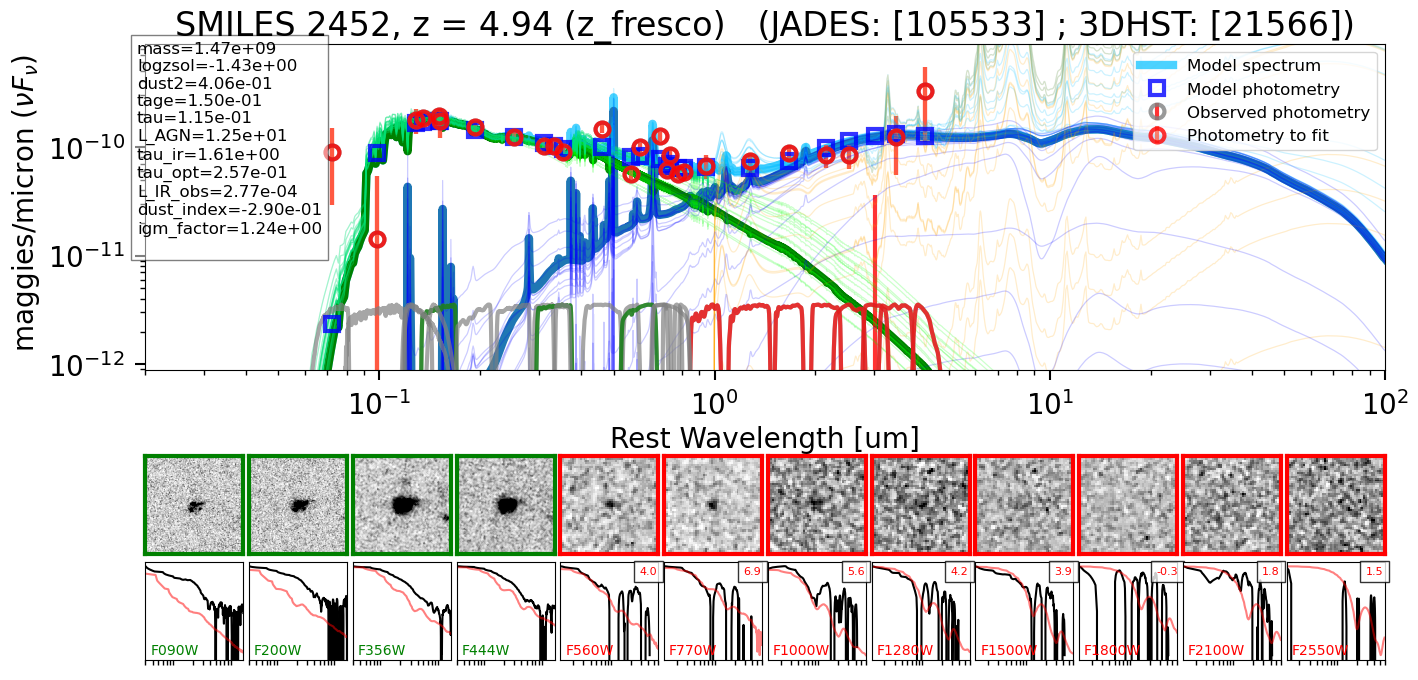
Combining the results above, we found 217 AGNs (or candidates) from SED analysis in total as listed in Table 1. In Figure 10, we present the AGN luminosity distribution as a function of redshift. Compared to the AGN sample selected in the pre-JWST era (Lyu et al., 2022a), the new sample contains more objects with lower bolometric luminosities and/or higher redshifts.
| MIRI ID | RA | Dec | z_type | sub-sample | |||
|---|---|---|---|---|---|---|---|
| 67 | 53.137839 | -27.87013 | 2.07 | z_easy | norm | 11.51 | 9.98 |
| 68 | 53.101515 | -27.86996 | 3.46 | z_easy | norm | 12.29 | 11.18 |
| ……… |
Note. — Only a portion of this table is shown here to demonstrate its form and content. The full table will be made avaliable with the published journal online

As mentioned above, there are several caveats in the AGN search among the extended and high- samples and our selections are conservative to reduce the number of false positives. In the future, we will improve these selections with more comprehensive analysis and additional data.
3.4 Other Selections in the SMILES Footprint
Besides SED fitting of MIRI sources, there are many other methods to identify AGNs. Now we describe the identification of radio-loud AGNs, broad-line AGNs and mid-IR variable AGNs from JWST data with the combination of datasets at other wavelengths when necessary, and then summarize AGN samples identified without the usage of JWST data within the same footprint.
3.4.1 Radio-Loud AGNs with MIRI and JVLA
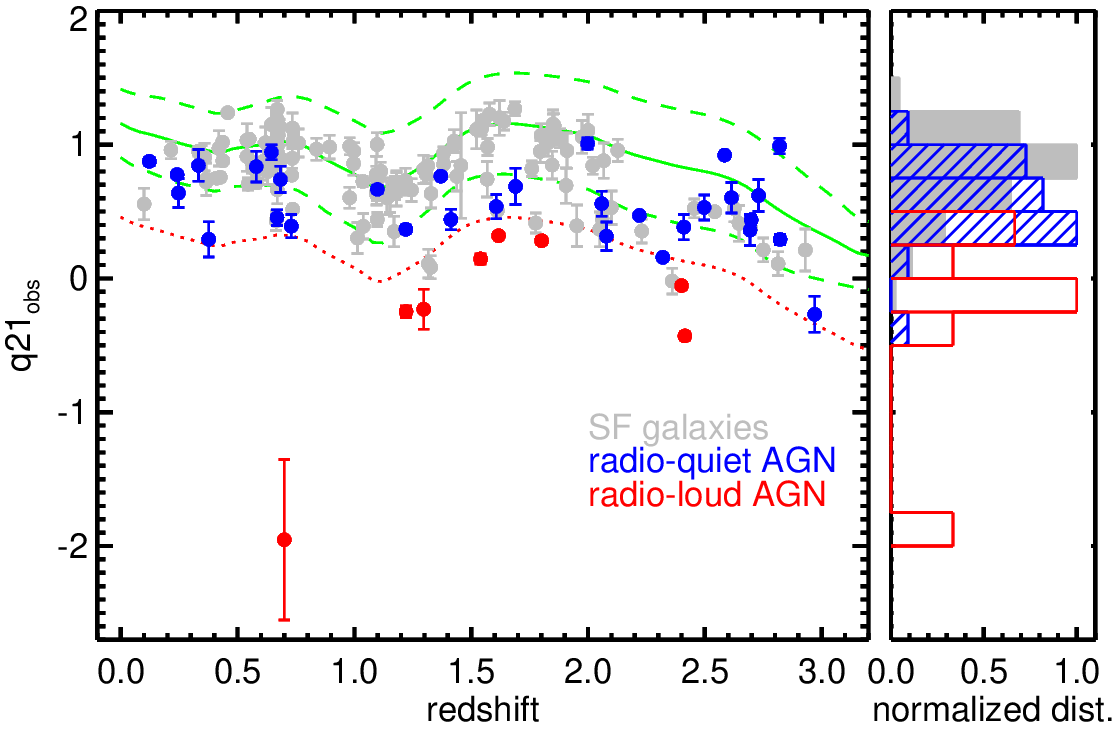
Since we now have deeper F2100W photometry than the previous Spitzer/MIPS 24m data, it is possible to improve the previous radio-loud AGN selections based on the ratio between the radio and mid-IR fluxes (i.e., [rtype_rl] in Lyu et al. 2022a). As the F2100W data is deeper than F2550W, we adopt to reveal outliers from the radio-infrared correlations for dusty star-forming galaxies, where is the observed MIRI F2100W flux and is the observed radio flux at 1.4 GHz. For the latter, we assume a power-law index of to estimate the 1.4 GHz flux density from 3 GHz, similar to Lyu et al. (2022a). Following the same strategy in Alberts et al. 2020, we determine the locus of SFGs by calculating at 0–3 from the Rieke et al. (2009) SFG templates at . An outlier from the SFG radio-infrared relation is defined as being 0.5 dex below the midpoint of SFG locus. Using this criterion, we identify 8 radio-loud AGNs among 167 MIRI sources that have been detected at 3 GHz, as shown in Figure 11. In total, there are 39 AGNs in this radio-detected sample and the radio loud fraction is about 20%.
3.4.2 Spectroscopically-identified broad-line AGNs with JWST
FRESCO has conducted deep NIRCam/grism observations with the F444W filter for the 62 arcmin2 area of GOODS-S that has a considerable overlap with our SMILES survey (see Figure 1), offering the chance to identify AGNs through broad-line emission. At , only one AGN has been reported at z=5.481 in GOODS-S, based on the broad H emission line (Matthee et al., 2023). Our MIRI SED fitting also identified this AGN (MIRI ID v0.4.2: 1104). We have also looked for AGN candidates at lower redshifts based on broad emission lines from Pa, Pa and He II (Lyu et al, in prep). All the sources we found have been previously identified in Lyu et al. (2022a).
In addition, a few AGNs in GOODS-S have been identified from JADES/NIRSpec spectral observations (Bunker et al., 2023). In terms of broad-line AGNs, there are only two: 10013704 (=5.92) and 8083 (=4.64) (Maiolino et al., 2023). In contrast to the FRESCO AGN, these objects are much fainter by selection. In our MIRI images, they are only marginally detected in F560W and/or F770W without additional measurements in other bands and thus we cannot conduct robust SED fittings for AGN selection.
3.4.3 Mid-IR Variable AGNs with NIRCam and IRAC
Given the deep IRAC and NIRCam images available across the field, we can also look for long-term mid-IR variable AGNs. We have degraded the JADES/NIRCam F356W images to match the PSF of Spitzer/IRAC band-1 mosaics and carried out local difference photometry to look for variable objects (Lyu et al., 2023, in prep). Nevertheless, no new AGNs have been revealed.
3.4.4 AGNs with weak Pa
Potential identification of AGN candidates from weak Pa compared with mid-infrared continuum is discussed in Appendix A. We have not yet applied this method; with current data it adds a small number of candidates.
3.4.5 AGN Selected in the Pre-JWST Era
In Lyu et al. (2022a), we have presented an AGN sample selected based on the pre-JWST data from X-ray to radio with eight different methods that included X-ray luminosity, X-ray-to-radio luminosity ratio, UV-to-mid-IR SED fitting, mid-IR IRAC color, radio-to-mid-IR ratio (for radio-loud AGN), radio slope (for flat spectral radio sources), and time variability in the X-ray and optical bands. We can now replace the AGN sample selected by IRAC color and SED fittings from the Lyu et al. (2022a) pre-JWST catalog with the new SED-identified AGNs obtained in this work using the improved JWST photometry. In the MIRI survey footprint, there are 203 pre-JWST candidate AGNs in total; only five of them do not have a MIRI counterpart. Among these pre-JWST AGNs without MIRI source association, four are identified by variability and one is identified by the X-ray to radio flux [x2r]. The latter object is also an X-ray source with very low S/N detection that does not have a MIRI counterpart, which therefore may be spurious.
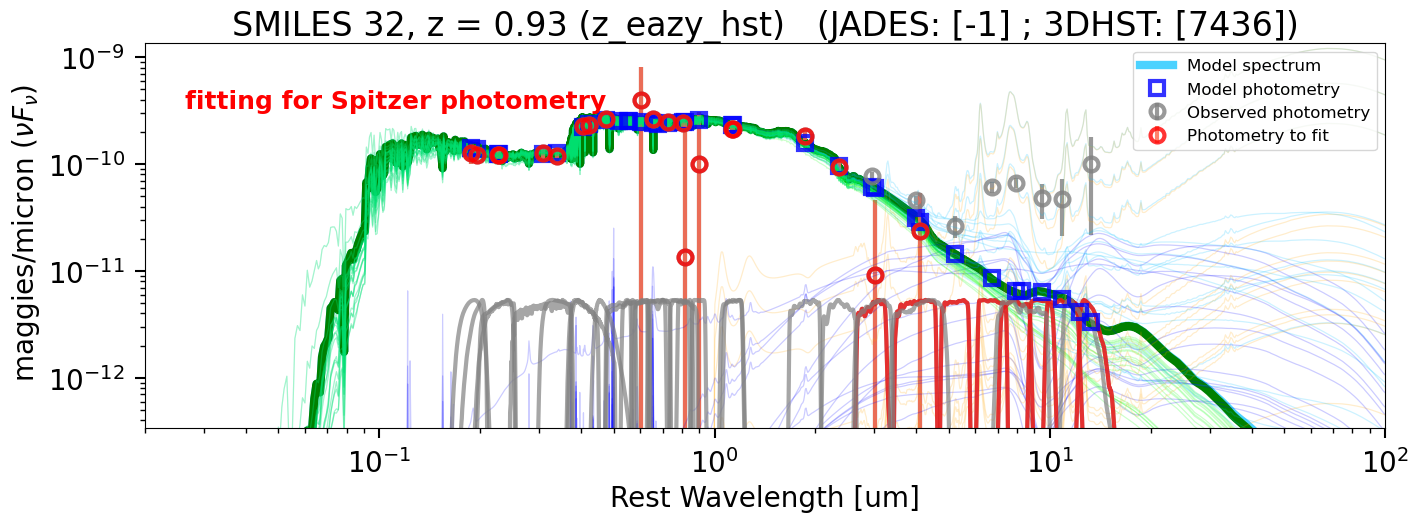
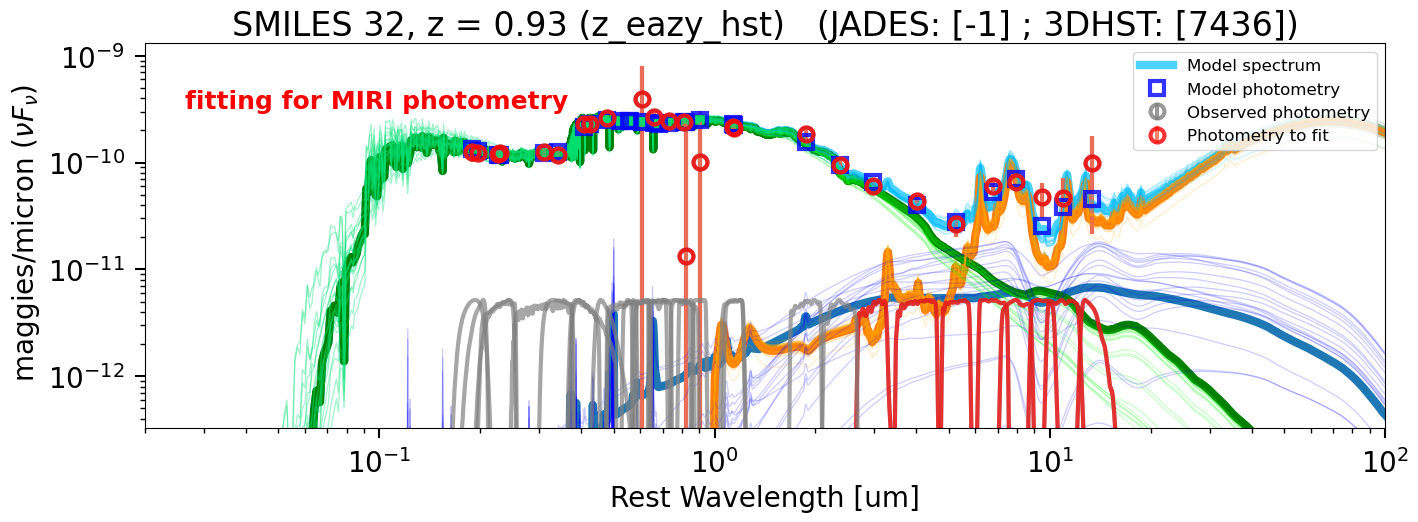
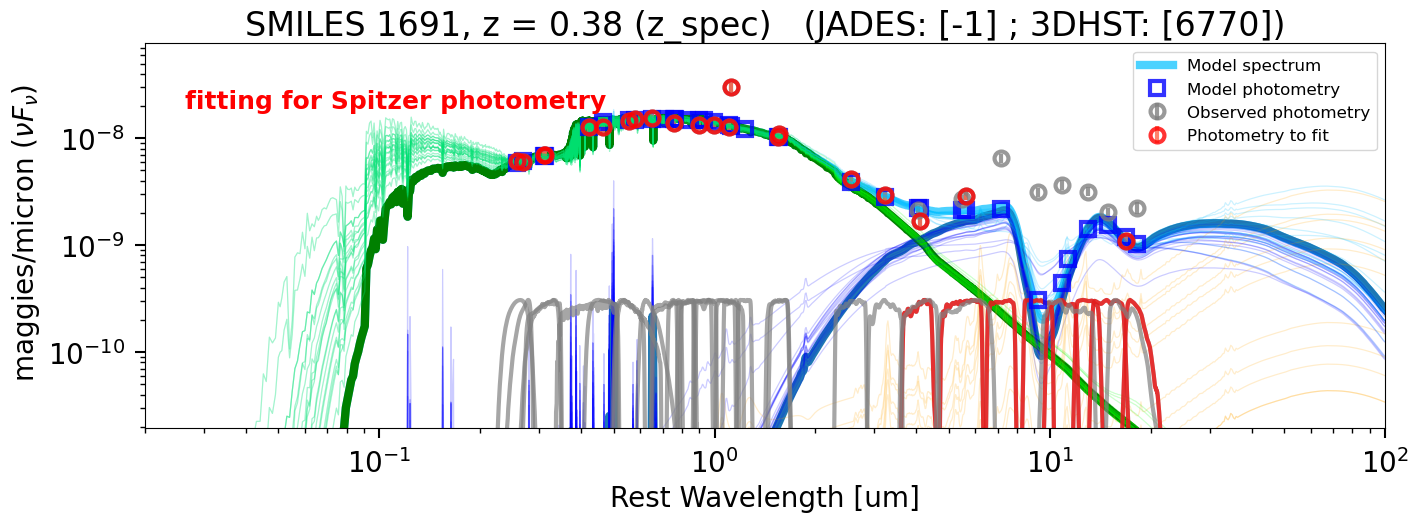
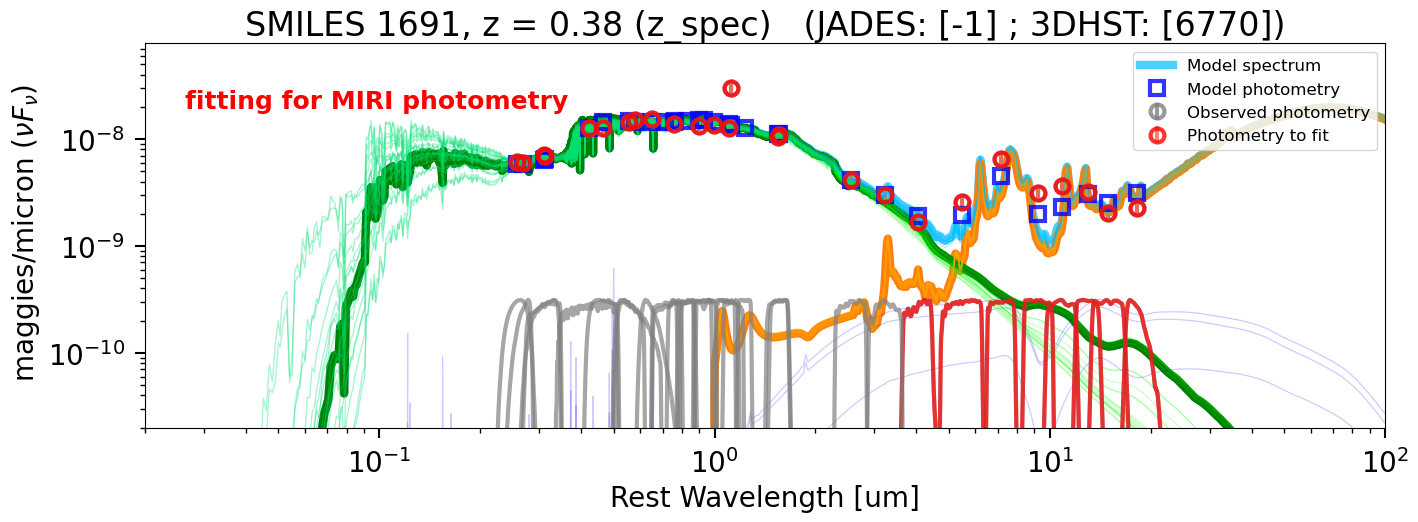
We can also compare the SED fittings with the Spitzer and JWST data for the same sources. Two examples are given in Figure 12. The first object (MIRI 32) does not show evidence for an AGN, since the SED constraints for wavelengths longer than IRAC band 2 are very limited in the shallower Spitzer data. In contrast, the new MIRI data points reveal this object is a composite galaxy with an obscured nucleus in the mid-IR. The second object (MIRI 1691) seems to be an obscured AGN based on the limited wavelength coverage by the Spitzer data while the new fittings with MIRI data prefer the star forming galaxy solution. In fact, the AGN solution can be ruled out due the extended MIRI source morphology.
For the other selections based on X-ray or radio properties, the new mid-IR JWST data do not have any influence.
4 AGN Statistics and Comparison of Selection Techniques
With the various selection methods presented above, we can now compile all known AGNs in the MIRI footprint and compare the relative performance of different selections. As described above, four variable AGN candidates and one X-ray-to-radio AGN candidate do not have MIRI counterparts and they are likely to be spurious; thus we will ignore them and focus the discussion on the MIRI-detected sources.
4.1 MIRI AGN Number Density
Given the survey area of 34 arcmin2, the total number density for the robust MIRI AGNs in the primary sample is 3.4 per arcmin2, or nearly eight AGNs per MIRI pointing. In addition, there are 2.9 AGNs per arcmin2 from the extended sample. For each band, the total MIRI-selected AGN (candidates) number densities are 6.4, 6.3, 5.6, 5.0, 4.7, 3.7, 3.2 and 2.1 arcmin-2 from F560W to F2550W (3 detections, corresponding to flux limits at 0.16, 0.13, 0.26, 0.36, 0.41, 1.0, 1.7 and 9.0 Jy). These estimates will evolve as we develop more sophisticated methods to differentiate the emission by warm dust in extended-sample galaxies from that of embedded AGNs. For now, these values should be treated as lower limits for total numbers of AGNs detected by MIRI since (1) due to the reduced sensitivities at longer wavelengths, we are likely missing obscured AGNs at high-; and (2) for the AGNs in the extended-sample galaxy population, we are using an extreme SFG template based on Haro 11 and it is possible that some AGNs are missed due to the conservative selection; (3) there are AGNs that have been identified by other selection techniques and that are detected by MIRI but are missed by the SED analysis, as shown in the upcoming section.
In Figure 13, we plot the number density of the various MIRI sources as well as the total AGN fraction as a function of observed flux for all the MIRI bands. In every band, the AGNs in the primary sample of massive galaxies have dominated the distribution at the bright end while those in the extended sample of low-mass galaxies and high- galaxies contribute mainly at the faint end. The total AGN fraction typically dominates the bright end with a fraction 40-60% and gradually drops toward the faint end to about 13–16%. For F560W, F770W and F1000W, the AGN fraction presents an apparent drop at the faint end, which is expected given our reduced selection efficiency since these sources are not detected at longer wavelengths. For F1280W, F1500W and F1800W, the AGN fraction seems to present a trend that decreases from the bright end to the intermediate flux followed by a gradual upturn towards the faint end. Given that the redshift distribution of our MIRI sources is peaked around 1–1.5, such trends are likely caused by the strong 7.7m PAH features from DSFGs.

4.2 Comparison to Previous AGN Samples
In Figure 14, we present the Venn diagram to show how the MIRI SED-identified AGN sample intersects with the CDF-S AGN catalog (Luo et al., 2017) and the pre-JWST AGN catalog (Lyu et al., 2022a). Over the same area, there are 94 X-ray detected AGNs reported from the 7Ms CDF-S catalog with an AGN number density about 2.8 per arcmin2. Among the 217 MIRI AGNs, only 48 of them (22%) have X-ray detections in the 7Ms CDF-S catalog and 38 of them (18%) are reported as AGN by Luo et al. (2017). In other words, our relatively shallow MIRI survey (2.17 hours per pointing) yields 2.4 times more AGNs than the deepest X-ray survey ( hr) and 80% are new discoveries.

Within the same footprint, there are 181 sources in the pre-JWST AGN catalog that include not only X-ray detected but also radio- and mid-IR detected AGNs. Still, about 78% of the MIRI AGN sample does not overlap with the pre-JWST AGN sample, demonstrating the huge discovery space offered by JWST. Among the 168 AGNs only identified by MIRI SEDs, there are 64 AGNs in massive galaxies at 4.0, 85 AGN candidates in dwarf galaxies and 19 high- AGN candidates. The latter two populations are mostly found by MIRI, as there are only 1 dwarf AGN candidate and 1 high- AGN candidate also identified by other selections.
Meanwhile, there are 56 CDF-S AGNs and 134 pre-JWST AGNs not identified by the MIRI SED analysis, which contribute to 60% and 74% of the corresponding catalog within the MIRI survey footprint. As pointed out in Lyu et al. (2022a), there is no single method or wavelength can identify all the AGNs. The results here provide very clear support to this argument — despite the much improved AGN hunting capability offered by MIRI, there are always some AGN population(s) left out and the combination of all possible selections across the electromagnetic spectrum is necessary to complete the AGN census.
To illustrate the new discovery space provided by MIRI in terms of AGN bolometric luminosity, Figure 15 shows the detection limits of the Chandra X-ray and JVLA radio bands as a function of redshift. In the X-ray, the Chandra data can only probe the most luminous MIRI AGNs, which is just the tip of the iceberg. This is consistent with the fact that only 33 out of 217 MIRI AGNs (15%) have reported X-ray luminosity that passes the AGN selection criteria. Most of the MIRI AGN sample are much fainter and the MIRI limit is about one order of magnitude deeper than the Chandra one.

Regarding the radio emission, there is a wide range of intrinsic variation of its strength from radio-loud to radio-quiet populations and we only show the AGN bolometric luminosity limits from the JVLA data from some average templates (see Lyu et al. 2022a for details about the template models). It is very clear that the current JVLA data is not deep enough to detect the radio emission from the radio-quiet MIRI AGNs and any detected radio emission is most likely coming from the host galaxies (Alberts et al., 2020). The JVLA data can probe the radio properties of bright radio-loud MIRI AGNs but would miss relatively faint radio-loud AGNs.
4.3 The Relative Performance of Different Selection Methods
To compare the yields of different selection methods and the possible overlaps, we used the UpSet visualization tool (Lex et al., 2014) to show the intersection of different AGN samples in Figure 16. Similar to the conclusions reached in Lyu et al. (2022a), the top three most efficient selection techniques are SED fittings, X-ray to radio luminosity cut ([X2R]) and X-ray luminosity cut, which identify 97.5% of the whole sample. For the remaining AGNs, 1.6% are identified by variability and 0.9% by the JWST-JVLA radio-loud AGN selection.

Despite the substantial improvement of the AGN SED identification with JWST data, about 34% of the known AGNs in the field have been missed and most of them have been identified by [X2R] (23% of the whole AGN sample). Meanwhile, 53% of the AGN are only revealed by the JWST SED analysis. The other selection methods such as [xtype_lumcut], [var], [jwst_rl] all include unique AGNs that are solely picked out by one method, despite their much smaller contribution compared to the [jwst_sed] sample. Given the discussion in Section 4.2, the yields of all the other selection methods are limited by the depth of X-ray or radio data and there should be additional galaxies detected by current MIRI data that have AGNs missed by the current SED analysis.
Regarding the different AGN groups (primary, extended and high-), the vast majority of extended-sample AGN candidates (89%) and high- AGN candidates (100%) have been identified through the MIRI SED analysis. For all the normal AGNs in massive galaxies at , the MIRI SED analysis has identified 114 out of 211 these objects (54%). Notably, after merging all AGN samples together, 18 out of 20 high- AGN candidates (92%), 88 out of 109 dwarf AGN candidates (81%) and 72 out of 211 normal AGNs (%) are only identified by MIRI SED fittings, where the error is from the sample size. In our previous study (Lyu et al., 2022a), which was less effective at identifying AGNs due to less complete data but covered a five times larger area, we found that 20% of the AGNs were very strongly obscured and 26% were undetected in the deepest Chandra data, qualitatively in agreement with the new estimate of the fraction missed in previous studies.
4.4 Comparison to MIRI AGN Studies in other fields
Pre-JWST efforts to use infrared photometry to identify AGNs are reviewed by Lyu & Rieke (2022a). Although they began with IRAS, they came into their own with the wide and deep surveys obtained with Spitzer and WISE (e.g., Lacy et al., 2004; Stern et al., 2005; Alonso-Herrero et al., 2006; Donley et al., 2008; Mateos et al., 2012; Asmus et al., 2020; Hviding et al., 2022). The possibilities are greatly expanded with JWST.
Based on four MIRI pointings from CEERS, Yang et al. (2023) reported 102 SF-AGN mixed systems and 25 AGNs from a total of 560 MIRI detections over a sky coverage of 9 arcmin2 by fitting the galaxy SEDs with CIGALE. If we combine their SF-AGN mixture and AGN categories, their reported AGN number density is 14 arcmin-2. Our fits include SF-AGN mixtures, so they can be compared directly. We find significantly lower numbers: 3.4 arcmin-2 for the main sample and 2.9 arcmin-2 for the extended one, for a total of 6.3 arcmin-2. The high AGN numbers in Yang et al. (2023) presumably come with a caution because of the possibility of significant contamination by low-mass galaxies. Some other important distinctions between the two studies are that: (1) we cover a larger field, with five times as many overall MIRI detections and with more ultra-deep ancillary data; (2) we have more accurate redshifts, with 40% spectroscopic ones and somewhat more accurate photometric ones for the rest; and (3) we separate galaxies assumed to have PAH emission from those without on the basis of mass/metallicity, whereas they leave this difference as a free parameter.888They reported anomalously weak PAH features in their median star forming SED. However, for the more massive galaxies in our sample at the relevant redshifts, the PAH features have strengths similar to local galaxies, as shown both by our fits in Figure 5 and by Spitzer spectra of similar galaxies amplified by lensing, e.g., Rigby et al. (2008).
Based on the same CEERS dataset, Kirkpatrick et al. (2023) found 3 AGNs per arcmin-2 at F1000W based on mid-IR color selections, compared to our 5 AGNs per arcmin-2 in the same band. There are two likely reasons for this low yield: (1) their template fitting is based on a single set of templates from Kirkpatrick et al. (2015) in which AGN SEDs are represented by power laws with a narrow range of slopes and thus do not represent the full range of AGN SED variations; (2) color-color plots are less diagnostic than SED fitting, as discussed extensively in Lyu & Rieke 2022a. Consequently, the AGN numbers identified in this way are expected to be less than those from SED analysis. Another limitation of the Kirkpatrick et al. (2023) study is that their templates include strong PAH emission for the normal SFGs and do not capture the IR behavior of lower-metallicity galaxies, which may result in misclassifying some dwarf galaxies with strong warm dust emission as obscured AGNs.
5 The Obscured AGN population
Given the AGN sample constructed from this work, we now discuss the obscured AGN population seen at different wavelengths.
5.1 The Fraction of Obscured AGNs from SED analysis
We first characterize the obscured AGN fraction of MIRI-selected AGNs and explore its dependence on the AGN luminosity and redshift. Our discussion will focus on the 114 MIRI-selected AGNs at , and =0–4. These criteria ensure a reasonably large sample to carry out statistical studies that cover a large range of source properties while minimizing the complications caused by dwarf and high-z AGN candidates where the selections are less robust.
Depending on the observed wavelengths and available spectral features, the definition of what is an obscured AGN varies in the literature. To first order, the obscuration of an AGN, i.e., whether the AGN can be seen or not, at a given band is caused by two major effects: (1) how much of the AGN emission can be diminished by obscuring materials (e.g., a dusty torus); (2) how strongly the host galaxy emission dilutes the AGN light. Our SED fittings provide direct measurements of both effects at rest-frame UV to mid-IR. We define AGN obscuration in three ways:
-
•
optically obscured: regardless of the AGN intrinsic luminosity and dust attenuation, if the observed AGN light fraction at rest-frame 0.1–1 is less than 20% of the whole galaxy, we count it as an optically obscured AGN;
-
•
IR obscured: the near- to mid-IR attenuation level of the AGN component is described by tau_ir, which can be transferred to the silicate strength following equation (negative value for absorption) (Lyu et al., 2022a). We define an AGN as IR obscured if , corresponding to tau_ir1.1;
-
•
IR heavily obscured: we define an AGN as IR heavily obscured if tau_ir3.85. This corresponds to the silicate strength of , indicating significant dust attenuation (e.g., Goulding et al., 2012).
In a statistical sense, the significance of AGN obscuration increases from optically obscured, IR obscured to IR heavily obscured, though the definition of the first case is complicated by AGN-host galaxy contrast as well as the SMC extinction law.


In Figure 17, we show how the obscured AGN fractions change with different source properties. All three obscuration fractions first increase with AGN bolometric luminosity from to , with the slope increasing from optical obscured, IR obscured to IR heavily obscured, and then dropping towards higher luminosity in a consistent way. For redshift evolution, all the obscured AGN fractions increase as a function of object redshift. We discuss the implications of these trends below.
Previous studies have repeatedly shown that the obscured AGN fraction decreases with increasing AGN luminosity (e.g., Lawrence, 1991; Simpson, 2005; Lusso et al., 2013), so the trend in the left panel of Figure 17 is a surprise at first glance. However, most of these studies have been limited to . At the low-luminosity end, the obscured fraction has been found to increase with AGN luminosity in the X-ray (e.g., Burlon et al., 2011). In particular, Buchner et al. (2015) did show a similar trend with the X-ray obscuration level peaking at erg s-1 and declining both above and below this value around Cosmic Noon (see also, e.g., Brightman & Nandra 2011 for a similar trend reported at low redshifts). Adopting the bolometric luminosity correction of (Duras et al., 2020), this corresponds to , consistent with the peak luminosity of our SED-inferred obscuration.
From a theoretical perspective, AGN obscuration occurs from the gas inflow that feeds the central SMBH, where the disk becomes unstable due to turbulence that produces a torus-like structure or dusty wind (e.g., Wada 2012, 2015; Hopkins et al. 2012; see review by Netzer 2015). Based on high-resolution hydrodynamic simulations, the obscuring gas column density presents positive correlations with the AGN luminosity (e.g., Blecha et al., 2018; Trebitsch et al., 2019). When the AGN becomes sufficiently bright, strong feedback is expected to blow out the surrounding material, reducing the chance of obscuration (e.g., Sanders et al., 1988; Hopkins et al., 2008).
Based on the analysis of the rest-frame UV to mid-IR SEDs, our study suggests an increasing fraction of obscured AGNs towards higher redshifts. Previous work in the X-ray based on the gas column density has also revealed an increasing fraction of obscured AGNs from the local Universe to Cosmic Noon (e.g., Ueda et al., 2003; La Franca et al., 2005; Treister & Urry, 2006; Buchner et al., 2015; Vijarnwannaluk et al., 2022). Such results are possibly associated with the large amount of gas in high redshift galaxies (e.g., Carilli & Walter, 2013) as well as the more vigorous growth of SMBHs in the early Universe (Inayoshi et al., 2020).
Finally, AGN selections in our extended and highz samples (dwarf and galaxies) are less secure or complete so we only report the integrated numbers of the obscured fractions for reference. For extended sample AGN candidates, the fraction of optically obscured, IR obscured and IR heavily obscured AGN is 86%, 76% and 42%. These numbers are subject, of course, to further confirmation of the AGN nature of individual members of this sample. For the AGN candidates at , the fraction of optically obscured, IR obscured and IR heavily obscured AGN is very roughly 54%, 75% and 46%. Given that the MIRI data is shallower than that from NIRCam, the obscured AGN fraction among these galaxies may be underestimated.
5.2 X-ray Bright but Mid-IR Faint AGNs
As shown in Section 4.2, our MIRI+NIRCam data is much deeper than other multi-wavelength data used for AGN selection in terms of source bolometric luminosity. Naively, one would expect that the superb JWST data can pick out all the AGNs found at other wavelengths. However, this is not the case. Notable examples are 23 X-ray bright AGNs not identified by SED fittings. In other words, these systems are X-ray detected bright AGNs but very faint in the optical to the mid-IR.
In Figure 18, we illustrate the locations of such objects on the X-ray luminosity vs the rest-frame 6 AGN luminosity plot. Previous studies have established a strong correlation between the absorption-corrected X-ray luminosity and the AGN luminosity at 6 m for most AGNs (e.g., Asmus et al., 2015; Stern, 2015; Mateos et al., 2015; Chen et al., 2017). For AGNs identified by both MIRI SED fitting and X-rays, such a trend also exists despite a large scatter. However, there are many X-ray bright AGNs with very weak AGN 6m emission (left side of Figure 18). In fact, even if we ignore the SED decomposition and assume all the observed flux is from the AGN, eleven objects cannot be moved near the typical relation.

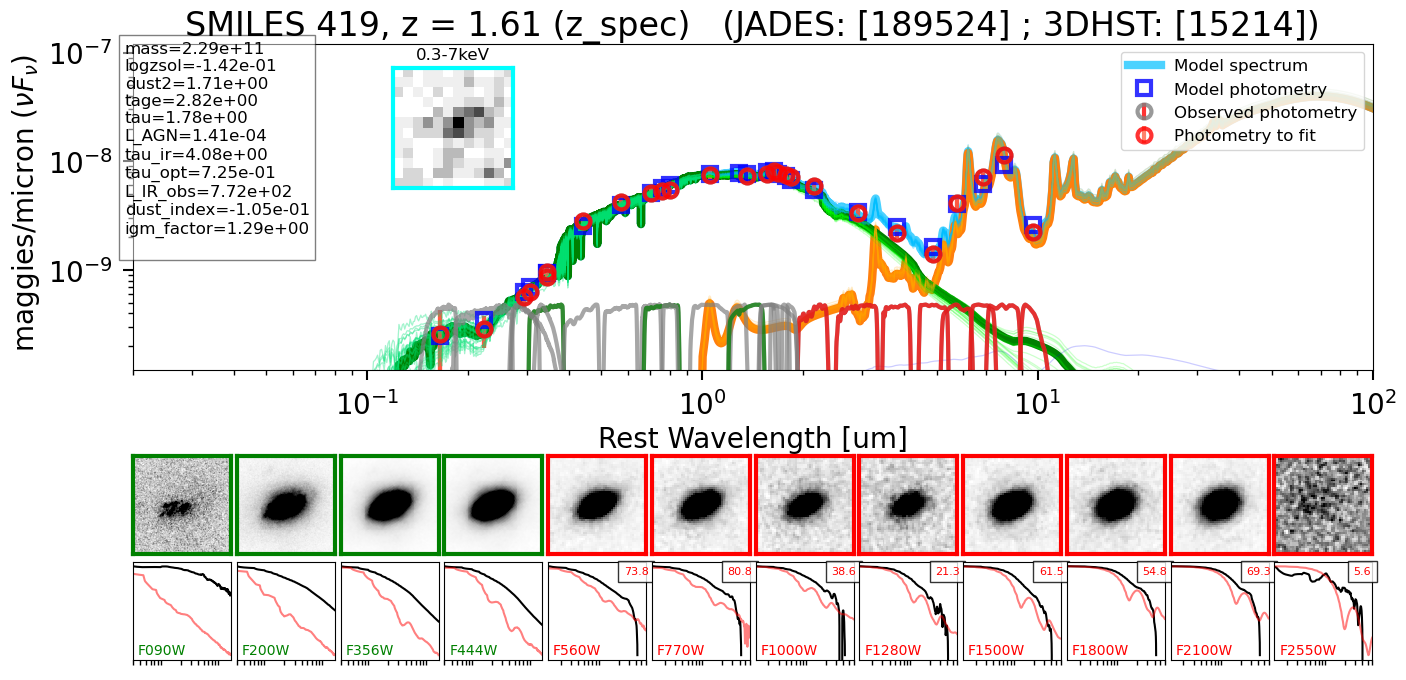
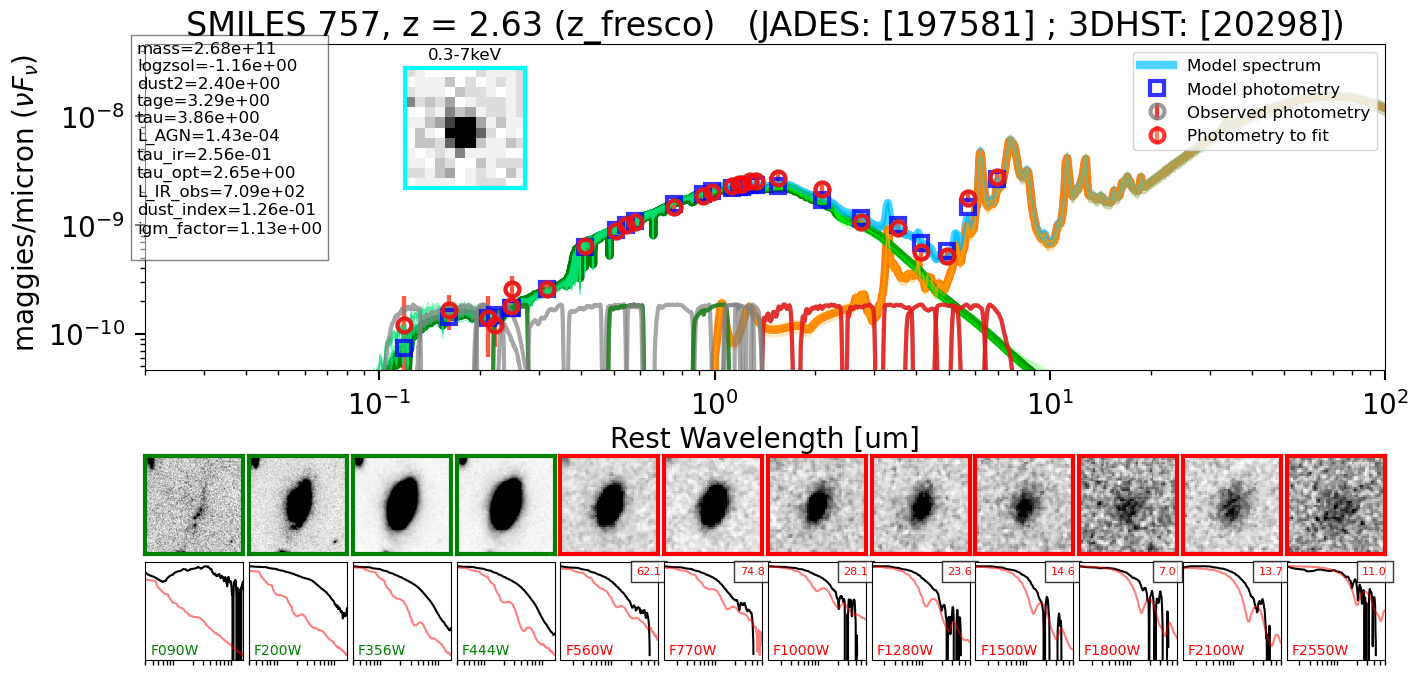
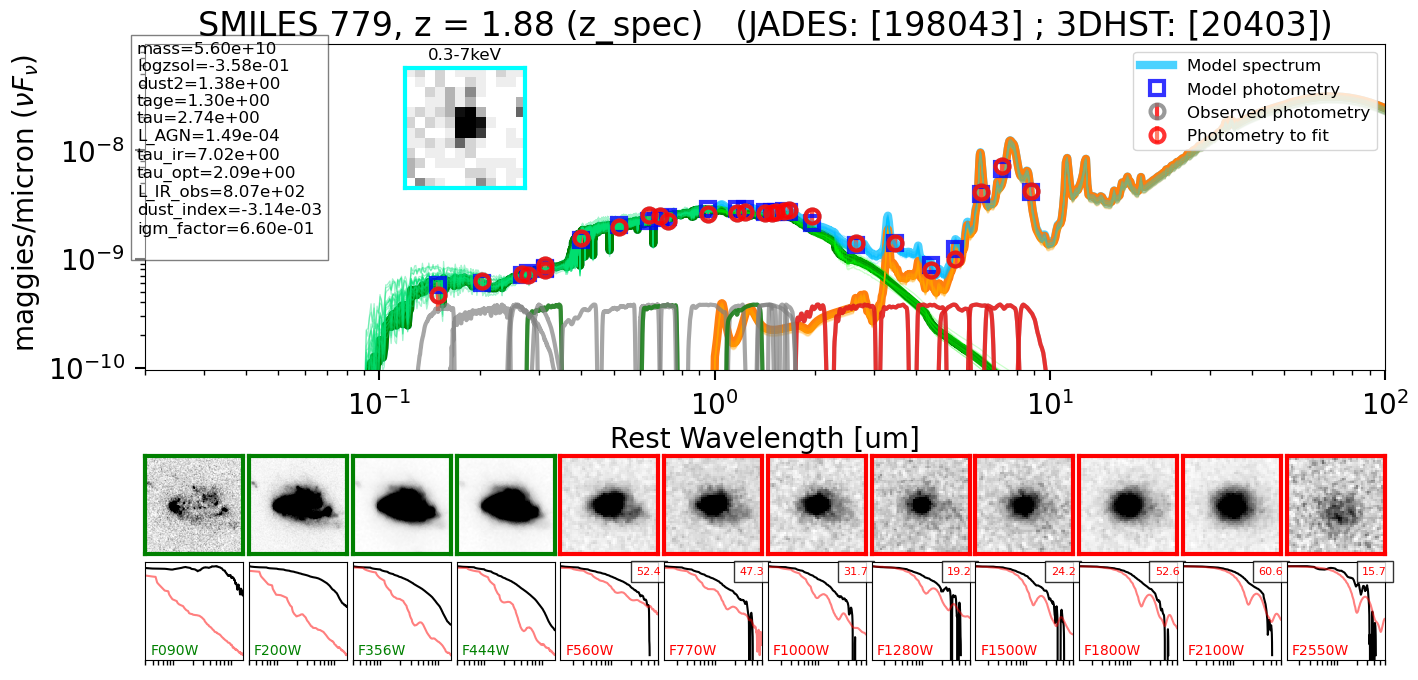
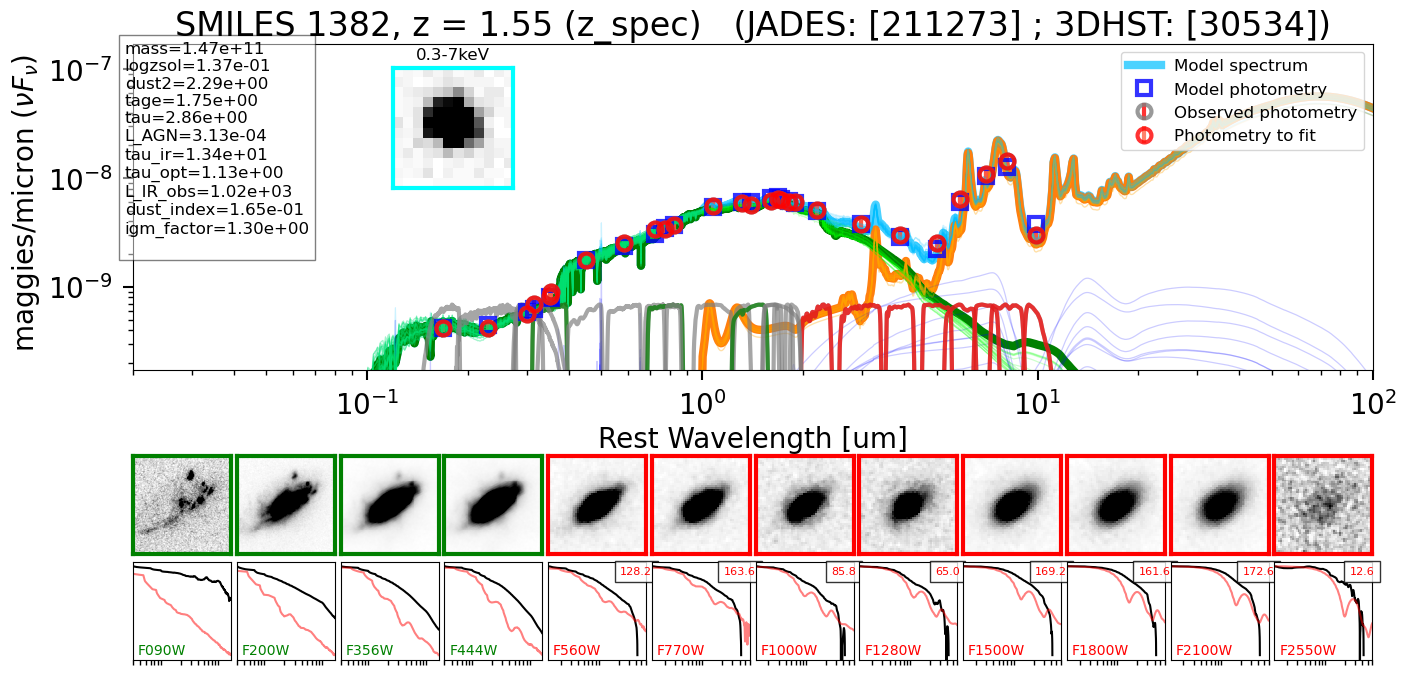
We have carefully inspected these objects. Besides 8 objects with noisy SEDs or degenerate fitting results, 15 do not show any AGN evidence in the UV-to-mid-IR SEDs. In Figure 19, we present some example SEDs with the cutouts from NIRCam, MIRI and Chandra. Besides the unresolved SED analysis, all these systems are extended in both NIRCam and MIRI images, consistent with the lack of AGN signatures. Meanwhile, their emission is very strong in the X-ray. Similar AGNs have been reported previously (LaMassa et al., 2019; Lyu et al., 2022a).
One possible explanation could be dust-deficient AGNs that lack the hot/warm dust emission (Lyu et al., 2017). If we limited the sample to X-ray detected AGNs, the fraction of such objects is about 16–25%, consistent with the typical fraction of dust deficient AGN in an IR-unbiased sample as reported in Lyu et al. (2017). Another possibility is that the X-ray emission of these AGNs is boosted by, e.g., jets. Typically, the X-ray jet emission is associated with radio loud AGNs. Among these 23 X-ray bright AGNs, 15 are detected by the JVLA at 3 GHz – one is a confirmed radio-loud AGN, two are ambiguous cases and 12 are consistent with typical SFGs. It is therefore likely that the X-ray bright but mid-IR faint AGNs arise from both the radio-loud and radio-quiet populations.
5.3 MIRI AGNs without X-ray Detections
As described in Section 4.2, a large fraction of our MIRI AGNs do not have X-ray detections (see also Figure 18). The intrinsically faint AGNs will not be detected in X-ray even if they are unobscured due to the shallower Chandra detection limits compared to MIRI. For relatively bright AGNs, the X-ray non-detected AGNs can be interpreted as being Compton-thick or intrinsically X-ray weak. We now focus on the first possibility and put some constraints on the Compton-thick AGN fractions with the aid of the MIRI SED results.
Since our SED fittings provide a measurement of the AGN bolometric luminosity, we can convert them to the equivalent X-ray luminosity for different gas column densities and compare with observations. In Figure 20, we show the ratio between the SED-derived bolometric luminosity and the X-ray luminosity at 2–10 keV against the AGN bolometric luminosity for MIRI-identified AGNs at different redshifts. We compute an upper limit to the 2–10 keV luminosity assuming no extinction for objects without X-ray detections. We also plot the bolometric correction for the extinction-corrected AGN X-ray luminosity at 2–10 keV from Duras et al. (2020) as well as the expected correlation if the X-ray emission is Compton-thick with gas column density cm-2. The relative location of an AGN on this diagram is determined by its intrinsic luminosity as well as the gas column density. AGNs above the red curve can be counted as Compton-thick AGNs.

The weak X-ray emission of most AGNs at relatively low redshift is well-explained in terms of absorption (Saade et al., 2022; Wang et al., 2022). Above 1, we found the obscured AGN fraction gradually increases with redshift, possibly due to an increase in the number of Compton thick sources. Our finding of 34% X-ray-undetected AGNs with SEDs suggestive that they are Compton thick aligns well with the typical explanation of diffuse X-ray background (e.g., Akylas et al., 2012). Although there are some variations, a summary of its properties is: (1) % of the hard X-ray (2–7 keV) background is resolved into individual sources by the Chandra 7 Msec exposure (Luo et al., 2017; Cappelluti et al., 2017); (2) models to fit the background are centered on the AGN population at redshifts of 0.5 - 2; and (3) many of these models invoke a population of Compton thick AGNs not detected in X-rays to fit the background around 30 keV (e.g., Gilli et al., 2007; Moretti et al., 2009; Treister et al., 2014). It should be possible to advance our understanding of the X-ray background significantly through deep JWST surveys for infrared-discovered AGNs, although such studies are beyond the scope of this paper.
Although the increase of the fraction of X-ray undetected AGN population apparently continues for 3, Compton absorption becomes weak at the relevant rest-frame energies999For example, at z = 5.28, the redshift of MIRI 1104, the hard X-ray 2–7 keV band is at rest energies of 12–45 keV. Rather than obscuration, some of these AGNs may be intrinsically weak in the X-ray. Indeed, the existence of such objects has been suggested previously by, e.g., Leighly (2004); Simmonds et al. (2016); Lyu et al. (2022a). Stacking the X-ray observations for all six of the AGNs in Figure 9 yields non-detections of erg cm-2 s-1 for the 0.5 2 keV band and erg cm-2 s-1 for the 2 7 keV band. These stacked values reinforce the result in Figure 20 that the high redshift AGNs are in general very X-ray weak.
We now explore the implications of this result. The X-ray output of high redshift quasars in general does not show any deficiency of X-ray emission with an average of for those with measured values (omitting two outliers), using the results from Li et al. (2021). This does not exclude weak X-rays from the undetected members, which are the majority of the sample, although these authors conclude that the relation of the X-ray outputs to the other parameters of the quasars is similar to that for lower redshift quasars. The low X-ray fluxes for the lower luminosity high-z AGNs could arise due to Compton thick absorption with cm-2, but such high absorbing columns are very rare locally. The infrared AGN-driven SED shapes for the six sources in Figure 9, extending down to 1–2 m and even shorter wavelengths, are similar to those of typical local Type-2 Seyfert galaxies, rather than extreme Compton thick examples like NGC 1068. A hint toward an alternative explanation is provided by the very X-ray weak AGNs in a number of low-metallicity dwarf galaxies (Dong et al., 2012; Simmonds et al., 2016; Cann et al., 2021; Bohn et al., 2021; Latimer et al., 2021), often two orders of magnitude below the values expected by analogy with AGNs in massive galaxies. That is, the behavior might be associated with low metallicity in modest mass high redshift host galaxies.
Hard X-rays from AGNs are produced by Compton scattering in the coronal regions above their accretion disks. Therefore, a process that disrupts the coronal regions could suppress the X-ray outputs. The dwarf galaxies have strong AGN-driven outflows that are believed to be effective at clearing gas from the galaxies (Bohn et al., 2021); these outflows are also candidates to disrupt the coronal regions. A possible issue with this explanation is that a small sample indicates that the outflow and coronal line strengths may be correlated (Bohn et al., 2022). Overall, this is a complex situation requiring much larger samples than provided in this paper to test, particularly since AGN variability is likely to influence the observational properties of any sample of AGNs.
6 The Blind Men and the Elephant: How to Build a Complete AGN Sample?
The process of selecting AGNs is like the story of the blind men and the elephant. Every study is limited by the wavelength regime and survey depth, so the results are inevitably biased and incomplete. One might expect that a complete picture can be obtained by combining all the results together as this ancient parable hints. Unfortunately, the AGN population is more diverse than elephants. Regardless of the disagreements they have, the blind men at least knew they were standing around the same animal and the elephant would reveal consistent features when a blind person touched the right part. In contrast, astronomers typically work on different samples built at different wavelengths and the AGNs seen in one study can be totally missed in another study due to e.g., the intrinsic variation of AGN properties, the apparent obscuration caused by dust and gas, the efficiency of the selection method for AGN, and the data quality that the selection has to be based on.
As also shown in previous efforts, there is no single wavelength regime or selection technique that can pick out all AGNs. In Section 4, we show the existence of X-ray bright AGNs without relevant IR signatures in the JWST SEDs and bright mid-IR AGNs without X-ray detections. As a result, we should combine all the multi-wavelength datasets and use as many selection methods as possible to improve the AGN census (see also Lyu et al. 2022a). Albeit the great advances that have been (or will be) brought by JWST, new X-ray and IR telescopes are still needed to complete the census of the obscured AGN population at high-redshift. The time-domain surveys from, e.g. the Roman Telescope, are also expected to bring significant progress on AGN selections.
In terms of selection techniques, the so-called gold standards for AGN identification, such as very broad emission lines, bright X-ray emission or clear hot dust signatures, are definitive but certainly not complete indicators. Given how complicated and diverse the AGN population is, we could miss a substantial fraction of AGNs if the selections rely on these most obvious features, as seen in Section 5. Traditionally, when people call some object an “AGN candidate”, there is a hint that some relatively robust method may confirm its nature in the future, which is actually not guaranteed to happen. A practical solution is to refine one selection to make sure it is robust enough, so we can drop the ‘candidate’ modifier and trust the selected objects as real AGNs. In this regard, we need to review our techniques carefully and compare the performance with other techniques. For example, for SED fittings, the SED models should match the observations and have enough predictive power, rather than just providing a good fit to known AGNs merely due to the large parameter space. When we are confident that the technique works for bright objects where other multi-wavelength selections can also confirm the AGN nature, we can cautiously extend its usage to faint objects.
Besides refining the AGN selections, there is also a balance between robustness and completeness that needs to be considered carefully. When multi-wavelength data is available, it is reasonable to relax the criteria and use multiple (relaxed) selections to complete the AGN census. From the AGN hints from other wavelengths, selections at one band can be calibrated and improved (e.g., Donley et al., 2012; Hviding et al., 2022). Meanwhile, we should also be aware of the limitations of each selection technique so it is not used inappropriately. For example, we should not adopt the classical AGN color criteria or SED fittings with normal galaxy templates to look for AGN in the dwarf galaxy population (e.g., Hainline et al., 2016). As we enter a new regime, relevant tools need to updated or developed.
Given the various factors that influence the observed AGN behavior at different wavelengths, whether an AGN sample is complete or not is actually determined by how we define the term “AGN” observationally, which can be very controversial (e.g., the extended discussion about how to classify LINERs, now understood to be a mixed category). We should keep in mind that our ultimate goal is not to collect all kinds of AGN samples but to understand the physics behind the AGNs themselves and the SMBH-galaxy interaction. In this sense, one intriguing future direction is to combine the observed AGN statistics with the predicted observables from cosmological simulations that involve reasonable treatments of various selection biases. This approach has more physics behind it and can mitigate the issues of obscured AGNs that may not be easily revealed by the data. A direct comparison between models and observations benefits everyone — theorists can calibrate their models with data to make better predictions and observers are motivated to look for new populations suggested by theorists. If one day we could build such a physical framework that matched all the key empirical correlations between SMBHs and galaxies with good predictive power for the observed AGN statistics at different wavelengths, our long journey to complete the AGN census might reach its final end.
7 Summary
In this work, we presented the first results on AGN selection and demographics from SMILES, a JWST Cycle 1 GTO program that has targeted the central region of GOODS-S with eight MIRI filters from 5.6 to 26 . Combining the MIRI data with JADES NIRCam and HST photometry at shorter wavelengths, we conducted comprehensive SED analyses of 3273 MIRI-sources and reported 217 AGNs over a footprint of 34 arcmin2. This MIRI-selected AGN sample includes 111 AGNs in the primary sample of normal massive galaxies, 86 AGN candidates in the extended sample of dwarf galaxies and 20 high-z AGN candidates at z 4. Our major conclusions are:
-
•
We reached a total number density of SED-identified AGNs of 6.6 arcmin-2, which is over two times larger than that for the confusion-limited Spitzer/MIPS 24 m observations of the same field (Lyu et al., 2022a). In addition, compared to the deepest X-ray survey by Chandra in the same footprint, our relatively shallow MIRI surveys (2.17 hours per pointing) yield 2.4 times more AGNs, of which 80% are new discoveries.
-
•
AGNs in our primary sample of massive galaxies should be sufficiently luminous for detection by previous searches in other wavebands, assuming they are not obscured. However, 34% of the AGNs found in our study do not have previous identifications. This result indicates that 34 6% of AGNs have been missed due to obscuration, where the error arises from the modest sample size (114);
-
•
For the first time at z 2, JWST/MIRI is detecting significant numbers of AGNs in low-mass galaxies [] – from our conservative SED identifications, they are comparable in number with the AGNs we have found in the more massive primary sample;
-
•
We confirm the existence of X-bright but mid-IR faint AGNs and suggest that they may be dust-deficient AGNs that do not present strong hot dust SED features, or AGNs with X-ray emission boosted by e.g. a jet, or a mixture of both populations;
-
•
80% of the MIRI-selected AGNs do not have X-ray detections. Most of them are too faint to be detected by Chandra, some of which are likely to be Compton-thick AGNs. For MIRI AGNs without X-ray detections at higher redshifts (4–6), they may be intrinsically weak in the X-ray, possibly due to the lack of a strong corona component due to their lower metallicity environment.
-
•
Based on SED analysis, we find the obscured AGN fraction increases with AGN luminosity towards L 1011 L⊙ and then drops at higher luminosity. The obscured AGN fraction also increases with redshift, regardless of the detailed definitions. For AGNs at , it is likely half of the population is heavily obscured.
-
•
Despite the comprehensive MIRI photometric data and the substantially improved SED selections, about 28% of the known AGN (candidates) in the field have been missed by the SED analysis, indicating a huge diversity of AGN properties that challenges the completion of the AGN census. In other words, no single method or wavelength can identify all the AGNs and a combination of multi-wavelength dataset and selection techniques is always desired;
Our results demonstrate the unique power of JWST MIRI for AGN selection and characterization. This paper summarizes first results from a modest initial survey and we look forward to larger and more ambitious studies.
References
- Abazajian et al. (2009) Abazajian, K. N., Adelman-McCarthy, J. K., Agüeros, M. A., et al. 2009, ApJS, 182, 543. doi:10.1088/0067-0049/182/2/543
- Adams (1977) Adams, T. F. 1977, ApJS, 33, 19. doi:10.1086/190416
- Alberts et al. (2020) Alberts, S., Rujopakarn, W., Rieke, G. H., et al. 2020, ApJ, 901, 168. doi:10.3847/1538-4357/abb1a0
- Alexander & Hickox (2012) Alexander, D. M. & Hickox, R. C. 2012, New A Rev., 56, 93. doi:10.1016/j.newar.2011.11.003
- Alonso-Herrero et al. (2006) Alonso-Herrero, A., Pérez-González, P. G., Alexander, D. M. et al. 2006, ApJ, 640, 167, doi:10.1086/499800
- Álvarez-Márquez et al. (2023) Álvarez-Márquez, J., Crespo Gómez, A., Colina, L., et al. 2023, A&A, 671, A105. doi:10.1051/0004-6361/202245400
- Akylas et al. (2012) Akylas, A., Georgakakis, A., Georgantopoulos, I., et al. 2012, A&A, 546, A98. doi:10.1051/0004-6361/201219387
- Ananna et al. (2019) Ananna, Tonima Tasnim, Treister, Ezequiel, Urry, C. Megan et al. 2019, ApJ, 871, 240, doi:10.3847/1538-4357/aafb77
- Aniano et al. (2020) Aniano, G., Draine, B. T., Hunt, L. K. et al. 2020, ApJ, 889, 150, doi:10.3847/1538-4357/ab5fdb
- Asmus et al. (2015) Asmus, D., Gandhi, P., Hönig, S. F., et al. 2015, MNRAS, 454, 766. doi:10.1093/mnras/stv1950
- Asmus et al. (2020) Asmus, D., Greenwell, C. L., Gandhi, P., et al. 2020, MNRAS, 494, 1784. doi:10.1093/mnras/staa766
- Bacon et al. (2023) Bacon, R., Brinchmann, J., Conseil, S., et al. 2023, A&A, 670, A4. doi:10.1051/0004-6361/202244187
- Bunker et al. (2023) Bunker, A. J., Cameron, A. J., Curtis-Lake, E., et al. 2023, arXiv:2306.02467. doi:10.48550/arXiv.2306.02467
- Barro et al. (2011a) Barro, G., Pérez-González, P. G., Gallego, J., et al. 2011, ApJS, 193, 13. doi:10.1088/0067-0049/193/1/13
- Barro et al. (2011b) Barro, G., Pérez-González, P. G., Gallego, J., et al. 2011, ApJS, 193, 30. doi:10.1088/0067-0049/193/2/30
- Baskin & Laor (2018) Baskin, A. & Laor, A. 2018, MNRAS, 474, 1970. doi:10.1093/mnras/stx2850
- Beckwith et al. (2006) Beckwith, S. V. W., Stiavelli, M., Koekemoer, A. M., et al. 2006, AJ, 132, 1729. doi:10.1086/507302
- Blecha et al. (2018) Blecha, L., Snyder, G. F., Satyapal, S., et al. 2018, MNRAS, 478, 3056. doi:10.1093/mnras/sty1274
- Bohn et al. (2021) Bohn, T., Canalizo, G., Veilleux, S., et al. 2021, ApJ, 911, 70. doi:10.3847/1538-4357/abe70c
- Bohn et al. (2022) Bohn, T., Canalizo, G., Satyapal, S., et al. 2022, ApJ, 931, 69. doi:10.3847/1538-4357/ac6870
- Brammer et al. (2008) Brammer, G. B., van Dokkum, P. G., & Coppi, P. 2008, ApJ, 686, 1503. doi:10.1086/591786
- Brightman & Nandra (2011) Brightman, M. & Nandra, K. 2011, MNRAS, 413, 1206. doi:10.1111/j.1365-2966.2011.18207.x
- Buchner et al. (2015) Buchner, J., Georgakakis, A., Nandra, K., et al. 2015, ApJ, 802, 89. doi:10.1088/0004-637X/802/2/89
- Burlon et al. (2011) Burlon, D., Ajello, M., Greiner, J., et al. 2011, ApJ, 728, 58. doi:10.1088/0004-637X/728/1/58
- Bushouse et al. (2022) Bushouse, H., Eisenhamer, J., Dencheva, N., et al. 2022, Zenodo doi:10.5281/zenodo.7795697
- Cann et al. (2021) Cann, J. M., Satyapal, S., Rothberg, B., et al. 2021, ApJ, 912, L2. doi:10.3847/2041-8213/abf56d
- Carilli & Walter (2013) Carilli, C. L. & Walter, F. 2013, ARA&A, 51, 105. doi:10.1146/annurev-astro-082812-140953
- Cappelluti et al. (2017) Cappelluti, N., Li, Y., Ricarte, A., et al. 2017, ApJ, 837, 19. doi:10.3847/1538-4357/aa5ea4
- Chen et al. (2017) Chen, C.-T. J., Hickox, R. C., Goulding, A. D., et al. 2017, ApJ, 837, 145. doi:10.3847/1538-4357/837/2/145
- Conroy et al. (2009) Conroy, C., Gunn, J. E., & White, M. 2009, ApJ, 699, 486. doi:10.1088/0004-637X/699/1/486
- Conroy & Gunn (2010) Conroy, C. & Gunn, J. E. 2010, ApJ, 712, 833. doi:10.1088/0004-637X/712/2/833
- Del Moro et al. (2016) Del Moro, A., Alexander, D. M., Bauer, F. E. et al. 2016, MNRAS, 456, 2105, doi:10.1093/mnras/stv2748
- De Rossi et al. (2018) De Rossi, M. E., Rieke, G. H., Shivaei, I., et al. 2018, ApJ, 869, 4. doi:10.3847/1538-4357/aaebf8
- Dong et al. (2012) Dong, R., Greene, J. E., & Ho, L. C. 2012, ApJ, 761, 73. doi:10.1088/0004-637X/761/1/73
- Donley et al. (2008) Donley, J. L., Rieke, G. H., Pérez-González, P. G., et al. 2008, ApJ, 687, 111. doi:10.1086/591510
- Donley et al. (2012) Donley, J. L., Koekemoer, A. M., Brusa, M., et al. 2012, ApJ, 748, 142. doi:10.1088/0004-637X/748/2/142
- Draine et al. (2014) Draine, B. T., Aniano, G., Krause, O., et al. 2014, ApJ, 780, 172. doi:10.1088/0004-637X/780/2/172
- Duras et al. (2020) Duras, F., Bongiorno, A., Ricci, F., et al. 2020, A&A, 636, A73. doi:10.1051/0004-6361/201936817
- Edge et al. (1959) Edge, D. O., Shakeshaft, J. R., McAdam, W. B., Baldwin, J. E., & Archer, S. 1959, MmRAS, 68, 37
- Eisenstein et al. (2023) Eisenstein, D. J., Willott, C., Alberts, S., et al. 2023, arXiv:2306.02465. doi:10.48550/arXiv.2306.02465
- Engelbracht et al. (2005) Engelbracht, C. W., Gordon, K. D., Rieke, G. H., et al. 2005, ApJ, 628, L29. doi:10.1086/432613
- Engelbracht et al. (2008) Engelbracht, C. W., Rieke, G. H., Gordon, K. D., et al. 2008, ApJ, 678, 804. doi:10.1086/529513
- Fabian (2012) Fabian, A. C. 2012, ARA&A, 50, 455. doi:10.1146/annurev-astro-081811-125521
- Filippenko & Sargent (1985) Filippenko, A. V. & Sargent, W. L. W. 1985, ApJS, 57, 503. doi:10.1086/191012
- Gáspár et al. (2021) Gáspár, A., Rieke, G. H., Guillard, P., et al. 2021, PASP, 133, 014504. doi:10.1088/1538-3873/abcd04
- Giacconi et al. (2002) Giacconi, R., Zirm, A., Wang, J., et al. 2002, ApJS, 139, 369. doi:10.1086/338927
- Giavalisco et al. (2004) Giavalisco, M., Ferguson, H. C., Koekemoer, A. M., et al. 2004, ApJ, 600, L93. doi:10.1086/379232
- Gilli et al. (2007) Gilli, R., Comastri, A., & Hasinger, G. 2007, A&A, 463, 79. doi:10.1051/0004-6361:20066334
- Glikman et al. (2006) Glikman, E., Helfand, D. J., & White, R. L. 2006, ApJ, 640, 579. doi:10.1086/500098
- Goulding et al. (2012) Goulding, A. D., Alexander, D. M., Bauer, F. E., et al. 2012, ApJ, 755, 5. doi:10.1088/0004-637X/755/1/5
- Goulding et al. (2023) Goulding, A. D., Greene, J. E., Setton, D. J., et al. 2023, arXiv:2308.02750. doi:10.48550/arXiv.2308.02750
- Gursky et al. (1971) Gursky, H., Kellogg, E. M., Leong, C., Tananbaum, H., & Giacconi, R. 1971, ApJ, 165, L43, doi:10.1086/180713
- Hainline et al. (2016) Hainline, K. N., Reines, A. E., Greene, J. E., et al. 2016, ApJ, 832, 119. doi:10.3847/0004-637X/832/2/119
- Hainline et al. (2023) Hainline, K. N., Johnson, B. D., Robertson, B., et al. 2023, arXiv:2306.02468. doi:10.48550/arXiv.2306.02468
- Hao et al. (2005) Hao, L., Strauss, M. A., Tremonti, C. A., et al. 2005, AJ, 129, 1783. doi:10.1086/428485
- Harikane et al. (2023) Harikane, Y., Zhang, Y., Nakajima, K., et al. 2023, arXiv:2303.11946. doi:10.48550/arXiv.2303.11946
- Heckman & Best (2014) Heckman, T. M. & Best, P. N. 2014, ARA&A, 52, 589. doi:10.1146/annurev-astro-081913-035722
- Hernán-Caballero et al. (2016) Hernán-Caballero, A., Hatziminaoglou, E., Alonso-Herrero, A., et al. 2016, MNRAS, 463, 2064. doi:10.1093/mnras/stw2107
- Hickox & Alexander (2018) Hickox, R. C. & Alexander, D. M. 2018, ARA&A, 56, 625. doi:10.1146/annurev-astro-081817-051803
- Hinshaw et al. (2013) Hinshaw, G., Larson, D., Komatsu, E., et al. 2013, ApJS, 208, 19. doi:10.1088/0067-0049/208/2/19
- Ho et al. (1997) Ho, L. C., Filippenko, A. V., & Sargent, W. L. W. 1997, ApJ, 487, 568. doi:10.1086/304638
- Hopkins et al. (2008) Hopkins, P. F., Hernquist, L., Cox, T. J., et al. 2008, ApJS, 175, 356. doi:10.1086/524362
- Hopkins et al. (2012) Hopkins, P. F., Hayward, C. C., Narayanan, D., et al. 2012, MNRAS, 420, 320. doi:10.1111/j.1365-2966.2011.20035.x
- Hopkins & Quataert (2010) Hopkins, P. F. & Quataert, E. 2010, MNRAS, 407, 1529. doi:10.1111/j.1365-2966.2010.17064.x
- Hviding et al. (2018) Hviding, Raphael E., Hickox, Ryan C., Hainline, Kevin N. et al. 2018, MNRAS, 474, 1955,
- Hviding et al. (2022) Hviding, R. E., Hainline, K. N., Rieke, M., et al. 2022, AJ, 163, 224. doi:10.3847/1538-3881/ac5e33
- Inayoshi et al. (2020) Inayoshi, K., Visbal, E., & Haiman, Z. 2020, ARA&A, 58, 27. doi:10.1146/annurev-astro-120419-014455
- Johnson et al. (2021) Johnson, B. D., Leja, J., Conroy, C., et al. 2021, ApJS, 254, 22. doi:10.3847/1538-4365/abef67
- Kauffmann et al. (2003) Kauffmann, G., Heckman, T. M., Tremonti, C., et al. 2003, MNRAS, 346, 1055. doi:10.1111/j.1365-2966.2003.07154.x
- Kirkpatrick et al. (2015) Kirkpatrick, A., Pope, A., Sajina, A., et al. 2015, ApJ, 814, 9. doi:10.1088/0004-637X/814/1/9
- Kirkpatrick et al. (2023) Kirkpatrick, A., Yang, G., Le Bail, A., et al. 2023, arXiv:2308.09750. doi:10.48550/arXiv.2308.09750
- Kocevski et al. (2023) Kocevski, D. D., Onoue, M., Inayoshi, K., et al. 2023, arXiv:2302.00012. doi:10.48550/arXiv.2302.00012
- Kodra et al. (2023) Kodra, D., Andrews, B. H., Newman, J. A., et al. 2023, ApJ, 942, 36. doi:10.3847/1538-4357/ac9f12
- Kormendy & Ho (2013) Kormendy, J. & Ho, L. C. 2013, ARA&A, 51, 511. doi:10.1146/annurev-astro-082708-101811
- Kriek & Conroy (2013) Kriek, M. & Conroy, C. 2013, ApJ, 775, L16. doi:10.1088/2041-8205/775/1/L16
- Lacy et al. (2004) Lacy, M., Storrie-Lombardi, L. J., Sajina, A. et al. 2004, ApJS, 154, 166, doi:10.1086/422816
- La Franca et al. (2005) La Franca, F., Fiore, F., Comastri, A., et al. 2005, ApJ, 635, 864. doi:10.1086/497586
- LaMassa et al. (2019) LaMassa, S. M., Georgakakis, A., Vivek, M., et al. 2019, ApJ, 876, 50. doi:10.3847/1538-4357/ab108b
- Lanzuisi et al. (2018) Lanzuisi, G., Civano, F., Marchesi, S., et al. 2018, MNRAS, 480, 2578. doi:10.1093/mnras/sty2025
- Larson et al. (2023) Larson, R. L., Finkelstein, S. L., Kocevski, D. D., et al. 2023, arXiv:2303.08918. doi:10.48550/arXiv.2303.08918
- Latimer et al. (2021) Latimer, L. J., Reines, A. E., Hainline, K. N., et al. 2021, ApJ, 914, 133. doi:10.3847/1538-4357/abfe0c
- Lawrence (1991) Lawrence, A. 1991, MNRAS, 252, 586. doi:10.1093/mnras/252.4.586
- Lee et al. (2006) Lee, H., Skillman, E. D., Cannon, J. M., et al. 2006, ApJ, 647, 970. doi:10.1086/505573
- Leighly (2004) Leighly, K. M. 2004, ApJ, 611, 125. doi:10.1086/422089
- Lex et al. (2014) Lex, A.,, Gehlenborg, B., Strobelt, H., Vuillemot, R., Pfister, H. 2014, IEEE Transactions on Visualization and Computer Graphics (InfoVis ‘14), 20, 12. doi:10.1109/TVCG.2014.2346248
- Li et al. (2021) Li, J.-T., Wang, F., Yang, J., et al. 2021, MNRAS, 504, 2767. doi:10.1093/mnras/stab1042
- Luo et al. (2017) Luo, B., Brandt, W. N., Xue, Y. Q., et al. 2017, ApJS, 228, 2. doi:10.3847/1538-4365/228/1/2
- Lusso et al. (2013) Lusso, E., Hennawi, J. F., Comastri, A., et al. 2013, ApJ, 777, 86. doi:10.1088/0004-637X/777/2/86
- Lyu et al. (2016) Lyu, J., Rieke, G. H., & Alberts, S. 2016, ApJ, 816, 85. doi:10.3847/0004-637X/816/2/85
- Lyu et al. (2017) Lyu, J., Rieke, G. H., & Shi, Y. 2017, ApJ, 835, 257. doi:10.3847/1538-4357/835/2/257
- Lyu et al. (2022a) Lyu, J., Alberts, S., Rieke, G. H., et al. 2022, ApJ, 941, 191. doi:10.3847/1538-4357/ac9e5d
- Lyu & Rieke (2017) Lyu, J. & Rieke, G. H. 2017, ApJ, 841, 76. doi:10.3847/1538-4357/aa7051
- Lyu & Rieke (2018) Lyu, J. & Rieke, G. H. 2018, ApJ, 866, 92. doi:10.3847/1538-4357/aae075
- Lyu & Rieke (2022a) Lyu, Jianwei & Rieke, George 2022, Universe, 8, 304, doi:10.3390/universe8060304
- Lyu & Rieke (2022b) Lyu, Jianwei, & Rieke, George H. 2022b, ApJ, 940, L31, doi:10.3847/2041-8213/ac9e5c
- Madden et al. (2006) Madden, S. C., Galliano, F., Jones, A. P., et al. 2006, A&A, 446, 877. doi:10.1051/0004-6361:20053890
- Ma et al. (2016) Ma, X., Hopkins, P. F., Faucher-Giguère, C.-A., et al. 2016, MNRAS, 456, 2140. doi:10.1093/mnras/stv2659
- Maiolino & Rieke (1995) Maiolino, R.& Rieke, G. H. 1995, ApJ, 454, 95, doi:10.1086/176468
- Maiolino et al. (2023) Maiolino, R., Scholtz, J., Witstok, J., et al. 2023, arXiv:2305.12492. doi:10.48550/arXiv.2305.12492
- Marble et al. (2010) Marble, A. R., Engelbracht, C. W., van Zee, L. et al. 2010, ApJ, 715, 506, doi:10.1088/0004-637X/715/1/506
- Markarian (1977) Markarian, B. E. 1977, A&A, 58, 139
- Mateos et al. (2012) Mateos, S., Alonso-Herrero, A., Carrera, F. J., et al. 2012, MNRAS, 426, 3271. doi:10.1111/j.1365-2966.2012.21843.x
- Mateos et al. (2015) Mateos, S., Carrera, F. J., Alonso-Herrero, A., et al. 2015, MNRAS, 449, 1422. doi:10.1093/mnras/stv299
- Matthee et al. (2023) Matthee, J., Naidu, R. P., Brammer, G., et al. 2023, arXiv:2306.05448. doi:10.48550/arXiv.2306.05448
- Mendez et al. (2013) Mendez, Alexander J., Coil, Alison L., Aird, James et al. 2013, ApJ, 770, 40, doi:10.1088/0004-637X/770/1/40
- Merlin et al. (2021) Merlin, E., Castellano, M., Santini, P., et al. 2021, A&A, 649, A22. doi:10.1051/0004-6361/202140310
- M. Rieke et al. (2023) Rieke, M. & the JADES Collaboration 2023, arXiv:2306.02466. doi:10.48550/arXiv.2306.02466
- Moretti et al. (2009) Moretti, A., Pagani, C., Cusumano, G., et al. 2009, A&A, 493, 501. doi:10.1051/0004-6361:200811197
- Moustakas & Kennicutt (2006) Moustakas, John, & Kennicutt, Robert C., Jr. 2006, ApJS, 164, 81, doi:10.1086/500971
- Netzer (2015) Netzer, H. 2015, ARA&A, 53, 365. doi:10.1146/annurev-astro-082214-122302
- Oesch et al. (2023) Oesch, P. A., Brammer, G., Naidu, R. P., et al. 2023, arXiv:2304.02026. doi:10.48550/arXiv.2304.02026
- Osterbrock & Pogge (1987) Osterbrock, Donald E. & Pogge, Richard W. 1987, ApJ, 323, 108, doi:10.1086/165810
- Padovani et al. (2017) Padovani, P., Alexander, D. M., Assef, R. J., et al. 2017, A&A Rev., 25, 2. doi:10.1007/s00159-017-0102-9
- Padovani (2017) Padovani, P. 2017, Frontiers in Astronomy and Space Sciences, 4, 35. doi:10.3389/fspas.2017.00035
- Papovich et al. (2023) Papovich, C., Cole, J. W., Yang, G., et al. 2023, ApJ, 949, L18. doi:10.3847/2041-8213/acc948
- Pérez-González et al. (2005) Pérez-González, P. G., Rieke, G. H., Egami, E., et al. 2005, ApJ, 630, 82. doi:10.1086/431894
- Pérez-González et al. (2008) Pérez-González, P. G., Rieke, G. H., Villar, V., et al. 2008, ApJ, 675, 234. doi:10.1086/523690
- Perrin et al. (2014) Perrin, M. D., Sivaramakrishnan, A., Lajoie, C.-P., et al. 2014, Proc. SPIE, 9143, 91433X. doi:10.1117/12.2056689
- Pouliasis et al. (2019) Pouliasis, E., Georgantopoulos, I., Bonanos, A. Z., et al. 2019, MNRAS, 487, 4285. doi:10.1093/mnras/stz1483
- Rémy-Ruyer et al. (2013) Rémy-Ruyer, A., Madden, S. C., Galliano, F., et al. 2013, A&A, 557, A95. doi:10.1051/0004-6361/201321602
- Rémy-Ruyer et al. (2015) Rémy-Ruyer, A., Madden, S. C., Galliano, F., et al. 2015, A&A, 582, A121. doi:10.1051/0004-6361/201526067
- Richards et al. (2002) Richards, G. T., Fan, X., Newberg, H. J., et al. 2002, AJ, 123, 2945. doi:10.1086/340187
- Rieke et al. (2009) Rieke, G. H., Alonso-Herrero, A., Weiner, B. J., et al. 2009, ApJ, 692, 556. doi:10.1088/0004-637X/692/1/556
- Rieke et al. (2015) Rieke, G. H., Wright, G. S., Böker, T., et al. 2015, PASP, 127, 584. doi:10.1086/682252
- Rieke et al. (2017) Rieke, G., Alberts, S., Lyu, J., et al. 2017, JWST Proposal. Cycle 1, 1207
- Rigby et al. (2008) Rigby, J. R., Marcillac, D., Egami, E., et al. 2008, ApJ, 675, 262. doi:10.1086/525273
- Rose et al. (2013) Rose, M., Tadhunter, C. N., Holt, J., & Rodríguez Zaurín, J. 2013, MNRAS, 432, 2150, doi:10.1093/mnras/stt564
- Saade et al. (2022) Saade, M. L., Brightman, M., Stern, D., et al. 2022, ApJ, 936, 162. doi:10.3847/1538-4357/ac88cf
- Sanders et al. (1988) Sanders, D. B., Soifer, B. T., Elias, J. H., et al. 1988, ApJ, 325, 74. doi:10.1086/165983
- Santini et al. (2009) Santini, P., Fontana, A., Grazian, A., et al. 2009, A&A, 504, 751. doi:10.1051/0004-6361/200811434
- Seyfert (1943) Seyfert, Carl K.1943, ApJ, 97, 28, doi:10.1086/144488
- Shivaei et al. (2017) Shivaei, I., Reddy, N. A., Shapley, A. E., et al. 2017, ApJ, 837, 157. doi:10.3847/1538-4357/aa619c
- Shivaei et al. (2020) Shivaei, I., Darvish, B., Sattari, Z., et al. 2020, ApJ, 903, L28. doi:10.3847/2041-8213/abc1ef
- Shivaei et al. (2022) Shivaei, I., Popping, G., Rieke, G., et al. 2022, ApJ, 928, 68. doi:10.3847/1538-4357/ac54a9
- Silverman et al. (2010) Silverman, J. D., Mainieri, V., Salvato, M., et al. 2010, ApJS, 191, 124. doi:10.1088/0067-0049/191/1/124
- Simmonds et al. (2016) Simmonds, C., Bauer, F. E., Thuan, T. X., et al. 2016, A&A, 596, A64. doi:10.1051/0004-6361/201629310
- Simpson (2005) Simpson, C. 2005, MNRAS, 360, 565. doi:10.1111/j.1365-2966.2005.09043.x
- Spinoglio & Malkan (1989) Spinoglio, L. & Malkan, M. A. 1989, ApJ, 342, 83. doi:10.1086/167577
- Stern (2015) Stern, D. 2015, ApJ, 807, 129. doi:10.1088/0004-637X/807/2/129
- Stern et al. (2005) Stern, Daniel, Eisenhardt, Peter, Gorjian, Varoujan et al. 2005, ApJ, 631, 163, doi:10.1086/432523
- Trebitsch et al. (2019) Trebitsch, M., Volonteri, M., & Dubois, Y. 2019, MNRAS, 487, 819. doi:10.1093/mnras/stz1280
- Treister & Urry (2006) Treister, E. & Urry, C. M. 2006, ApJ, 652, L79. doi:10.1086/510237
- Treister et al. (2014) Treister, E., Urry, C. M., Schawinski, K., et al. 2014, Multiwavelength AGN Surveys and Studies, 304, 188. doi:10.1017/S1743921314003731
- Tremonti et al. (2004) Tremonti, C. A., Heckman, T. M., Kauffmann, G., et al. 2004, ApJ, 613, 898. doi:10.1086/423264
- Übler et al. (2023) Übler, H., Maiolino, R., Curtis-Lake, E., et al. 2023, arXiv:2302.06647. doi:10.48550/arXiv.2302.06647
- Ueda et al. (2003) Ueda, Y., Akiyama, M., Ohta, K., et al. 2003, ApJ, 598, 886. doi:10.1086/378940
- Vijarnwannaluk et al. (2022) Vijarnwannaluk, B., Akiyama, M., Schramm, M., et al. 2022, ApJ, 941, 97. doi:10.3847/1538-4357/ac9c07
- Wada (2012) Wada, K. 2012, ApJ, 758, 66. doi:10.1088/0004-637X/758/1/66
- Wada (2015) Wada, K. 2015, ApJ, 812, 82. doi:10.1088/0004-637X/812/1/82
- Wang et al. (2022) Wang, C., Luo, B., Brandt, W. N., et al. 2022, ApJ, 936, 95. doi:10.3847/1538-4357/ac886e
- Whitaker et al. (2011) Whitaker, K. E., Labbé, I., van Dokkum, P. G., et al. 2011, ApJ, 735, 86. doi:10.1088/0004-637X/735/2/86
- Winter et al. (2010) Winter, Lisa M., Lewis, Karen T., Koss et al. 2010, ApJ, 710, 503, doi:10.1088/0004-637X/710/1/503
- Yang et al. (2023) Yang, G., Caputi, K. I., Papovich, C., et al. 2023, ApJ, 950, L5. doi:10.3847/2041-8213/acd639
- Wright et al. (2023) Wright, G. S., Rieke, G. H., Glasse, A., et al. 2023, PASP, 135, 048003. doi:10.1088/1538-3873/acbe66
- Zahid et al. (2013) Zahid, H. J., Geller, M. J., Kewley, L. J., et al. 2013, ApJ, 771, L19. doi:10.1088/2041-8205/771/2/L19
Appendix A AGN Identification from Weak Pa
Figure 21 shows the distribution of H to 12 m luminosities for Type 2 AGNs, relative to the average value for star forming galaxies. We have selected 12 m for this comparison both because of the availability of all-sky data bases, and because the flux at this wavelength is representative of the total luminosity of many galaxies (Spinoglio & Malkan, 1989). The integrated H fluxes for the star forming galaxies have been taken from Moustakas & Kennicutt (2006) and the 12 m fluxes from IRAS (which has a sufficiently large beam that the flux is close to incorporating the full galaxy). The luminosity at the latter wavelength is taken to be proportional to Fλ. The H fluxes for the AGNs are from Winter et al. (2010); Rose et al. (2013) (which provide flux-calibrated line strengths), with 12 m fluxes from ALLWISE. The ratio for Type 1 AGNs, obtained from the same references plus Osterbrock & Pogge (1987), is nominally just a factor of about two below the average for the star forming galaxies, but Figure 21 shows that the majority of Type 2 AGNs fall more than an order of magnitude low in this ratio.

This behavior is a product of extinction, as is shown by the much higher average ratios for the Type 1 AGNs. If the extinction follows a normal interstellar law and is a foreground screen, the ratio for Pa would typically still be a factor of 3–4 weaker relative to star forming galaxies. It is likely that the extinction is partially due to optically thick structures (e.g., the circumnuclear torus) and it may be due to relatively large grains due to the harsh environment around the nucleus, and hence be more neutral than the typical interstellar behavior; both effects would increase the difference.
Since both the Pa and infrared luminosities are indicators of the star formation rate, this discriminator can be applied by declaring any galaxy where the SFR indicated by Pa falls significantly below that estimated from the infrared flux is a candidate to host an AGN. This test can be implemented using the FRESCO spectra. At higher redshifts, it may be possible to use FRESCO spectra showing Pa .
We have carried out a preliminary analysis using only galaxies with detected Pa by FRESCO. There are ten galaxies with SFRs calculated from the Pa luminosity more than three times lower than indicated by the flux density at 18 m; we accept this as the indicator of an AGN based on the study of obscuration levels in local LIRGs by Alonso-Herrero et al. (2006). They are listed in Table 2. Additional candidates can probably be identified among MIRI-detected sources with accurate redshifts in the appropriate range and upper limits on Pa from the FRESCO spectra.
| MIRI ID | RA | DEC | SFR(18 m)/SFR(Pa ) | Previous AGN Selectionsaa1 = from IR SED; 2 = from IR colors; 3 = from X-ray luminosity; 4 = from X-ray to radio flux ratio; 5 = from radio loudness; 6 = from optical spectrum; 7 = from variability |
|---|---|---|---|---|
| 302 | 53.07644 | -27.84873 | 7.5 | 1, 3,4, 5 |
| 509 | 53.10938 | -27.83495 | 6.1 | |
| 1183 | 53.14350 | -27.78327 | 3.2 | |
| 1425 | 53.16288 | -27.76723 | 8.3 | 1, 3, 4, 6, 7 |
| 1637 | 53.17287 | -27.74456 | 4.3 |