An almost dark galaxy with the mass of the Small Magellanic Cloud
Almost Dark Galaxies are objects that have eluded detection by traditional surveys such as the Sloan Digital Sky Survey (SDSS). The low surface brightness of these galaxies ((0) mag/arcsec2), and hence their low surface stellar mass density (a few solar masses per pc2 or less), suggests that the energy density released by baryonic feedback mechanisms is inefficient in modifying the distribution of the dark matter halos they inhabit. For this reason, almost dark galaxies are particularly promising for probing the microphysical nature of dark matter. In this paper, we present the serendipitous discovery of Nube, an almost dark galaxy with mag/arcsec2. The galaxy was identified using deep optical imaging from the IAC Stripe82 Legacy Project. Follow-up observations with the 100m Green Bank Telescope strongly suggest that the galaxy is at a distance of 107 Mpc. Ultra-deep multi-band observations with the 10.4m Gran Telescopio Canarias favour an age of Gyr and a metallicity of [Fe/H]. With a stellar mass of M⊙ and a half-mass radius of kpc (corresponding to an effective surface density of M⊙/pc2), Nube is the most massive and extended object of its kind discovered so far. The galaxy is ten times fainter and has an effective radius three times larger than typical ultra-diffuse galaxies with similar stellar masses. Galaxies with comparable effective surface brightness within the Local Group have very low mass (tens of 105 M⊙) and compact structures (effective radius kpc). Current cosmological simulations within the cold dark matter scenario, including baryonic feedback, do not reproduce the structural properties of Nube. However, its highly extended and flattened structure is consistent with a scenario where the dark matter particles are ultra-light axions with a mass of mB=() eV.
Key Words.:
Galaxies: dwarf – dark matter – galaxies: photometry – galaxies: structure – galaxies: formation1 Introduction
Many cosmological observations at large scales suggest that dark matter can be well described as a cold and collisionless fluid (see e.g., White & Rees, 1978; Blumenthal et al., 1984; Davis et al., 1985; Smoot et al., 1992). Nonetheless, the predictions of this model at galactic scales have faced an increasing number of challenges, such as the “cusp-core problem”, the “missing satellite problem” or the “too-big-to-fail problem” (see e.g., Boylan-Kolchin et al., 2011; Weinberg et al., 2015; Del Popolo & Le Delliou, 2017). Many of these problems can be mitigated by the effect of baryon feedback on the dark matter distribution (see e.g., Davis et al., 1992; Governato et al., 2010; Di Cintio et al., 2014). However, if the number of stars or their spatial density is low enough, it would be difficult to argue that stellar feedback could be responsible for affecting the dark matter distribution, since there would not be enough energy to change the location of the dark matter (see e.g., Peñarrubia et al., 2012; Oñorbe et al., 2015). In parallel, as long as the direct detection of dark matter particles remains out of reach, other alternatives to the cold dark matter model have gained traction to solve the small scale challenges. These include the warm dark matter scenario (see e.g., Sommer-Larsen & Dolgov, 2001; Bode et al., 2001), self-interacting dark matter (Spergel & Steinhardt, 2000) or fuzzy dark matter (composed of ultra-light axions with masses in the 10-23-10-21 eV range; see e.g., Sin, 1994; Hu et al., 2000; Matos & Arturo Ureña-López, 2001). For these reasons, the search for objects with extremely low stellar surface densities (where the effect of baryonic feedback is not expected to be relevant) promises to probe the microphysical nature of dark matter, i.e., the properties of the dark matter particle.
In recent years, our ability to detect more and more diffuse galaxies with broadband imaging has increased considerably (see e.g., Sandage & Binggeli, 1984; Conselice et al., 2003; van Dokkum et al., 2015; Román & Trujillo, 2017; Lim et al., 2020; Tanoglidis et al., 2021; Trujillo et al., 2021; Marleau et al., 2021; La Marca et al., 2022; Zaritsky et al., 2023), and it is expected to continue to increase with the arrival of very deep optical surveys (see e.g., Ivezić et al., 2019). Within this population of very faint galaxies, the so-called “almost dark” galaxies are of particular interest. These faint galaxies are missed in the optical catalogues of wide field surveys such as the Sloan Digital Sky Survey (SDSS, Eisenstein et al., 2011). Although there is no definition of the surface brightness of an almost dark galaxy, given the SDSS surface brightness limit (i.e., mag/arcsec2; 3 in 10″10″ boxes), galaxies with central surface brightness fainter than mag/arcsec2 are very difficult to detect in SDSS catalogues. Therefore, we can use such a value as a rough definition of what an almost dark galaxy should be. These galaxies represent less than 1% of the galaxies found in blind HI surveys such as Arecibo Legacy Fast Arecibo L-band Feed Array (ALFALFA, Giovanelli et al., 2005), and have HI masses between 107 and 109 M⊙. Since the definition of an almost dark galaxy depends on whether it is typically detected in the SDSS, its maximum stellar surface mass density is a function of its stellar population properties (age and metallicity). In a scenario where the age of the stellar population is old ( Gyr) and metal-poor ([Fe/H]), a surface brightness of mag/arcsec2 corresponds to a few M⊙/pc2. This is very close to the expected stellar surface density resulting from the gas density threshold for star formation (Schaye, 2004) and in good agreement with the values found at the edges of galaxies where star formation suddenly drops off (Trujillo et al., 2020; Chamba et al., 2022). Consequently, almost dark galaxies may also be an interesting place to study how galaxy formation occurs at low densities.
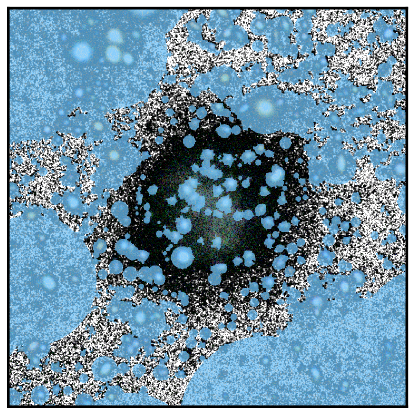
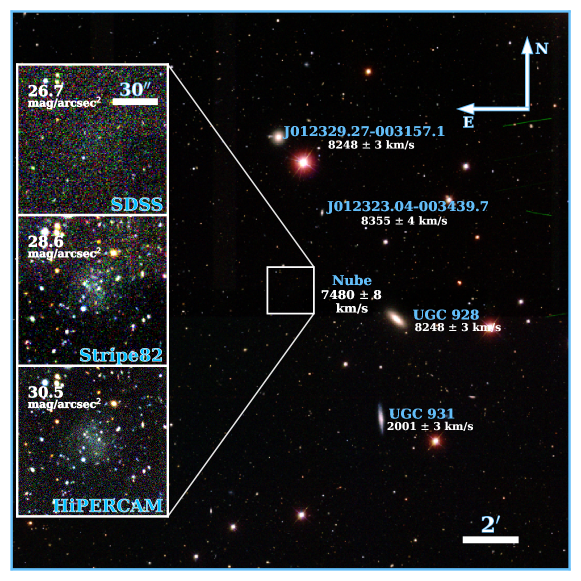
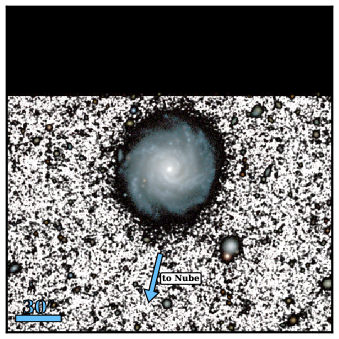
In this paper, we describe the structural properties of a very extended almost dark galaxy serendipitously discovered in the IAC Stripe82 Legacy Project (Fliri & Trujillo, 2016; Román & Trujillo, 2018). This object (which we have named Nube111noo-beh. Cloud in Spanish.) was found during a visual inspection of one of the survey fields. The object is not visible in SDSS and appears quite noisy even in deeper images such as those produced by the Stripe82 data (see Fig. 1). Dedicated observations with the Gran Telescopio Canarias and the Green Bank Telescope have allowed to characterise its nature in detail. This paper presents a comprehensive analysis of the stellar populations and structural properties of this object. We also consider the properties of this very faint galaxy within the cold dark matter and fuzzy dark matter scenarios.
Throughout this work we adopt a standard cosmological model with the following parameters: km s-1 Mpc-1, and . Based on the probable redshift of this galaxy, the assumed distance is Mpc, corresponding to a spatial scale of kpc/arcsec. All magnitudes in this paper are in the AB magnitude system.
2 Data
The data used in this paper come from two different facilities: the 10.4m Gran Telescopio Canarias (GTC) and the 100m Robert C. Byrd Green Bank Telescope (GBT). The details of each observation are described below.
2.1 GTC HiPERCAM images
Deep optical multi-band imaging of Nube was performed using HiPERCAM. HiPERCAM (Dhillon et al., 2018) is a quintuple-beam, high-speed astronomical imager capable of simultaneously imaging celestial objects in five different Sloan filters (, , , , ). The image area of each of the five CCDs is pixels (; 1 pixel) divided into four channels of pixels each. Nube was observed on 9 and 10 January 2019. We followed the dithering strategy described in Trujillo & Fliri (2016) to reduce as much as possible the scattered light from the telescope structure.
The data reduction of the Nube images follows the steps detailed in Montes et al. (2020) and briefly described here. The entire reduction process was carried out in a controlled and enclosed environment as described in Akhlaghi et al. (2021). After the standard calibration per CCD channel (bias and flat field), each set of four channels was assembled into a single image. The different exposures that went into the final images were visually inspected, and those with low quality (too noisy and/or very bright background) or strong gradients were discarded. Photometric calibration of these images was performed using SDSS DR12 (Alam et al., 2015). The size of Nube on the sky (effective diameter of 27; see Fig. 1) is significantly smaller than the FOV of the camera (), allowing reliable background subtraction and study of the galaxy using these images. The background subtraction was performed by subtracting a calculated constant value from the masked image. In addition to masking the foreground and background sources, we masked a circular region with a radius of centred on Nube (that is Re of this galaxy, see Sec. 3.1) to avoid over-subtracting the light associated with the outer parts of the galaxy.
The final exposure time on-source is 1 hour and 8 minutes for each band. The limiting surface brightness depths of the final images measured in boxes are 30.5, 31, 30.5, 30 and 29.2 mag/arcsec2 for , , , and ( above the background) respectively, measured using the method described in Appendix A of Román et al. (2020). The limiting magnitudes for point-like sources are: 26.2, 26.7, 26.2, 25.8 and 25 mag from u to z (5 within an aperture of 2″).
2.2 GBT HI data
We performed 12 hours of observations with the Green Bank Telescope (GBT)222The Green Bank Observatory is a facility of the National Science Foundation operated under cooperative agreement by Associated Universities, Inc. along the line of sight (LOS) to Nube between January 2019 and July 2019 (programmes GBT18B-356 and GBT19A-485). Our observational configuration is identical to that of Karunakaran et al. (2020b), where we used the L-band receiver and the VErsatile GBT Astronomical Spectrometer (VEGAS) in Mode 7 (spectral resolution = 3 kHz km/s, bandpass = 100 MHz). The use of such a wide bandpass, sensitive out to recession velocities of km/s, is essential in the blind search for HI in such a faint object, which can be at any distance along the LOS.
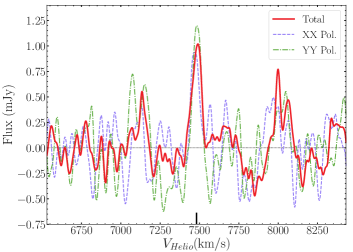
These data were reduced using the standard GBTIDL333http://gbtidl.nrao.edu/ procedure getps. We removed both narrowband and broadband Radio Frequency Interference (RFI) before searching for potential HI signals. We note that broadband RFI (i.e. GPS L3, GHz) was particularly prominent, resulting in almost a third of the data being flagged. The effective integration time of the final calibrated spectrum is therefore 8.5 hours. We also note that the fluxes are scaled up by a factor of 20% due to the systematic offset in the GBT noise diode calibration values (Goddy et al., 2020). We smoothed the resulting RFI-free spectrum at various spectral resolutions to search for possible HI emission. Fig. 2 shows a faint HI detection at VHelio = km/s (red line) with a signal-to-noise ratio of 6.1, along with the statistically independent XX and YY polarizations (blue and green lines, respectively) that were co-added to produce the total spectrum. Although faint, the line is detected in both XX and YY, and it is also consistently detected in jackknifes about other observables such as observing date and time. For a number of reasons, which we explain below, we believe that this detection is most likely associated with Nube.
We estimate the systemic heliocentric velocity () and velocity width () of the HI detection using the methods described in Karunakaran et al. (2020a, b), which are based on those of Springob et al. (2005). Briefly, we fit first order polynomials to each edge of the HI profile between 15% and 85% of the peak flux and find the velocities corresponding to the 50% flux value. The mean and difference of these velocities give and respectively. We correct for instrumental and cosmological redshift broadening according to Springob et al. (2005) and for ISM turbulence according to Verheijen & Sancisi (2001) (see their section 4; see also Karunakaran et al. 2020b).
We convert to a kinematic distance () using the Hubble-Lemaître law and assuming an uncertainty of 5 Mpc due to peculiar velocities. The derived distance is Mpc. We measure the HI flux () by integrating over the line profile whose uncertainties are dominated by the noise and the 2% diode uncertainty (van Zee et al., 1997). The flux value is Jy km/s. We use the kinematic distance together with the integrated flux in the standard equation for an optically thin gas (Haynes & Giovanelli, 1984) to calculate the HI mass:
| (1) |
resulting in . All derived properties from the HI spectrum are at a spectral resolution of km/s and are listed in Table 1.
2.3 Possible sources of contamination in HI
Although it is tempting to associate the HI detection with the Nube galaxy, it could be that the measurement corresponds to another galaxy in the line of sight. For this reason, a detailed analysis of the velocity distributions of the galaxies in the Nube region is needed to see if the HI detection is compatible with any of them.
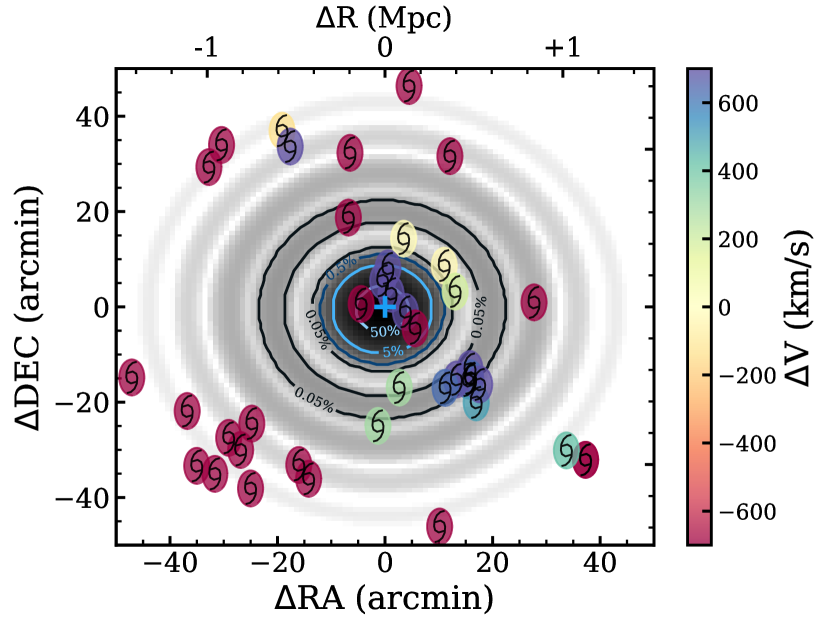
Using NED444The NASA/IPAC Extragalactic Database (NED) is operated by the Jet Propulsion Laboratory, California Institute of Technology, under contract with the National Aeronautics and Space Administration we have created a catalogue of all objects in this database with spectroscopic redshifts in a region centred around Nube of . The total number of galaxies found is 711. All galaxies with recession velocities in the range 54809480 km/s, 42 galaxies, are plotted in Fig. 3. The galaxies are colour coded according to the relative velocity of the HI detection. In this region, there are many galaxies with relative velocities -600 km/s from the HI detection (red symbols in the figure). There is also a smaller group with velocities about 500 km/s greater than the HI detection (purple symbols close to the centre). Interestingly, there is no galaxy with known spectroscopic redshift within a radius of 10′ centred on Nube that has a km/s. This is important because this is the region where potential contamination from a gas-rich source could mimic the signal we identify as possibly coming from Nube. To better illustrate this point, in Fig. 3 we also show the 2D GBT beam response using the well-characterised pattern at 1.4 GHz from Spekkens et al. (2013). The contours (from blue to black) indicate where the beam efficiency drops by the factor indicated on the label.
The closest galaxy in terms of velocity ( km/s) would be the spiral galaxy to the north: UGC929, in yellow in Fig. 3. This galaxy is 14.7 arcmin or 435 kpc away at the distance corresponding to the HI detection (i.e., 107 Mpc). This object is close to the first minimum of the beam response, shown by the grey-scale background image in Fig. 3, which means that the HI emission, if coming, from UGC929 would be suppressed by a factor of . If the source of the HI emission is UGC929, this implies that the HI mass of this galaxy should be M⊙. Using scaling relations between stellar mass and HI mass, a galaxy with the stellar mass of UGC 929 (, see Appendix A) is expected to have a mass in HI of and no more than (Feldmann, 2020). This is at least 100 times less gas than what it is needed to reproduce the observations. It is, therefore, very unlikely that the emission we see at the location of Nube is caused by the contamination from UGC929. To the northwest in Fig. 3, there is another galaxy at a similar velocity ( km/s) at 14′ away. This galaxy appears to be a low-mass galaxy, probably a satellite of UGC929. Given it is also located in the first minimum of the beam response and its low mass, it is also very unlikely that it is the source of the HI emission.
None of the galaxies with a confirmed spectroscopic redshift appear to be responsible for the detection of HI in the Nube region. However, it is possible that the HI emission is coming from a low-mass galaxy in the region which, due to its faintness, has no spectroscopic redshift. To investigate this, we have made a catalogue of all sources with a photometric redshift within a radius of 10′ around Nube. This radius corresponds to the area where the response efficiency of the GBT beam is greater than 5% (see Fig. 3). We used one of the value added catalogues from the DR9 DECaLS survey, which provides photometric redshifts of sources down to a depth of = 24 mag (Zhou et al., 2021). The list of objects with a photometric redshift compatible with the HI emission (i.e., z=0.02502) is given in Table 3. The vast majority of objects with a photometric redshift compatible with the HI detection reported in this work are either a star or a point-like source. This is somewhat to be expected, since at a given magnitude photometric catalogues are biased towards objects with higher signal-to-noise, and therefore extended objects are less represented or missing.
Finally, to account for the possibility that some faint and diffuse galaxies might not have a photometric redshift measured, we visually inspected the inner 10′ around Nube using the Dark Energy Camera Legacy Survey (DECaLS, Dey et al., 2019) DR10 images to find extended faint sources that could potentially be emitting in HI. We found only two very faint galaxies, which are listed in Table 4. These two galaxies are visually smaller than Nube and therefore potentially less massive at the same distance. Furthermore, these objects are found at a radial distance of 4.5′ from the central direction of the HI beam. While we cannot completely rule out the possibility that one of these galaxies is responsible for the HI detection, their off-centre location would imply that they are less likely to be associated with the HI detection than Nube.
The analysis in this section reinforces the idea that the detection of an emission peak in HI could be related to the optical detection of Nube. Moreover, the fact that the HI emission observed coincides with the velocity of UGC929 (even if it is extremely unlikely to be caused by it) is a further argument in favour of the HI detection being genuine and not a fluctuation. Having ruled out contamination of nearby HI sources, there is still the possibility that the optical and HI detections are unrelated, and therefore the distance assumed for the optical counterpart of the galaxy may be incorrect. However, this possibility does come with its own problems. For a detailed discussion of the implications of the distance for Nube, see the Appendix B. The scenario that follows from the analysis in this section is that Nube could be a satellite of UGC929, at a distance of 107 Mpc.
3 Analysis and results
3.1 Radial profiles of Nube
The aim of this paper is to study the properties of Nube in detail in order to determine its origin. A fundamental way to characterise the shape of a galaxy is through its radial surface brightness profiles. In addition, multi-wavelength information provides valuable constraints on galaxy formation processes. We have, therefore, derived the surface brightness radial profiles of this galaxy using the optical, multi-wavelength, HiPERCAM data.
To measure the photometry of this galaxy, we first masked out all foreground and background sources in the image. As can be seen in the insets in Fig. 1, the galaxy is very faint and almost transparent. Since we cannot determine whether the clumps on top of the galaxy are part of the galaxy or are objects in the line of sight of the galaxy, we masked them all, leaving only the diffuse component for photometry. We used a combination of NoiseChisel (Akhlaghi & Ichikawa, 2015; Akhlaghi, 2019) and manual masking after visual inspection. This is a very conservative approach as we are only analysing the diffuse light of the galaxy. Appendix D shows the mask used in this work.
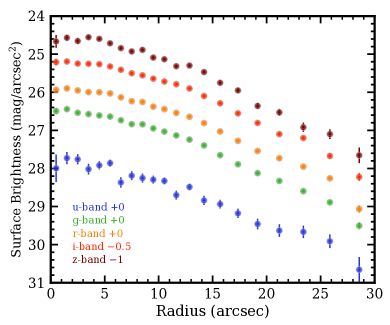
Once we had masked out all the sources of contamination, we derived the radial surface brightness profiles of the galaxy. Given the nearly circular shape of the object, we decided to extract the radial profiles using circular annuli at different radial distances, up to 30″ from the centre of the galaxy. To derive the profiles, we use a custom python code. For each radial bin, the surface brightness was obtained as the -clipped median of the pixel values. Fig. 4 shows the surface brightness profiles of Nube for the 5 bands imaged with HiPERCAM. Some of the profiles are shifted by a constant value, given in the legend, for ease of viewing. The errors are calculated as a combination of the Poisson noise in each annulus and the error in the sky given by the distribution of background pixels in each image. These surface brightness profiles are corrected for the absorption of our Galaxy (E(BV) = 0.34, Schlafly & Finkbeiner, 2011).
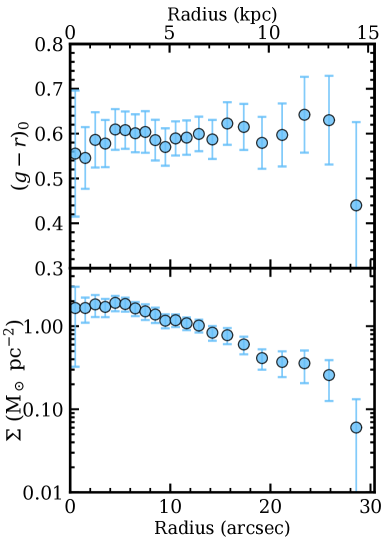
We can now study the radial variations of the galaxy’s stellar populations. The surface brightness profiles are used to determine the radial profile of the galaxy. The top panel in Figure 5 shows the colour profile of Nube. The colour profile appears flat at all radii, with an average colour of 0.6. This almost flat colour profile could be compatible with a similar age and metallicity at all radii, up to ( kpc).
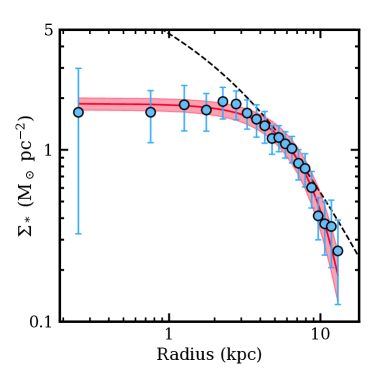
The bottom panel of Fig. 5 shows the surface stellar mass density profile for this galaxy. To derive it, we follow the procedure given in Bakos et al. (2008) to link the observed surface brightness in the g-band to the radial variation of the stellar mass to light (M/L) ratio. The M/L ratio was obtained from the prescriptions given in Roediger & Courteau (2015) assuming a Chabrier (2003) IMF, using the colour profile. As with the colour profile, the stellar mass density profile of Nube is also relatively flat compared to the stellar mass density profiles of galaxies with similar stellar masses (e.g., Montes et al., 2021). We expand on this result later in the text.
We have used this stellar mass density profile to measure the radius that encloses half the mass of the galaxy, or the half-mass radius (). This radius is arcsec ( kpc at a distance of 107 Mpc). The effective surface stellar mass density of Nube is M⊙ pc-2. The total stellar mass of the galaxy derived from the surface mass density profile, assuming circular symmetry, is M M⊙. The effective surface brightness is mag/arcsec2. These values, along with other global properties of Nube, are listed in the Table 1.
To assess the validity of our results, we also fitted Sérsic (1968) models (using the code GALFIT Peng et al., 2002) to the galaxy in all the different HiPERCAM bands, independently. The values of the half-light effective radius, , and the Sérsic index for each band are given in Table 2. The values of from the GALFIT fits are consistent with those derived using the surface brightness profiles.
3.2 Stellar populations of Nube
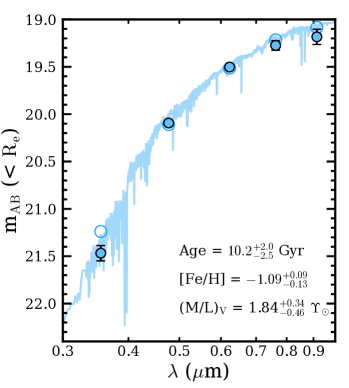
Given the very low surface brightness of this galaxy (26.2 mag/arcsec2), the use of deep multi-wavelength observations is the best, if not the only, way to constrain its stellar populations, namely the age, metallicity and stellar mass-to-light ratio (M/L). To estimate these quantities, we first constructed the spectral energy distribution (SED) of the galaxy (see Fig. 6). The photometry at each band was derived measuring the total flux within a circular aperture with radius equal to the half-mass radius (13.7″) of the galaxy. The purpose of using this aperture (instead of the total galaxy) is to ensure enough signal to reliably characterise the SED of Nube. The errors of the photometry of each individual band that compose the SED are a combination of the photometric errors and the zero point uncertainties.
To characterise the stellar population properties of the galaxy, we fitted Bruzual & Charlot (2003) single stellar population (SSP, instantaneous burst) models to the SED of the galaxy. This is a reasonable assumption given the homogeneous colour distribution of this galaxy (Fig. 5). The parameters to be fitted are three: age, metallicity and luminosity, and we assumed a Chabrier Initial Mass Function (IMF, Chabrier, 2003) for the models. Since the SED is derived from broadband imaging, it is a good approach to assume an SSP to describe the stellar populations of this galaxy, since the information we have is limited. This assumption will give us the average properties of this galaxy. For the fit, we use the minimisation approach described in Montes et al. (2014). We derive a most likely age of Gyr and a metallicity [Fe/H] of , values in agreement with those of old diffuse low-mass galaxies (see e.g., Ruiz-Lara et al., 2018; Heesters et al., 2023; Iodice et al., 2023). Uncertainties in the parameters have been estimated by marginalising the 1D probability distribution functions obtained during the fitting. Since the colour profile of this galaxy is flat at all radii (see Fig. 5), we assume that the stellar populations obtained for the inner are representative for the whole galaxy.
Using the M/L derived from the SED fit ()555This M/L value is consistent with the M/L ratios derived at each radial distance using the colour profile in Sec. 3.1; a median of ., the total stellar mass of Nube is M M⊙, in agreement with the stellar mass estimate derived in Sec. 3.1. As this stellar mass is derived with the properties inside , we prefer to use the previous estimate (Sec. 3.1) as it is more representative of the whole galaxy.
| RA | DEC | z | Distance | log(MHI/M⊙) | log(M∗/M⊙) | ||
|---|---|---|---|---|---|---|---|
| (Mpc) | (arcsec) | (mag/arcsec2) | |||||
| 01h23m27.37s | -00d3727.83 | 0.02502 | |||||
| Age | [Fe/H] | ||||||
| km/s | (mag/arcsec2) | (M⊙pc-2) | (Gyr) | (kpc) | |||
| 0.970.01 |
3.3 Dynamical mass of Nube
A rough estimate of the dynamical mass of this galaxy666This calculation assumes that Nube is in dynamical equilibrium. This is a reasonable assumption given the large distance to its potential progenitor UGC929. can be obtained using the following equation from Spekkens & Karunakaran (2018):
| (2) |
with Re the half-mass radius in kpc, the inclination of the HI disc in degrees, and W50 the turbulence-corrected velocity width of the HI line. We calculate the inclination of the HI disc as follows:
| (3) |
In Table 1, we provide the axis ratio, , of Nube obtained from GALFIT Sérsic fits to the object (see sec. 3.1). The resulting value (0.970.01) is the average from the axis ratio measured in the , , and bands. That results in an inclination value of 133 deg. It is worth emphasizing that using the axis ratio of the stellar distribution to characterise the inclination of the HI disc is a rough approximation. The dynamical mass we derive for Nube is M⊙ within kpc.
3.4 A search for Globular Clusters
Globular clusters (GCs) provide a complementary way to estimate the distance to an extragalactic object based on the universality of their luminosity function. The peak of the GC distribution lies at M mag for different galaxies (see e.g., Rejkuba, 2012), making it a secondary distance indicator. Therefore, the detection of GCs in Nube would help us to validate the distance obtained with the HI detection. Note that the peak of the GC luminosity at the distance of 107 Mpc (i.e., a distance modulus of 35.15 mag) is expected at m mag, fainter than our point-like 5 limiting magnitudes meaning that it would be difficult to detect GCs, if any, in our images (see section 2.1). We expect that an ultra-diffuse galaxy of similar stellar mass than Nube would have around 10 GCs, although the range varies from 0 to 30 GCs. However, only the brightest GCs of the system are expected to be detectable.
We follow a similar procedure to detect globular clusters as in Montes et al. (2020, 2021). In short, we first preselect the GCs based on their morphology (size and ellipticity), and then we refine the selection based on their colours. However, in this case we do not have the high spatial resolution of the HST images to make a preselection based on the morphology of the GCs, but only the ground-based images. For this reason, we have to impose very strict shape criteria to minimise contamination in our selection.
We run SExtractor on our images in dual mode, with the -band image as the detection image. At a distance of 107 Mpc, globular clusters will look like point sources in the images. Therefore, to pre-select the GC candidates, we first select stars in our images by imposing that the stellarity parameter in SExtractor (‘CLASS_STAR’) is greater than 0.98. We do this to estimate the FWHM of a point-like source in our images, to impose strict conditions on our detections and to minimise contamination from other objects. We find 6 point-like objects, 3 of which were detected in Gaia DR3 (Gaia Collaboration et al., 2023). The FWHM of these point-like objects are between and pixels (0.8″to 1.12″) and their ellipticities are . Therefore, based on these values, we pre-selected the GC candidates with: ellipticity , FWHM pix and mag, in order to minimise false detections.
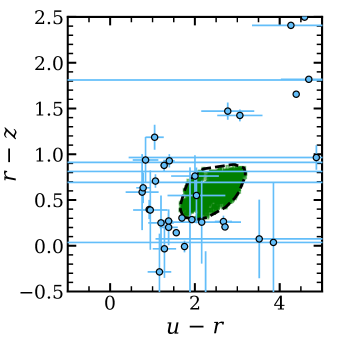
After this initial selection, we also applied the colour-colour selection used in Taylor et al. (2017) to narrow down the selection of GCs777See Muñoz et al. (2014); Lim et al. (2020); Cantiello et al. (2020) for other examples on using colour-colour diagrams to identify candidate GCs.. To do this, we defined a colour-colour region based on the position on the diagram of candidate GCs with a probability of 0.95 of being true GCs in Taylor et al. (2017), the green squares in Fig. 7. To define this region, we computed the convex hull or convex envelope, i.e., the minimum region containing all GCs from Taylor et al. (2017) (dashed line in Fig. 7).
Only two sources fall on the area defined by the GCs provided by Taylor et al. (2017)888Taylor et al. (2017) use the GCs of NGC5128 to generate their catalogue. NGC5128 is a massive galaxy with intense merger activity. Therefore, the population of GCs in this massive galaxy includes GCs of a wide variety of origins, from those formed in-situ in this massive galaxy to those accreted by mergers with a large number of dwarfs. In this sense, the Taylor et al. (2017) catalogue is expected to contain a very heterogeneous and complete sample of GCs.. However, both are very far from Nube (110″or 54 kpc from its centre), so they are unlikely to be associated with the galaxy. We also checked the three sources near the bottom of the region (u-r2, r-z0.25), but they are also not spatially associated with Nube. In summary, we are unable to detect any GCs associated with Nube, as expected, considering both our point-like limiting magnitudes and if the distance to the galaxy is 107 Mpc.
4 On the formation mechanism of Nube
4.1 Nube in comparison with other Low Surface Brightness galaxies
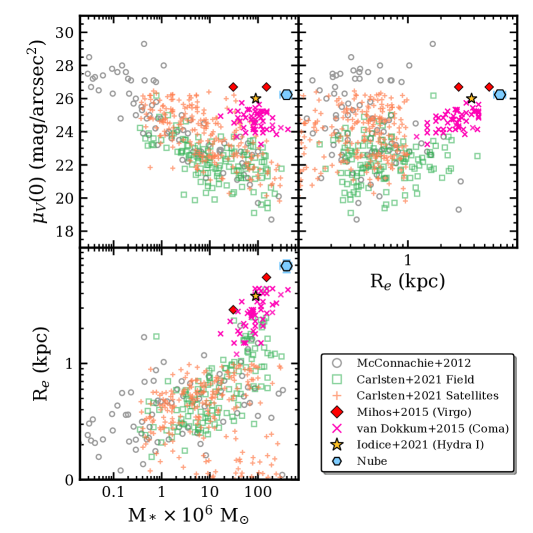
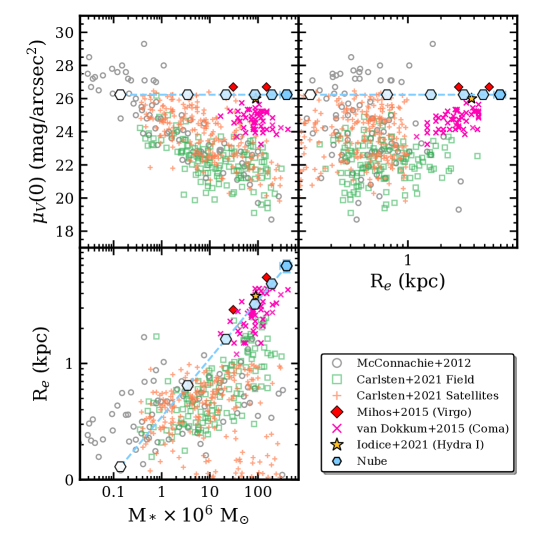
The galaxy reported in this paper, Nube, has some extreme properties in terms of size and surface brightness. Fig. 8 shows the structural properties of Nube compared to other low surface brightness or dwarf galaxies compiled from the literature. The grey open circles represent low-mass Local Group galaxies from McConnachie (2012), the green open squares are field dwarfs, while the orange crosses are satellite dwarfs (orbiting a more massive galaxy) from Carlsten et al. (2021), pink ‘x’ are UDGs in Coma from van Dokkum et al. (2015), the golden star is UDG32 from Iodice et al. (2021) and the red diamonds are two of the LSB galaxies in Virgo from Mihos et al. (2015). Compared to all these objects, Nube appears quite unique due to its low central surface brightness and extension for a galaxy of its stellar mass. The closest objects in size, mass and central surface brightness are the two LSB galaxies in Virgo from Mihos et al. (2015): VLSB-B and VLSB-C999To derive the mass of VLSB-C, we assume a BV = 0.7 mag for this galaxy, which is typical for dwarf galaxies and the M/L colour relation in Bell et al. (2003). and UDG32 in Hydra I (Iodice et al., 2021). We do not include VLSB-A, as this LSB galaxy is clearly tidally perturbed, as indicated by its visible tidal tails. VLSB-C appears to be quite similar in size and brightness to Nube ( kpc and mag/arcsec2, Mihos et al., 2015). This galaxy shows no obvious signs of tidal stripping; possibly it is an LSB galaxy in the cluster outskirts or falling into the Virgo cluster for the first time.
We also compare Nube with other galaxies that have been described as “almost dark” in previous works. One example is AGC229385 (also known as Coma P.; Janowiecki et al., 2015; Brunker et al., 2019). Unlike Nube, this galaxy appears elongated. It also has an extreme ratio of HI to stellar mass (=81; Brunker et al., 2019) compared to Nube (). This is also the case of AGC229101 (Leisman et al., 2021). This galaxy is an HI source (=98) with a very dim optical counterpart ( mag/arcsec2) and kpc. Other two extended “almost dark” galaxies are AGC229398 and AGC333576 (Gray et al., 2023). Their effective radii are large, 9 and 4.4 kpc respectively, and their stellar masses (108 M⊙) are also close to Nube. However, their central surface brightness are significantly brighter than Nube (23.8 and 24.6 mag/arcsec2).
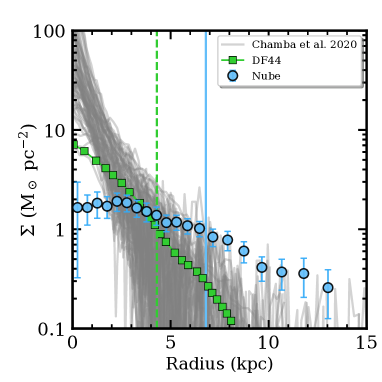
In addition to comparing the global properties of Nube with other low-mass galaxies, it is also very instructive to compare its surface mass density profile with respect to galaxies of similar stellar mass. In Fig. 9, we show the stellar surface mass density of Nube (blue dots) derived from the colours (Sec. 3.1). For comparison, we plot the profiles of dwarf galaxies of similar stellar mass (grey lines), in the mass range from Chamba et al. (2020). This shows how different Nube is from typical dwarf galaxies of similar mass. Even ultra-diffuse galaxies with large effective radius are not comparable to this galaxy. For example, the iconic ultra-diffuse galaxy Dragonfly 44 (DF44), also shown as the green squares in Fig. 9, has a kpc (van Dokkum et al., 2016)101010Other estimates for for DF44 are kpc (Chamba et al., 2020) and kpc (Saifollahi et al., 2021)., and a central surface brightness of mag/arcsec2. This is 1.5 times smaller and mag/arcsec2 brighter than Nube.
4.2 On the nature of Nube
Given the extreme properties of Nube, it is interesting to discuss whether these properties are a result of the original formation of this galaxy, or whether they are due to a later evolutionary process caused by the environment in which it is found. In this section, we discuss two possible alternatives. In the first, we explore whether Nube can be considered a tidal dwarf galaxy. The second is whether Nube was born with a stellar density typical of dwarf galaxies of the same stellar mass and has been deformed by the environment into this peculiar structure. Either of these two possibilities (if correct) should be able to explain the stellar populations and the present morphology of Nube.
4.2.1 Is Nube a Tidal Dwarf Galaxy (TDG)?
There is a population of galaxies whose formation mechanisms would not be associated with what is expected to be the main channel of formation of galaxies, i.e., gravitational collapse of gas within a dark matter halo. These galaxies are known as Tidal Dwarf Galaxies (TDGs). They form from material torn away from larger galaxies by tidal interactions or by harassment (e.g., Duc & Bournaud, 2008) and, as a result of their formation, they exhibit characteristics such as significant gas fractions, low dark matter content, and metallicity higher than expected for dwarf galaxies of similar mass (e.g., Duc, 2012).
Around 95% of the known TDG galaxies are located at relatively modest distances (20 kpc) from their potential progenitors (Kaviraj et al., 2012). However, Nube is very distant (435 kpc) from its likely progenitor UGC929. This large distance from its possible parent should not be considered as a factor against Nube being a TDG, since the selection of TDG galaxies usually requires a visible tidal tail and is therefore biased towards newly formed objects. Some simulations suggest that if the TDG is massive enough (M) and escapes the parent galaxy with sufficient velocity, it could become self-gravitating and avoid falling back into its progenitor system (Bournaud & Duc, 2006). However, it is unclear how long TDGs formed in this way could survive without the protection of a massive dark matter halo, as both axisymmetric and non-axisymmetric instabilities would eventually destroy the system (Sellwood & Sanders, 2022). Assuming that these galaxies manage to survive, they are expected to remain gas-rich and very faint. These old galaxies are therefore good candidates to be identified as “almost dark” galaxies (see e.g., Cannon et al., 2015; Janowiecki et al., 2015; Leisman et al., 2017; Román et al., 2021).
The metallicity observed in Nube ([Fe/H] = ) is similar to that of normal dwarf galaxies (e.g., McConnachie, 2012). However, it is lower than expected for currently forming TDGs (solar metallicity, e.g., Duc et al., 2000), i.e., more metallic as it inherits the metallicity of the more massive parent galaxies. Nonetheless, given the age of the galaxy (9 Gyr), it could have formed from ancient spirals with less enriched gas than the present ones (see e.g., Recchi et al., 2015). Therefore, the relatively low metallicity of Nube should not necessarily be an indication that it did not form as a TDG.
Another characteristic of TDGs is their low dark matter content. The dynamical mass of Nube is M⊙ within kpc (Sec. 3.3), while the stellar mass is M M⊙ (Sec. 3.2). This means that the ratio of dark matter to stellar mass is between . This amount of dark matter is significantly larger than the amount of dark matter expected if the galaxy had formed as a TDG (M2; Gray et al., 2023). In addition, its gas content relative to the stellar content is not very large compared to those found in other TDGs (M10, Gray et al., 2023). For these reasons, we conclude that Nube is with high confidence not a TDG.
4.2.2 Nube as a result of environmental processes
If Nube is not a TDG, can its structural properties be explained as the result of interaction with its environment? It is known that dwarf galaxies can be dynamically heated and “puffed up” by interactions with more massive galaxies (e.g., Liao et al., 2019; Tremmel et al., 2020). This puffing could explain why the age and metallicity of Nube are similar to other regular dwarf galaxies, while its physical properties (effective radius and central surface brightness) are extreme. However, against this scenario for the origin of Nube is the fact that the galaxy does not inhabit a particularly dense environment. In fact, its nearest massive neighbour, UGC 929, is at a distance of 435 kpc in projection.
Assuming that Nube and UGC 929 have had a close encounter in the past, we can make a rough estimate of when this occurred. Considering the current projected distance between the two objects plus a transverse projected velocity of 100 km/s (i.e., 100 kpc/Gyr), the close encounter would have occurred 4 to 5 Gyr ago. Given the dynamical time of each galaxy, this is enough time to have erased any signature of the perturbation in the central regions of both objects. We do not find the central region of Nube to be obviously perturbed (see Fig. 10). Regarding UGC929, we have used deep imaging from DECaLS to study its morphology. Fig. 13 shows the composite DECaLS image of the galaxy. We can see in the image that the galaxy appears to be very symmetric, with no sign of perturbations or interactions. Therefore, if Nube and UGC929 had met in the past, it would have been long enough for the central shape of both galaxies to have already been restored.
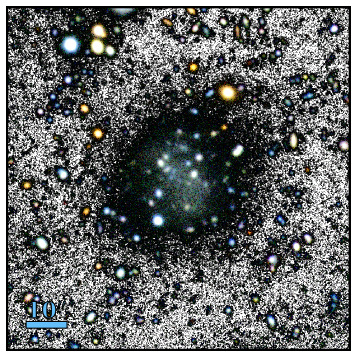
However, in the outermost parts of Nube it would be possible to study the effects of this gravitational interaction in the form of tidal distortions. These deformations produce an S-shaped structure (e.g. Johnston et al., 2002; Moreno et al., 2022). Thanks to the deep imaging provided by HiPERCAM, we can investigate whether there is any evidence that this could be the case for Nube. An interaction capable of distorting the galaxy in this way would be clearly visible in our ultra-deep imaging (30.5 mag/arcsec2; see Sec. 2.1) even long after the interaction (Moreno et al., 2022). Fig. 10 shows an RGB composite of the image of Nube with a black and white background to highlight the fainter outskirts of this galaxy. A visual inspection of Nube shows no obvious signatures of deformation in the outer regions. This can be seen from the lack of an excess in the outer parts of the surface brightness and stellar density profiles (Fig. 4 and Fig. 5), which is associated with the presence of tidal tails (Johnston et al., 2002; Montes et al., 2020).
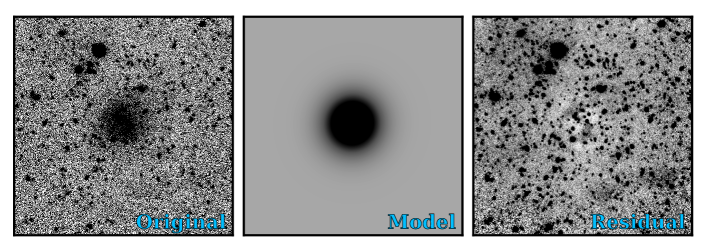
To improve the visualization of the outer parts of Nube, we also modelled Nube with GALFIT. To obtain additional signal-to-noise, we have performed a model fit on a image. Fig. 11 shows the original (left), model (middle) and residual (right) image. No signs of an excess or deformation can be seen.
| filter | n | ||
|---|---|---|---|
| (arcsec) | |||
| 0.999 | |||
| 0.986 | |||
| 0.962 | |||
| 0.975 | |||
| 0.971 |
5 Nube as a test-bed to explore the nature of dark matter
5.1 Nube within the cold dark matter scenario
Given the extreme properties of Nube, it is interesting to see whether traditional models of cold dark matter are able to reproduce galaxies with these characteristics. In particular, we are interested in knowing if galaxy formation models can produce objects with stellar masses, surface brightnesses and effective radii like Nube. To answer this question, it is worth looking at simulations that have been able to reproduce the properties of the largest known ultra-diffuse galaxies. These simulations have sufficient spatial resolution and stellar population feedback recipes to produce low surface brightness, large effective radius galaxies like DF44.
Using the FIRE-2 simulations (Hopkins et al., 2018), Chan et al. (2018) find that isolated field dwarfs, where the effect of stellar feedback (i.e., stellar winds, supernovae, etc.) is large, produce galaxies with surface brightness, effective radius, and stellar masses representative of UDGs (after imposing artificial quenching to simulate the effect of infall into the cluster environment). Simulated galaxies with stellar masses around 108 M⊙ and dark matter halos around 1010 M⊙, such as Nube, have effective radii less than 5 kpc, smaller than what we measure for Nube. NIHAO simulations (Wang et al., 2015) produce galaxies with similar structural properties to UDGs due to episodes of gas outflows associated with star formation (Di Cintio et al., 2017). The dark matter halo masses and stellar masses are consistent with what we find for Nube. However, the effective radii (3 kpc) of these simulated galaxies are again well below the value we measure for Nube.
Other ways that have been proposed to form UDGs are high-z major mergers (Wright et al., 2021) or that UDGs populate higher spin halos (Amorisco & Loeb, 2016; Benavides et al., 2023). However, neither of these scenarios can reproduce the observed characteristics of Nube. In Wright et al. (2021), major mergers produce galaxies with kpc. Benavides et al. (2023) explores UDGs in the TNG50 simulation and finds that for isolated galaxies of the mass of Nube, the effective radius is 5 kpc.
5.2 Nube in the fuzzy dark matter framework
As the microphysical nature of the dark matter is still completely unknown, it is worth exploring whether extreme objects such as Nube can be compatible with other alternative dark matter models. In particular, models based on ultralight (axion-like) scalar particles are gaining recently a significant interest (fuzzy dark matter; Schive et al., 2014; May & Springel, 2021). Due to the very small mass of these particles (10-22 eV), the quantum effects are expected to appear at the kpc (i.e., galactic) scale. The ultralight particles generate dark matter models with large cores. In particular, the dark matter distribution is expected to generate a central distribution named soliton followed by a NFW profile in the outer parts (Schive et al., 2014). The soliton density profile can be well approximated by:
| (4) |
with mB the mass of the dark matter particle, rc the core radius where the density has dropped to one-half its peak value. Equation 29 of Bar et al. (2018) shows that if the core radius and the virial mass of the dark matter halo Mh is known, the dark matter particle can be estimated through the following equation:
| (5) |
To get a rough estimate of the core radius, we assume the stellar distribution follows the shape of the dark matter soliton. This is a reasonable assumption, as the dark matter is the dominant component generating the global gravitational potential (Sánchez Almeida et al., 2023). Therefore, we project the soliton density profile obtaining:
| (6) |
The stellar mass surface density of Nube fits very well with this equation (see Fig. 12). We obtain a value of = 6.6 0.4 kpc. The mass of the dark matter particle compatible with this core radius is mB=()10-23 eV.
We also plot a Navarro, Frenk & White profile (dashed black line, Navarro et al., 1996) to show that this commonly used profile to describe the distribution of mass in dark matter halos cannot reproduce the characteristics of Nube especially at small radii. For Fig. 12, we used the projected NFW profile in equation 11 in Wright & Brainerd (2000), assuming as transition radius () the core radius of the soliton derived above.
It is interesting to compare the mass of the axion-like particle derived in this analysis with other studies. Using galactic rotation curves, Bernal et al. (2018) found an average value of mB0.510-23 eV, while Bañares-Hernández et al. (2023) derived mB210-23 eV. These values are in good agreement with our estimate using only the structural properties of the galaxy. Analysing the velocity dispersion of the Fornax and Sculptor dwarfs, González-Morales et al. (2017) find an upper limit of mB410-23 eV. Based on the angular scale of the CMB acoustic peaks and anisotropies, Hložek et al. (2018) derive a lower limit of mB0.110-23 eV. Analysis of the stellar heating of the Milky Way disc due to the substructure within a fuzzy dark matter halo suggests an upper limit of mB410-23 eV (Chiang et al., 2023). These results are consistent with our estimate for the mass of the axion-like particle.
However, the situation is far from clear. Other estimates of the mass of the particle are inconsistent with the above results. To name a few, Chen et al. (2017) using Jeans analysis of the Milky Way satellite dSphs find mB=(17.93.3)10-23 eV. Dalal & Kravtsov (2022) suggest that the size and stellar kinematics of ultra-faint dwarfs imply a lower limit of mB310-19 eV. Although fuzzy dark matter could relieve some of the small scale tensions appearing in the cold dark matter scenario, more work is needed to assess this model.
6 Conclusions
In the absence of a laboratory detection of the particles that make up dark matter, the hope for characterising its nature lies in the analysis of astrophysical objects. In particular, galaxies with very low surface brightness (also called “almost dark”) offer an interesting possibility to constrain the microphysical properties of dark matter. In these galaxies, baryonic feedback effects are expected to be very moderate, leaving the spatial distribution of their dark matter halo almost intact.
In this paper, we present the serendipitous discovery in the IAC Stripe 82 Legacy Project (Fliri & Trujillo, 2016; Román & Trujillo, 2018) of a galaxy, Nube, of stellar mass M∗ = M⊙, very extended ( kpc) and very low surface brightness ( mag/arcsec2) located at 107 Mpc. Using the GBT radio telescope, we inferred a total halo mass of M⊙ for the galaxy. Current simulations of ultra-diffuse galaxy formation, which take into account baryonic feedback effects and simulate dark matter particles as WIMPs (i.e., cold dark matter), are unable to reproduce objects with the properties of Nube. We have investigated the possibility that the object could be reproduced with the predictions for the fuzzy dark matter model. To this end, and under the hypothesis that the distribution of stars in Nube is representative of the distribution of the dark matter halo, we found that a soliton-shaped profile (typical of fuzzy dark matter) reproduces the observed distribution of stars very well. The mass of the axion-like particle inferred from the fit is mB=()10-23 eV. This value is in good agreement with other astrophysical measurements using the dynamical properties of other low surface brightness galaxies.
Acknowledgements.
We thank the referee for their useful comments that helped improve the original manuscript. We are indebted to Amelia Trujillo González for suggesting the name of the galaxy explored in this work. The authors want to thank Scott Carlsten for providing the tables of the structural parameters of the dwarf galaxies in Carlsten et al. (2021). We also thank Betsy Adams and Pierre-Alain Duc for useful discussions. This publication is part of the Project PCI2021-122072-2B, financed by MICIN/AEI/10.13039/501100011033, and the European Union “NextGenerationEU”/RTRP. I.T. acknowledges support from the ACIISI, Consejería de Economía, Conocimiento y Empleo del Gobierno de Canarias and the European Regional Development Fund (ERDF) under grant with reference PROID2021010044 and from the State Research Agency (AEI-MCINN) of the Spanish Ministry of Science and Innovation under the grant PID2019-107427GB-C32, financed by the Ministry of Science and Innovation, through the State Budget and by the Canary Islands Department of Economy, Knowledge and Employment, through the Regional Budget of the Autonomous Community. MM and IT acknowledge support from IAC project P/302302. NC acknowledges support from the research project grant ‘Understanding the Dynamic Universe’ funded by the Knut and Alice Wallenberg Foundation under Dnr KAW 2018.0067. Based on observations made with the GTC telescope, in the Spanish Observatorio del Roque de los Muchachos of the Instituto de Astrofísica de Canarias, under Director’s Discretionary Time. This work makes use of the following code: astropy (The Astropy Collaboration et al., 2018), SExtractor (Bertin & Arnouts, 1996), SCAMP (Bertin, 2006), SWarp (Bertin, 2010), Gnuastro (Akhlaghi & Ichikawa, 2015), photutils v0.7.2 (Bradley et al., 2019), pillow (van Kemenade et al., 2020), numpy (Oliphant, 2006), scipy (Virtanen et al., 2020), Astrometry.net (Lang et al., 2010), GALFIT (Peng et al., 2002).References
- Akhlaghi (2019) Akhlaghi, M. 2019, arXiv e-prints, arXiv:1909.11230
- Akhlaghi & Ichikawa (2015) Akhlaghi, M. & Ichikawa, T. 2015, ApJS, 220, 1
- Akhlaghi et al. (2021) Akhlaghi, M., Infante-Sainz, R., Roukema, B. F., et al. 2021, Computing in Science and Engineering, 23, 82
- Alam et al. (2015) Alam, S., Albareti, F. D., Allende Prieto, C., et al. 2015, ApJS, 219, 12
- Amorisco & Loeb (2016) Amorisco, N. C. & Loeb, A. 2016, MNRAS, 459, L51
- Bañares-Hernández et al. (2023) Bañares-Hernández, A., Castillo, A., Martin Camalich, J., & Iorio, G. 2023, A&A, 676, A63
- Bakos et al. (2008) Bakos, J., Trujillo, I., & Pohlen, M. 2008, ApJ, 683, L103
- Bar et al. (2018) Bar, N., Blas, D., Blum, K., & Sibiryakov, S. 2018, Phys. Rev. D, 98, 083027
- Bell et al. (2003) Bell, E. F., McIntosh, D. H., Katz, N., & Weinberg, M. D. 2003, ApJS, 149, 289
- Benavides et al. (2023) Benavides, J. A., Sales, L. V., Abadi, M. G., et al. 2023, MNRAS, 522, 1033
- Bernal et al. (2018) Bernal, T., Fernández-Hernández, L. M., Matos, T., & Rodríguez-Meza, M. A. 2018, MNRAS, 475, 1447
- Bertin (2006) Bertin, E. 2006, in Astronomical Society of the Pacific Conference Series, Vol. 351, Astronomical Data Analysis Software and Systems XV, ed. C. Gabriel, C. Arviset, D. Ponz, & S. Enrique, 112
- Bertin (2010) Bertin, E. 2010, SWarp: Resampling and Co-adding FITS Images Together
- Bertin & Arnouts (1996) Bertin, E. & Arnouts, S. 1996, A&AS, 117, 393
- Blumenthal et al. (1984) Blumenthal, G. R., Faber, S. M., Primack, J. R., & Rees, M. J. 1984, Nature, 311, 517
- Bode et al. (2001) Bode, P., Ostriker, J. P., & Turok, N. 2001, ApJ, 556, 93
- Bournaud & Duc (2006) Bournaud, F. & Duc, P. A. 2006, A&A, 456, 481
- Boylan-Kolchin et al. (2011) Boylan-Kolchin, M., Bullock, J. S., & Kaplinghat, M. 2011, MNRAS, 415, L40
- Bradley et al. (2019) Bradley, L., Sipocz, B., Robitaille, T., et al. 2019, astropy/photutils: v0.7.1
- Brunker et al. (2019) Brunker, S. W., McQuinn, K. B. W., Salzer, J. J., et al. 2019, AJ, 157, 76
- Bruzual & Charlot (2003) Bruzual, G. & Charlot, S. 2003, MNRAS, 344, 1000
- Cannon et al. (2015) Cannon, J. M., Martinkus, C. P., Leisman, L., et al. 2015, AJ, 149, 72
- Cantiello et al. (2020) Cantiello, M., Venhola, A., Grado, A., et al. 2020, A&A, 639, A136
- Carlsten et al. (2021) Carlsten, S. G., Greene, J. E., Greco, J. P., Beaton, R. L., & Kado-Fong, E. 2021, ApJ, 922, 267
- Chabrier (2003) Chabrier, G. 2003, ApJ, 586, L133
- Chamba et al. (2020) Chamba, N., Trujillo, I., & Knapen, J. H. 2020, A&A, 633, L3
- Chamba et al. (2022) Chamba, N., Trujillo, I., & Knapen, J. H. 2022, A&A, 667, A87
- Chan et al. (2018) Chan, T. K., Kereš, D., Wetzel, A., et al. 2018, MNRAS, 478, 906
- Chen et al. (2017) Chen, S.-R., Schive, H.-Y., & Chiueh, T. 2017, MNRAS, 468, 1338
- Chiang et al. (2023) Chiang, B. T., Ostriker, J. P., & Schive, H.-Y. 2023, MNRAS, 518, 4045
- Conselice et al. (2003) Conselice, C. J., O’Neil, K., Gallagher, J. S., & Wyse, R. F. G. 2003, ApJ, 591, 167
- Dalal & Kravtsov (2022) Dalal, N. & Kravtsov, A. 2022, Phys. Rev. D, 106, 063517
- Davis et al. (1985) Davis, M., Efstathiou, G., Frenk, C. S., & White, S. D. M. 1985, ApJ, 292, 371
- Davis et al. (1992) Davis, M., Efstathiou, G., Frenk, C. S., & White, S. D. M. 1992, Nature, 356, 489
- Del Popolo & Le Delliou (2017) Del Popolo, A. & Le Delliou, M. 2017, Galaxies, 5, 17
- Dey et al. (2019) Dey, A., Schlegel, D. J., Lang, D., et al. 2019, AJ, 157, 168
- Dhillon et al. (2018) Dhillon, V., Dixon, S., Gamble, T., et al. 2018, in Society of Photo-Optical Instrumentation Engineers (SPIE) Conference Series, Vol. 10702, Proc. SPIE, 107020L
- Di Cintio et al. (2017) Di Cintio, A., Brook, C. B., Dutton, A. A., et al. 2017, MNRAS, 466, L1
- Di Cintio et al. (2014) Di Cintio, A., Brook, C. B., Macciò, A. V., et al. 2014, MNRAS, 437, 415
- Duc (2012) Duc, P.-A. 2012, in Astrophysics and Space Science Proceedings, Vol. 28, Dwarf Galaxies: Keys to Galaxy Formation and Evolution, 305
- Duc & Bournaud (2008) Duc, P.-A. & Bournaud, F. 2008, ApJ, 673, 787
- Duc et al. (2000) Duc, P. A., Brinks, E., Springel, V., et al. 2000, AJ, 120, 1238
- Eisenstein et al. (2011) Eisenstein, D. J., Weinberg, D. H., Agol, E., et al. 2011, AJ, 142, 72
- Feldmann (2020) Feldmann, R. 2020, Communications Physics, 3, 226
- Fliri & Trujillo (2016) Fliri, J. & Trujillo, I. 2016, MNRAS, 456, 1359
- Gaia Collaboration et al. (2023) Gaia Collaboration, Vallenari, A., Brown, A. G. A., et al. 2023, A&A, 674, A1
- Giovanelli et al. (2005) Giovanelli, R., Haynes, M. P., Kent, B. R., et al. 2005, AJ, 130, 2598
- Goddy et al. (2020) Goddy, J., Stark, D. V., & Masters, K. L. 2020, Research Notes of the American Astronomical Society, 4, 3
- González-Morales et al. (2017) González-Morales, A. X., Marsh, D. J. E., Peñarrubia, J., & Ureña-López, L. A. 2017, MNRAS, 472, 1346
- Governato et al. (2010) Governato, F., Brook, C., Mayer, L., et al. 2010, Nature, 463, 203
- Gray et al. (2023) Gray, L. M., Rhode, K. L., Leisman, L., et al. 2023, AJ, 165, 197
- Haynes & Giovanelli (1984) Haynes, M. P. & Giovanelli, R. 1984, AJ, 89, 758
- Heesters et al. (2023) Heesters, N., Müller, O., Marleau, F. R., et al. 2023, A&A, 676, A33
- Hložek et al. (2018) Hložek, R., Marsh, D. J. E., & Grin, D. 2018, MNRAS, 476, 3063
- Hopkins et al. (2018) Hopkins, P. F., Wetzel, A., Kereš, D., et al. 2018, MNRAS, 480, 800
- Hu et al. (2000) Hu, W., Barkana, R., & Gruzinov, A. 2000, Phys. Rev. Lett., 85, 1158
- Iodice et al. (2023) Iodice, E., Hilker, M., Doll, G., et al. 2023, arXiv e-prints, arXiv:2308.11493
- Iodice et al. (2021) Iodice, E., La Marca, A., Hilker, M., et al. 2021, A&A, 652, L11
- Ivezić et al. (2019) Ivezić, Ž., Kahn, S. M., Tyson, J. A., et al. 2019, ApJ, 873, 111
- Janowiecki et al. (2015) Janowiecki, S., Leisman, L., Józsa, G., et al. 2015, ApJ, 801, 96
- Johnston et al. (2002) Johnston, K. V., Choi, P. I., & Guhathakurta, P. 2002, AJ, 124, 127
- Karunakaran et al. (2020a) Karunakaran, A., Spekkens, K., Bennet, P., et al. 2020a, AJ, 159, 37
- Karunakaran et al. (2020b) Karunakaran, A., Spekkens, K., Zaritsky, D., et al. 2020b, ApJ, 902, 39
- Kaviraj et al. (2012) Kaviraj, S., Darg, D., Lintott, C., Schawinski, K., & Silk, J. 2012, MNRAS, 419, 70
- La Marca et al. (2022) La Marca, A., Iodice, E., Cantiello, M., et al. 2022, A&A, 665, A105
- Lang et al. (2010) Lang, D., Hogg, D. W., Mierle, K., Blanton, M., & Roweis, S. 2010, AJ, 139, 1782
- Leisman et al. (2017) Leisman, L., Haynes, M. P., Janowiecki, S., et al. 2017, ApJ, 842, 133
- Leisman et al. (2021) Leisman, L., Rhode, K. L., Ball, C., et al. 2021, AJ, 162, 274
- Liao et al. (2019) Liao, S., Gao, L., Frenk, C. S., et al. 2019, MNRAS, 490, 5182
- Lim et al. (2020) Lim, S., Côté, P., Peng, E. W., et al. 2020, ApJ, 899, 69
- Marleau et al. (2021) Marleau, F. R., Habas, R., Poulain, M., et al. 2021, A&A, 654, A105
- Matos & Arturo Ureña-López (2001) Matos, T. & Arturo Ureña-López, L. 2001, Phys. Rev. D, 63, 063506
- May & Springel (2021) May, S. & Springel, V. 2021, MNRAS, 506, 2603
- McConnachie (2012) McConnachie, A. W. 2012, AJ, 144, 4
- Mihos et al. (2015) Mihos, J. C., Durrell, P. R., Ferrarese, L., et al. 2015, ApJ, 809, L21
- Montes et al. (2014) Montes, M., Acosta-Pulido, J. A., Prieto, M. A., & Fernández-Ontiveros, J. A. 2014, MNRAS, 442, 1350
- Montes et al. (2020) Montes, M., Infante-Sainz, R., Madrigal-Aguado, A., et al. 2020, ApJ, 904, 114
- Montes et al. (2021) Montes, M., Trujillo, I., Infante-Sainz, R., Monelli, M., & Borlaff, A. S. 2021, ApJ, 919, 56
- Moreno et al. (2022) Moreno, J., Danieli, S., Bullock, J. S., et al. 2022, Nature Astronomy, 6, 496
- Muñoz et al. (2014) Muñoz, R. P., Puzia, T. H., Lançon, A., et al. 2014, ApJS, 210, 4
- Navarro et al. (1996) Navarro, J. F., Frenk, C. S., & White, S. D. M. 1996, ApJ, 462, 563
- Oñorbe et al. (2015) Oñorbe, J., Boylan-Kolchin, M., Bullock, J. S., et al. 2015, MNRAS, 454, 2092
- Oliphant (2006) Oliphant, T. E. 2006, A guide to NumPy, Vol. 1 (Trelgol Publishing USA)
- Peñarrubia et al. (2012) Peñarrubia, J., Pontzen, A., Walker, M. G., & Koposov, S. E. 2012, ApJ, 759, L42
- Peng et al. (2002) Peng, C. Y., Ho, L. C., Impey, C. D., & Rix, H.-W. 2002, AJ, 124, 266
- Recchi et al. (2015) Recchi, S., Kroupa, P., & Ploeckinger, S. 2015, MNRAS, 450, 2367
- Rejkuba (2012) Rejkuba, M. 2012, Ap&SS, 341, 195
- Roediger & Courteau (2015) Roediger, J. C. & Courteau, S. 2015, MNRAS, 452, 3209
- Román et al. (2021) Román, J., Jones, M. G., Montes, M., et al. 2021, A&A, 649, L14
- Román & Trujillo (2017) Román, J. & Trujillo, I. 2017, MNRAS, 468, 4039
- Román & Trujillo (2018) Román, J. & Trujillo, I. 2018, Research Notes of the American Astronomical Society, 2, 144
- Román et al. (2020) Román, J., Trujillo, I., & Montes, M. 2020, A&A, 644, A42
- Ruiz-Lara et al. (2018) Ruiz-Lara, T., Beasley, M. A., Falcón-Barroso, J., et al. 2018, MNRAS, 478, 2034
- Saifollahi et al. (2021) Saifollahi, T., Trujillo, I., Beasley, M. A., Peletier, R. F., & Knapen, J. H. 2021, MNRAS, 502, 5921
- Sánchez Almeida et al. (2023) Sánchez Almeida, J., Plastino, A. R., & Trujillo, I. 2023, ApJ, 954, 153
- Sandage & Binggeli (1984) Sandage, A. & Binggeli, B. 1984, AJ, 89, 919
- Schaye (2004) Schaye, J. 2004, ApJ, 609, 667
- Schive et al. (2014) Schive, H.-Y., Chiueh, T., & Broadhurst, T. 2014, Nature Physics, 10, 496
- Schlafly & Finkbeiner (2011) Schlafly, E. F. & Finkbeiner, D. P. 2011, ApJ, 737, 103
- Sellwood & Sanders (2022) Sellwood, J. A. & Sanders, R. H. 2022, MNRAS, 514, 4008
- Sérsic (1968) Sérsic, J. L. 1968, Atlas de galaxias australes
- Sin (1994) Sin, S.-J. 1994, Phys. Rev. D, 50, 3650
- Smoot et al. (1992) Smoot, G. F., Bennett, C. L., Kogut, A., et al. 1992, ApJ, 396, L1
- Sommer-Larsen & Dolgov (2001) Sommer-Larsen, J. & Dolgov, A. 2001, ApJ, 551, 608
- Spekkens & Karunakaran (2018) Spekkens, K. & Karunakaran, A. 2018, ApJ, 855, 28
- Spekkens et al. (2013) Spekkens, K., Mason, B. S., Aguirre, J. E., & Nhan, B. 2013, ApJ, 773, 61
- Spergel & Steinhardt (2000) Spergel, D. N. & Steinhardt, P. J. 2000, Phys. Rev. Lett., 84, 3760
- Springob et al. (2005) Springob, C. M., Haynes, M. P., Giovanelli, R., & Kent, B. R. 2005, ApJS, 160, 149
- Springob et al. (2009) Springob, C. M., Masters, K. L., Haynes, M. P., Giovanelli, R., & Marinoni, C. 2009, ApJS, 182, 474
- Tanoglidis et al. (2021) Tanoglidis, D., Drlica-Wagner, A., Wei, K., et al. 2021, ApJS, 252, 18
- Taylor et al. (2017) Taylor, M. A., Puzia, T. H., Muñoz, R. P., et al. 2017, MNRAS, 469, 3444
- The Astropy Collaboration et al. (2018) The Astropy Collaboration, Price-Whelan, A. M., Sipőcz, B. M., et al. 2018, ArXiv e-prints [arXiv:1801.02634]
- Tremmel et al. (2020) Tremmel, M., Wright, A. C., Brooks, A. M., et al. 2020, MNRAS, 497, 2786
- Trujillo et al. (2020) Trujillo, I., Chamba, N., & Knapen, J. H. 2020, MNRAS, 493, 87
- Trujillo et al. (2021) Trujillo, I., D’Onofrio, M., Zaritsky, D., et al. 2021, A&A, 654, A40
- Trujillo & Fliri (2016) Trujillo, I. & Fliri, J. 2016, ApJ, 823, 123
- van Dokkum et al. (2016) van Dokkum, P., Abraham, R., Brodie, J., et al. 2016, ApJ, 828, L6
- van Dokkum et al. (2015) van Dokkum, P. G., Abraham, R., Merritt, A., et al. 2015, ApJ, 798, L45
- van Kemenade et al. (2020) van Kemenade, H., wiredfool, Murray, A., et al. 2020, python-pillow/Pillow 7.1.1
- van Zee et al. (1997) van Zee, L., Maddalena, R. J., Haynes, M. P., Hogg, D. E., & Roberts, M. S. 1997, AJ, 113, 1638
- Verheijen & Sancisi (2001) Verheijen, M. A. W. & Sancisi, R. 2001, A&A, 370, 765
- Virtanen et al. (2020) Virtanen, P., Gommers, R., Oliphant, T. E., et al. 2020, Nature Methods, 17, 261
- Wang et al. (2015) Wang, L., Dutton, A. A., Stinson, G. S., et al. 2015, MNRAS, 454, 83
- Weinberg et al. (2015) Weinberg, D. H., Bullock, J. S., Governato, F., Kuzio de Naray, R., & Peter, A. H. G. 2015, Proceedings of the National Academy of Science, 112, 12249
- White & Rees (1978) White, S. D. M. & Rees, M. J. 1978, MNRAS, 183, 341
- Wright et al. (2021) Wright, A. C., Tremmel, M., Brooks, A. M., et al. 2021, MNRAS, 502, 5370
- Wright & Brainerd (2000) Wright, C. O. & Brainerd, T. G. 2000, ApJ, 534, 34
- Zaritsky et al. (2023) Zaritsky, D., Donnerstein, R., Dey, A., et al. 2023, ApJS, 267, 27
- Zhou et al. (2021) Zhou, R., Newman, J. A., Mao, Y.-Y., et al. 2021, MNRAS, 501, 3309
Appendix A Properties of UGC929
Given the difference in distance between both galaxies, we assumed that Nube is a satellite of UGC 929. UGC 929 is at a projected distance of 14.7 (435 kpc at a distance of 107 Mpc) from Nube. To calculate the stellar mass of UGC929, we use the DECaLS g and r images, obtaining the M/L ratio using the Roediger & Courteau (2015) prescriptions and assuming a Chabrier (2003). The stellar mass of the galaxy is .
Appendix B Alternative distances to Nube
Some of the most peculiar properties of Nube depend on the assumed distance to the galaxy. In Section 2.3 we found that it is unlikely that another nearby galaxy could be responsible for the HI emission we detected. However, we cannot completely rule out the possibility that the HI detection is not related to Nube. In that case, the galaxy could be at a different distance from the one assumed in this work. For this reason, it is worth exploring what alternative distances are potentially possible.
One possibility is that Nube is a satellite of a galaxy in the field of view other than UGC929. Exploring the nearby galaxies with spectroscopic redshifts (Fig. 1), Nube could be associated with UGC928 (8248 km/s). However, if it is associated with UGC928 (projected separation of ), Nube will be even further away and its properties will be even more extreme. Alternatively, Nube could be closer to us. In Fig. 14 we show the inferred properties of Nube at different distances, from 2 Mpc (white) to the assumed distance of 107 Mpc (darker blue). The only galaxy in the field of view with a spectroscopic redshift that is closer to us is UGC931 (Fig. 1) at Mpc (Springob et al. 2009). If Nube it is associated with UGC931, its properties will also be peculiar. Its stellar mass and will be similar to those of UDGs, but it would have a significantly lower central surface brightness (3rd to 4th hexagon from the left, upper right panel in Fig. 14).
For Nube to be a more normal galaxy, the distance should be between 2 and 10 Mpc. In this case, Nube will be more like the low-mass Local Group galaxies of McConnachie (2012), such as Phoenix (M∗ = M⊙, = 454 pc and = 25.8 mag/arcsec2) or the dwarfs of Carlsten et al. (2021). However, there is no nearby massive galaxy to act as a host for Nube in such case, and therefore it would be a rare example of an isolated very low-mass galaxy.
Appendix C Photometric redshifts and other sources around Nube
Given the spatial resolution of the GBT data, in section 2.3 we discussed the possibility that the HI detection corresponds to another source and not to Nube. Table 3 lists all galaxies with photometric redshifts within 10′ of Nube. Table 4 lists faint sources that have neither spectroscopic nor photometric redshifts, but could be responsible for the HI emission.
| RA | DEC | z | mr | distance |
|---|---|---|---|---|
| (deg) | (deg) | (AB mag) | (arcmin) | |
| 20.7455 | -0.6473 | 0.0280.03 | 17.3 | 7.3* |
| 20.8104 | -0.6972 | 0.0250.03 | 20.4 | 5.5a |
| 20.8105 | -0.7059 | 0.0250.02 | 21.0 | 5.9a |
| 20.8349 | -0.6543 | 0.0250.1 | 20.3 | 2.5* |
| 20.7561 | -0.5262 | 0.0270.05 | 17.2 | 8.9* |
| 20.7682 | -0.5045 | 0.0260.2 | 20.2 | 9.2* |
| 20.7984 | -0.6008 | 0.0250.1 | 20.6 | 4.2* |
| 20.8535 | -0.5496 | 0.0260.1 | 20.0 | 4.5* |
| 20.8571 | -0.5475 | 0.0250.01 | 12.1 | 4.6* |
| 20.9294 | -0.4799 | 0.0260.09 | 20.4 | 9.5* |
| 21.0163 | -0.6003 | 0.0270.15 | 20.5 | 9.2* |
| RA | DEC | Distance to Nube |
|---|---|---|
| (deg) | (deg) | (arcmin) |
| 20.9390 | -0.6132 | 4.5 |
| 20.9092 | -0.5122 | 7.2 |
Appendix D Masks for photometry and surface brightness profiles
Masking is a key component in obtaining reliable photometry and surface brightness profiles of the galaxy under study. In section 3.1 we describe how the HiPERCAM mask used to derive the photometry and surface brightness profiles of Nubewas created. Fig. 15 shows the mask used to derive the photometry and surface brightness profiles of the galaxy.