Galaxy formation with Wave/Fuzzy Dark Matter: The core-halo structure
Abstract
Dark matter-dominated cores have long been claimed for the well-studied local group dwarf galaxies. More recently, extended stellar halos have been uncovered around several of these dwarfs through deeper imaging and spectroscopy. Such core-halo structures are not a feature of conventional cold dark matter (CDM), based on collisionless particles where smooth, scale-free profiles are predicted. In contrast, smooth and prominent dark matter cores are predicted for Warm and Fuzzy/Wave Dark Matter (WDM/DM) respectively. The question arises to what extent the visible stellar profiles should reflect this dark matter core structure. Here we compare cosmological hydrodynamical simulations of CDM, WDM DM, aiming to predict the stellar profiles for these three DM scenarios. We show that cores surrounded by extended halos are distinguishable for WDM and DM, with the most prominent cores in the case of DM, where the stellar density is enhanced in the core due to the presence of the relatively dense soliton. Our analysis demonstrates that such behavior does not appear in CDM, implying that the small-scale cut-off in the power spectrum present for WDM and DM provides a core-halo transition. Consequently, we estimate the mass of the DM particle at this core-halo transition point. Furthermore, we observe the anticipated asymmetry for DM due to the soliton’s random walk, a distinctive characteristic not found in the symmetric distributions of stars in Warm and CDM models.
keywords:
Dark Matter, Galaxies: dwarfs, Galaxies: kinematics and dynamics1 Introduction
Dark Matter is understood to be non-relativistic, i.e. cold, as required to form galaxies gravitationally and for explaining the spectrum of CMB fluctuations in detail (Collaboration et al., 2018). However, the standard heavy particle interpretation for Cold Dark Matter (CDM) faces a stringent laboratory absence of any new particle signature (Aprile et al., 2018; Collaboration, 2020) and several inconsistencies have emerged between CDM predictions and the properties of dwarf galaxies (Moore, 1994; de Blok, 2010; Marsh & Pop, 2015; Klypin et al., 1999; Safarzadeh & Loeb, 2021). Warm Dark Matter (WDM) is defined to be relativistic initially with a keV-scale mass that is sufficiently redshifted to become non-relativistic before galaxy formation, generating smooth cores and suppressing formation of low-mass galaxies. Alternatively, for very light bosons of , an inherently non-relativistic possibility of dark matter as a Bose-Einstein condensation (Widrow & Kaiser, 1993; Hu et al., 2000), originally termed Fuzzy Dark Matter (FDM), has been emerged by the first simulations in this context, which predict prominent solitonic standing wave cores surrounded by pervasive interference on the de Broglie wavelength scale within all galaxies and filaments (Schive et al., 2014a; Mocz et al., 2017; Veltmaat et al., 2018; Hui, 2020). This was then termed as ‘Wave Dark Matter’, DM, (Schive et al., 2014a; Hui et al., 2021). While DM predicts almost identical large-scale structure to CDM in terms of the network of filaments and clusters (Schive et al., 2014a; Mocz et al., 2017), the small-scale structure of DM halos is very different in DM paradigm, as DM cannot be confined to less than the de Broglie scale. Consequently, in DM, with a light boson mass of , the dwarf galaxy formation is suppressed and there is also a prominent solitonic core (Schive et al., 2014a, b; Mocz et al., 2017; Veltmaat et al., 2018; Niemeyer, 2020) in the galaxy.
On these scales, self-gravity balances the effective pressure from the Uncertainty Principle in the ground state at the de Broglie wavelength. Crucially, smaller galaxies are predicted to have wider cores of lower density because the soliton is larger at lower momentum, which we test here.
Many independent claims of dark matter and stellar cores in deep images and spectroscopy are now available for the well-studied, Local Group dwarf spheroidal galaxies, dSph, providing one of the main sources of tension for CDM for which the lack of any predicted cores reflects the scale-free nature of simplest, collisionless DM scenario. More recently the presence of extended stellar halos has been uncovered in several local dwarfs, independently, with deep imaging and spectroscopy (Chiti et al., 2021; Collins et al., 2021). A joint analysis of the available data now suggests that such a core-halo structure with a sharp density transition between the core and the halo is a common feature of both dSph galaxies and also the smaller new class of UFG (Ultra faint galaxies) (Pozo et al., 2020, 2023). This core-halo behaviour motivates the examination of hydrodynamical simulations with a comparison of the differing DM contenders as a possible distinguishing feature.
For cold dark matter (CDM), the scale-free formation of DM structures is predicted to extend to arbitrarily small scales, reaching lower halo masses with higher DM concentrations. In contrast, small-scale suppression of the power spectrum is inherent to both DM and WDM. In the case of DM, this suppression limits the minimum scale of structure to below the de Broglie length, which is determined by the boson mass. Consequently, DM structures below are suppressed for a choice of boson masses of eV, motivated by the observed kpc scale of dwarf galaxy cores. This limitation has a direct consequence for the formation timescales between CDM and DM, resulting in a delay in galaxy formation for DM compared to CDM. In both cases, we observe that the formation of the first "filamentary" structures occurs earlier in CDM, where they are comprised of low-mass subhaloes. In contrast, in DM/WDM, there is no fragmentation along the filaments due to the small-scale cutoff of the power spectrum. Instead, dark matter is distributed more continuously along these filaments.
The main difference between warm dark matter (WDM) and DM is that WDM exhibits a clear caustic structure in the distribution of dark matter, while DM is characterized by wave interference patterns that manifest as fringes in simulations. These fringes are now understood to generate turbulent density structures within halos, resulting from the superposition of numerous plane waves encoding the velocity dispersion in the halo (Mocz et al., 2020). In DM, these filaments persist for longer periods, as the gravitational attraction from the early formation of the first halos in cold dark matter (CDM) tends to disrupt them earlier. Moreover, the prolonged lifetimes of these filaments in wave dark matter favor the formation of a greater number of stars within them, leading to significant differences in the location and extent of stellar profiles in CDM and DM galaxies. This also causes baryonic objects to appear more diffuse or smoothed compared to CDM (Mocz et al., 2019, 2020), indicating that they could serve as excellent tracers of dark matter in DM. On the scale of solitons, the quantum pressure in DM can become sufficiently strong to counteract the self-gravity of the dark matter. This results in the formation of prominent solitonic standing waves at the base of each virialized potential, characterized by a spherical soliton core of a few kiloparsecs at the center of every dark matter halo (Schive et al., 2014a), in contrast to the much denser cusps observed in CDM (Navarro & Frenk, 1996) and WDM (Mocz et al., 2019).
In dSph galaxies it is known that stellar motions are dominated by the dark matter gravitational potential and so we expect some visible differences for stars in these galaxies depending on the nature of dark matter. In addition, the formation and early evolution of galaxies and filaments will also be sensitive to the nature of DM, arising in particular from the suppressed form of the high-k power spectrum for the WDM/DM models. The wave behaviour and the quantum pressure of DM provide different virialized DM halo structures and prominent soliton cores, unlike the smooth cores of WDM. While for CDM and WDM cuspy profiles are expected (Navarro & Frenk, 1996; Lovell et al., 2014), DM simulations of merging DM haloes clearly show the formation of soliton structures at the de Broglie wavelength scale (Schive et al., 2014a; Mocz et al., 2017; Schwabe et al., 2016), and are prominent in terms of the core density, standing above the surrounding DM halo. This is in contrast to the early fragmentation of filaments and cuspy haloes in CDM (Mocz et al., 2017, 2019, 2020). Mocz et al. (2019, 2020) demonstrated that baryonic feedback does not have a significant effect in halos of to for redshifts , in the sense of being unable to soften the cuspy profiles of CDM/WDM to produce cores. Consequently, neither CDM/WDM are able to explain the origin of the claimed cores from the dynamical studies of dSph galaxies (Read & Gilmore, 2005; Amorisco et al., 2013).
In this paper we compare the galaxy formation process between CDM, WDM, and DM, in the high-resolution cosmological simulations by Mocz et al. (2019, 2020, 2017). Here, we will consider the distribution of stars modelled in these simulations, where in the WDM and DM contexts these simulations have already reported stars to be born along dense dark matter filaments, tracing dark matter, and highlighted as “a smoking gun” signature of DM (Mocz et al., 2019). Here we will further examine these lowest redshifts, focusing on the question of core-halo structure for comparison with new deep imaging and spectroscopic data for the Milky Way and other local group dwarfs. For these objects, the data now indicates non-smooth profiles in these dark matter-dominated dwarfs as this stellar structure may potentially have important implications for the nature of dark matter. Moreover, we will look into the different evolution of the stellar populations and the impact of the three DM models on their spatial distribution.
The structure of this paper is as follows: firstly, in sections 2 and 3, we describe the radial structure and internal dynamics of the DM halo for comparison with the data. Next, in section 4, we present the simulation setup. In section 5, we focus on presenting all the results of the work, with particular emphasis on the main finding related to the detection of the core-halo structure. Finally, in section 6, we discuss our conclusions regarding the non-detection of the core-halo structure for CDM and its implications.
2 The Wave Dark Matter Halo
Ultralight bosons, such as Axions, have been considered as an ingredient in describing the DM (Widrow & Kaiser, 1993; Hu et al., 2000). In the absence of any self-interactions, the boson mass is the only free parameter that describes the DM. For a sufficiently light boson mass, the de-Broglie wavelength exceeds the mean free path leading the Axion to satisfy the ground state condition for a Bose-Einstein condensation. In the comoving coordinate, the governing equation for Axion reads as:
| (1) | |||
| (2) |
where is the wave function, is the gravitation potential and (1/(1+z)) is the cosmological scale factor. The system is normalized to the time scale , and to the scale length , with , where is the current density parameter (Widrow & Kaiser, 1993).
Recently, it has proved possible with advanced GPU computing to make reliable, high dynamic range cosmological simulations that solve the above equations, (Schive et al., 2014a; Schwabe et al., 2016; Mocz et al., 2017; May & Springel, 2021). These evolve to produce large-scale structures indistinguishable from CDM, but with virialized halos characterized by a solitonic core in the ground state that naturally explains the dark matter-dominated cores of dSph galaxies (Schive et al., 2014b). Another important feature arising from the simulations is that the central soliton is surrounded by an extended halo with a “granular” texture on the de-Broglie scale, due to interference of excited states, but which when azimuthally averaged follows the Navarro-Frenk-White (NFW) density profile (Navarro & Frenk, 1996; Woo & Chiueh, 2009; Schive et al., 2014a, b).
The fitting formula for the density profile of the solitonic core in a DM halo is obtained from cosmological simulations (Schive et al., 2014a, b) as:
| (3) |
where is the boson mass and is the solitonic core radius. The latter scales with the product of the galaxy mass and boson mass, obeying the following scaling relation which has been derived from simulations (Schive et al., 2014b):
| (4) |
Beyond the soliton, at radii larger than a transition radius (), the simulations also reveal that the halo roughly looks like NFW in shape, presumably reflecting the non-relativistic nature of condensates beyond the de Broglie scale, and therefore the total density profile can be written as:
| (5) |
In detail, the scale radius of the solitonic solution, which represents the ground state of the Schrodinger-Poisson equation, is related to the size of the halo through the uncertainty principle. From cosmological simulations, the latter is found to hold non-locally, relating a local property with a global one (for more details we refer to Schive et al. (2014b)).
3 Dynamical Model of Galaxies in Wave Dark Matter Halo
Classical dSph galaxies are known to be dominated by DM with stars being treated as the tracer particles (Gregory et al., 2019; McConnachie & Irwin, 2006; McConnachie et al., 2006; Kang & Ricotti, 2019) moving along the gravitational potential generated by the DM halo.
In this context, the corresponding velocity dispersion profile can be estimated by solving the spherically symmetric Jeans equation:
| (6) |
where is the DM halo mass obtained by integrating the spherically symmetric density profile in Eq. (5), is the anisotropy parameter (see (Binney & Tremaine, 2008), Equation (4.61)), and is the stellar density profile as given by:
| (7) |
where
| (8) |
Here, is the 3D scale radius of the stellar halo corresponding to the central stellar density, is the normalization of at the transition radius and the transition radius, , is the point where the solitonic structure ends and the halo begins at the juncture of the core and halo profiles.
4 Simulation setup
Throughout this manuscript, we extensively make use of the most recent simulations of DM of Mocz et al. (2019, 2020). These simulations adopt a simulation box of and a boson mass of and starts from an initial redshift of evolving to a final redshift of (5.56 for DM). The initial conditions are generated using the publicly available Boltzmann code AXION-CAMB. The selection of the final redshift is driven by the need for a resolution to achieve fully converged results. The DM spatial resolution is set at , accompanied by a baryonic resolution of . The cosmological parameters correspond to the Planck results.
The primary objective is to conduct a thorough comparative analysis of the stellar properties between the DM simulations and the ones stemming from both CDM and WDM simulations, spanning an extended duration down to . In the case of the WDM simulations, a particle resolution of was utilized, employing the identical hydrodynamical setup as the DM simulations. It is noteworthy that while the CDM simulation lacks any form of cutoff in its power spectrum, both the DM and WDM simulations adopt an initial power spectrum characterized by exponential suppression.
Baryons (gas and star formation) are included in the simulation, and couple to the dark matter gravitationally. The baryonic material experiences primordial and metal-line cooling, chemical enrichment, stochastic star formation with a density threshold of , supernova feedback via kinetic winds, and instantaneous uniform reionization at (Vogelsberger et al., 2013; Torrey et al., 2014; Pillepich et al., 2017; Springel et al., 2018), as has been used in the Illustris and Illustris-TNG projects. The stellar feedback model has previously been tuned to match key observables with CDM simulations (Vogelsberger et al., 2013). Whether FDM requires significant re-tuning of efficiency factors is left for future study. The subgrid model for feedback is meant to describe the effects of Type II supernovae (SNII), and uses the local star formation rate to set the mass loading of stellar winds driven by the energy available through SNII (Vogelsberger et al., 2013; Pillepich et al., 2018). The simulation also keeps track of metallicty, as described in Torrey et al. (2019). Star particles (representing a population of stars) are born with the metallicity of their surrounding interstellar gas. As star particles evolve in time, mass and metals from the aging stellar populations are returned to the interstellar medium, taking into account SN1a and SNII supernovae and AGB stars. Deposited metals in the gas evolve through passive advection with the fluid flow.
5 results
5.1 First Illustration of density profiles
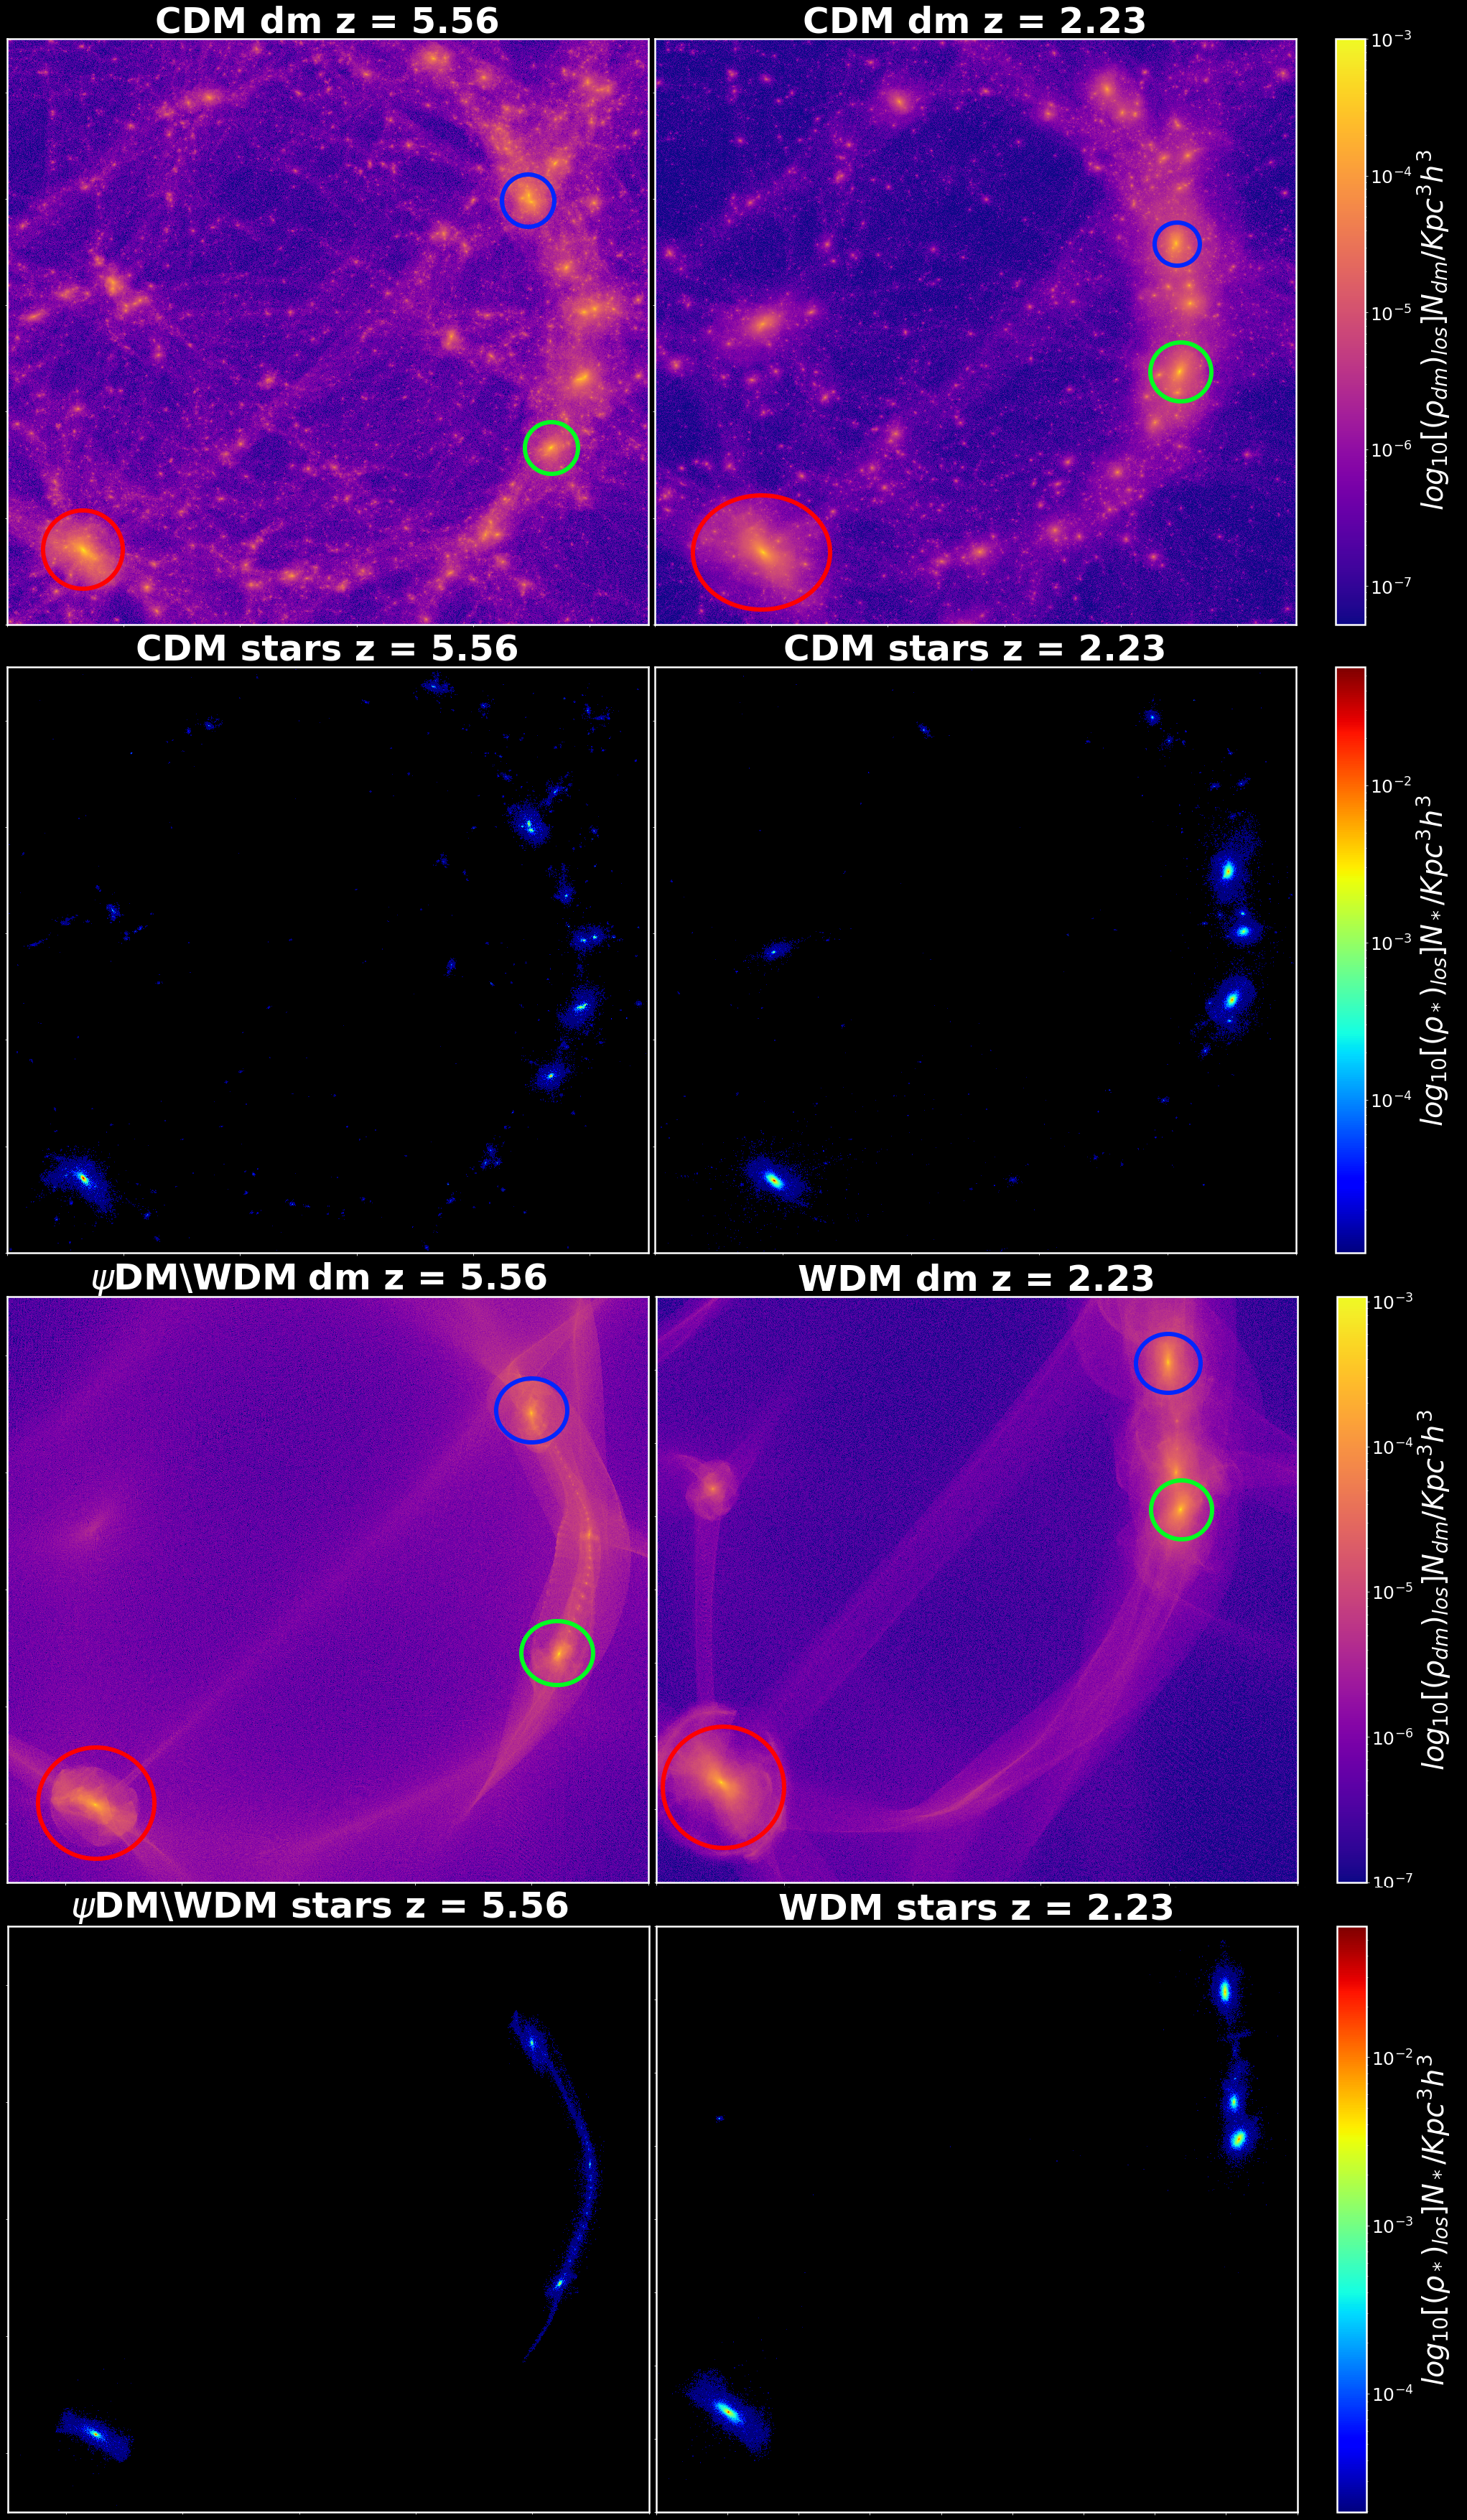
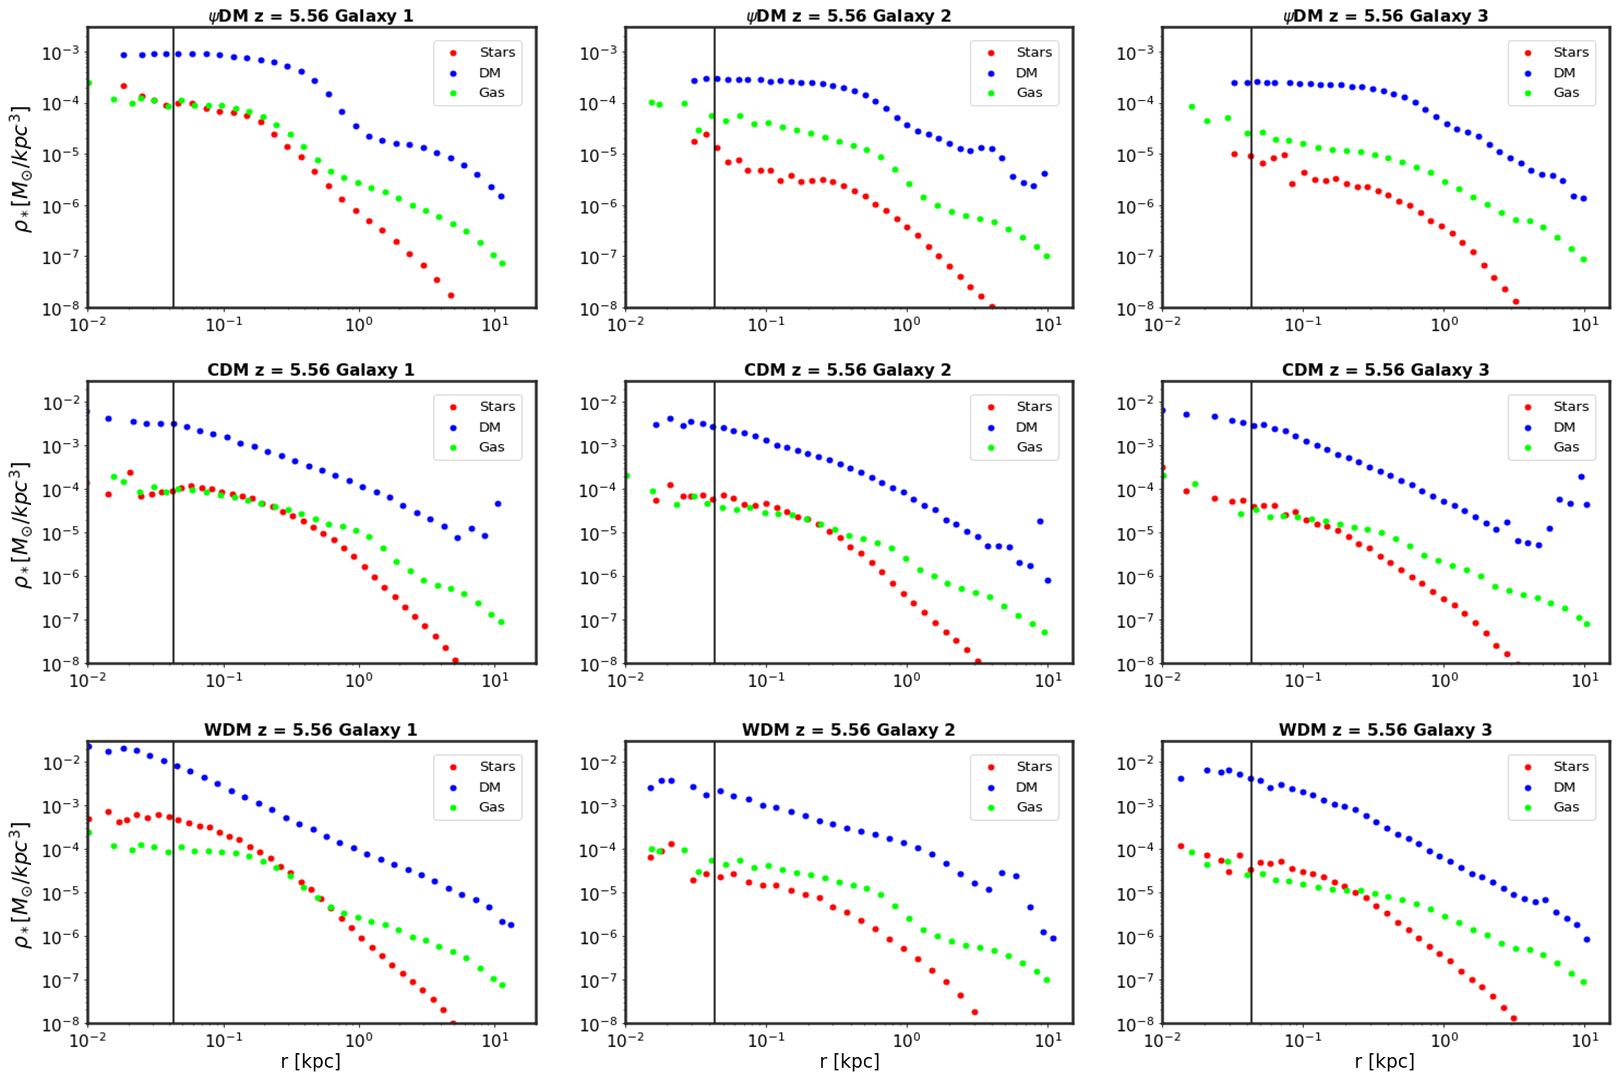
Before delving into the intricacies of comparing various simulation types, we provide an initial depiction of the projected density profiles for CDM, WDM, and DM at two different redshifts. In Figure 1, we present the projected density profiles for both DM and stars. The first two rows illustrate CDM profiles, while the last two rows depict the corresponding profiles for WDM/DM. In each row, the left(right) panel presents (). Mocz et al. (2019) showed that WDM and DM exhibit remarkably similar evolutionary patterns across various redshifts, implying a resemblance in the development of large-scale structures. This stands in contrast to CDM. Consequently, in Figure 1 we exclusively focus on presenting the WDM results.
Figure 1 suggests slight discrepancies between galaxies in these three distinct DM scenarios. First, in the context of CDM, filaments rapidly collapse into compact halos, whereas in the case of DM, these filaments retain a smoother configuration without giving rise to small galaxies. Second, in the CDM scenario, stars seem to exhibit greater concentration with irregular structures. Conversely, in the case of DM and WDM, a flatter shape is evident, accompanied by galaxies possessing extended stellar halos. This imparts a visual impression that stars are positioned farther away from the center. As we consider individual stellar profiles of galaxies across distinct DM scenarios, a notable finding emerges. In the DM scenario, the stellar profiles exhibit a flatter behaviour in the inner regions, in alignment with the expected pattern of stars tracing the presence of a soliton in the core. In contrast, both WDM and CDM scenarios lack such a soliton, resulting in a cuspy inner profile for these scenarios. While the primary focus of this study lies in the comparison of evolved cosmological structures between DM and CDM, it is reasonable to anticipate that the large-scale structures in WDM would bear similarities to DM. As illustrated in Mocz et al. (2019), the resulting structures are remarkably akin for WDM and DM at z=5.56, despite the more pronounced differences in their internal halo structures.
5.2 Core-halo structure
Below, we explore the presence of core-halo structures across various galaxies.
5.2.1 Signature of the core-halo structure
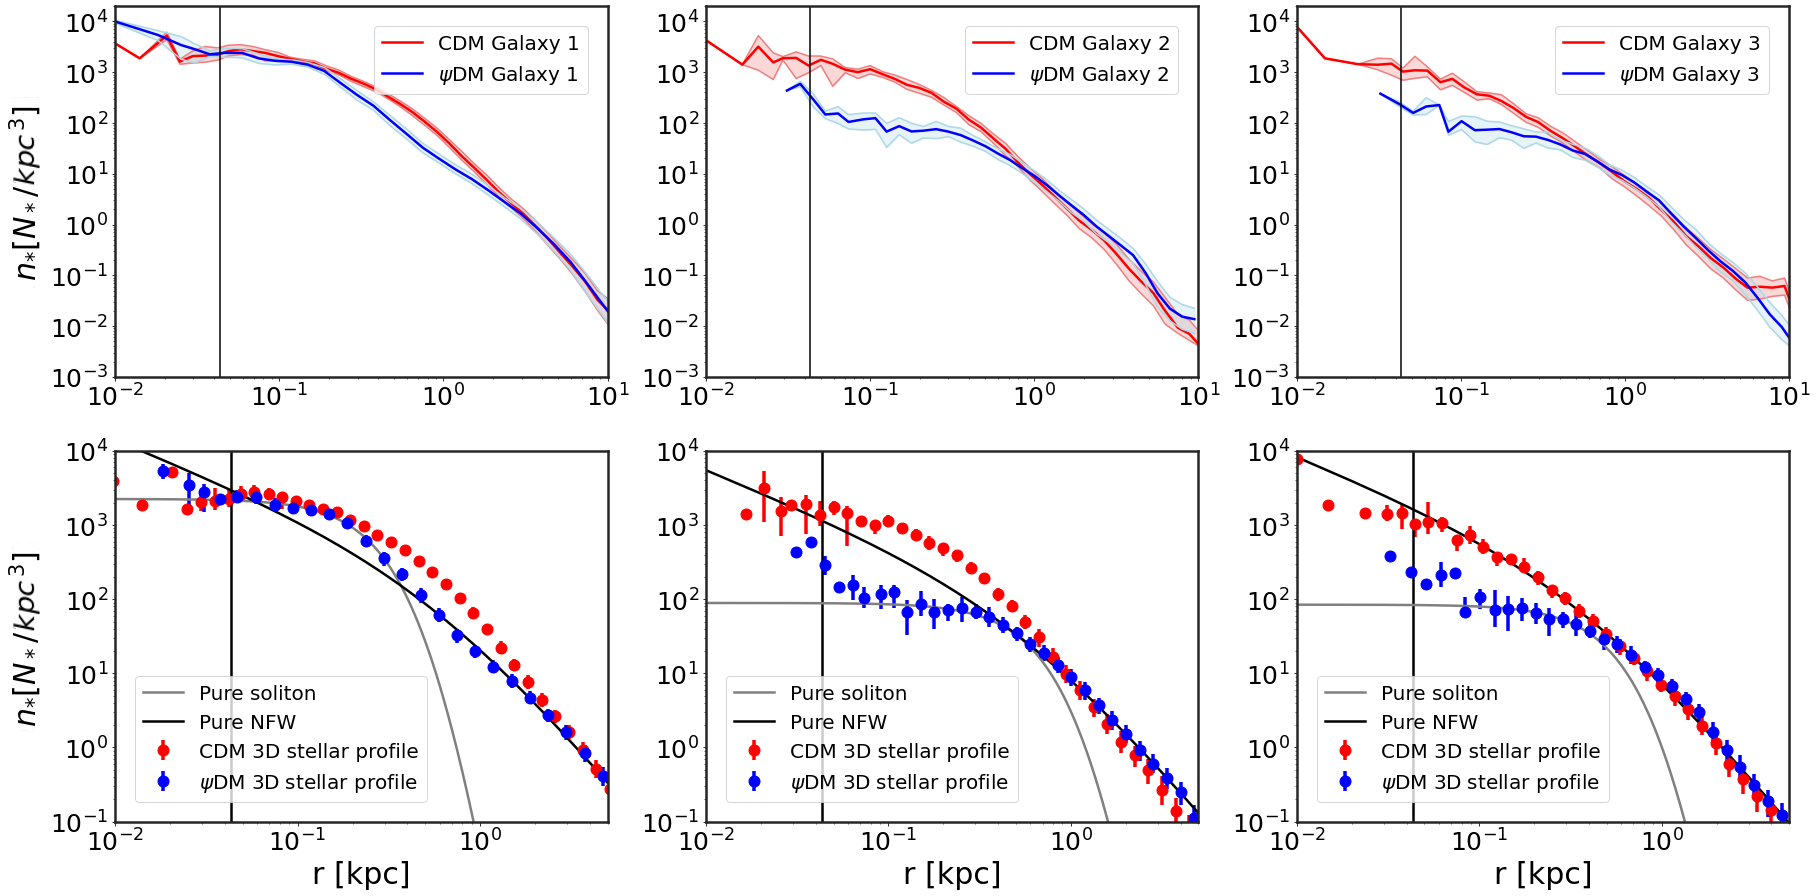
We start off with comparing the stellar profiles at . Figure 2 compares the stellar density profiles of the three main galaxies in the DM model at with those of the CDM model. Moving from left to right, we present the first, second, and third galaxy, respectively, as was previously pointed out in Figure 1. In the first row, a notable difference is seen between the stellar profiles in the DM scenario and CDM. This highlights how stellar profiles can vary and evolve differently in distinct DM scenarios, suggesting they could serve as a valuable tool for analyzing DM signatures in dwarf galaxies. The second row provides a closer look at the inner part of the galaxy and offers a clear test to assess the compatibility of the profiles with a core-halo structure. To this end, we plot the ideal solitonic and NFW profiles that would correspond to the inner core and the characteristic asymptotic profile, respectively. It is worth noting that only in the case of DMG1 do the NFW and solitonic profiles intersect while still fitting the stellar profile. This is never a possibility for any CDM galaxy. This result may indicate the potential presence of a primordial core-halo stellar structure. There is also a noticeable difference in the inner profile for galaxies two and three, which aligns with the presence or absence of a soliton, resulting in a core-cuspy disagreement. Furthermore, in the case of galaxy three, where both DM and CDM exhibit a similar halo with the same slope, we can observe how the NFW profile effectively fits the entire CDM stellar profile. This is a consequence of the anticipated cusp, whereas a soliton is required for DM to establish its flat inner profile. The reason why both stellar profiles appear to coincide with a flat core for galaxy one in the inner part could be attributed to the widely suggested notion that baryonic feedback may lead to the development of a core, even in the CDM scenario (Chan et al., 2015; Pontzen & Governato, 2012). This is more plausible at this redshift for G1 than for G2 and G3, given its greater mass as the inner slope of the DM halo profiles shows a strong mass dependence (Chan et al., 2015). It is likely the same reason why the core-halo structure had sufficient time to form only in this galaxy. The vertical line in the figure represents the comoving softening length, which is 0.19 kpc in this case. Below this radius, cautious must be taken in interpreting the data.
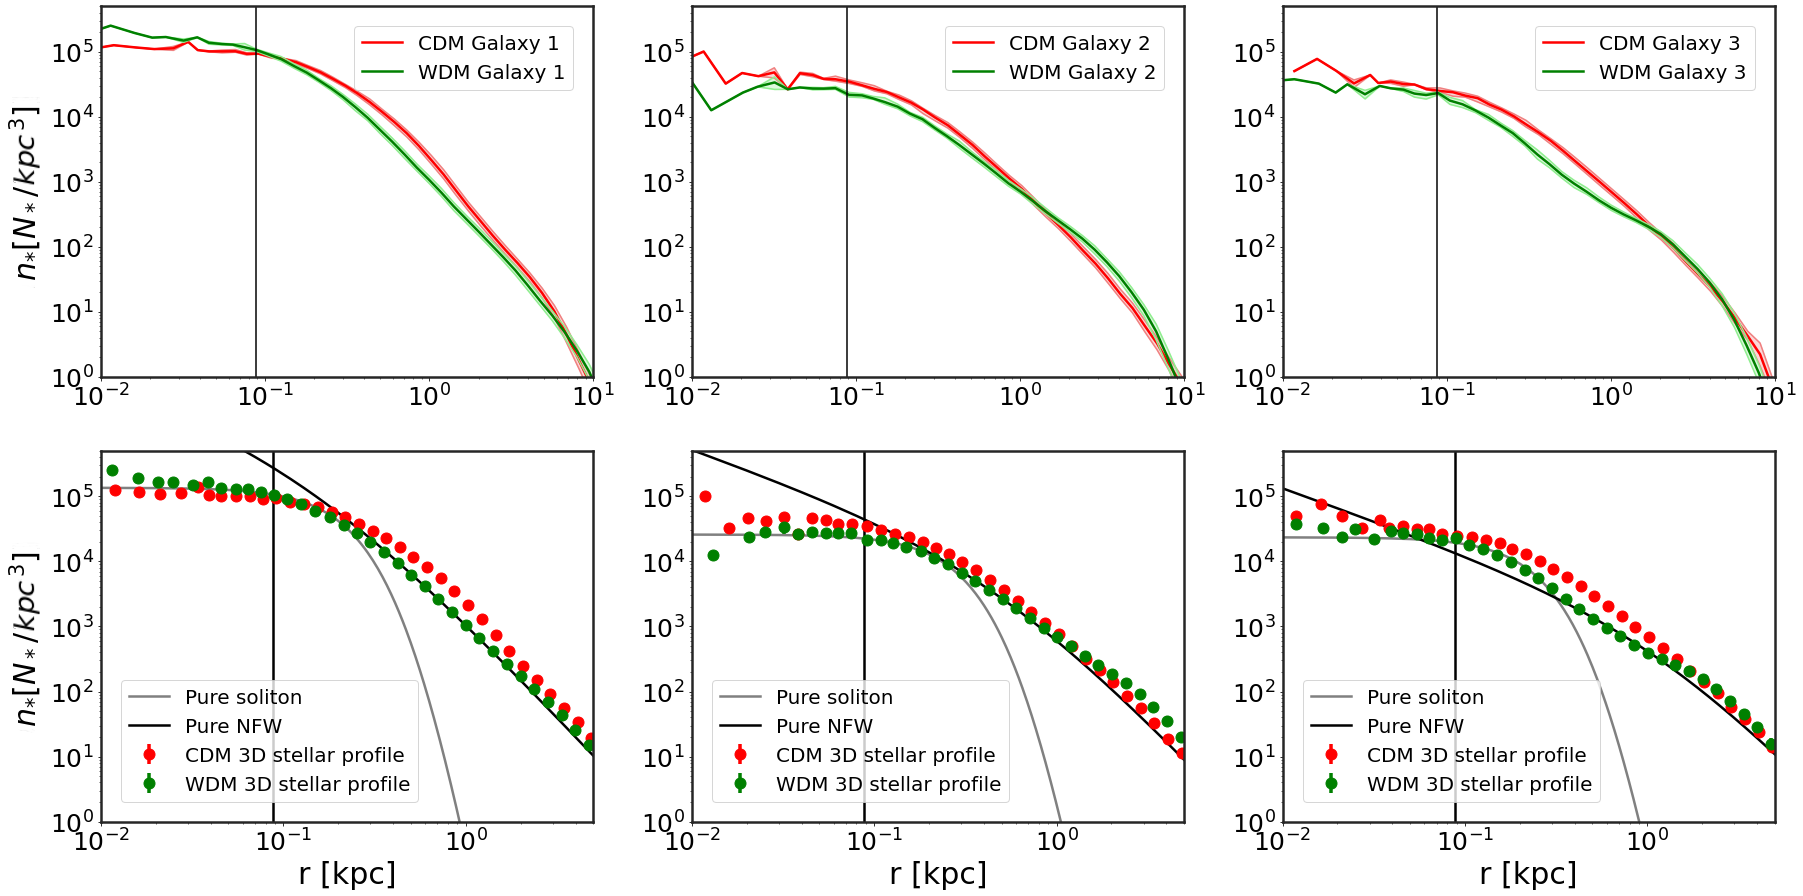
Next, we proceed with comparing the stellar profiles at between the WDM and CDM simulations, following the approach outlined in the previous section. It is worth noting that there was no available data at this redshift for DM. Despite the significant differences between WDM and DM on small scales where the core-halo structure is anticipated, their similar large-scale evolution and initial conditions could make the comparison between WDM and CDM valuable for future studies. The resulting extracted stellar profiles, shown in Figure 3, seem to reaffirm the same findings as the previous redshift for CDM. In CDM, there is no evidence or imprint of a core-halo structure identified in the halos of the three simulated galaxies. In contrast, one WDM halo exhibits a potentially compatible core-halo stellar profile, particularly in a primordial context, suggesting that they may still be in the process of forming for galaxies one and two. Furthermore, a well-defined core-halo structure is evident for the third galaxy, characterized by a notable density drop from the core to the halo, along with the distinctive change of regime point (transition point, ) marking the boundary between the inner core and the outer halo (as depicted in the lower panels of Figure 3). This is observable where the pure NFW and solitonic profiles intersect. It is interesting to observe that for WDM, the core-halo structure emerges earlier in a lower mass galaxy, such as galaxy three, in comparison to the more massive galaxy one. This structure should be established by a more pronounced core, likely a combination of a dense soliton and potentially baryonic feedback, both more prominent in heavier galaxies. Nevertheless, it is crucial to remember that WDM lacks a solitonic core. Indeed, the presence of a core-halo structure remains a topic for future analysis.
5.2.2 Stellar, dark matter and gas distribution
Here we compare distinct distributions of stellar, gaseous, and dark matter profiles in all three different simulated galaxies across different DM scenarios. The aim is to extend the former comparison made only for the stellar profiles, done in Figure 2 and 3, to further include the DM and gaseous distributions as well. Figure 4 presents these profiles at . Once again, the stark contrast between the stellar and DM profiles in each case is evident, with gas profiles exhibiting a more consistent pattern across different DM models. Notably, a common feature is the presence of a core-halo transition in the DM profile from DM and gas profiles, even if it is only visibly prominent in the case of stars in G1. In comparison with DM, WDM and CDM exhibit strikingly similar cuspy stellar and DM profiles, while the gas profile resembles that of the DM case. From the plot, it is inferred that in DM model both of the stellar and gaseous profiles demonstrate similar core radii and transition points compared with the DM profile. This suggests that stars, rather than gas, may hold the key to determine the underlying DM model. Another crucial observation is the nearly identical core size and transition point in stars and gas, closely mirroring that reproduced by the DM particles. This implies a potential baryonic-dark matter connection and hints at the possibility of baryonic tracking of dark matter particles (Pozo et al., 2021; Pozo et al., 2022; Pozo et al., 2020, 2023).
| Combinations | ||||
| (kpc) | (kpc) | eV | ||
| DMG1 | 5.56 | |||
| WDMG3 | 2.23 | |||
| dSphBoth | 0 | |||
| dSph | 0 | |||
| dSphAndromeda | 0 | |||
| Draco | 0 | - | ||
| Leo II | 0 | - | ||
| Sculptor | 0 | - | ||
| And IX | 0 | - | ||
| And XV | 0 | - |
| Halos | ||||
| kpc | kpc | |||
| DMG1 | 8.3 | - | 52 | - |
| DMG2 | 5.5 | - | 45 | - |
| DMG3 | 5.9 | - | 46 | - |
| CDMG1 | 17 | 39.5 | 65 | 83 |
| CDMG2 | 4.5 | 26.8 | 42 | 73 |
| CDMG3 | 8.3 | 26.8 | 52 | 73 |
| WDMG1 | 13 | 35.5 | 60 | 80 |
| WDMG2 | 7.3 | 38.2 | 49 | 82 |
| WDMG3 | 6.9 | 24.8 | 48 | 70 |
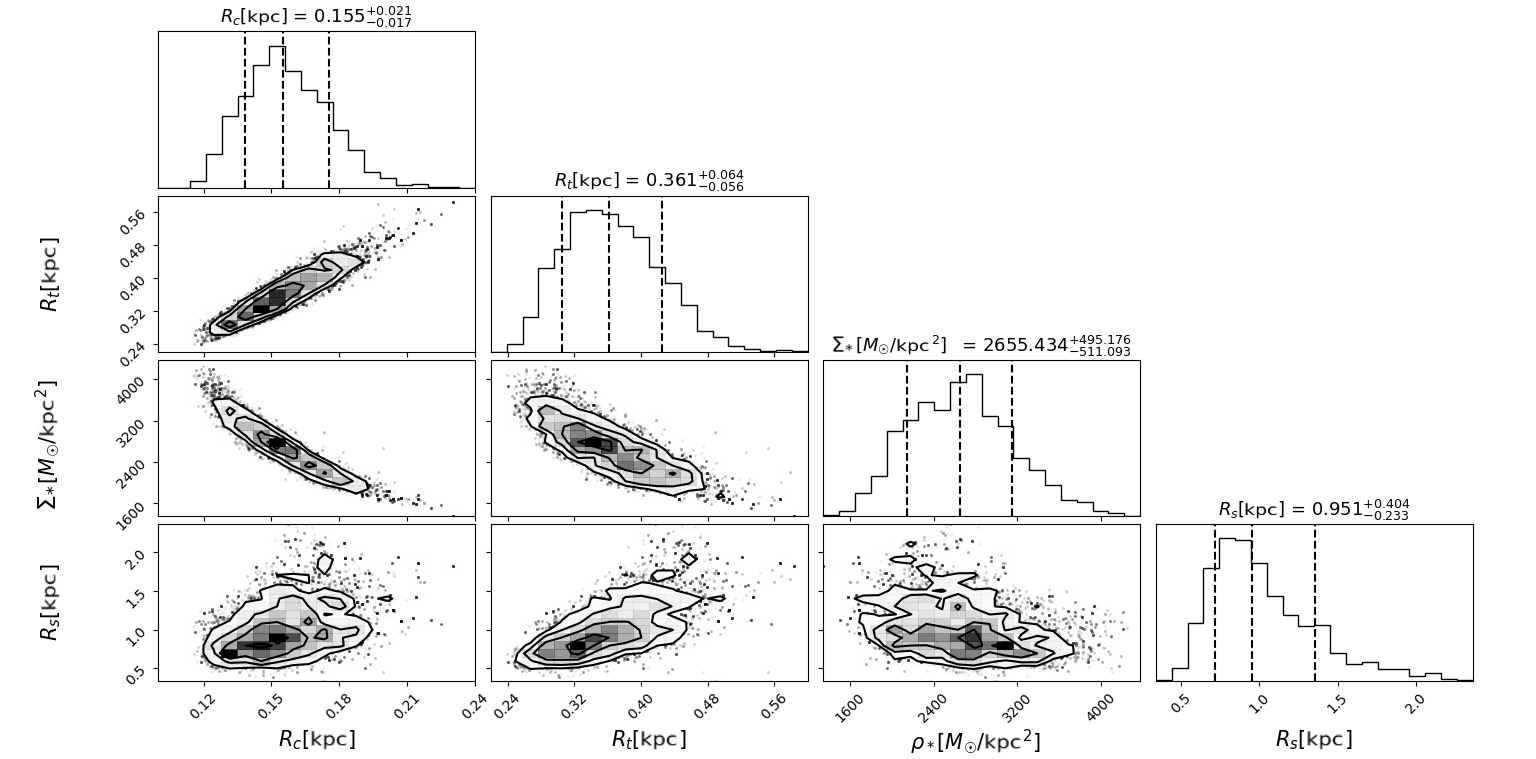
5.2.3 Estimation of the core-halo parameters
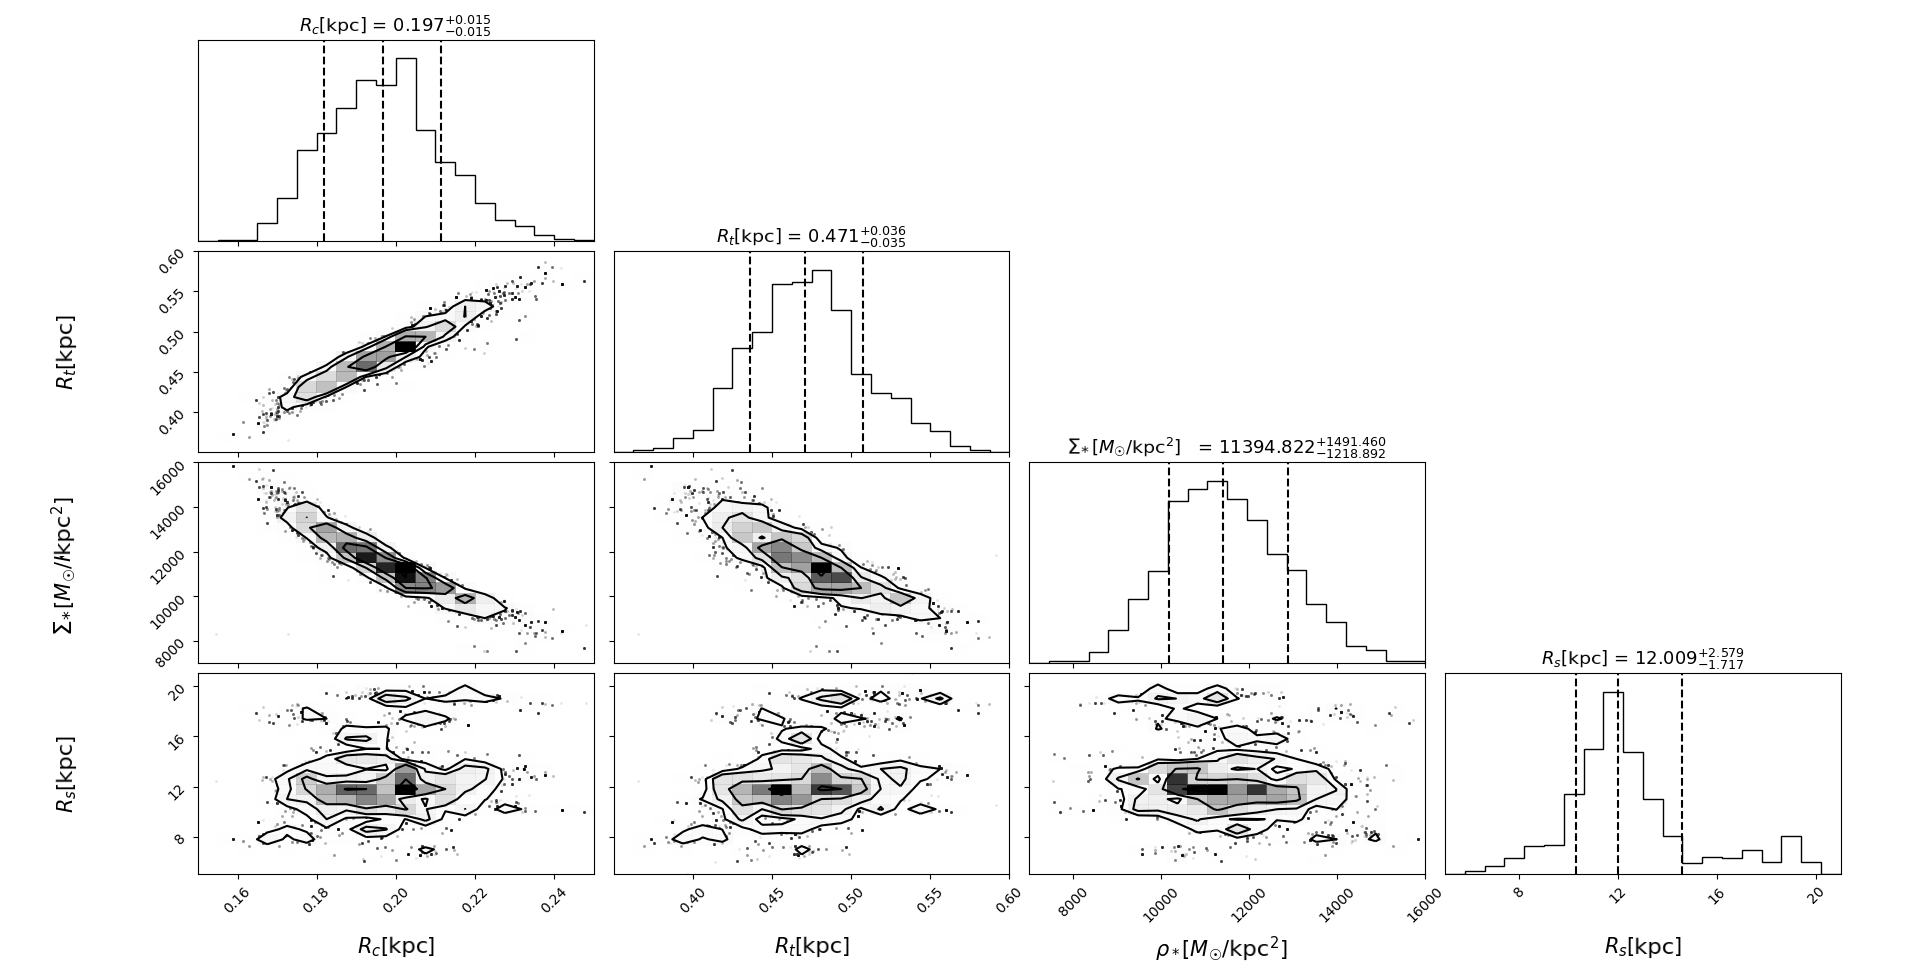
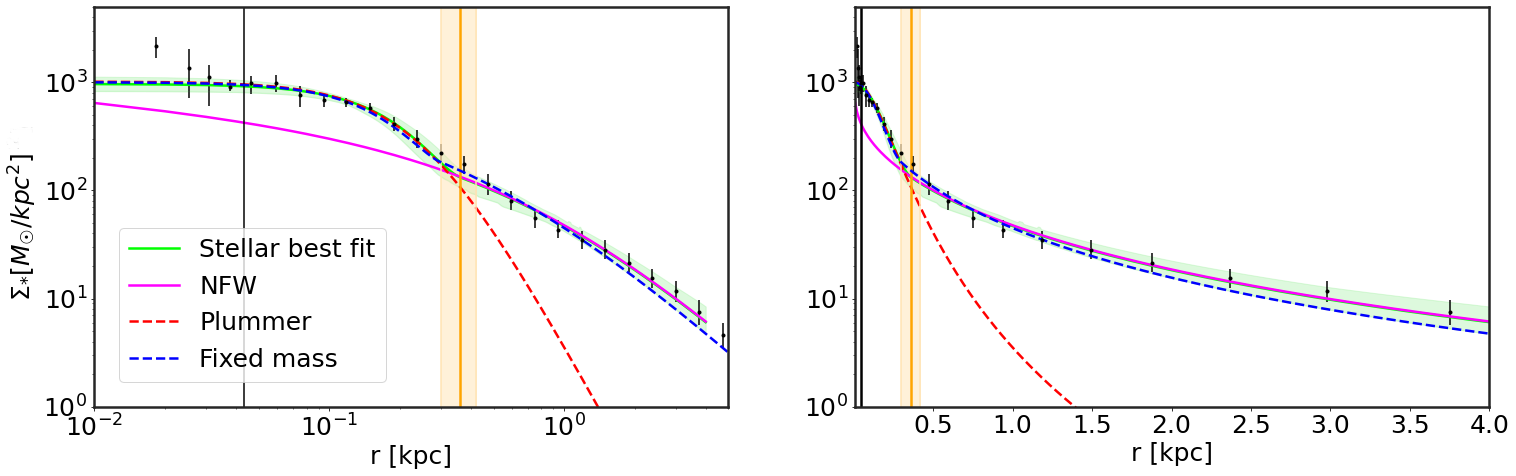
We now proceed with MCMC-based DM profile fits (Eq. (7)) to the DMG1, as shown in Figure 5 ( Corner plot Figure 14). The core radius (), as defined in Eq. (4), plays a crucial role in characterizing the shape of the solitonic core profile. For the halo, we utilize a NFW profile with a scale radius () and the normalization factor (). The transition radius (), defining the point of density transition between the soliton and NFW profiles, is the only other free parameter. We vary this within a prior range determined by DM simulations, specifically to times (Schive et al., 2014a, b). The boson mass stands as the sole fixed parameter, maintaining a value of eV, consistent with that used for the simulations (Mocz et al., 2020). The best-fit yields a resulting profile with a total mass of , aligning well with the computed mass from Mocz et al. (2020) of for this galaxy at this redshift. In Figure 5 the blue dashed line presents the resulting profile when we conduct the analysis with the fixed total mass of , which corresponds to the total mass of that specific simulated halo (indicated by a red circle in Figure 1) at this redshift. It is worth noting that while it may not match the accuracy of the green profile with a freely varying mass, it still demonstrates excellent agreement. Furthermore, the resulting values for kpc and kpc, fall within the expected range for such dSphs, and are very close to the directly inferred soliton radius from the simulation ( kpc (Pozo et al., 2020, 2023)). This concordance between the suggested soliton size based on stellar behaviour and the actual size of the simulated DM halo soliton may hold significant implications for our understanding of how stellar behaviour is influenced by dark matter.
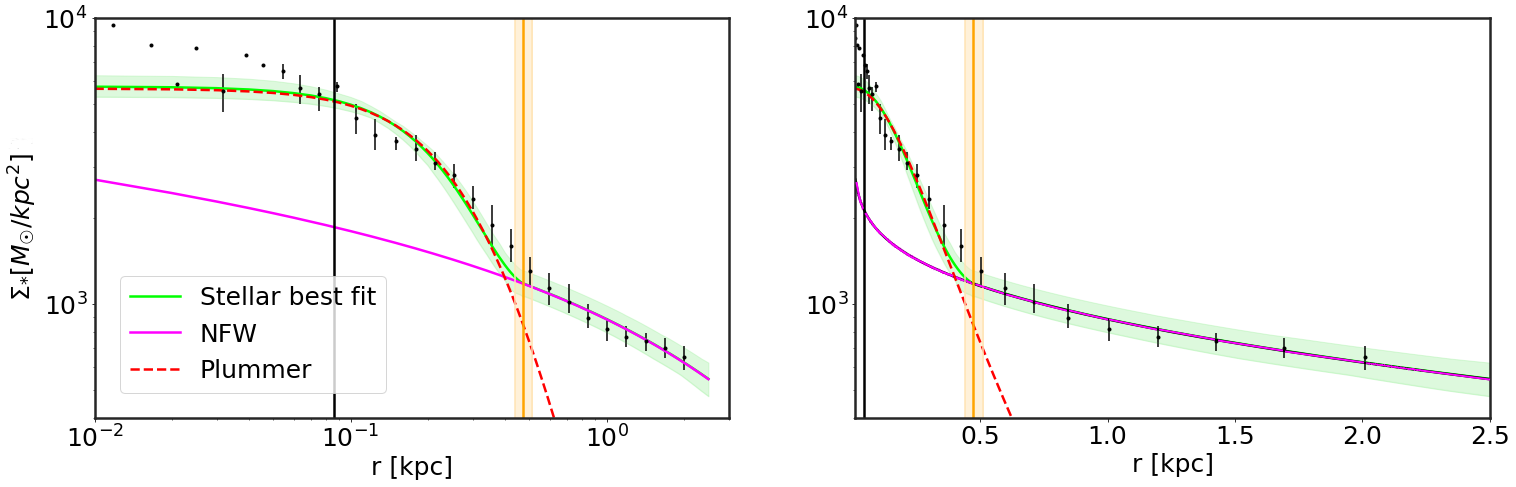
Next, we proceed with fitting a stellar core-halo profile for another case where a core-halo shape is evident: the WDM G3 at . It is crucial to note that in principle fitting a core-halo profile to WDM, without a physical soliton, might be challenging. In this sense, we are careful not to directly link the core-halo structure to a soliton but rather to an effective profile with a transition from the core to the halo in WDM at this lower redshift. The resulting values for core radius () as well as the transition point () are summarized in Table 1, alongside other pertinent variables, with the resulting profiles depicted in Figure 6 ( Corner plot Figure 15). It is noteworthy that these parameter values fall within the expected range when compared to those extracted from observed profiles of Local Group classical dSphs. This is particularly striking considering they were analyzed at different redshifts and are still in the process of the formation. Table 1 also provides the parameter values for the two extracted galaxies and the observed dSphs in the Local Group (Pozo et al., 2023). The core radius values are in excellent agreement with the mean values obtained for such dSphs in the Local Group.
The isolated galaxy (G1) from the DM simulation data (, Table 1) exhibits a core radius akin to that of two Milky Way satellite galaxies, Leo II and Sculptor. Conversely, the third galaxy from the WDM simulation data (WDM3, Table 1) aligns exceptionally well with the observed cores of Sculptor and And IX. Nonetheless, there are slight disparities in the transition point, which is reasonable given the difference in redshift and the fact that these simulated galaxies are still in the process of formation. The observed increase in between and WDM3 could be attributed to the lower redshift of WDM3, which aligns with the expectation of a larger . Notably, despite the significant redshift difference (almost 6 between the observed galaxies and the observable Local Group dwarfs), the values remain similar. This suggests that for a DM origin, the soliton is likely the first structure to form in this core-halo structure.
We have included the virial masses of all these three simulated galaxies at both redshifts in Table 2 to facilitate a clearer comparison of their evolution across different DM models. Additionally, this table serves as a useful tool for comparing the masses of G1 (isolated) with those in G2 and G3 within the filamentary structure, as depicted in Figure 1.
5.2.4 Comparison with observations
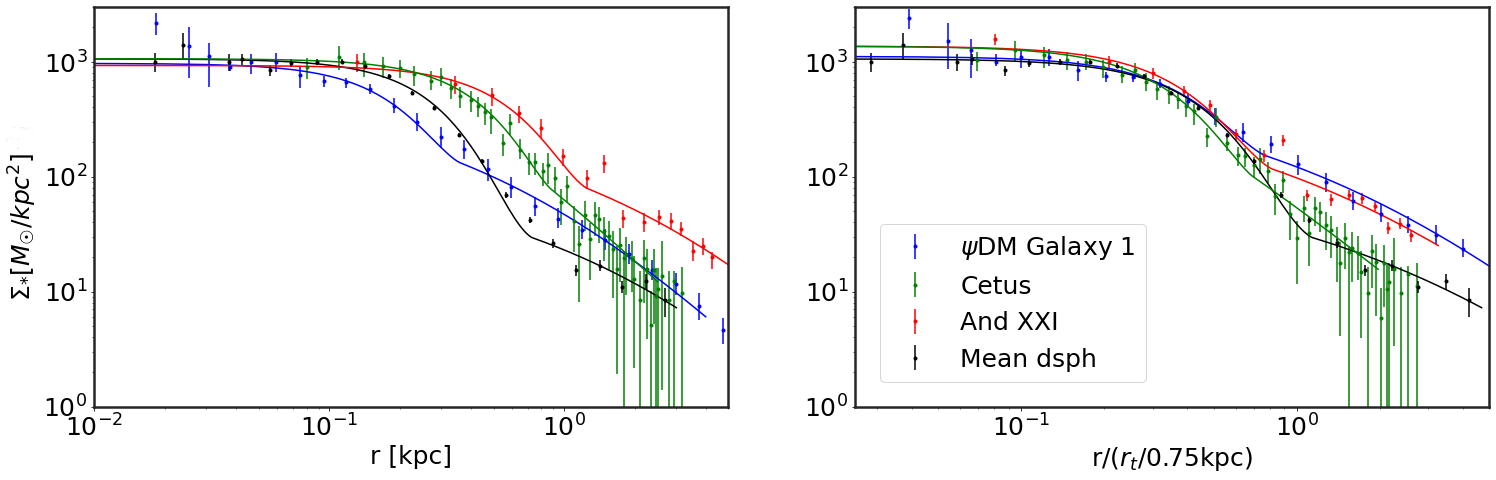
We proceed by comparing the extracted profile with two known dwarf galaxies, Cetus and Andromeda XXI, that orbit the Milky Way and Andromeda, respectively, and exhibit the most similar density gaps (See Figure 7). In the left panel, the profiles are normalized based on their stellar peak density, while the right panel is additionally normalized by their respective transition radii. The black profiles represent the mean stellar profile of all Local Group dwarf spheroidal galaxies (Pozo et al., 2023). The right panel demonstrates that the extracted DM stellar profile (blue profile) aligns well with a real observed stellar profile, Andromeda XXI (red profile). This indicates that the extracted profile can reproduce observed dSph structures, in contrast to the CDM profiles.
Furthermore, this panel reveals that the inner portions of the profiles are in good agreement, suggesting that they are consistent with a solitonic core. However, it’s crucial to note that Andromeda XXI and the extracted profile are at different redshifts, 5.5 and 0 respectively. This indicates that the extracted profile still has much more time to evolve, and its final core-halo structure at redshift 0 could substantially change over time.
| Halos | (-2<[Fe/H]<0) | (-4<[Fe/H]<-2) | (-6<[Fe/H]<-4) | (-8<[Fe/H]<-6) | |
|---|---|---|---|---|---|
| DMG1 | 12340 | 93.12 | 4.91 | 0.71 | 1.26 |
| DMG2 | 1950 | 80.62 | 14.82 | 1.44 | 3.12 |
| DMG3 | 1550 | 77.22 | 16.91 | 1.68 | 4.19 |
| CDMG1 | 21206 | 95.62 | 3.61 | 0.36 | 0.41 |
| CDMG2 | 7572 | 88.55 | 9.17 | 1.12 | 1.16 |
| CDMG3 | 3417 | 83.79 | 12.38 | 1.82 | 2.01 |
| WDMG1 | 28328 | 89.48 | 8.43 | 0.76 | 1.33 |
| WDMG2 | 3793 | 79.25 | 14.79 | 2.14 | 3.82 |
| WDMG3 | 5122 | 78.21 | 16.34 | 1.44 | 4.01 |
| Halos | ||||||||
| DMG1 | 12340 | 11.57 | 8.02 | 0.92 | 48.72 | 37.41 | 10.46 | 3.41 |
| DMG1 | 1950 | 5.66 | 2.82 | 0.16 | 72.10 | 16.41 | 7.23 | 4.26 |
| DMG1 | 1550 | 5.10 | 2.89 | 0.15 | 64.45 | 27.36 | 8.19 | 0 |
| CDMG1 | 21206 | 13.21 | 5.58 | 0.74 | 48.60 | 37.27 | 7.75 | 6.38 |
| CDMG2 | 7572 | 24.57 | 8.24 | 2.02 | 29.32 | 30.78 | 14.05 | 25.85 |
| CDMG3 | 3417 | 7.99 | 10.87 | 0.87 | 35.91 | 24.00 | 9.51 | 30.58 |
| WDMG1 | 28328 | 24.56 | 13.75 | 3.37 | 38.04 | 36.55 | 12.05 | 13.36 |
| WDMG2 | 3793 | 10.18 | 6.14 | 0.63 | 63.88 | 20.43 | 6.52 | 9.17 |
| WDMG3 | 5122 | 16.08 | 9.31 | 1.50 | 49.57 | 38.54 | 11.21 | 0.68 |
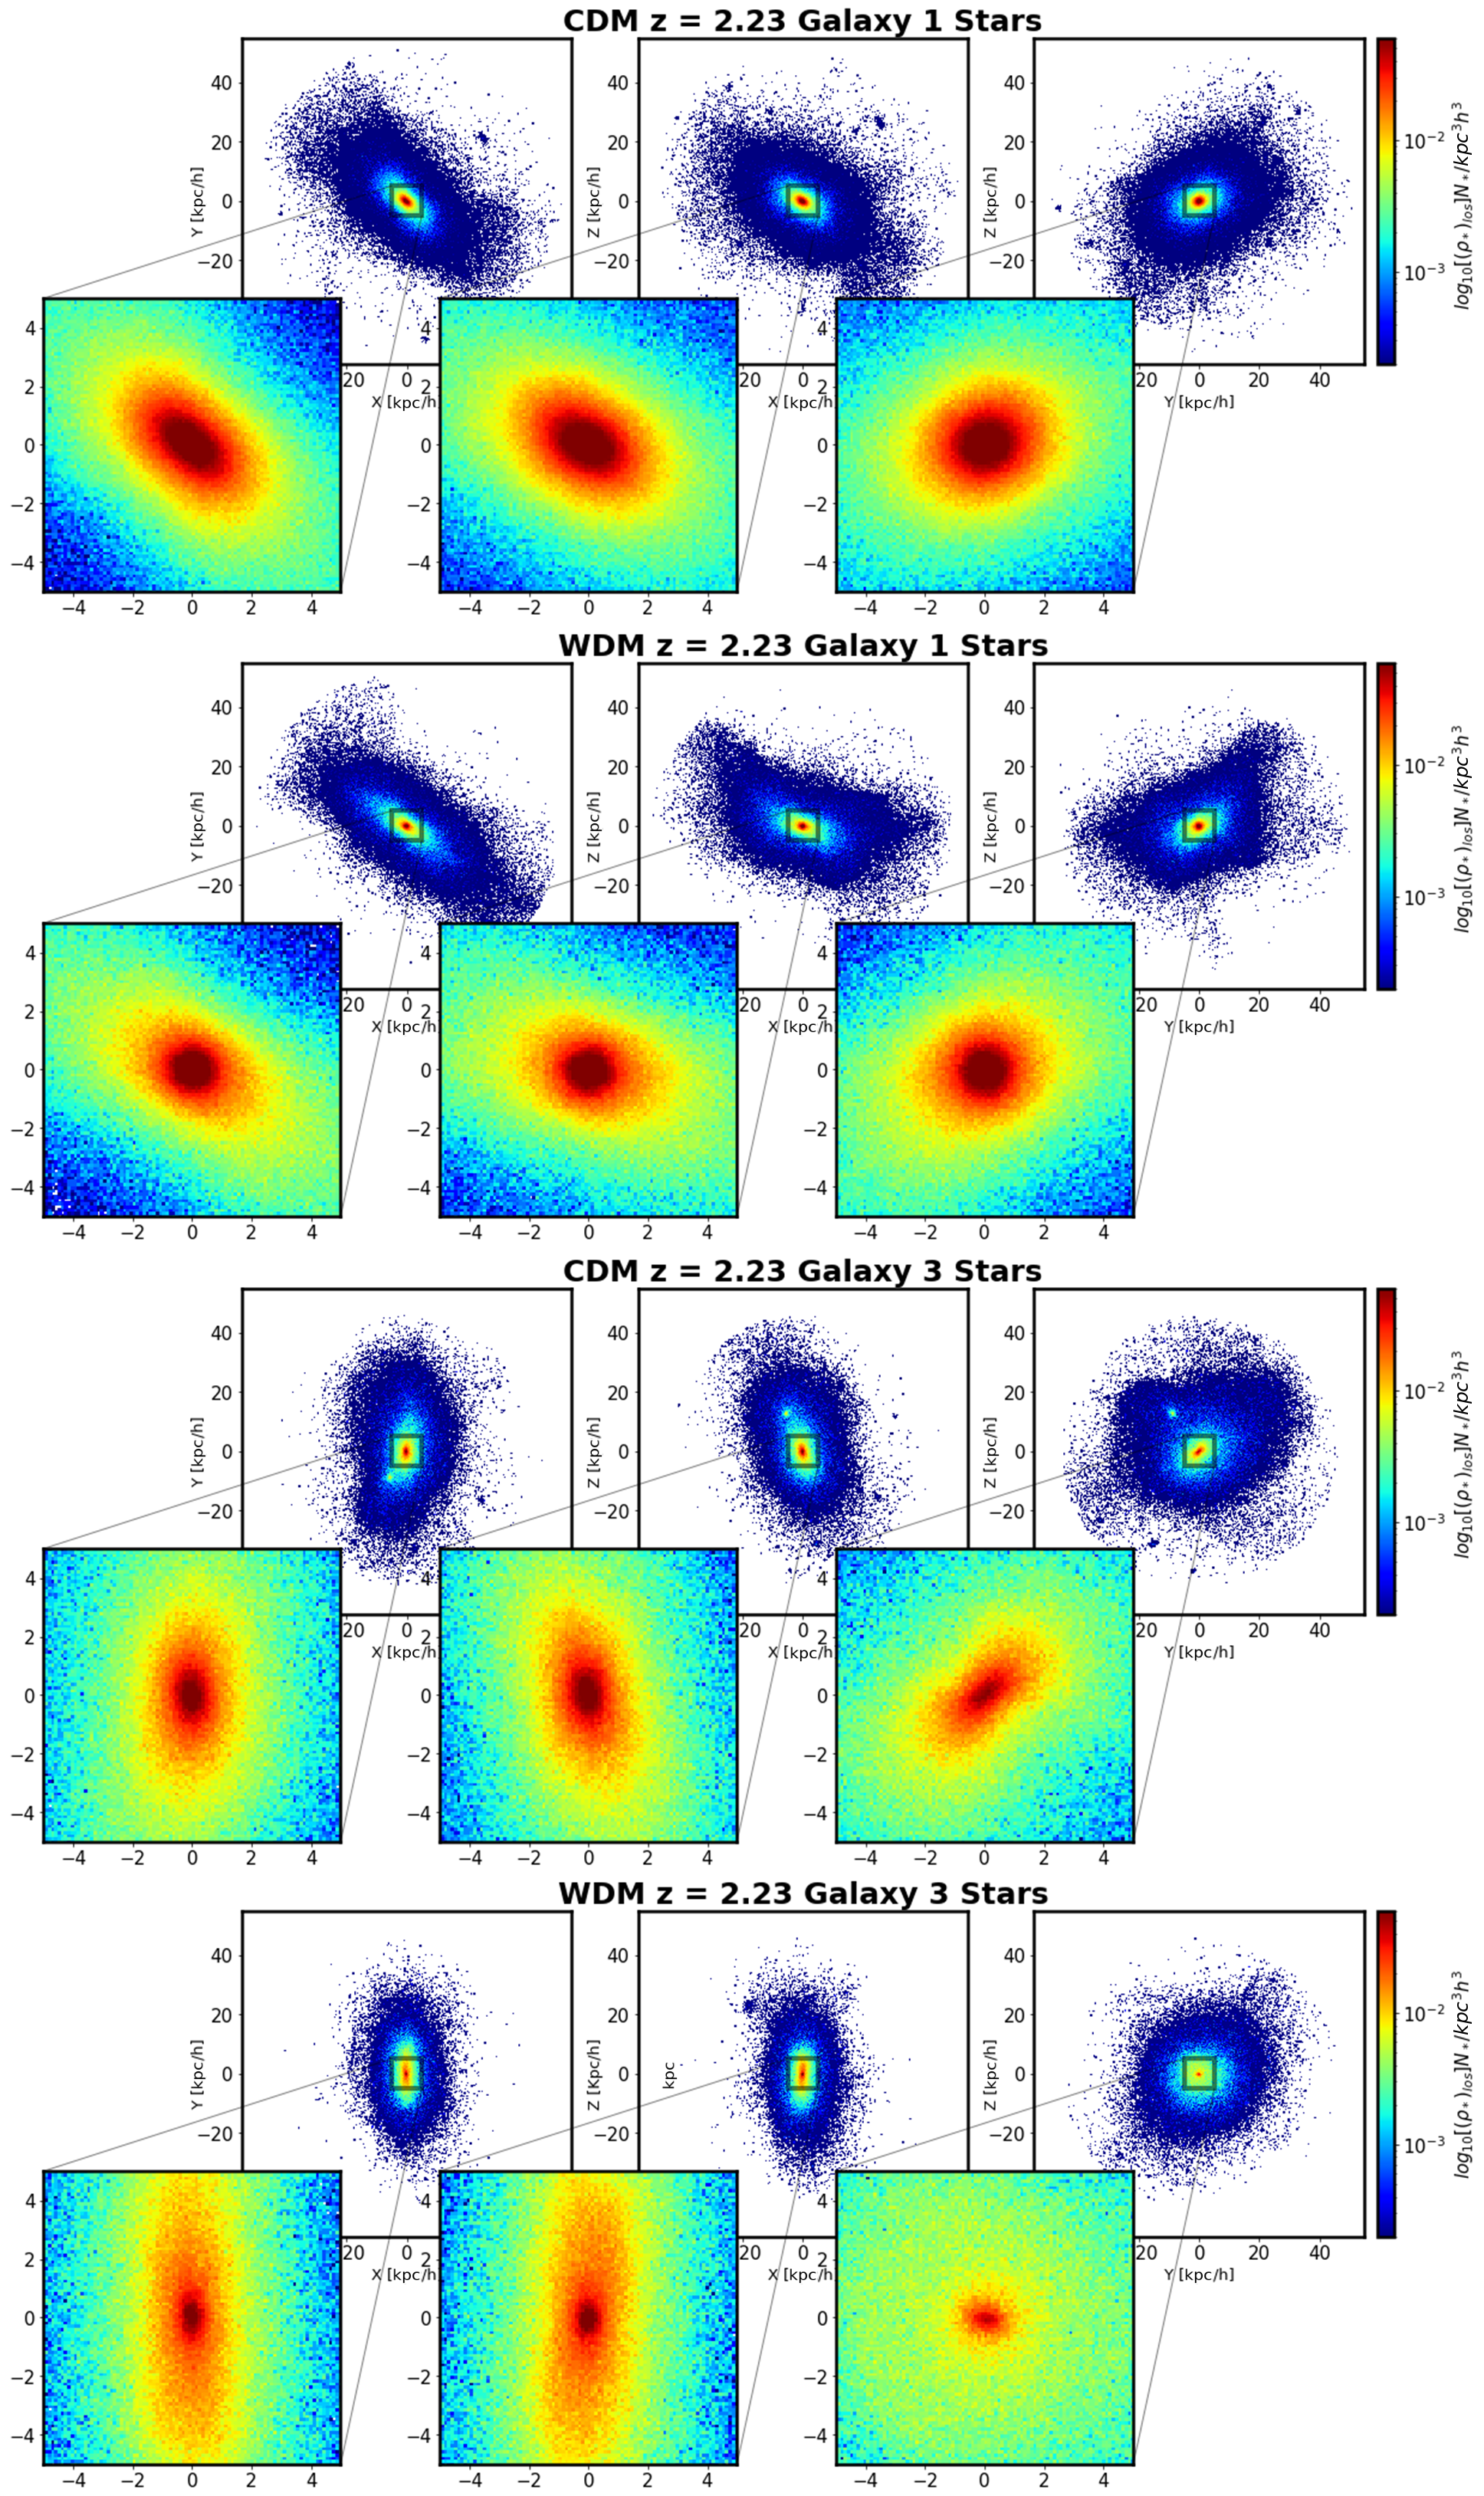
5.3 Stellar Morphology
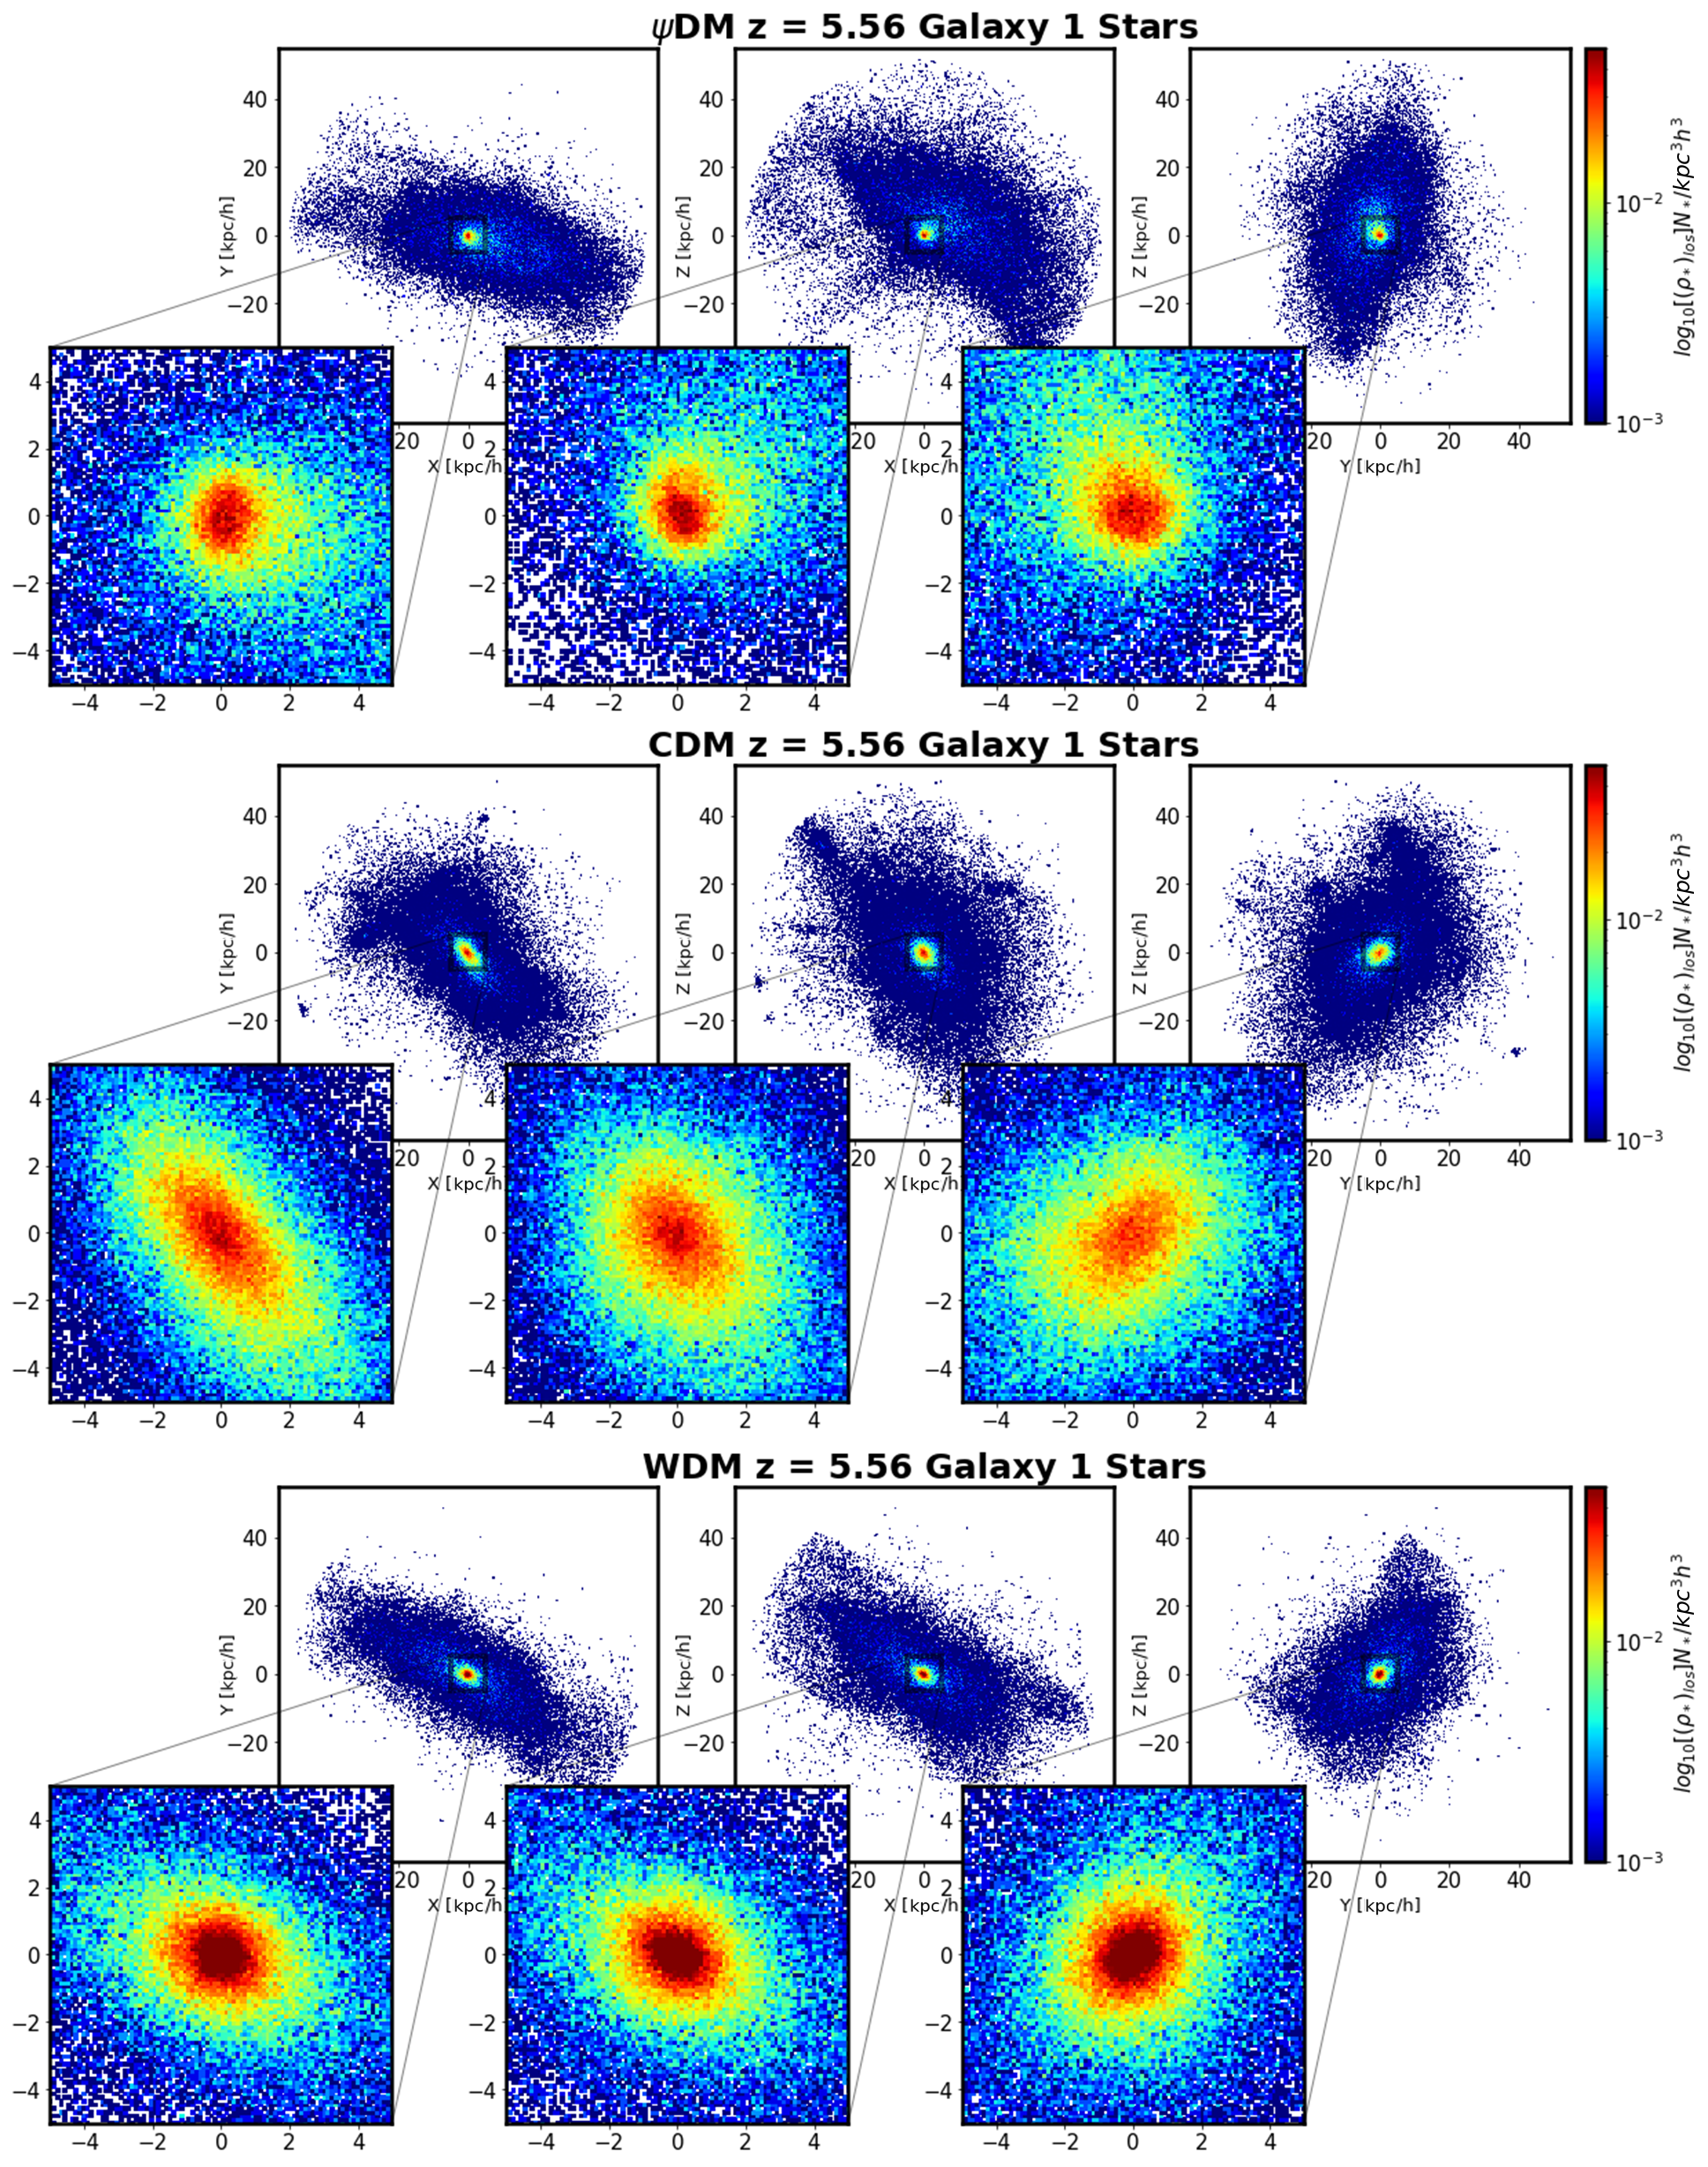
In this section, we will compare the stellar distribution of each galaxy across different DM simulations. Figure 8 presents the stellar morphology at three projections for the isolated G1 at . The main panels in this plot display the stellar distribution for the entire galaxy at a scale of approximately 55 kpc/h, while the additional sub-panels provide a closer view of the central regions of the galaxy (5 kpc/h). This allows for a detailed comparison between different stellar cores.
Figure 8 distinctly illustrates variations among three DM models, revealing that stars exhibit a more asymmetric structure in DM compared to a slightly symmetric shape seen in WDM and progressively a more symmetric shape in CDM, aligning well with theoretical predictions (Gao & Theuns, 2007; Schive et al., 2020). Notably, there is a significant discernible difference between the stellar distributions in WDM and DM. Despite appearing similar in scale in Figure 1, stars in WDM are actually more flattened than in DM. Upon closer examination in the subpanels with zoomed data, stars exhibit a spherical form in the DM core, but a more elliptical shape towards the center for both CDM and WDM. The plot effectively highlights the disparities between the core and cuspy centers, indicating that stars tend to concentrate in smaller cores in DM model, contrasting the cusps observed in CDM/WDM. Additionally, aside from having fewer stars than CDM and WDM, DM has a smaller proportion of stars in the central regions (see Table 4). This suggests a more extended stellar profile around the soliton, in line with recent discoveries of halos around some studied dwarfs (Chiti et al., 2021; Collins et al., 2021). These extended halos are inherent to DM, composed of excited states above the ground state soliton, as evidenced by the NFW form, as predicted by the DM simulations (Schive et al., 2014a). This reflects the fundamentally non-relativistic nature of DM. Moving to Figure 11, we observe WDM/CDM data for z 2.23. The results are comparable for both models when compared to the data from redshift z 5.56, showing an expected symmetry.
The additional sub-panels in Figure 8 prominently display the predicted asymmetry for DM, a distinctive feature not observed in the symmetric distributions of stars in WDM and CDM models (Schive et al., 2020). This asymmetry in DM arises from the solitonic characteristic ‘jumping’ behaviour (soliton oscillations) on the scale of the de Broglie wavelength , or the core radius (), owing to its standing wave nature (Li et al., 2021; Chiang et al., 2021). The jumps occur over a timescale of years for a dSph with 0.3 kpc and 10 km/s, values closely matching those for this galaxy (as referred in Tables 1 and 2 and check out Pozo et al. (2023) for a deeper explanation of ). Notably, this timescale is equivalent to the stellar crossing time of the soliton, . In essence, this means that stars ‘sense’ the movement of the soliton and respond accordingly, resulting in the observed asymmetry (Li et al., 2021; Chiang et al., 2021).
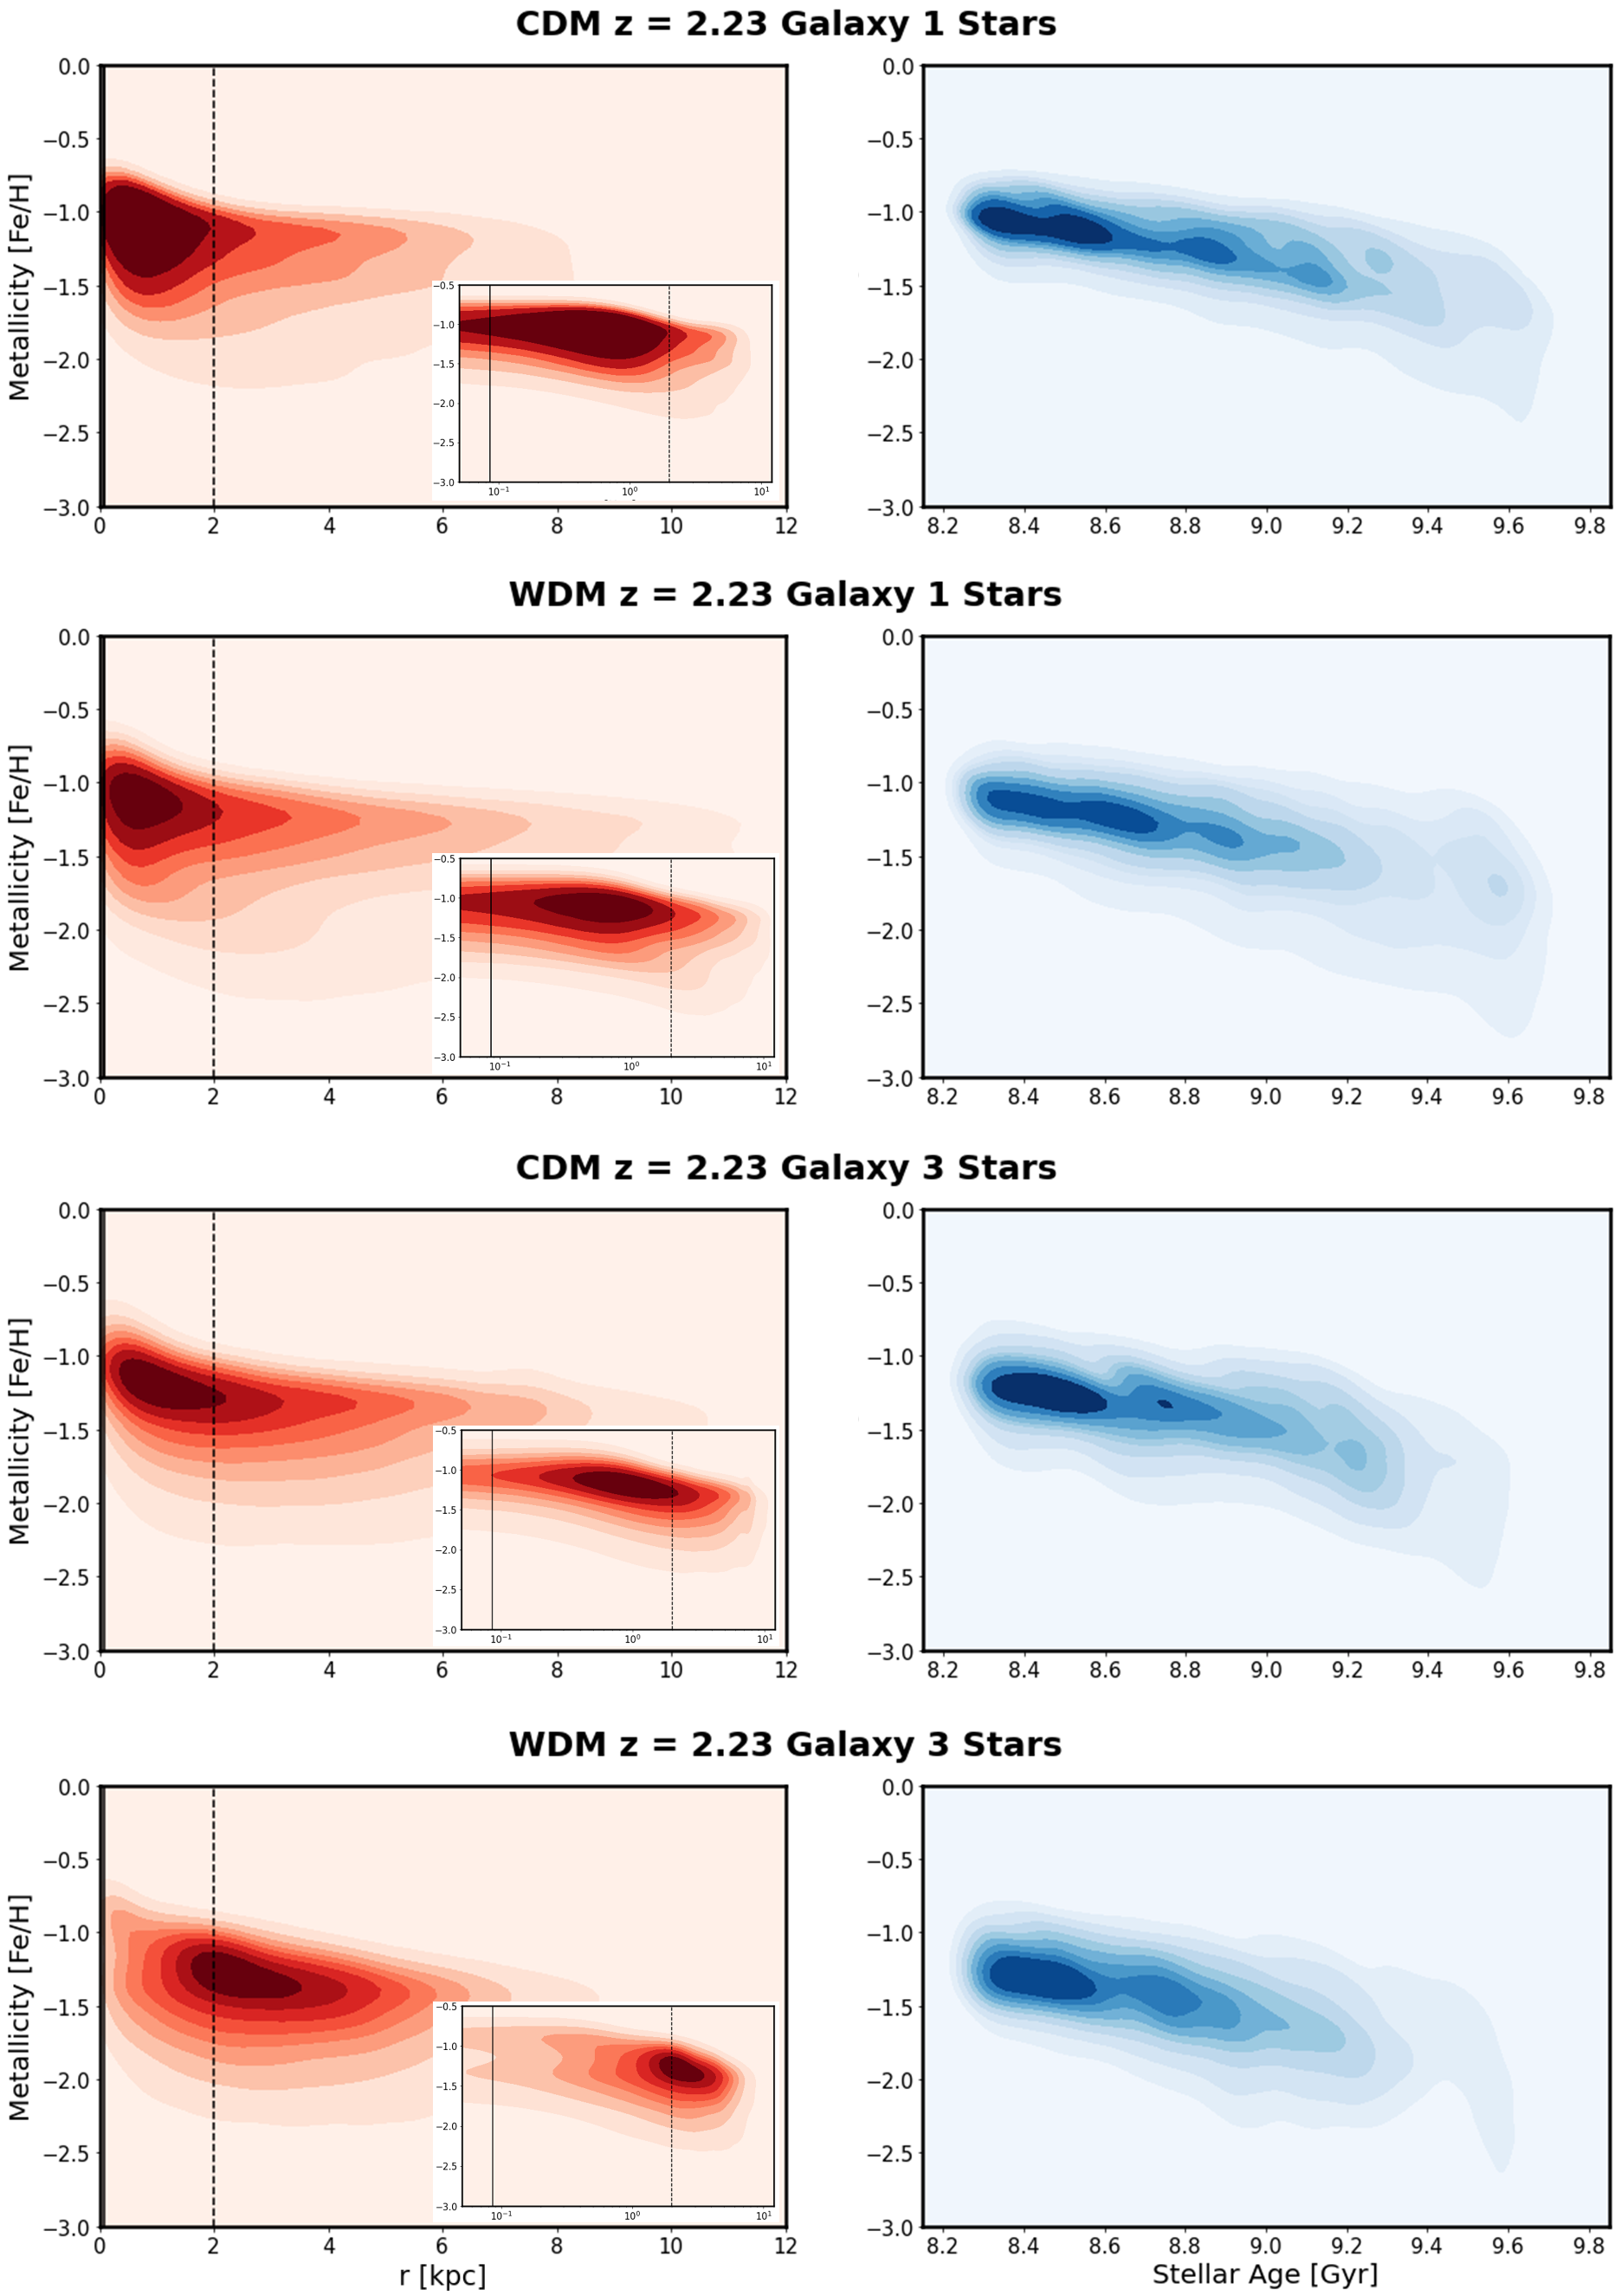
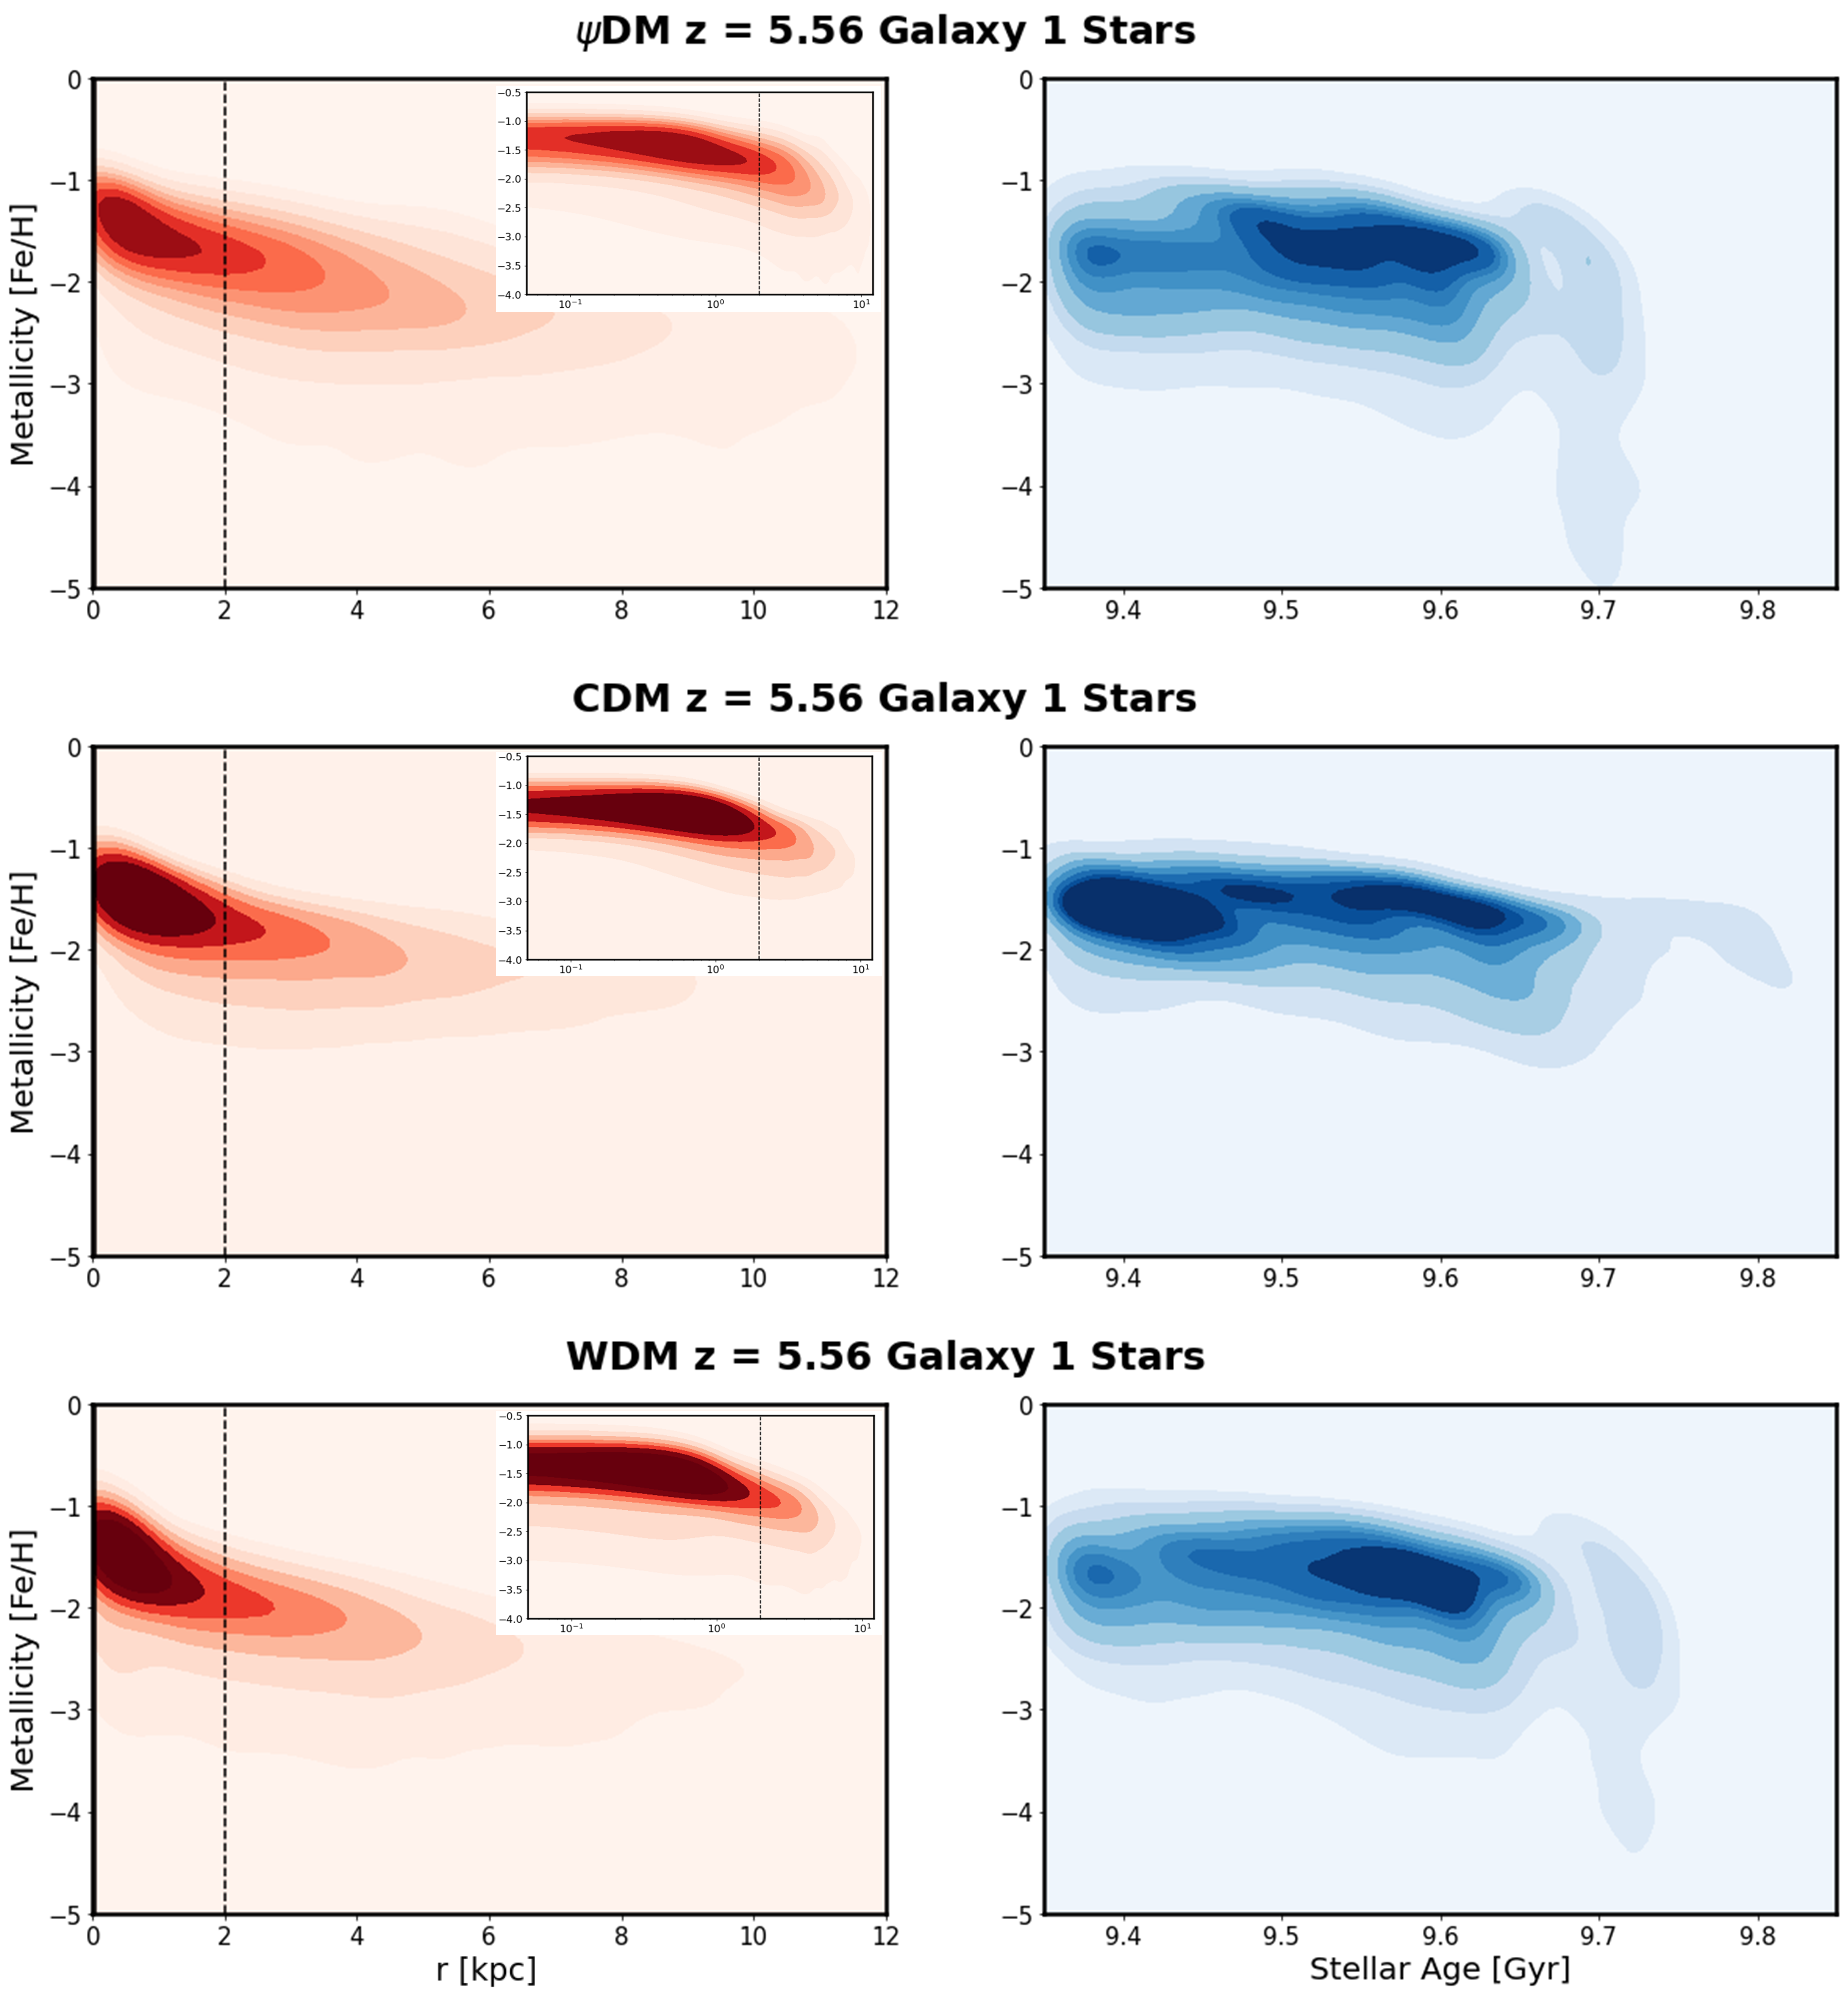
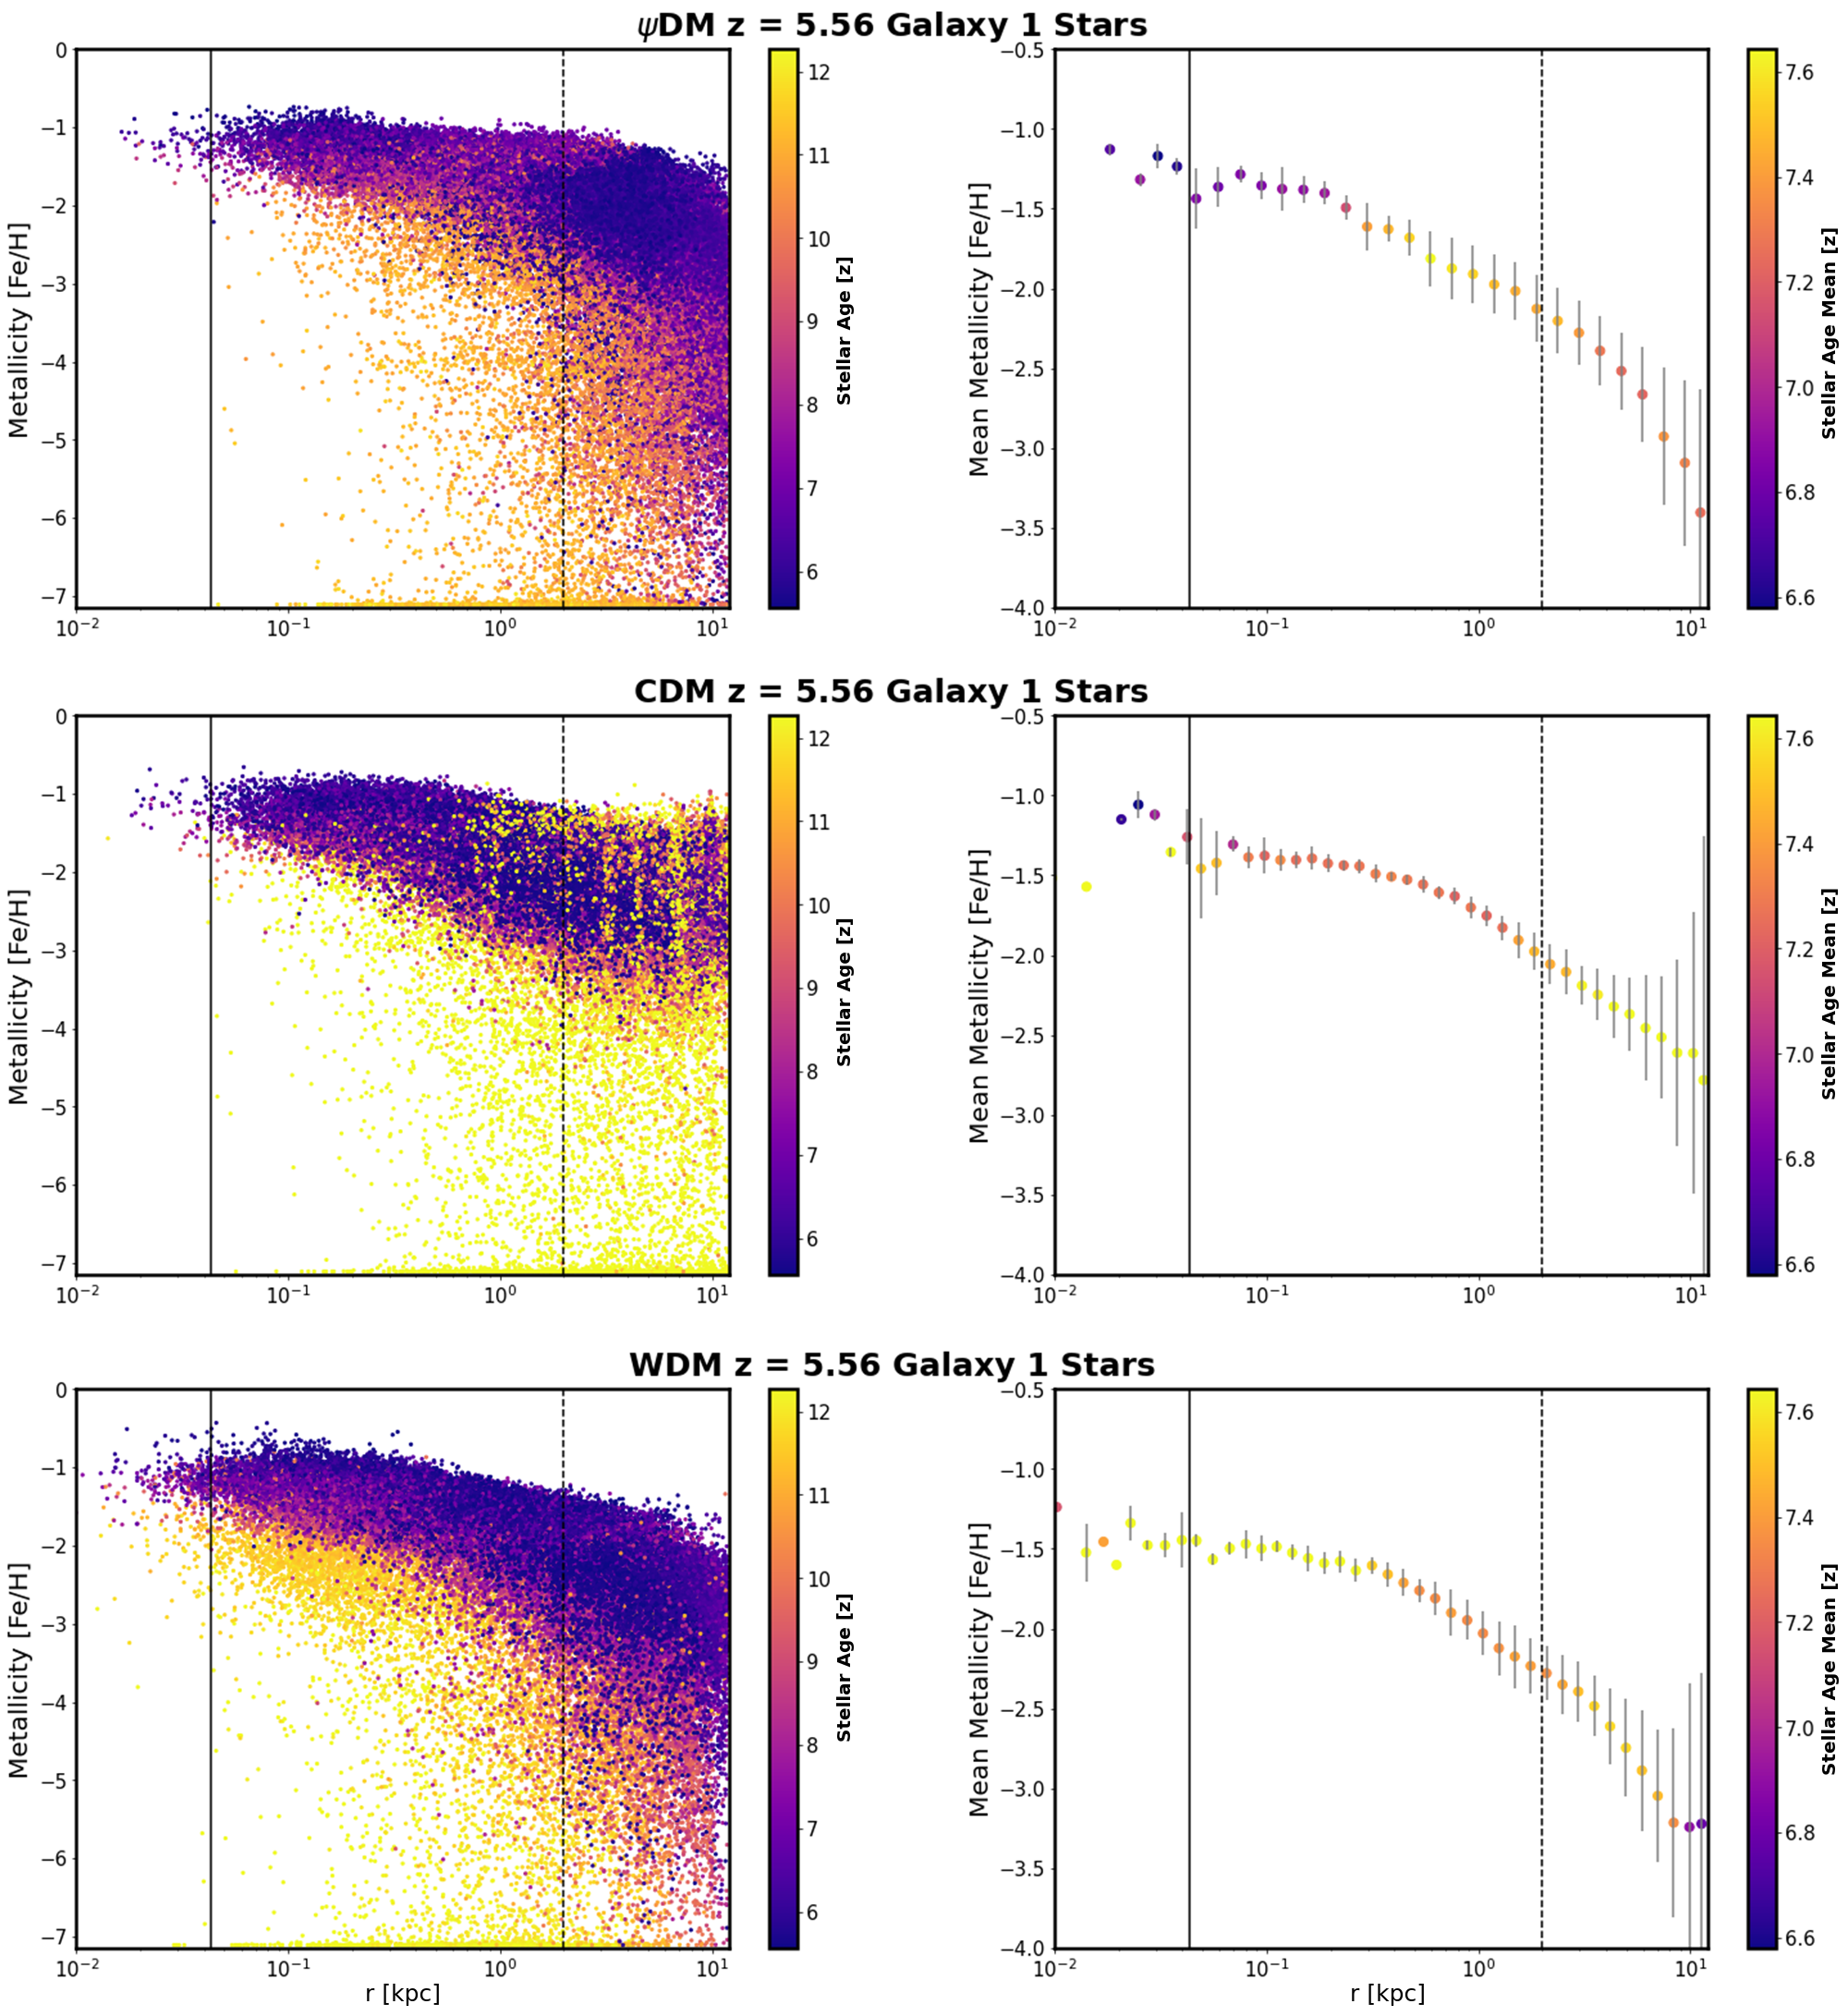
5.3.1 Stellar age vs metallicity
Metallicity plays a crucial role in unraveling the galaxy history. Here, we explore the relationship between the stellar metallicity and age. The corresponding data is displayed in the right columns of Figures 9 and 12. These figures illustrate the [Fe/H] versus stellar age profiles for G1 at the and for galaxies 1 and 3 at the . We chose to focus on these specific galaxies to emphasize the most pertinent data associated with instances where the potential presence of a core-halo structure has been identified.
We observe that in DM and WDM, the stellar metallicity exhibits a smoother decline as the stellar age increases. On the other hand, CDM displays a more pronounced breaks and a more discrete age vs. [Fe/H] profile, suggesting that its associated stars may have diverse origins. This disparity could arise from a combination of a few different factors. In CDM, the stellar cycle is more extended, with the first stars forming around z30 and continuing up to 9.8 billion years (as seen in Figure 9). In contrast, in WDM/DM, star formation begins around z13 (Mocz et al., 2019, 2020). Additionally, DM structures form earlier in CDM compared to WDM/DM, a consequence of the small-scale cut-off in the power spectrum.
Continuing with this idea, all three galaxies exhibit a peak of star formation around 9.6 billion years and 9.4 billion years, with the former being the predominant one for WDM/DM and the latter for CDM. Additionally, CDM is the only model with an additional small peak at 9.5 billion years. It is evident that all three models display a moderate to strong negative correlation between stellar age and metallicity. Similar trends and predictions are confirmed in Figure 12 at .
The observations in Figures 9 and 12 suggest that metal-rich stars tend to be more concentrated in the central regions of the galaxies, while metal-poor stars are located farther out, which is consistent with previous studies (Dietz et al., 2020; Santucci & otehrs, 2020). Additionally, the majority of stars are concentrated within distances compatible with the core-halo structure (r < 2 kpc, marked with a vertical dashed line). Of particular interest is that the galaxies where a compatible core-halo structure has been identified (DMG1 at and WDMG3 at ) exhibit a radially-offset region of stellar-density enhancement, which is especially pronounced in WDMG3 at (as seen in Figure 12). Notably, WDMG3 is the only case where this concentration of stars extends beyond the theoretical limit of the core-halo structure (r > 2 kpc). This peculiarity may be attributed to the filamentary environment observed for this galaxy, an environment that cannot be reproduced in the CDM model (as shown in Figure 1). In a future work we will study this in more detail. In summary, galaxies with a higher concentration of stars extending along their halos, rather than being centrally concentrated, seem to be more likely to develop the core-halo structure.
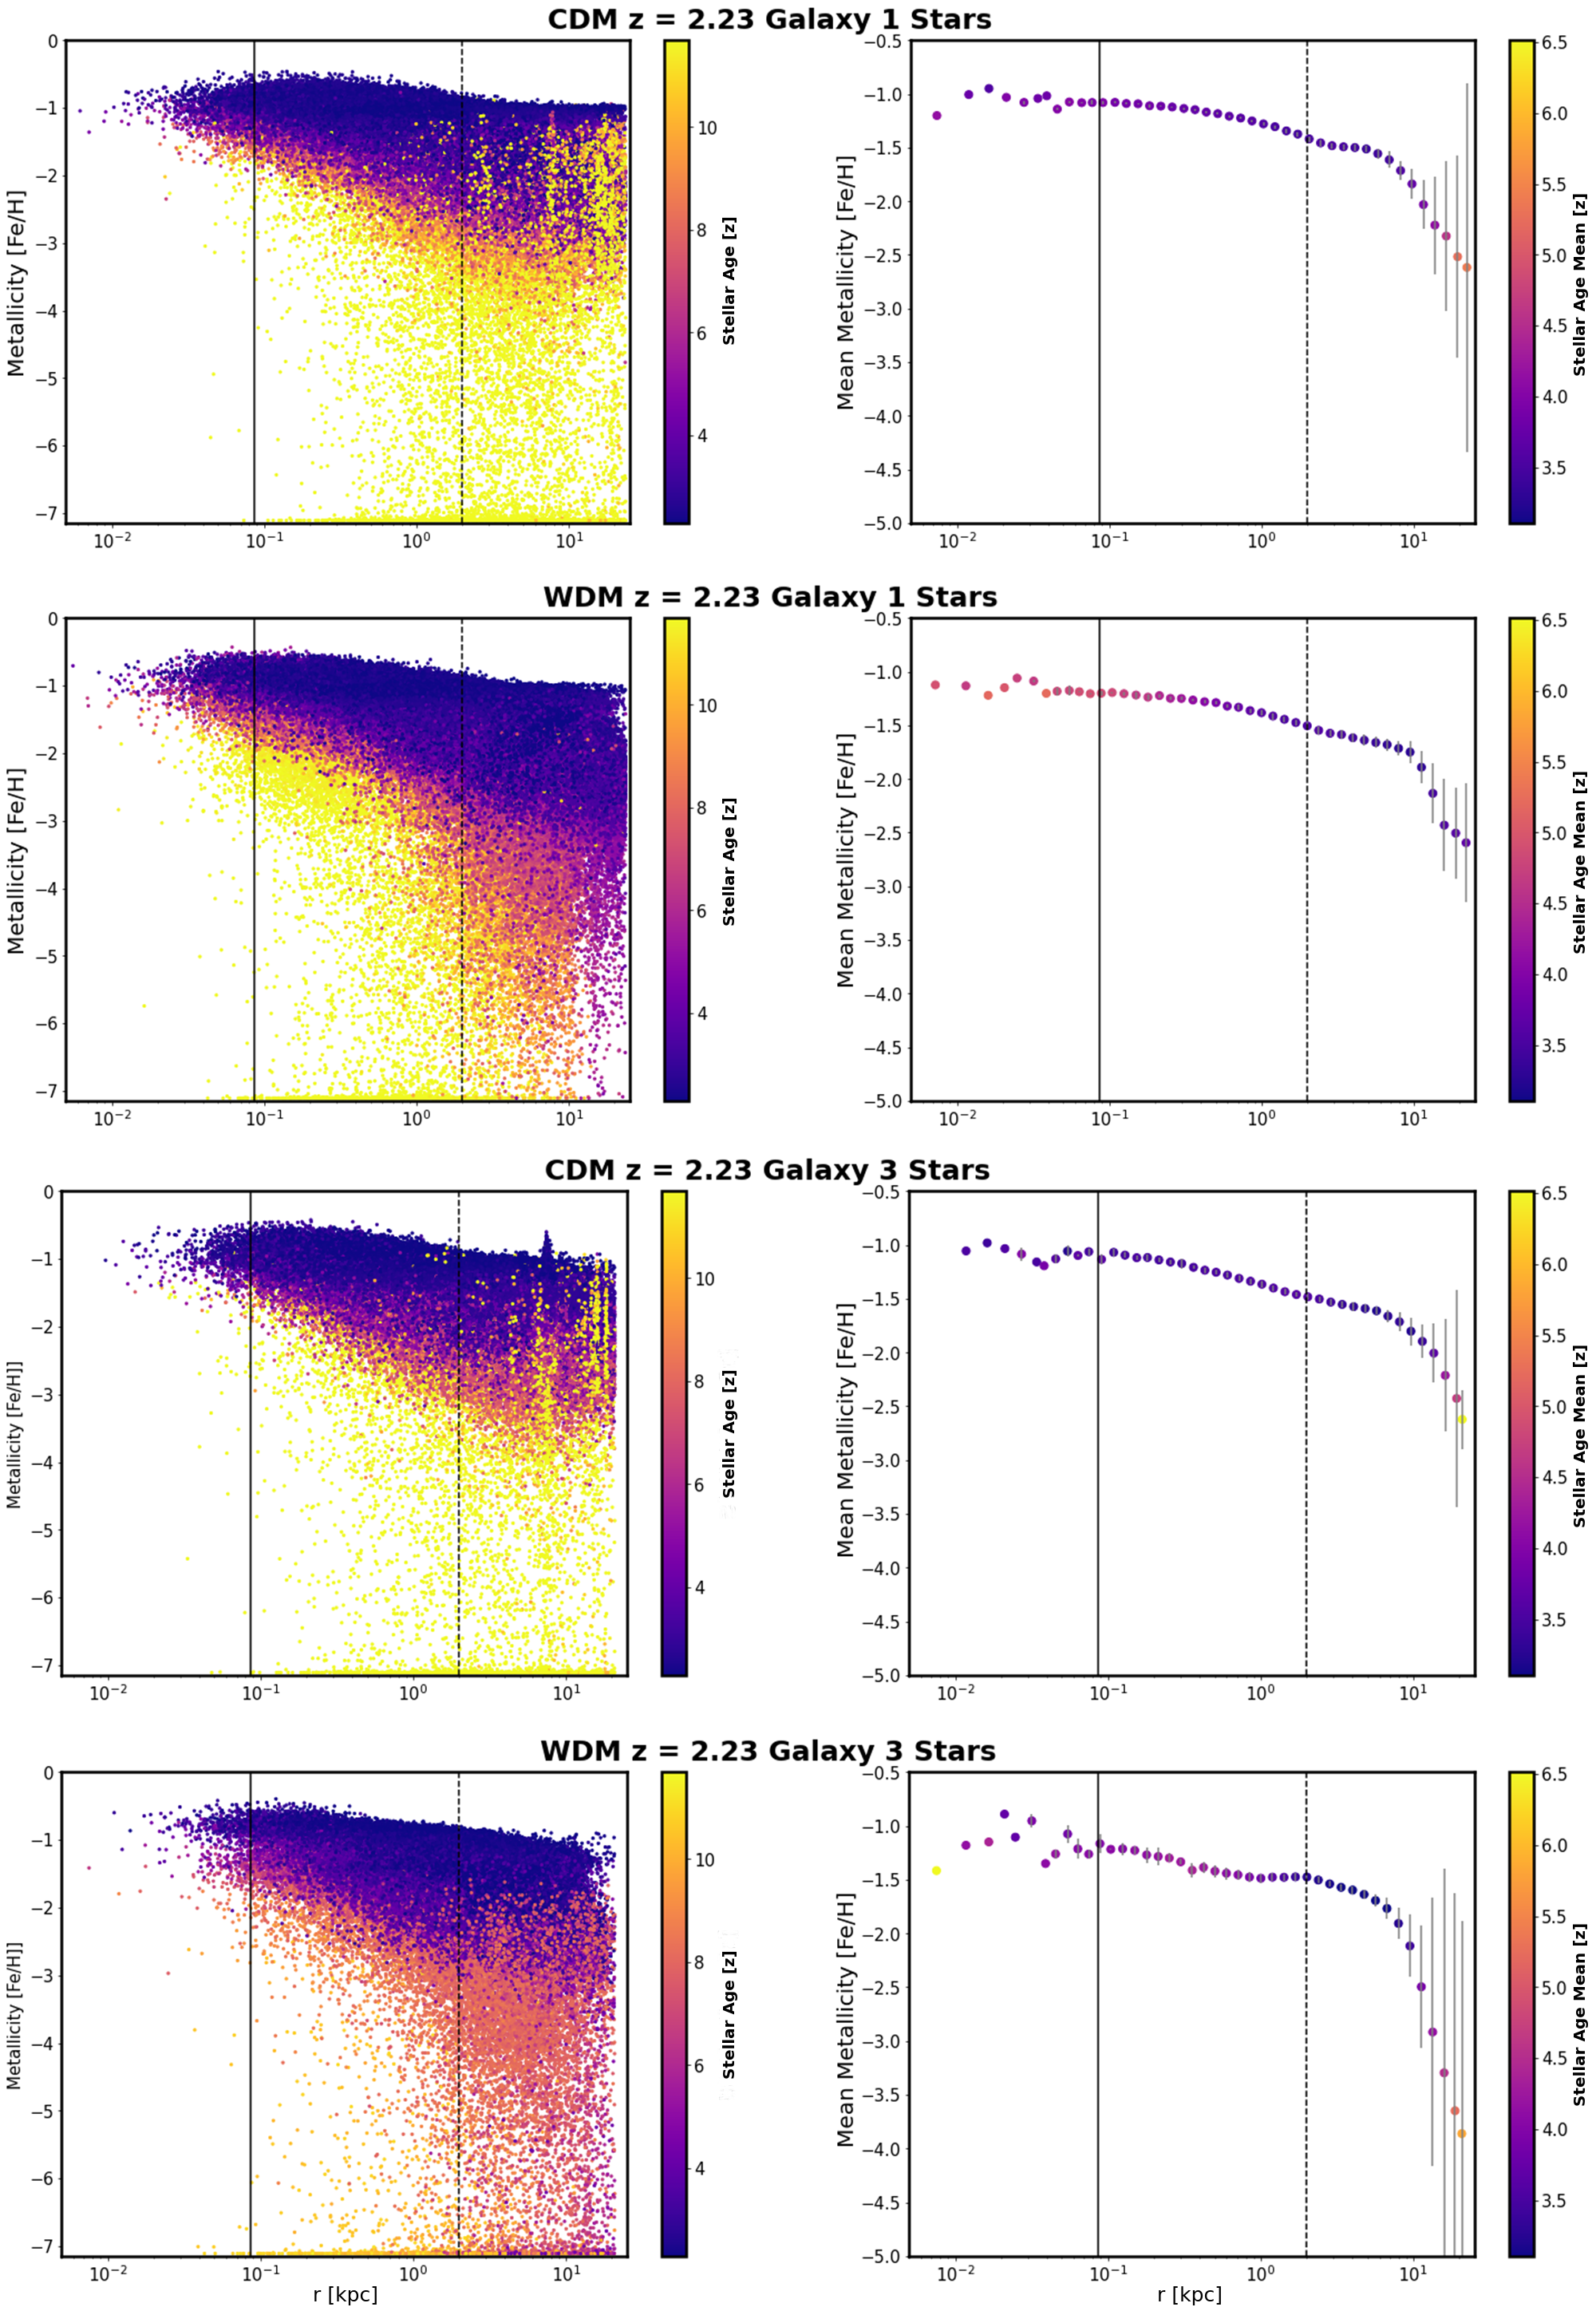
5.3.2 Spatial distribution of metallicity and age
Figures 10 and 13 investigate the correlation between the mean stellar metallicity and the stellar radii for galaxies from different DM models at both redshifts. The mean stellar age is depicted in the color bars.
The analysis of the correlation between stellar age and the spatial distribution of metallicity (as shown in Figures 10 and 13) reveals distinct differences among the three DM models. One notable distinction is that in CDM and WDM stars are relatively more metal-rich ([Fe/H] -1.0) compared to DM ([Fe/H] -1.25). Furthermore, CDM and WDM exhibit a smoother, continuous decline in metallicity from the center to the outer halo, whereas DM displays a more discrete profile, with noticeable drops in metallicity around 0.3 kpc and 0.5 kpc (as observed in the right panel of the first row in Figure 10). Regarding the spatial distribution of stellar age, WDM exhibits older stars concentrated in the center, while the mean age decreases towards the outer parts of the halo. This trend is opposite to what is observed for CDM and DM. However, it is important to note that for DM, the mean age is lower compared to the mean age observed for CDM, which aligns with the predicted stellar history between both models (Mocz et al., 2019, 2020). Tables 3 and 4 provide additional data regarding the percentage of metallicity and age in the stellar profiles of all the galaxies. These findings further contribute to our understanding of how different DM models influence the stellar properties of galaxies.
6 Discussion and Conclusions
The comparison between the core-halo structures of WDM and DM simulations with the CDM predictions reveals intriguing distinctions. In the case of WDM and DM, the core-halo structure appears to naturally stem from their respective power spectrum small-scale cut-off, whereas for CDM this structure is not anticipated. This notion could be further examined by tracking the stars of each galaxy across different epochs and observing their initial positions to scrutinize in more detail whether the stars appearing in the outer extended halos were born within their halo or in the outer filamentary structures. This observation, combined with other disparities between CDM predictions and observations, has spurred the investigation of alternative DM candidates like WDM and DM. Moreover, the fact that the stellar profiles in each DM scenario adhere to the predicted behaviours, with a cuspy profile for WDM and CDM, and a flat core structure for DM, supports the notion that stars trace DM. Figure 4 vividly illustrates that the DM, stellar, and the gaseous density profiles (especially stellar and DM) differ significantly in each DM scenario, and that the resulting stellar profile varies depending on the DM profile (cuspy/core discrepancy and core-halo structure). This underscores the potential significance of studying the properties of stars to achieve a deeper comprehension of the characteristics of DM.
Nonetheless, it is also true that in CDM and WDM both of the stellar and DM profiles appear to shift from a cuspy profile to cored one when decreasing the redshift (though never becoming as flat as DM predictions, which exhibit a better consistency with the observations (Sanchez Almeida et al., 2023)). This transformation from cuspy to cored profiles for CDM/WDM seems to align with the asserted impact of baryonic feedback in generating cores from originally cuspy halos. Feedback induces bursts of star formation and outflows, modifying the DM distribution and mitigating small-scale issues in CDM (Read & Gilmore, 2005; Amorisco et al., 2013; Chan et al., 2015), potentially resolving the cuspy-core problem. Furthermore, the simulations conducted by Mocz et al. (2019, 2020) were highly informative, demonstrating that baryonic feedback may not possess sufficient strength to convert cusps into cores for z>6, but it does open up possibilities for lower redshifts. This coincides with our findings, where the cusps observed for CDM/WDM at z5.56 seem to be alleviated around z2.23.
Certainly, the detection of the core-halo structure in WDM simulations, despite the absence of a soliton, is a topic of discussion. It seems that the smoothness of the cut-off in the initial dark matter power spectrum, which is likely more pronounced for WDM, may play a role in the formation of the core-halo structure in the stellar profiles. This suggests that the soliton itself may not be the sole factor determining the presence of the core-halo structure. However, it is worth noting that the presence of a soliton can be important as the transition feature in the DM and star profiles is a result of the power spectrum cut-off. The presence of a soliton may have a more notable impact on the early formation of the core-halo structure in DM (at ) compared to WDM (at ).
Indeed, the small-scale cut-off of the initial power spectrum appears to be the pivotal factor in determining the core-halo structure, as it leaves its mark on both the DM and the stellar profiles. The resemblance of the large-scale structures between the WDM and DM, despite their distinct physics on smaller scales, lends support to this notion. It is worth noting that the underlying cause of the cut-off differs for WDM and DM, with WDM exhibiting a thermal free-streaming cut-off, while DM featuring a quantum mechanical cut-off. However, this distinction does not seem to significantly impact larger scales where the cut-off length scale is imprinted on the profiles. The simulation data presented by Mocz et al. (2020) demonstrates that both of the WDM and DM yield core-halo stellar profiles, which appear to be at odds with CDM predictions. Further analysis is warranted to validate this finding and to probe the hypothesis that the core-halo structure arises from the small-scale cut-off of the initial power spectrum.
On the other hand, the discrepancies found in the stellar morphology, age, and metallicity suggest the notion of a less concentrated and non-cuspy inner halo as a prerequisite for the observed core-halo structure in local dwarfs. This idea gains further support when we observe the higher concentration of stars in CDM/WDM models compared to DM, which exhibit a lower proportion of stars in their halo centers, indicating more extended stellar profiles. Furthermore, the spatial distribution of metallicity and age indicates that the core-halo structure emerges in galaxies where the greater concentration of stars is not extremely close to the center, a condition that appears only feasible in a filamentary environment, which is challenging to replicate for CDM. Finally, the solitonic stellar imprint is substantiated by the observed asymmetry in the core of G1 in the DM scenario, as a consequence of the previously analyzed solitonic random walk (Li et al., 2021; Chiang et al., 2021), where stars are thought to “sense” the movement of the soliton and respond accordingly, resulting in the observed asymmetry, in stark contrast to CDM/WDM outcomes. This further strengthens the idea of distinct stellar behaviors for each DM model. Quantifying this effect with the deepest JWST images of different dwarfs at various redshifts could yield valuable insights. Additionally, a more detailed analysis of this soliton ‘jumping’ phenomenon could be carried out with data from lower redshifts, an area we plan to explore in future studies by tracking the motion of stars around the soliton across different redshifts.
We conclude that CDM is under significant tension with core-halo observations. Moreover, there are several compelling reasons to favor DM over WDM/CDM. Firstly, as highlighted previously, DM seems to align better with observations in terms of the presence and structure of core-halo profiles in galaxy halos, as opposed to CDM. Additionally, DM predicts a granularity in the lensed halos Amruth et al. (2023) that has not been observed in WDM simulations. Furthermore, the lack of detection of WDM particles in laboratory searches is a substantial drawback for this model. In contrast, DM posits light bosons that would necessitate a much larger laboratory scale of 1 kpc for detection, making it challenging to rule out this possibility based solely on laboratory experiments. Overall, the combination of better agreement with observations and the lack of definitive evidence against it makes DM a promising candidate for dark matter, and a more viable alternative to WDM/CDM.
Acknowledgements
We warmly acknowledge Douglas Finkbeiner for very fruitful conversations. A.P. is grateful for the continued support of the DIPC graduate student program as well as the Center for Astrophysics | Harvard & Smithsonian for their warm hospitality at the beginning of this project. R.E. acknowledges the support from grant numbers 21-atp21-0077, NSF AST-1816420, and HST-GO-16173.001-A as well as the Institute for Theory and Computation at the Center for Astrophysics. We are grateful to the supercomputer facility at Harvard University where most of the simulation work was done. G.S. is grateful to the IAS at HKUST for their generous support. This work has been supported by the Spanish project PID2020-114035GB-100 (MINECO/AEI/FEDER, UE). P.M. acknowledges this work was in part performed under the auspices of the U.S. Department of Energy by Lawrence Livermore National Laboratory under contract DE-AC52-07NA27344, Lawrence Livermore National Security, LLC.
Data Availability
The data underlying this article will be shared on reasonable request to the corresponding author.
References
- Amorisco et al. (2013) Amorisco N. C., Agnello A., Evans N. W., 2013, Mon. Not. R. Astron. Soc., 429, L89
- Amruth et al. (2023) Amruth A., et al., 2023, Nature Astronomy, 7, 736
- Aprile et al. (2018) Aprile E., et al., 2018, Phys. Rev. Lett., 121
- Binney & Tremaine (2008) Binney J., Tremaine S., 2008, Galactic Dynamics
- Chan et al. (2015) Chan T. K., et al., 2015, Mon. Not. R. Astron. Soc., 454, 2981
- Chiang et al. (2021) Chiang B., Schive H.-Y., Chiueh T., 2021, Phys. Rev. D., 103
- Chiti et al. (2021) Chiti A., et al., 2021, Nat. Astro., 5
- Collaboration (2020) Collaboration C., 2020, Journal of High Energy Phy., 2020, 33
- Collaboration et al. (2018) Collaboration P., et al., 2018, Astron. Astrophys., 641, 67
- Collins et al. (2021) Collins M. L., et al., 2021, Mon. Not. R. Astron. Soc., 505, 5686
- Dietz et al. (2020) Dietz S. E., Yoon J., Beers T. C., Placco V., 2020, Astrophys. J., 894, 10
- Gao & Theuns (2007) Gao L., Theuns T., 2007, Science, 317, 1527
- Gregory et al. (2019) Gregory A. L., et al., 2019, Mon. Not. R. Astron. Soc., 485, 2010
- Hu et al. (2000) Hu W., Barkana R., Gruzinov A., 2000, Phys. Rev. Lett., 85, 1158
- Hui (2020) Hui L., 2020, Phys. Rev. Lett., 95
- Hui et al. (2021) Hui L., Joyce A., Landry M. J.and Li X., 2021, Journal of Cosmo. and Astroparticle Phy.
- Kang & Ricotti (2019) Kang H. D., Ricotti M., 2019, Mon. Not. R. Astron. Soc., 488, 2673
- Klypin et al. (1999) Klypin A., Kravtsov A. V., Valenzuela O. Prada F., 1999, Astrophys. J., 522, 82
- Li et al. (2021) Li X., Hui L., Yavetz T. D., 2021, Phys. Rev. D., 103
- Lovell et al. (2014) Lovell M. R., et al., 2014, Mon. Not. R. Astron. Soc., 439, 300
- Marsh & Pop (2015) Marsh D. J. E., Pop A.-R., 2015, Mon. Not. R. Astron. Soc., 451, 2479
- May & Springel (2021) May S., Springel V., 2021, Mon. Not. R. Astron. Soc., 506, 2603
- McConnachie & Irwin (2006) McConnachie A. W., Irwin M. J., 2006, Mon. Not. R. Astron. Soc., 365, 1263
- McConnachie et al. (2006) McConnachie A. W., Arimoto N., Irwin M., Tolstoy E., 2006, Mon. Not. R. Astron. Soc., 373, 715
- Mocz et al. (2017) Mocz P., et al., 2017, Mon. Not. R. Astron. Soc., 471, 4559
- Mocz et al. (2019) Mocz P., et al., 2019, Phys. Rev. Lett., 123
- Mocz et al. (2020) Mocz P., et al., 2020, Mon. Not. R. Astron. Soc., 494, 2027
- Moore (1994) Moore B., 1994, Nature, 370, 629
- Navarro & Frenk (1996) Navarro J., Frenk C. S., 1996, Astrophys. J., 462, 563
- Niemeyer (2020) Niemeyer J. C., 2020, P. in Particle & Nuclear Phys., 113
- Pillepich et al. (2017) Pillepich A., et al., 2017, preprint, (arXiv:1703.02970)
- Pillepich et al. (2018) Pillepich A., et al., 2018, MNRAS, 473, 4077
- Pontzen & Governato (2012) Pontzen A., Governato F., 2012, Mon. Not. R. Astron. Soc., 421, 3464
- Pozo et al. (2020) Pozo A., et al., 2020, Arxiv
- Pozo et al. (2021) Pozo A., Broadhurst T., de Martino I., Luu H. N., Smoot G. F. ; Lim J., Neyrinck M., 2021, Mon. Not. R. Astron. Soc., 504, 2868
- Pozo et al. (2022) Pozo A., Broadhurst T., Emami R., Smoot G., 2022, Mon. Not. R. Astron. Soc., Advance Access
- Pozo et al. (2023) Pozo A., et al., 2023, Arxiv
- Read & Gilmore (2005) Read J. I., Gilmore G., 2005, Mon. Not. R. Astron. Soc., 356, 107
- Safarzadeh & Loeb (2021) Safarzadeh M., Loeb A., 2021, Arxiv
- Sanchez Almeida et al. (2023) Sanchez Almeida J., Plastino A. R., Trujillo I., 2023, ArXiv
- Santucci & otehrs (2020) Santucci G., otehrs 2020, Astrophys. J., 896, 15
- Schive et al. (2014a) Schive H.-Y., Chiueh T., Broadhurst T., 2014a, Nature Phys, 10, 496
- Schive et al. (2014b) Schive H.-Y., et al., 2014b, Phys. Rev. Lett., 113
- Schive et al. (2020) Schive H.-Y., Chiueh T., Broadhurst T., 2020, Phys. Rev. Lett., 124
- Schwabe et al. (2016) Schwabe B., Niemeyer J. C., Engels J. F., 2016, Phys. Rev. D., 94
- Springel et al. (2018) Springel V., et al., 2018, MNRAS, 475, 676
- Torrealba et al. (2019) Torrealba G., et al., 2019, Mon. Not. R. Astron. Soc., 488, 2743
- Torrey et al. (2014) Torrey P., Vogelsberger M., Genel S., Sijacki D., Springel V., Hernquist L., 2014, MNRAS, 438, 1985
- Torrey et al. (2019) Torrey P., et al., 2019, MNRAS, 484, 5587
- Veltmaat et al. (2018) Veltmaat J., Niemeyer J. C., Schwabe B., 2018, Phys. Rev. D., 98
- Vogelsberger et al. (2013) Vogelsberger M., Genel S., Sijacki D., Torrey P., Springel V., Hernquist L., 2013, MNRAS, 436, 3031
- Widrow & Kaiser (1993) Widrow L. M., Kaiser N., 1993, Astrophys. J., 416, L71
- Woo & Chiueh (2009) Woo T. P., Chiueh T., 2009, Astrophys. J., 697, 850
- de Blok (2010) de Blok W. J. G., 2010, Adv. in Astro.
Appendix A Stellar Morphology at
Here we present the equivalent plots for data at from the main text, for . This supplementary analysis further enriches our understanding of the core-halo structure in the system under investigation. It is valuable to explore how these parameters interact and correlate at different redshifts, providing a more comprehensive view of the underlying dynamics.