The NANOGrav 15-year data set: Search for Transverse Polarization Modes in the Gravitational-Wave Background
Abstract
Recently we found compelling evidence for a gravitational wave background with Hellings and Downs (HD) correlations in our 15-year data set. These correlations describe gravitational waves as predicted by general relativity, which has two transverse polarization modes. However, more general metric theories of gravity can have additional polarization modes which produce different interpulsar correlations. In this work we search the NANOGrav 15-year data set for evidence of a gravitational wave background with quadrupolar Hellings and Downs (HD) and Scalar Transverse (ST) correlations. We find that HD correlations are the best fit to the data, and no significant evidence in favor of ST correlations. While Bayes factors show strong evidence for a correlated signal, the data does not strongly prefer either correlation signature, with Bayes factors when comparing HD to ST correlations, and for HD plus ST correlations to HD correlations alone. However, when modeled alongside HD correlations, the amplitude and spectral index posteriors for ST correlations are uninformative, with the HD process accounting for the vast majority of the total signal. Using the optimal statistic, a frequentist technique that focuses on the pulsar-pair cross-correlations, we find median signal-to-noise-ratios of 5.0 for HD and 4.6 for ST correlations when fit for separately, and median signal-to-noise-ratios of 3.5 for HD and 3.0 for ST correlations when fit for simultaneously. While the signal-to-noise-ratios for each of the correlations are comparable, the estimated amplitude and spectral index for HD are a significantly better fit to the total signal, in agreement with our Bayesian analysis.
1 Introduction
Einstein’s theory of general relativity (GR) predicts the existence of gravitational waves (GWs) with two transverse polarization modes that propagate at the speed of light (Eardley et al., 1973a, b). Observations by the LIGO collaboration have shown that GR best describes gravitational radiation from massive freely accelerating objects in the universe (Abbott et al., 2016; The LIGO Scientific Collaboration et al., 2021). However, pulsars and pulsar timing array (PTA) experiments offer a unique opportunity to probe other possible metric theories of gravity external to Einstein’s GR.
Modified theories of gravity are often introduced to resolve some of the current challenges facing fundamental physics, such as the nature of dark matter, dark energy, and in attempts to reconcile quantum mechanics and gravity (see, e.g., Berti et al. 2015 and references therein). In metric theories of gravity, there can be up to six possible GW polarization modes (Eardley et al., 1973a, b; Will, 1993). PTA searches for non-Einsteinian polarization modes may provide evidence for modified gravity theories by uncovering the different correlation patterns associated with such modes (Chamberlin & Siemens, 2012; Yunes & Siemens, 2013; Gair et al., 2015; Cornish et al., 2018; Afzal et al., 2023).
Millisecond pulsars (MSPs) emit radio beams from their magnetic poles and are extremely stable rotators. They appear to us as point sources of periodic radio bursts that arrive on Earth with a consistency that rivals that of atomic clocks (Matsakis et al., 1997; Hobbs et al., 2012, 2019). Pulsar timing experiments exploit the regularity of MSPs to search for low-frequency (1-100 nHz) GWs by measuring deviations from the expected arrival time of radio pulses (Sazhin, 1978; Detweiler, 1979). Moreover, an array of these MSPs allows us to search for correlations between deviations of times of arrivals (TOAs) of pulses from MSP pairs (Hellings & Downs, 1983; Foster & Backer, 1990).
The North American Nanohertz Observatory for Gravitational Waves (NANOGrav), the European Pulsar Timing Array (EPTA), the Chinese Pulsar Timing Array (CPTA), and the Parkes Pulsar Timing Array (PPTA) are the PTAs that possess the most sensitive datasets capable of measuring nHz GWs. NANOGrav, the EPTA, and the PPTA have seen strong evidence for a common red noise process (Arzoumanian et al., 2020; Chalumeau et al., 2021; Goncharov et al., 2021). Most recently in Agazie et al. (2023a) (hereafter referred to as NG15), NANOGrav has found compelling evidence for quadrupolar correlations (Hellings & Downs, 1983), while the EPTA and PPTA have seen these correlations at varying levels of significance (Antoniadis et al., 2023; Reardon et al., 2023). In this paper, we complement our work in NG15 by searching for evidence for Scalar Transverse correlations from the non-Einsteinian breathing polarization mode of gravity. Previous work in (Arzoumanian et al., 2021) has shown preference for a Scalar-Transverse (ST) and GW-like monopolar correlations. However, these correlations were not significant as they were not robust to the solar system ephemeris and were associated with pulsar J00300451. In §2, we review the theoretical background required to identify and search for a general transverse polarization mode of gravity using PTAs. In §3, we then describe the analyses performed, both using Bayesian and frequentist approaches. Lastly, in §4, we present the evidence for/against the existence of ST correlations.
2 Theoretical Background
In this section, we will first review the basics of gravitational wave polarization modes, §2.1, and proceed to outline the theoretical considerations needed to predict the signature of such modes in a PTA GWB signal in §2.2. Finally, in §2.3, we will explicitly describe the model for a general transverse GWB signal which we will later search for in §3 using the NANOGrav 15-year data set.
2.1 Generalized Polarization Modes in Metric Theories of Gravity
In metric theories of gravity, there can be between two and six independent polarization modes for GWs (Eardley et al., 1973a). These modes are the “electric” components of the Riemann tensor , where and are the spatial components. These components were originally found by Newman & Penrose (1962) making use of tetrad and spinor calculus.
For the purposes of this work, we assume a coordinate system such that a null plane-GW travels along the -axis at the speed of light (), where the components of the Riemann tensor only depend on the retarded time . The assumptions lead to the following coefficients which depend on combinations of the independent electric components of the Riemann tensor:
| (1a) | ||||
| (1b) | ||||
| (1c) | ||||
| (1d) | ||||
We may relate these to a matrix of the GW polarization modes by
| (2) |
where
| (3a) | ||||
| (3b) | ||||
| (3c) | ||||
| (3d) | ||||
| (3e) | ||||
| (3f) | ||||
Here, and represent the two tensor modes of GWs, the only two allowed by GR. The shear modes are given by and , while the scalar breathing and scalar longitudinal modes are and respectively. Searching for the coefficients in Eq. (2) allows for a theory-independent way to perform a test of gravity, without the need to be concerned with the specifics of any metric theory of gravity. We will utilize this technique in searches for a GWB using PTAs.
2.2 Pulsar Timing and Isotropic Gravitational Wave Background
A GW propagating through the Earth-pulsar line of sight will induce a change in the expected time of arrival for the pulsar’s radio pulse. These perturbations were first calculated in the late 1970s (Sazhin, 1978; Detweiler, 1979) and have since been used to predict the GWB signature. For pulsar timing, the measured variation in the pulse TOAs can be used to calculate GW induced residuals, , of pulsar following the relation
| (4) |
which is the quantity measured directly in PTAs, where is the GW induced redshift. For a detailed explanation of Eq. (4), refer to Arzoumanian et al. (2021) and Chamberlin & Siemens (2012).
The fractional energy density of the background is given to be
| (5) |
where is the energy of the gravitational wave, is the frequency, and is the critical density necessary for a closed universe. For the purposes of this analysis, we assume the GWB is produced by a large number of independent, weak, unresolvable sources isotropically distributed throughout the sky. Hence, the correlation between the strain functions is written as
| (6) |
where is the one-sided power-spectral-density of the GWB; related to by
| (7) |
The spectral characteristics of the GWB are often described via the characteristic strain
| (8) |
This quantity is useful, as it includes the effects of the number of cycles during the GW source in-spiral throughout the frequency band as discussed in Taylor (2021). While several models exist for describing the nature of (NG15), in this work, we will restrict ourselves to that of a power-law model for each polarization such that
| (9) |
where is a dimensionless amplitude, is the reference frequency, and is the spectral index. Using Eqs. (6), (8), and (9), we can find the cross-correlation estimator between pulsars and (Chamberlin & Siemens, 2012):
| (10) | ||||
| (11) | ||||
where and are lower and upper frequencies and is the overlap reduction function (ORF) which is related to the spatial geometry of the two pulsars in relation to the Earth and we have introduce defined as
In the above, to align with the more widely used terminology for spectral index, we have made the reparametrization .
2.3 Restriction to Transverse Modes
As discussed in §2.1, there exist between two and six possible independent polarization modes for a GW in metric theories of gravity. Calculating the effects of longitudinal modes requires additional steps and assessments such as accurate knowledge of distances to the pulsars, handling the frequency dependence of the ORF, as well as having a significant number of pulsars at small-angular separations to capture the unique ORF signature of such polarization modes (Arzoumanian et al., 2021). Thus, we will restrict ourselves to the three transverse modes, , and , for the purposes of this paper.
Given only the transverse tensor and scalar modes, we may generalize Eq. (11) (O’Beirne et al., 2019; Arzoumanian et al., 2021) as
| (13) |
It is worth pointing out that the effect of dipole radiation of binary sources in non-GR metric theories of gravity (O’Beirne et al., 2019), is accounted for by treating the spectral index as a free parameter in our statistical models.
The ORFs for the TT and ST modes have been calculated previously in Chamberlin & Siemens (2012) and Gair et al. (2015),
| (14a) | ||||
| (14b) | ||||
with being the angular distance on the sky between pulsars and and
| (15) |
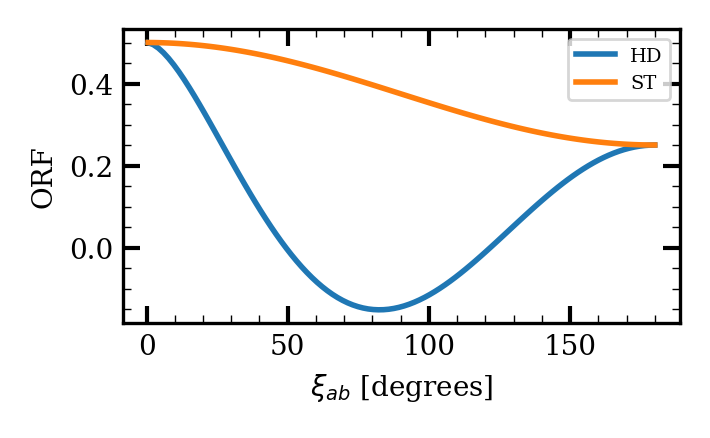
A plot of the transverse ORFs as a function of angular separation is shown in Figure 1. Where is represented by the more widely known Hellings and Downs (HD) curve (Hellings & Downs, 1983), and henceforth the TT mode will be represented by HD. With this structure in hand, we may proceed to the analysis of the NG15yr data and the investigation of the general transverse modes.
3 Searches for a General Transverse GWB in the NANOGrav 15 Year Data Set
In this section, we complement our previous work in NG15 by analyzing the NANOGrav 15 year data set for statistical significance of HD plus ST correlations. We first describe the pulsar noise modeling in §3.1, and then we present the results of the Bayesian and frequentist analyses in §3.2 and §3.3 respectively. We will take an agnostic approach to the mixing between the HD and the ST polarization modes of gravity by allowing each mode to possess its own independent power-spectral-density as suggested by Eq. (13).
3.1 Noise Modeling Details
Through individual pulsar analyses we obtain posteriors for both the red and white noises intrinsic to each pulsar. In all of the analyses, these intrinsic noises are modeled as a power-law with varying spectral index as well as varying amplitudes. We model the power spectra using frequency bins from to for being the longest observational baseline among the considered pulsars in the data set. The white noise is described by three parameters: a linear scaling of TOA uncertainties, noise added in quadrature to the TOA uncertainties, and noise common to a given epoch at all frequency subbands. These parameters are called EFAC, EQUAD, and ECORR, respectively and are set to their fixed values in NG15. For detailed explanations of these parameters, refer to (Agazie et al., 2023b).
The common red noise process is modeled as a power-law model in three ways: CURN, HD, and ST, all of which are modeled using frequency bins from to . Adapted from the naming convention in NG15, refers to the modeling of the red noise common process as an uncorrelated process (i.e., ). Whereas HD and ST refer to modeling of the red noise common process as a correlated process with HD and ST curves as their respective correlation signatures.
The upper and lower bounds of the model parameters we use are shown below. Note that the subscript “int” refers to the intrinsic red noise processes while the subscript refers to the common red noise process (i.e., CURN, HD, or ST).
| (16) | ||||
Refer to NG15 and Agazie et al. (2023b) for a more detailed explanation of the noise modeling adapted for the analyses of the NANOGrav 15 year data set.
3.2 Bayesian Analyses
Our Bayesian analyses follow §3.1 as well as NG15. In short, in terms of a likelihood function, all the various noise modelings follow from (Johnson et al., 2023)
| (17) |
where
| (18) |
and we then use the Woodbury matrix identity to invert this covariance matrix. We find
| (19) |
with
| (20) |
In the above, is a matrix with alternating columns of sine and cosine components representing a discrete Fourier transform of the red noise processes, is covariance matrix for the white noise parameters, is the covariance matrix of the red noise components.
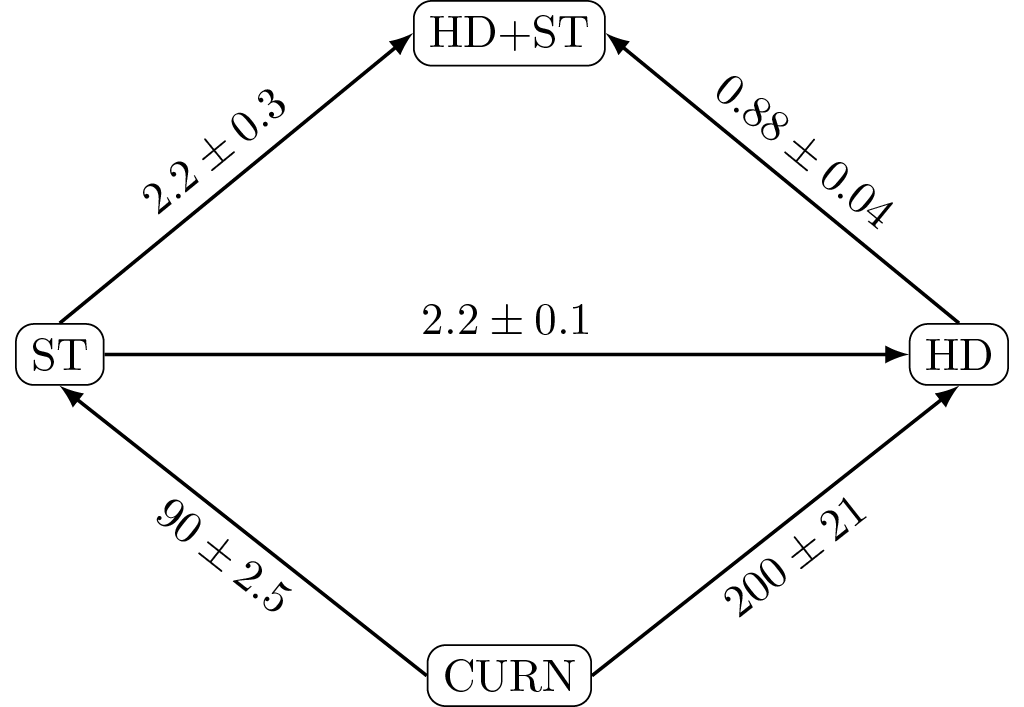
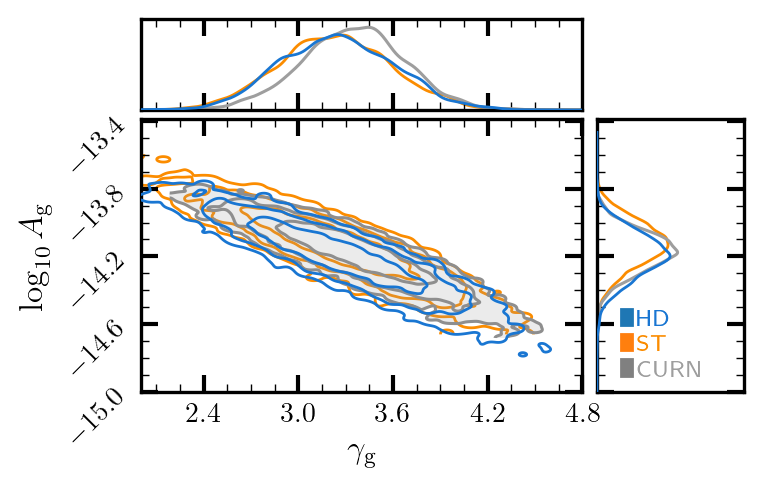
We use Bayesian analyses to compare several models of interest via Bayes factor estimation, Figure 2, and to obtain posterior distributions for and for HD and ST signals, Figure 3. In Figure 2, we observe that correlated Bayesian models are preferred over the uncorrelated model. The most favored model is a GWB with HD correlations with a Bayes factor of 200. When ST is modeled alongside HD, Bayes factors are uninformative given they are on the order of unity when compared to each correlation alone.
We can use the transitive nature of Bayes factors as a consistency check of our results. For instance, going around the bottom half of Figure 2 we can take the Bayes factor of and multiply by the Bayes factor of to obtain the Bayes factor of . This results in , which is consistent with the Bayes factor for of we obtained by directly comparing those two models.
We note that in Figure 3 when fitting for one correlation signature that both HD correlations and ST correlations are able to explain the total signal. This agrees with the large Bayes factors favoring these models over CURN. However, the recovered power spectral estimates for ST are poor when modeled alongside HD. To check the consistency of the power spectral estimates we see that and (median values with 68% credible interval). The ST values are and , while the HD values are and . We see that values for CURN and HD are more consistent with each other. While the ST spectral estimates do overlap with the median of the CURN spectral estimates, we observe the 68% credible region for and expand over about 43% and 31% of the prior region, respectively. Therefore, the addition of the ST correlation yields no additional information and we see that the HD signal in this model explains most of the total signal.
3.3 Optimal Statistic Analyses
The optimal statistic (Anholm et al., 2009; Chamberlin et al., 2015) allows for a robust and computationally inexpensive analysis of the correlation content of a PTA data set. The amplitude and the uncertainty of the pair-wise cross correlations are estimated by maximizing the ratio of the likelihood of the fiducial GWB over the noise-only model. The fiducial model contains a GWB signal along with intrinsic red and white noise components while the noise-only model includes the intrinsic noises and a common uncorrelated red noise process. We have employed the noise-marginalized version of the optimal statistic technique in which random draws from the posteriors of all of the model parameters of a CURN model are used to estimate the required power spectra. Additionally, since our goal is to search for a general transverse GWB signal in which two non-orthogonal types of correlations might simultaneously exist in the data set, a chi-squared statistic fitting for both HD and ST correlations is used to find the optimal estimators of the signal-to-noise-ratio (S/N or SNR) and the amplitude of the correlated signal () for each polarization mode. Note that differs from as the former is an optimal estimator of the latter. See Vigeland et al. (2018) and Sardesai & Vigeland (2023) for more details.
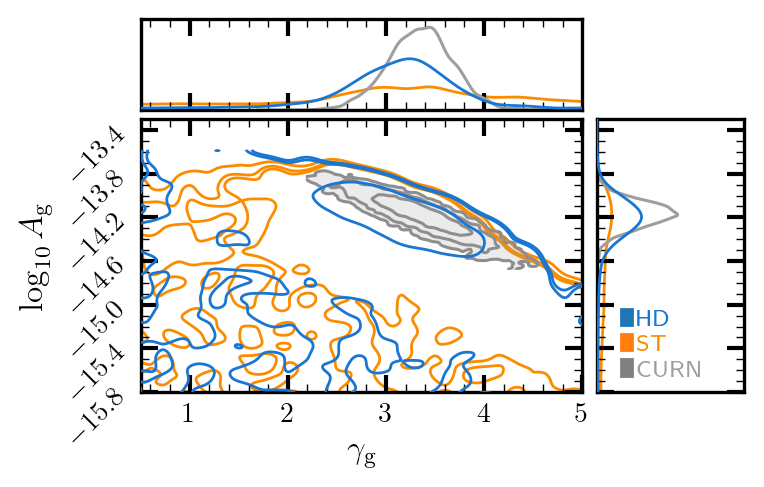
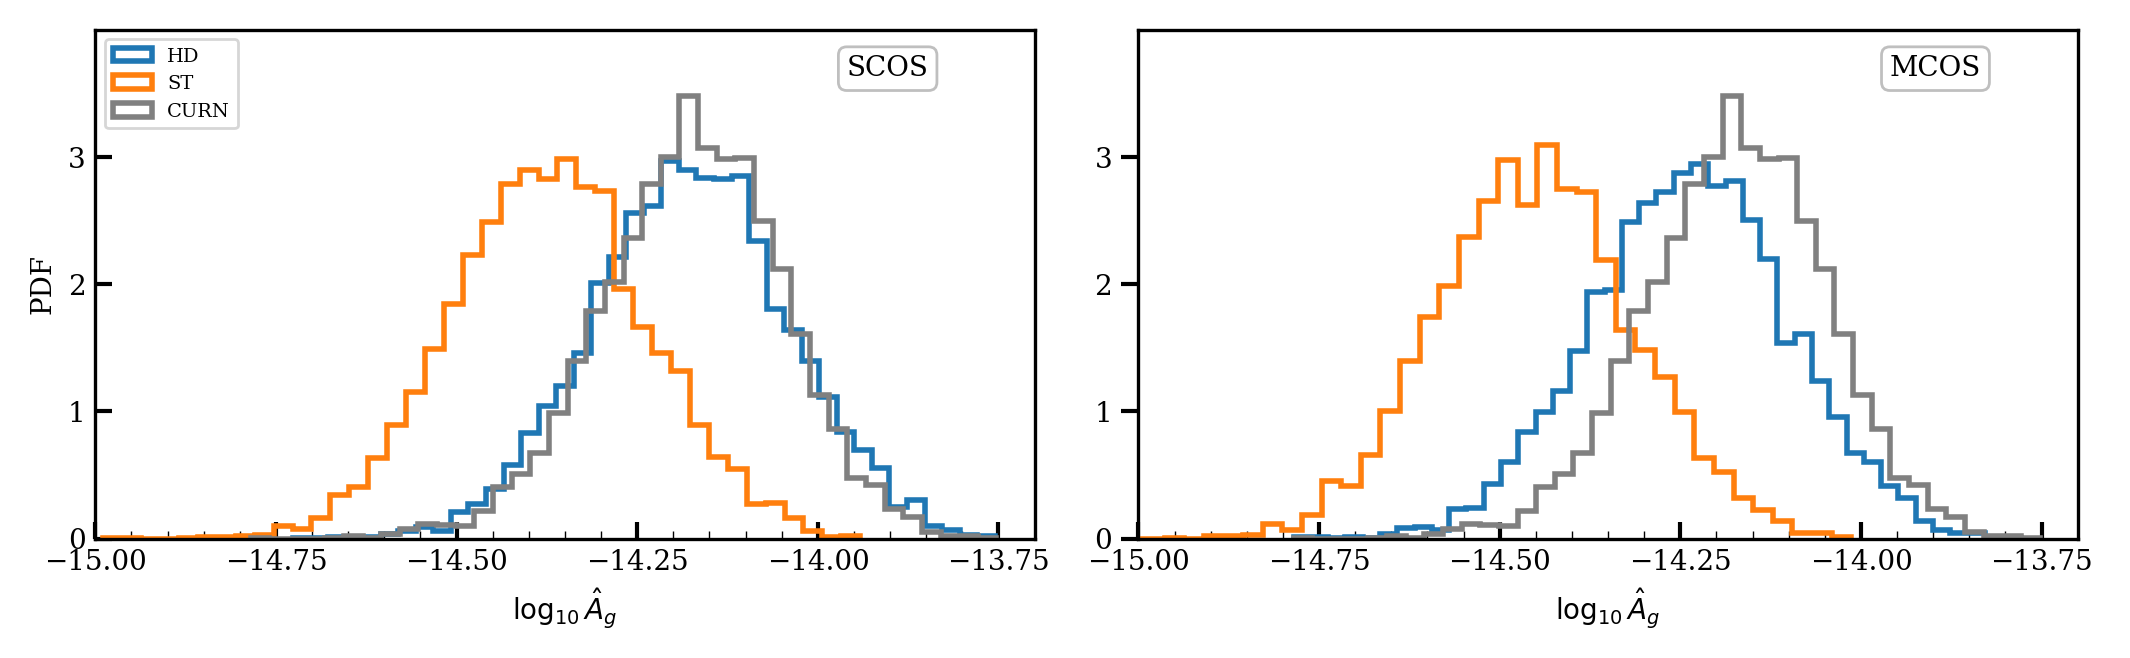
The estimated amplitudes for single component (SCOS) and multi-component (MCOS) noise marginalized optimal statistics are shown in Figure 4. We see that for SCOS that the amplitude reconstruction of the HD correlations is in excellent agreement with the CURN amplitude posterior, whereas the estimated amplitude for ST correlations is only consistent with CURN. For MCOS the correlations are fit for simultaneously so the total power is split and the fit correlations are shifted towards smaller amplitude values and less consistent with CURN. However, the HD correlations explain most of the total CURN signal when both correlations are present.
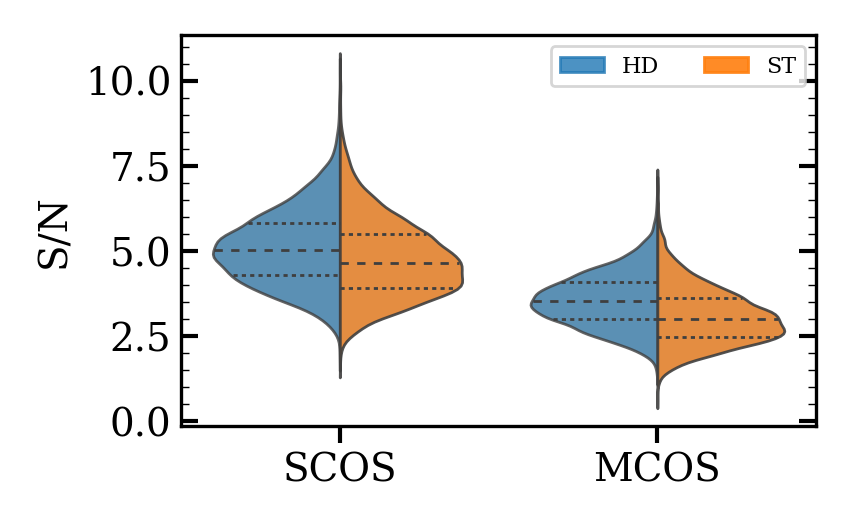
The SNR for SCOS and MCOS are shown in Figure 5. We note that the median SNRs for HD correlations, 5.0 and 3.5 for SCOS and MCOS, respectively, are larger than the median SNRs for ST correlations, 4.6 and 3.0 for SCOS and MCOS, respectively. The difference in median SNR values are not significant as the medians lie within the inter-quartile ranges of each other. While the SNR values are similar for HD and ST correlations, as noted before, the consistency of the estimated HD amplitude with CURN suggest that HD, not ST, correlations make up most of the common red noise process.
4 Discussion
NANOGrav’s 15-year data set shows compelling evidence for quadrupolar HD inter-pulsar correlations. In this work, we explored the possibility of deviations from the HD curve caused by the presence of an additional scalar-transverse (ST) mode.
Our Bayesian analyses show the Bayes factor for HD over ST is , and the Bayes factor for a model with both correlations compared to a model with just HD is . Taking the spectral parameter recovery into account, as in Figure 3, we found each correlation, when fit for individually, is in agreement with CURN. We also found more informative and recovery for HD than ST, and HD parameters show better agreement with CURN spectral parameters when correlations are included together. While these analyses do not rule out the possibility of ST correlations in our data, they show there is no statistical need for an additional stochastic process with ST correlations.
This is also the case for our frequentist analyses. When fitting the interpulsar correlation data for a single correlation signature, we find that HD correlations completely account for the total signal due to the amplitudes consistency with CURN, but ST correlations are only somewhat consistent. When we fit for both correlations simultaneously, we still see that HD correlations are able to explain most of the total signal. For the SNR, we find that the median values for HD correlations are larger than ST correlations, but are similar and lie within inter-quartile ranges.
Even though we cannot fully rule out ST correlations, Einsteinian polarization modes with HD correlations are present in all metric theories of gravity. Thus, even though we do not find a convincing Bayes factor favoring HD correlations over ST correlations and they have similar SNR values in our frequentist analyses, there is no metric theory that predicts only ST GWs. In addition, we no longer report higher SNR and Bayes factors for ST correlations as we did in Arzoumanian et al. (2021). We have seen a larger increases in favor of HD correlations than ST correlations in both SNR and Bayes factors. These changes are consistent with simulations in Arzoumanian et al. (2021) and, with no evidence indicating otherwise, we expect this trend to continue with additional data.
We also performed dropout analysis tests, similar to what was done in Arzoumanian et al. (2021), to determine if particular pulsars play a role in the observed ST significance. We found that J00300451 and J06130200 are responsible for a majority of the ST significance. When we remove these two pulsars from the analysis, we find that the Bayes factor for increases to , while the Bayes factor for is reduced to . We suspect improved noise modeling (as used in Falxa et al. (2023) and Agazie et al. (2023b)) on these and other pulsars will shed some light on this, and we leave this for future work.
Other recent work (Allen, 2023; Allen & Romano, 2022) has shown that the HD correlation signature has a cosmic variance. This idea is not addressed within this manuscript, but introduces increasing complexity in detecting alternative polarizations of gravity. An alternative polarization mode now not only needs to be disentangled from the HD correlations, but also the variance of the HD correlations to be detected. Impacts of these effects will be addressed in future work.
Future prospects for performing tests of gravity using PTA data are compelling. Large observational baselines as well as the addition of more millisecond pulsars to the observing array will enable more robust and sensitive searches for additional GW polarization modes. In this work, we reported on one test of gravity in which we searched for evidence for a scalar transverse polarization mode. While we did not find substantial evidence for or against this mode, the situation may change in the future due to the nature of the PTA data sets. It is also important to note that a number of the observed pulsars are dominated by white and intrinsic red noise process which could be suppressing a GW-sourced signal. For the case of a GWB, as we obtain more data on these pulsars, we will be able to provide more definitive answers about the possibility of the existence or absence of additional polarization modes of gravity.
5 Acknowledgments
Author contributions: An alphabetical-order author list was used for this paper in recognition of the fact that a large, decade timescale project such as NANOGrav is necessarily the result of the work of many people. All authors contributed to the activities of the NANOGrav collaboration leading to the work presented here, and reviewed the manuscript, text, and figures prior to the paper’s submission. Additional specific contributions to this paper are as follows. G.A., A.A., A.M.A., Z.A., P.T.B., P.R.B., H.T.C., K.C., M.E.D., P.B.D., T.D., E.C.F., W.F., E.F., G.E.F., N.G., P.A.G., J.G., D.C.G., J.S.H., R.J.J., M.L.J., D.L.K., M.K., M.T.L., D.R.L., J.L., R.S.L., A.M., M.A.M., N.M., B.W.M., C.N., D.J.N., T.T.P., B.B.P.P., N.S.P., H.A.R., S.M.R., P.S.R., A.S., C.S., B.J.S., I.H.S., K.S., A.S., J.K.S., and H.M.W. through a combination of observations, arrival time calculations, data checks and refinements, and timing model development and analysis; additional specific contributions to the data set are summarized in Agazie et al. (2023c). D.M.D led the search and coordinated the writing of the paper. D.M.D, N.L., A.S., S.C.S., and J.A.T. performed the Bayesian and frequentist analysis. J.B. and K.D.O cross-checked the Bayes factor values. B.B., J.S.H., K.D.O., X.S., J.P.S., S.R.T., and S.J.V. provided feedback and guidance on searches and analysis. N.L. and X.S. provided first insights to dropping J0030+0451 and J0613-0200. D.M.D, N.L., A.S., S.C.S., and J.A.T. wrote the paper.
Acknowledgments: The work contained herein has been carried out by the NANOGrav collaboration, which receives support from the National Science Foundation (NSF) Physics Frontier Center award numbers 1430284 and 2020265, the Gordon and Betty Moore Foundation, NSF AccelNet award number 2114721, an NSERC Discovery Grant, and CIFAR. The Arecibo Observatory is a facility of the NSF operated under cooperative agreement (AST-1744119) by the University of Central Florida (UCF) in alliance with Universidad Ana G. Mndez (UAGM) and Yang Enterprises (YEI), Inc. The Green Bank Observatory is a facility of the NSF operated under cooperative agreement by Associated Universities, Inc. L.B. acknowledges support from the National Science Foundation under award AST-1909933 and from the Research Corporation for Science Advancement under Cottrell Scholar Award No. 27553. P.R.B. is supported by the Science and Technology Facilities Council, grant number ST/W000946/1. S.B. gratefully acknowledges the support of a Sloan Fellowship, and the support of NSF under award #1815664. The work of R.B., R.C., D.D., N.La., X.S., J.P.S., and J.A.T. is partly supported by the George and Hannah Bolinger Memorial Fund in the College of Science at Oregon State University. M.C., P.P., and S.R.T. acknowledge support from NSF AST-2007993. M.C. and N.S.P. were supported by the Vanderbilt Initiative in Data Intensive Astrophysics (VIDA) Fellowship. K.Ch., A.D.J., and M.V. acknowledge support from the Caltech and Jet Propulsion Laboratory President’s and Director’s Research and Development Fund. K.Ch. and A.D.J. acknowledge support from the Sloan Foundation. Support for this work was provided by the NSF through the Grote Reber Fellowship Program administered by Associated Universities, Inc./National Radio Astronomy Observatory. Support for H.T.C. is provided by NASA through the NASA Hubble Fellowship Program grant #HST-HF2-51453.001 awarded by the Space Telescope Science Institute, which is operated by the Association of Universities for Research in Astronomy, Inc., for NASA, under contract NAS5-26555. K.Cr. is supported by a UBC Four Year Fellowship (6456). M.E.D. acknowledges support from the Naval Research Laboratory by NASA under contract S-15633Y. T.D. and M.T.L. are supported by an NSF Astronomy and Astrophysics Grant (AAG) award number 2009468. E.C.F. is supported by NASA under award number 80GSFC21M0002. G.E.F., S.C.S., and S.J.V. are supported by NSF award PHY-2011772. K.A.G. and S.R.T. acknowledge support from an NSF CAREER award #2146016. The Flatiron Institute is supported by the Simons Foundation. S.H. is supported by the National Science Foundation Graduate Research Fellowship under Grant No. DGE-1745301. N.La. acknowledges the support from Larry W. Martin and Joyce B. O’Neill Endowed Fellowship in the College of Science at Oregon State University. Part of this research was carried out at the Jet Propulsion Laboratory, California Institute of Technology, under a contract with the National Aeronautics and Space Administration (80NM0018D0004). D.R.L. and M.A.Mc. are supported by NSF #1458952. M.A.Mc. is supported by NSF #2009425. C.M.F.M. was supported in part by the National Science Foundation under Grants No. NSF PHY-1748958 and AST-2106552. A.Mi. is supported by the Deutsche Forschungsgemeinschaft under Germany’s Excellence Strategy - EXC 2121 Quantum Universe - 390833306. P.N. acknowledges support from the BHI, funded by grants from the John Templeton Foundation and the Gordon and Betty Moore Foundation. The Dunlap Institute is funded by an endowment established by the David Dunlap family and the University of Toronto. K.D.O. was supported in part by NSF Grant No. 2207267. T.T.P. acknowledges support from the Extragalactic Astrophysics Research Group at Eötvös Loránd University, funded by the Eötvös Loránd Research Network (ELKH), which was used during the development of this research. S.M.R. and I.H.S. are CIFAR Fellows. Portions of this work performed at NRL were supported by ONR 6.1 basic research funding. J.D.R. also acknowledges support from start-up funds from Texas Tech University. J.S. is supported by an NSF Astronomy and Astrophysics Postdoctoral Fellowship under award AST-2202388, and acknowledges previous support by the NSF under award 1847938. C.U. acknowledges support from BGU (Kreitman fellowship), and the Council for Higher Education and Israel Academy of Sciences and Humanities (Excellence fellowship). C.A.W. acknowledges support from CIERA, the Adler Planetarium, and the Brinson Foundation through a CIERA-Adler postdoctoral fellowship. O.Y. is supported by the National Science Foundation Graduate Research Fellowship under Grant No. DGE-2139292.
References
- Abbott et al. (2016) Abbott, B. P., Abbott, R., Abbott, T. D., et al. 2016, Phys. Rev. Lett., 116, 061102, doi: 10.1103/PhysRevLett.116.061102
- Afzal et al. (2023) Afzal, A., Agazie, G., Anumarlapudi, A., et al. 2023, The Astrophysical Journal Letters, 951, L11, doi: 10.3847/2041-8213/acdc91
- Agazie et al. (2023a) Agazie, G., Anumarlapudi, A., Archibald, A. M., et al. 2023a, The Astrophysical Journal Letters, 951, L8, doi: 10.3847/2041-8213/acdac6
- Agazie et al. (2023b) —. 2023b, The Astrophysical Journal Letters, 951, L10, doi: 10.3847/2041-8213/acda88
- Agazie et al. (2023c) Agazie, G., Alam, M. F., Anumarlapudi, A., et al. 2023c, The Astrophysical Journal Letters, 951, L9, doi: 10.3847/2041-8213/acda9a
- Allen (2023) Allen, B. 2023, Phys. Rev. D, 107, 043018, doi: 10.1103/PhysRevD.107.043018
- Allen & Romano (2022) Allen, B., & Romano, J. D. 2022, arXiv e-prints, arXiv:2208.07230, doi: 10.48550/arXiv.2208.07230
- Anholm et al. (2009) Anholm, M., Ballmer, S., Creighton, J. D. E., Price, L. R., & Siemens, X. 2009, Phys. Rev. D, 79, 084030, doi: 10.1103/PhysRevD.79.084030
- Antoniadis et al. (2023) Antoniadis, J., et al. 2023. https://arxiv.org/abs/2306.16214
- Arzoumanian et al. (2020) Arzoumanian, Z., et al. 2020, Astrophys. J. Lett., 905, L34, doi: 10.3847/2041-8213/abd401
- Arzoumanian et al. (2021) —. 2021, Astrophys. J. Lett., 923, L22, doi: 10.3847/2041-8213/ac401c
- Berti et al. (2015) Berti, E., Barausse, E., Cardoso, V., et al. 2015, Classical and Quantum Gravity, 32, 243001, doi: 10.1088/0264-9381/32/24/243001
- Chalumeau et al. (2021) Chalumeau, A., Babak, S., Petiteau, A., et al. 2021, Monthly Notices of the Royal Astronomical Society, 509, 5538, doi: 10.1093/mnras/stab3283
- Chamberlin et al. (2015) Chamberlin, S. J., Creighton, J. D. E., Siemens, X., et al. 2015, Phys. Rev. D, 91, 044048, doi: 10.1103/PhysRevD.91.044048
- Chamberlin & Siemens (2012) Chamberlin, S. J., & Siemens, X. 2012, Phys. Rev. D, 85, 082001, doi: 10.1103/PhysRevD.85.082001
- Cornish et al. (2018) Cornish, N. J., O’Beirne, L., Taylor, S. R., & Yunes, N. 2018, Phys. Rev. Lett., 120, 181101, doi: 10.1103/PhysRevLett.120.181101
- Detweiler (1979) Detweiler, S. L. 1979, Astrophys. J., 234, 1100, doi: 10.1086/157593
- Eardley et al. (1973a) Eardley, D. M., Lee, D. L., & Lightman, A. P. 1973a, Phys. Rev. D, 8, 3308, doi: 10.1103/PhysRevD.8.3308
- Eardley et al. (1973b) Eardley, D. M., Lee, D. L., Lightman, A. P., Wagoner, R. V., & Will, C. M. 1973b, Phys. Rev. Lett., 30, 884, doi: 10.1103/PhysRevLett.30.884
- Falxa et al. (2023) Falxa, M., Babak, S., Baker, P. T., et al. 2023, Monthly Notices of the Royal Astronomical Society, 521, 5077, doi: 10.1093/mnras/stad812
- Foster & Backer (1990) Foster, R. S., & Backer, D. C. 1990, ApJ, 361, 300, doi: 10.1086/169195
- Gair et al. (2015) Gair, J. R., Romano, J. D., & Taylor, S. R. 2015, Phys. Rev. D, 92, 102003, doi: 10.1103/PhysRevD.92.102003
- Goncharov et al. (2021) Goncharov, B., Shannon, R. M., Reardon, D. J., et al. 2021, The Astrophysical Journal Letters, 917, L19, doi: 10.3847/2041-8213/ac17f4
- Heck et al. (2019) Heck, D. W., Overstall, A. M., Gronau, Q. F., & Wagenmakers, E.-J. 2019, Statistics and Computing, 29, 631–643, doi: 10.1007/s11222-018-9828-0
- Hellings & Downs (1983) Hellings, R. W., & Downs, G. S. 1983, The Astrophysical Journal Letters, 265, L39, doi: 10.1086/183954
- Hobbs et al. (2012) Hobbs, G., Coles, W., Manchester, R. N., et al. 2012, Monthly Notices of the Royal Astronomical Society, 427, 2780, doi: 10.1111/j.1365-2966.2012.21946.x
- Hobbs et al. (2019) Hobbs, G., Guo, L., Caballero, R. N., et al. 2019, Monthly Notices of the Royal Astronomical Society, 491, 5951, doi: 10.1093/mnras/stz3071
- Johnson et al. (2023) Johnson, A. D., Meyers, P. M., Baker, P. T., et al. 2023, The NANOGrav 15-year Gravitational-Wave Background Analysis Pipeline. https://arxiv.org/abs/2306.16223
- Matsakis et al. (1997) Matsakis, D. N., Taylor, J. H., & Eubanks, T. M. 1997, A&A, 326, 924
- Newman & Penrose (1962) Newman, E., & Penrose, R. 1962, J. Math. Phys., 3, 566, doi: 10.1063/1.1724257
- O’Beirne et al. (2019) O’Beirne, L., Cornish, N. J., Vigeland, S. J., & Taylor, S. R. 2019, Phys. Rev. D, 99, 124039, doi: 10.1103/PhysRevD.99.124039
- Reardon et al. (2023) Reardon, D. J., et al. 2023, Astrophys. J. Lett., 951, L6, doi: 10.3847/2041-8213/acdd02
- Sardesai & Vigeland (2023) Sardesai, S. C., & Vigeland, S. J. 2023, arXiv e-prints, arXiv:2303.09615, doi: 10.48550/arXiv.2303.09615
- Sazhin (1978) Sazhin, M. V. 1978, Soviet Ast., 22, 36
- Taylor (2021) Taylor, S. R. 2021, Nanohertz gravitational wave astronomy (CRC Press)
- The LIGO Scientific Collaboration et al. (2021) The LIGO Scientific Collaboration, the Virgo Collaboration, the KAGRA Collaboration, et al. 2021, GWTC-3: Compact Binary Coalescences Observed by LIGO and Virgo During the Second Part of the Third Observing Run. https://arxiv.org/abs/2111.03606
- Vigeland et al. (2018) Vigeland, S. J., Islo, K., Taylor, S. R., & Ellis, J. A. 2018, Phys. Rev. D, 98, 044003, doi: 10.1103/PhysRevD.98.044003
- Will (1993) Will, C. M. 1993, Theory and Experiment in Gravitational Physics, doi: 10.1017/CBO9780511564246
- Yunes & Siemens (2013) Yunes, N., & Siemens, X. 2013, Living Reviews in Relativity, 16, 9, doi: 10.12942/lrr-2013-9