DiagrammerGPT: Generating Open-Domain, Open-Platform Diagrams via LLM Planning
Abstract
Text-to-image (T2I) generation has seen significant growth over the past few years. Despite this, there has been little work on generating diagrams with T2I models. A diagram is a symbolic/schematic representation that explains information using structurally rich and spatially complex visualizations (e.g., a dense combination of related objects, text labels, directional arrows, connection lines, etc.). Existing state-of-the-art T2I models often fail at diagram generation because they lack fine-grained object layout control when many objects are densely connected via complex relations such as arrows/lines and also often fail to render comprehensible text labels. To address this gap, we present DiagrammerGPT, a novel two-stage text-to-diagram generation framework that leverages the layout guidance capabilities of LLMs (e.g., GPT-4) to generate more accurate open-domain, open-platform diagrams. In the first stage, we use LLMs to generate and iteratively refine ‘diagram plans’ (in a planner-auditor feedback loop) which describe all the entities (objects and text labels), their relationships (arrows or lines), and their bounding box layouts. In the second stage, we use a diagram generator, DiagramGLIGEN, and a text label rendering module to generate diagrams following the diagram plans. To benchmark the text-to-diagram generation task, we introduce AI2D-Caption, a densely annotated diagram dataset built on top of the AI2D dataset. We show quantitatively and qualitatively that our DiagrammerGPT framework produces more accurate diagrams, outperforming existing T2I models. We also provide comprehensive analysis including open-domain diagram generation, vector graphic diagram generation in different platforms, human-in-the-loop diagram plan editing, and multimodal planner/auditor LLMs (e.g., GPT-4Vision). We hope that our work can inspire further research on the diagram generation capabilities of T2I models and LLMs.
1 Introduction
Over the past few years, text-to-image (T2I) generation models [33, 32, 39, 4, 12] have shown impressive advancements in image generation quality. Large language models (LLMs) have also recently shown strong capabilities and usefulness in broad language understanding and generation tasks [36, 37, 29, 11, 3, 10]. Recent works also have demonstrated that it is possible to leverage LLMs to control layouts for the downstream image generation models, for better semantic alignment with input text prompts [9, 13, 22].
However, it has not been explored to use the combination of LLM and T2I generation frameworks for creating diagrams. A diagram is a symbolic/schematic representation that explains information using rich and spatially complex visualizations (e.g., a dense combination of objects, text labels, arrows, lines, etc.). A system that helps to create accurate diagrams would be useful for preparing many educational and academic resources (e.g., creating a diagram that explains new concepts in books, presentations, and papers). While the existing T2I generation models are good at generating highly realistic images, they often fail at diagram generation because they lack fine-grained object layout control when many objects are densely connected via complex relations such as arrows/lines and also often fail to render comprehensible text labels. In diagram generation, it is more important to convey correct information (with correct object relationships) than to generate realistic objects. In our experiments, existing T2I generation models usually generate diagrams where objects and arrows/lines have incorrect relationships and rendered text labels are incomprehensible. Even the recent state-of-the-art model DALL-E 3 struggles to render accurate diagrams as described in their system card [28] (and as shown in our examples; see Fig. 7).
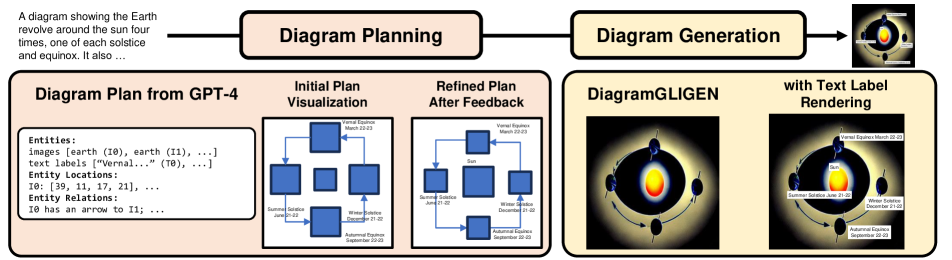
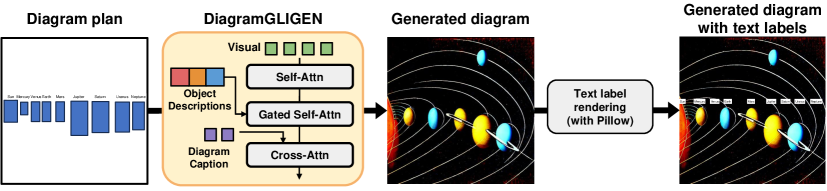
To address the issues in text-to-diagram generation, we introduce DiagrammerGPT, a novel two-stage framework capable of generating more accurate open-domain diagrams for multiple platforms by following LLM-generated diagram plans. As shown in Fig. 1, our DiagrammerGPT decomposes the text-to-diagram generation task into two stages: diagram planning and diagram generation. For the first stage, diagram planning (Fig. 1 left), we employ an LLM to create and refine ‘diagram plans,’ which consist of entities, the relationships between them, and their layouts. In the second stage, diagram generation (Fig. 1 right), we introduce DiagramGLIGEN, a layout-guided diagram generation module, to generate diagrams based on diagram plans, then explicitly render text labels, ensuring their readability. Our diagram plan can also be exported and rendered with different platforms such as Microsoft PowerPoint and Inkscape (see Fig. 8).
In the first stage, diagram planning (Sec. 3.1), we employ an LLM (e.g., GPT-4 [29]) to act as a planner and generate diagram plans given text prompts. The diagram plans consist of (1) a list of entities (i.e., objects and text labels), (2) relationships between the entities (i.e., arrows or lines between entities), and (3) entity layouts (i.e., 2D bounding box coordinates). After the initial generation of diagram plans, inspired by recent works on LLMs that self-refine previously generated contents [6, 27, 26], we use another LLM to act as an auditor and find potential errors such as incorrect object positions or relationships between objects (e.g., in Fig. 1, the sun is smaller than the earths, so the plan is adjusted to fix the relative scales). Then, the planner LLM takes feedback from the auditor LLM to update the diagram plan. We find that our LLM-generated diagram plans are quite accurate and that refinement can effectively help correct some small errors (see Sec. 5.2 and Fig. 6 for more details).
In the second stage, diagram generation (Sec. 3.2), we introduce DiagramGLIGEN, a layout-guided diagram generation module, to generate diagrams based on diagram plans, then explicitly render text labels, ensuring their readability. We implement DiagramGLIGEN based on GLIGEN [21] architecture, which adds gated self-attention layers to the Stable Diffusion v1.4 [33] model. While the original GLIGEN model is only trained on natural images and take only objects for layout grounding for objects, DiagramGLIGEN is more specialized in the diagram domain, by being trained on our new AI2D-Caption diagram dataset (see the following paragraph and Sec. 4.1 for more details) and taking the text labels and arrows as additional layout grounding inputs. As the recent state-of-the-art diffusion models still struggle in rendering accurate text in images [25, 5, 9], we explicitly render text labels on top of the generated diagrams to ensure they are readable. Compared to the previous T2I baselines (e.g., Stable Diffusion), our diagram generation stage allows more accurate object layouts and relationships between the objects (e.g., arrows/lines), as well as, clearer text labels during diagram generation.
Since diagram datasets with detailed annotations are limited (e.g., the AI2D [19] dataset usually describes diagrams in 1-2 words and does not provide object descriptions), we construct AI2D-Caption, a new dataset for the text-to-diagram generation task built on top of the AI2D dataset (Sec. 4.1). To fill in the missing information, we employ LLaVA 1.5 [24], a state-of-the-art multimodal language model, to generate a detailed caption for each diagram and to generate object descriptions for each bounding box in a diagram. We also provide a manually annotated subset of diagrams to ensure high-quality in-context examples for LLMs and accurate evaluation.
We comprehensively compare our DiagrammerGPT to recent state-of-the-art text-to-image/diagram generation methods, including Stable Diffusion v1.4 [33], VPGen [9], and AutomaTikZ [2], in both zeroshot and fine-tuned settings (see Sec. 4.2 and Sec. 5.1). In our quantitative and qualitative analysis, our DiagrammerGPT demonstrates more accurate diagram generation performance than the baseline models. Our method also outperforms Stable Diffusion v1.4, the closest and strongest baseline, in a human preference study on both image-text alignment and object relationship criteria. In our error analysis, we show that diagram plans generated by our LLM (GPT-4) are quite accurate (before and after refinement), while DiagramGLIGEN sometimes makes mistakes when generating diagrams following the diagram plan. This indicates that our DiagrammerGPT can benefit from future layout-guided image generation backbones stronger than GLIGEN with Stable Diffusion v1.4 architecture (see Sec. 5.2).
We also conduct additional analysis including open-domain diagram generation, vector graphic diagram generation from our diagram plans in multiple platforms, human-in-the-loop diagram plan editing, and text-only vs. multimodal LLM (e.g., GPT-4Vision [30]) for diagram plan creation/refinement (see Sec. 5.4). First, we experiment with generating diagrams in unseen domains (e.g., geology and plants) that are not covered in the LLM in-context example domains (astronomy, biology, engineering), where our DiagrammerGPT could often generate semantically accurate diagram plans and diagrams from these unseen prompts. Second, we experiment with rendering our diagram plans in multiple platforms, beyond just our diffusion model (DiagramGLIGEN): we render our plans in both Microsoft PowerPoint and Inkscape. While the rendered diagrams from these platforms are in different styles than the ones in the AI2D dataset, the diagrams still accurately convey the information described in the prompts. Our diagram plans can easily be exported to other similar platforms as well. Third, we show that once a diagram plan is exported to another platform, end-users can also manually edit plans to their liking and send them back to our DiagramGLIGEN to generate images using their manually refined plan (i.e., human-in-the-loop refinement of diagram plan). Lastly, we experiment with using the recently released GPT-4Vision [30] instead of text-only GPT-4 for our planner and auditor LLMs, to see whether multimodal LLMs can better handle diagram planning and refinement.
Our contributions in this work can be summarized as:
-
•
We present DiagrammerGPT, a novel open-domain, open-platform text-to-diagram generation framework, leveraging the knowledge of LLMs to create and refine a diagram plan for our downstream layout-guided diagram generator module (DiagramGLIGEN) (Sec. 3).
- •
- •
-
•
We also provide comprehensive additional analysis: step-by-step error analysis, ablation study of DiagramGLIGEN design choices, open-domain diagram generation, vector graphic diagram generation in different platforms, human-in-the-loop diagram plan refinement, and text-only vs. multimodal LLM for plan creation/refinement (Sec. 5.4).
2 Related Works
2.1 Text-to-Image Generation
In the text-to-image (T2I) generation task, models generate an image from a given text prompt. Early deep learning models leveraged the Generative Adversarial Networks (GAN) [14] framework for this task. More recently, multimodal language models (e.g., Parti [39] and MUSE [4]) and diffusion models (e.g., Stable Diffusion [33], DALL-E 2 [32], and Imagen [34]) have gained popularity. These recent T2I generation models have demonstrated impressive photorealism in their zeroshot image generation capabilities. However, using these models directly for diagram generation is challenging due to the significant distribution gap between diagram images and their training images. Additionally, these models often lack precise control of fine-grained layouts when many objects are densely connected via complex relations such as arrows/lines and frequently produce illegible text labels, which are essential for the diagram generation task.
2.2 Text-to-Image Generation with LLM-guided Layouts
Large language models (LLMs) have demonstrated their usefulness in various language generation tasks [36, 37, 29, 11, 3, 10]. Recent works also leverage LLMs to control layouts for the downstream image generation models, for better semantic alignment with input text prompts [9, 13, 22]. However, these works focus on generating natural images and do not have capabilities that are crucial in diagram generations, e.g., rendering clear text labels or the ability to precisely control fine-grained layouts of many objects that are densely connected via complex relations such as arrows/lines, as shown in our experiments (Sec. 5). A concurrent work, AutomaTikZ [2] uses LLMs to generate TikZ [35]111A TeX package for generating graphics by composing primitive objects such as arrows, circles, and other basic polygons. code to produce scientific vector graphics. While TikZ can be used to draw specific types of diagrams, such as 2D bar plots or directional acyclic graphs, it is difficult to generate diagrams including entities that are not supported by the TikZ primitives, such as animals. In contrast, our DiagrammerGPT allows for generating diagrams including diverse entities (e.g., different animals in life cycle diagrams or different planets/stars in astronomy diagrams).
3 DiagrammerGPT: Method Details
We introduce DiagrammerGPT, a novel two-stage framework for generating open-domain diagrams from text prompts, where an LLM first generates the overall plan, and a visual generator renders an actual diagram following the plan. In the first stage, Diagram Planning (Sec. 3.1), a planner LLM takes a text description of a diagram as input and generates a diagram plan, an overall diagram layout that guides the downstream diagram generation module. The planner LLM generates the initial diagram plan and iteratively refines the diagram plan via feedback from an auditor LLM. In the second Diagram Generation stage (Sec. 3.2), DiagramGLIGEN, our new layout-guided diagram generation module, takes the diagram plan and generates the diagram. Finally, we render the text labels (which are generated as part of the diagram plan) onto the diagram to ensure clear and easy-to-read labels for each entity.
3.1 Stage 1: Diagram Planning
As illustrated in the left part of Fig. 2, we use an LLM (e.g., GPT-4 [29]) to create the overall layouts for diagrams, which we call diagram plans. In the following paragraphs, we first detail the components of diagram plan and then describe how we generate and refine diagram plans.
Diagram plans.
A diagram plan consists of three components: (1) entities - a dense list of objects (e.g., larva in Fig. 2) and text labels (e.g., “egg” in Fig. 2); (2) relationships - complex relationships between entities (e.g., object-object relationship “[obj_0] has an arrow to [obj_1]” or object-text label relationship “[text_label_0] labels [obj_0]”; (3) layouts - 2D bounding boxes of the entities (e.g., “[obj_0]: ” in Fig. 2). For object-object relationships, we utilize two types: line and arrow (a line with explicit start and end entities), which are useful when specifying object relationships in diagrams such as flow charts or life cycles. For object-text label relationships, we specify which object each label refers to. For layouts, we use the format for 2D bounding boxes, whose coordinates are normalized and integer-quantized within , in accordance with VPGen [9].
Initial diagram plan generation.
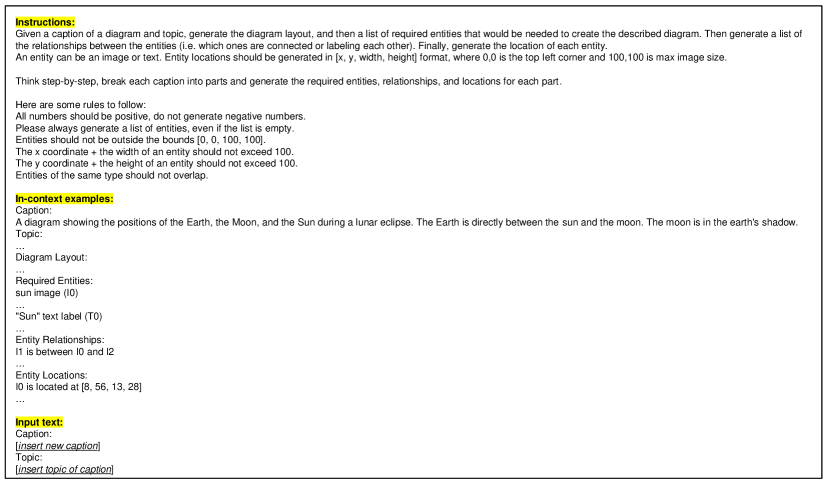
We generate diagram plans with GPT-4 via in-context learning with 10 examples. Each in-context example is created by concatenating the diagram caption, entities, relationships, and layouts. See appendix for the prompt used in diagram plan generation.
Diagram plan refinement via iterative feedback.
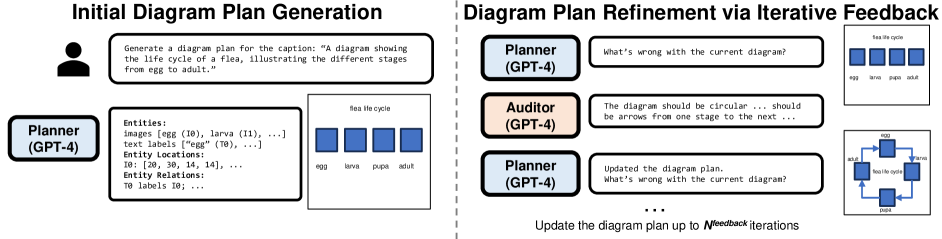
Although GPT-4 (referred to as the planner in Fig. 2) generates a fairly accurate initial diagram plans, we can further refine it to account for potentially missing or improperly arranged entities. To address this issue, we introduce an auditor LLM that checks for any mismatch between the current diagram plan and the input prompt. It then provides feedback, enabling the planner LLM to refine the diagram plans. Our auditor and planner LLMs form a feedback loop to iteratively refine the diagram plans. For this auditor LLM, we employ GPT-4 again but with a different preamble and in-context examples designed to give useful feedback (see appendix for the prompts to initialize the auditor LLM). We repeat the feedback loop for up to iterations, where we use in our experiments. Fig. 2 (right) exemplifies the feedback process. The auditor LLM requests the planner LLM to adjust the orientation of the entities to be more circular and add arrows between the entities to create a better representation of a life cycle. The planner LLM then makes these adjustments, resulting in a better diagram.
3.2 Stage 2: Diagram Generation
As shown in Fig. 3, we first generate the objects following the layouts in the diagram plan with DiagramGLIGEN, our layout-guided diagram generation model based on the GLIGEN denoising diffusion architecture [21]. Then we render text labels on the diagram with the Pillow222https://python-pillow.org Python package.
DiagramGLIGEN: Layout-guided diagram generation.
While existing text-to-image generation models demonstrate photorealistic image generation capabilities, in the text-to-diagram generation task, conveying factual information from the text description is more crucial than producing realistic objects. In our experiments, we observe that Stable Diffusion v1.4 [33], a recent strong text-to-image generation model, often omits important objects, generates incorrect relationships between objects, and generates unreadable text labels (see Sec. 5 and Fig. 5).
To tackle these issues, we introduce DiagramGLIGEN, a layout-guided diagram generation model capable of leveraging the knowledge of text-to-image generation models while adhering closely to the diagram plans. Inspired by GLIGEN [21], a layout-guided image generation model for natural images, we implement DiagramGLIGEN by incorporating gated self-attention layers which take layout grounding inputs into Stable Diffusion v1.4.
Unlike the original GLIGEN model, which can only process objects, we enhance control over diagram layouts by also incorporating text labels and relationships from the diagram plan as part of the layout grounding inputs to our DiagramGLIGEN during training. While DiagramGLIGEN itself does not have good text rendering capability due to the limitations of the Stable Diffusion v1.4 backbone, including text labels as part of the grounding inputs during training reduces the generation of unreadable text during inference by DiagramGLIGEN. For the encoding of objects and their relationships, we employ the CLIP [31] text encoder to represent object descriptions and their relationship descriptions, in a manner similar to GLIGEN [21]. For text label encoding, we use the CLIP image encoder to represent bounding box regions of the text labels in the ground truth diagrams.
We train DiagramGLIGEN on the AI2D-Caption dataset (see Sec. 4.1 for details), which contains annotations of overall diagram captions and bounding-box descriptions for 4.8K scientific diagrams extended from the AI2D dataset [19]. We initialize the parameters of DiagramGLIGEN from GLIGEN, whose gated self-attention layers are trained on 0.67M natural images (not diagram images) with layout annotations, before training on AI2D-Caption dataset. We train DiagramGLIGEN on AI2D-Caption dataset for 15k steps, which takes 12 hours with 8 A6000 GPUs (each 48GB memory).
Text label rendering.
Text labels (e.g., “Sun” labeling the sun object in Fig. 3) of objects in diagrams can effectively assist readers in understanding new concepts [18]. However, as shown in Cho et al. [9], existing text-to-image generation models, including our backbone Stable Diffusion v1.4, still struggle to generate high-quality text labels, resulting in unreadable text. In our diagram generation pipeline, instead of relying on diffusion models for pixel-level generation of text labels, we explicitly render clear text labels on the diagrams following diagram plan with the Pillow Python package.
4 Experimental Setup
In the following subsections, we introduce our AI2D-Caption dataset for the text-to-diagram generation task (Sec. 4.1), baseline models (Sec. 4.2), evaluation metrics (Sec. 4.3), and human evaluation setups (Sec. 4.4).
4.1 AI2D-Caption Dataset
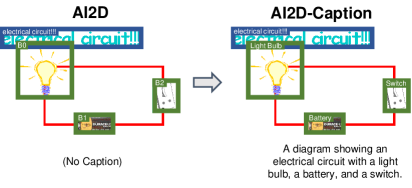
We introduce the AI2D-Caption dataset for the text-to-diagram generation task. AI2D-Caption is built on top of AI2 Diagrams (AI2D) dataset [19], which provides annotations of around 4.9K diagrams covering diverse scientific domains, such as astronomy, biology, and engineering, from Grade 1-6 science textbooks. We select 75 diagrams that cover diverse scientific domains as a test split and used the remaining diagrams for the training split in our experiments. The original AI2D dataset provides annotations for diagrams, including titles, bounding boxes for object/text labels, and text label-object linkages. However, since the dataset is designed for the diagram question answering task rather than diagram generation, the diagram titles are often too short (i.e., usually 1-2 words such as “food web”) and don’t provide enough information to produce diagram plans. Additionally, the dataset doesn’t include descriptions for each object (i.e., each object bounding box is labeled simply as ‘blob’). To address this, we employ LLaVA 1.5 [24], a state-of-the-art multimodal language model, to generate detailed captions and region descriptions of each bounding box in the training diagrams, (see appendix for more details on the caption annotation).
To ensure accurate diagram plans for the LLM in-context examples and accurate information for evaluation, we manually annotate diagram plans (i.e., captions, object/text label bounding boxes, object descriptions, arrows) for 105 diagrams (30 samples from the training split for in-context examples + all 75 from the test split for evaluation). Examples of AI2D and AI2D-Caption annotations are illustrated in Fig. 4. We use all of the training split diagrams with LLaVA 1.5-aided caption and region annotations for DiagramGLIGEN training and baseline fine-tuning, and use the 30 manually annotated diagrams as our planner LLM’s in-context examples. The 75 manually annotated diagrams from the test split are only used for evaluation.
4.2 Baseline Models
We compare our DiagrammerGPT to several baseline models, including Stable Diffusion v1.4 [33], VPGen (Vicuna13B [7] + GLIGEN) [9], and AutomaTikZ [2] (CLiMA-13B). For the baselines, we experiment with zero-shot and fine-tuned (on our AI2D-Caption dataset where applicable) diagram generation. For VPGen, we fine-tune both the Vicuna13B LLM and the GLIGEN generator. As our diagram generation module uses Stable Diffusion v1.4 as its backbone, Stable Diffusion v1.4 is the model most directly comparable to our method.
4.3 Evaluation Metrics
VPEval (Objects, Counts, Relationships, Texts).
We evaluate the diagrams in terms of the presence of objects (object evaluation), the number of objects (count evaluation), the correctness of spatial and connection relationships (relationship evaluation), and the presence of correct text labels (text evaluation) using the VPEval metric [9]. VPEval works by first generating evaluation programs that call specific evaluation modules (e.g., Object, OCR, VQA) and then running the modules to evaluate the image. Each module evaluates different parts of the image (e.g., Object checks object presence). For object, count, and text rendering evaluation, we use the ground-truth diagram plan to determine which evaluation programs to use. For relationship evaluation, following VPEval, we use an LLM (GPT-4) to generate VQA questions that evaluate the spatial/connection relationships of objects in the diagrams (e.g., if the moon is in between the sun and earth or if a light bulb is connected to a battery). While the original VPEval uses BLIP-2 [20] as its visual reasoning model, we employ the recently released LLaVA 1.5 [24] model as our visual reasoning model, as we find it is more faithful in diagram question answering in our initial experiments and is an overall stronger model than BLIP-2 [24].
For object evaluation, LLaVA determines if the object is present. For count evaluation (i.e., if a diagram requires multiple instances of an object), we ask LLaVA if there are exactly instances of the object in the diagram, where represents the count of that object in the ground-truth diagram. For relationship evaluation, we ask LLaVA if the relation (spatial or connection) is true. In our experiments, we find that LLaVA often can generate false positives during relation evaluation, as such we also show human evaluation for object relationships (Sec. 4.4). For text evaluation, in alignment with VPEval, we utilize EasyOCR [1] as the OCR model and check if the target text is detected.
Captioning.
In line with previous works [17, 16, 8], we also use captioning as a way to determine the accuracy of the generated diagrams. We use LLaVA 1.5 [24] to caption each generated diagram and then compare this generated caption with the ground-truth caption. The similarity between the generated and ground-truth captions is evaluated using CIDEr [38] and BERTScore [40].
CLIPScore.
Following previous works [8, 34, 2], we use CLIPScore [15] to measure the similarity between the generated diagram and the original caption/ground-truth diagram. Concretely, we calculate two types of CLIPScore: (1) CLIPScore: cosine similarity between the CLIP image embedding of the generated diagram and the text embedding of the ground-truth caption. (2) CLIPScore: cosine similarity between the CLIP image embeddings of the generated diagram and the ground-truth diagram. We use CLIP ViT-L/14 architecture [31] for these calculations.
| Methods | VPEval (%) | Captioning | CLIPScore | ||||||
|---|---|---|---|---|---|---|---|---|---|
| Object | Count | Text | Relationships | Overall | CIDEr | BERTScore | Img-Txt | Img-Img | |
| Zeroshot | |||||||||
| Stable Diffusion v1.4 | 70.1 | 48.1 | 0.0 | 76.7 | 43.8 | 7.7 | 87.5 | 27.3 | 65.3 |
| VPGen | 64.1 | 39.2 | 0.0 | 69.8 | 41.2 | 6.1 | 87.2 | 25.6 | 61.7 |
| AutomaTikZ | 32.9 | 29.1 | 5.5 | 68.1 | 33.5 | 12.2 | 86.9 | 24.7 | 64.5 |
| Fine-tuned | |||||||||
| Stable Diffusion v1.4 | 75.4 | 44.3 | 0.0 | 73.7 | 46.1 | 18.2 | 88.5 | 30.1 | 68.1 |
| VPGen | 69.1 | 41.8 | 0.0 | 74.6 | 42.9 | 4.2 | 86.9 | 26.4 | 61.9 |
| DiagrammerGPT (Ours) | 87.0 | 54.4 | 33.4 | 79.3 | 65.1 | 31.7 | 90.1 | 32.9 | 74.5 |
4.4 Human Evaluation
Pairwise preference: image-text alignment & object relationships.
We conduct a human analysis comparing our DiagrammerGPT framework to Stable Diffusion v1.4. We choose Stable Diffusion v1.4 fine-tuned on AI2D-Caption for comparison because it is the closest baseline to our DiagrammerGPT and also shows the strongest results among the baselines (see Sec. 5.1). We ask three crowd-sourced annotators from Amazon Mechanical Turk333https://www.mturk.com (AMT) to evaluate the diagrams generated for each prompt (see appendix for AMT setup details). For each prompt, we show diagrams generated by both our DiagrammerGPT and the fine-tuned Stable Diffusion v1.4 (their positions are randomly shuffled for each instance to prevent selection biases) and ask the annotators to indicate their preference based on (1) alignment to the input prompt (e.g., how well does the generated diagram reflect the input prompt), and (2) the accuracy of the generated relationships between objects (e.g., spatial relationships and arrows/lines). The agreement among the three annotators is taken as the final judgment.
Human error analysis of the two stages.
As our DiagrammerGPT pipeline consists of two stages, it is important to understand where any errors in our pipeline come from. In the diagram planning stage, we assess (1) Object Presence: whether all required objects for the diagrams are present (e.g., for a lunar eclipse, the generated diagram plan should include a sun, an earth, and a moon), and (2) Object Relationships: if the objects have proper relationships to each other (e.g., for a lunar eclipse, the bounding box of the earth should be situated between the bounding boxes of the sun and the moon or for an electrical circuit, all components should be connected). We conduct this evaluation for the diagram plan before and after the refinement step. In the diagram generation stage, we also evaluate on the above two metrics. We have an expert annotator rate both stages on a Likert scale from 1 to 5 for 25 layouts/images. By analyzing errors at each stage, we can determine which components are reliable and which lead to inaccuracies.
5 Results and Discussion
In the following sections, we show our primary quantitative results (Sec. 5.1), human evaluation on pairwise preference study and error analysis (Sec. 5.2), qualitative analysis (Sec. 5.3), additional analysis about open-domain generation, vector graphic diagram generation in different platforms, human-in-the-loop diagram plan editing, and multimodal planner/auditor LLMs (Sec. 5.4), and finally ablation studies on the DiagramGLIGEN design choices (Sec. 5.5).
5.1 Quantitative Results
VPEval.
Table 1 left block shows the VPEval results. For both Stable Diffusion v1.4 and VPGen baselines, fine-tuning improves the score for object skill (e.g., 70.1 75.4 for Stable Diffusion v1.4, and 64.1 69.1 for VPGen), but does not help much or sometimes decreasing scores for count (48.1 44.3 for Stable Diffusion v1.4, and 39.2 41.8 for VPGen). For relationships, it hurts Stable Diffusion v1.4 slightly (76.7 73.7) and helps VPGen (69.8 74.6 for). For text, both models achieve 0 scores before and after fine-tuning. Our DiagrammerGPT outperforms both zeroshot and fine-tuned baselines on both overall and skill-specific VPEval scores, showcasing the strong layout control, object relationship representation, and accurate text rendering capability of our diagram generation framework.
Captioning (text-text similarity).
Table 1 middle block shows captioning scores (with LLaVA 1.5). Our DiagrammerGPT outperforms both the zeroshot and fine-tuned baselines indicating our generated diagrams have more relevant information to the input prompt than the baselines (which is a critical aspect of diagrams). Our DiagrammerGPT significantly outperforms both fine-tuned VPGen (31.7 vs. 4.2) and fine-tuned Stable Diffusion v1.4 (31.7 vs. 18.2) for CIDEr and also achieves a few higher points on BERTScore.
CLIPScore (image-text and image-image similarities).
Table 1 right block shows CLIPScore (with CLIP-ViT L/14). Our DiagrammerGPT outperforms the zeroshot and fine-tuned baselines indicating our generated diagrams more closely reflect the input prompt (image-text similarity) and resemble the ground-truth diagrams (image-image alignment). For CLIPScore, DiagrammerGPT has slight improvement over fine-tuned Stable Diffusion v1.4 (32.9 vs. 30.1). For CLIPScore, DiagrammerGPT has a larger improvement over fine-tuned Stable Diffusion v1.4 (74.5 vs. 68.1).
| Evaluation category | Human Preference (%) | ||
|---|---|---|---|
| DiagrammerGPT | SD v1.4 | Tie | |
| Image-Text Alignment | 36 | 20 | 44 |
| Object Relationships | 48 | 30 | 22 |
5.2 Human Evaluation
Pairwise preference: image-text alignment & object relationships.
As discussed in Sec. 4.4, we conduct a human preference study, comparing our DiagrammerGPT and its closest/the strongest baseline, fine-tuned Stable Diffusion v1.4 in image-text alignment and object relationships. As shown in Table 2, our DiagrammerGPT achieves a higher preference than Stable Diffusion v1.4 in both image-text alignment (36% vs 20%) and object relationships (48% vs 30%) criteria.
| Stage 1: Diagram Planning (with GPT-4) | Stage 2: Diagram Generation (with DiagramGLIGEN) | ||||
| Initial diagram plan | Diagram plan after refinement | Final Diagram | |||
| Objects Presence () | Object Relations () | Objects Presence () | Object Relations () | Objects Presence () | Object Relations () |
| 4.96 | 4.56 | 4.96 | 4.72 | 2.96 | 3.36 |
Human error analysis of the two stages.
Table 3 shows the step-by-step error analysis results (see Sec. 4.4 for the setup). On the diagram plans before/after refinement and the final diagrams, we evaluate two aspects on a 1-5 Likert scale: (1) Object Presence - whether all required objects for the diagram are present and (2) Object Relationship - if the objects have proper relationships to each (e.g., arrows/lines as well as spatial relationships. Our diagram plans exhibit high scores on both object presence (4.96) and object relationship (4.56) even before the refinement (Sec. 3.2), and refinement increases the object relationship scores even further (4.56 4.72) by adjusting the entity layouts from the initial diagram plan. Fig. 6 exemplifies the improvement in diagram plan during the refinement process (e.g., in the bottom example, the moon phrases and arrow positions are adjusted). Even though the object presence and relationship scores drop during the diagram generation stage (with DiagramGLIGEN), our DiagrammerGPT still outperforms other baseline models on metrics including VPEval, Captioning, CLIPScore (see Table 1), and human evaluation (see Table 2). DiagramGLIGEN often misses the objects and relationships indicated by the diagram plan due to the limited capacity. This indicates that our DiagrammerGPT could generate more accurate diagrams, once we have access to a layout-guided image generation backbone model stronger than Stable Diffusion v1.4 architecture.
5.3 Qualitative Analysis
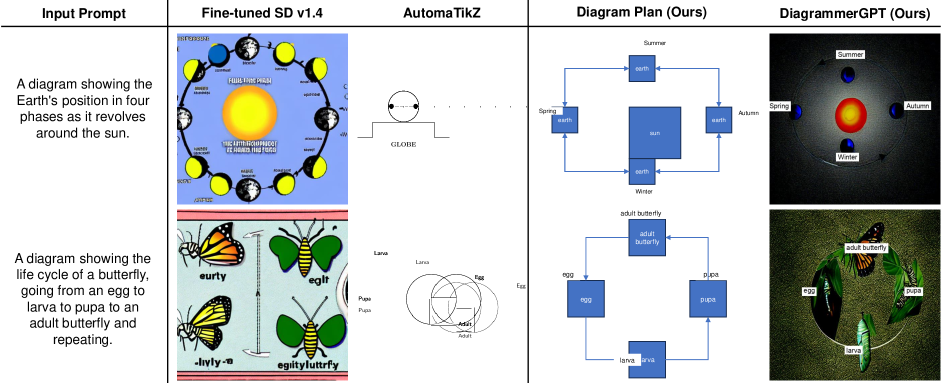
Comparison with baselines.
Fig. 5 shows example diagrams generated by the baselines (Stable Diffusion v1.4 and AutomaTikZ) and our DiagrammerGPT (both diagram plan and final generation diagram) on the AI2D-Caption test split. Our diagram plans strongly reflect the prompts and the final diagrams are more aligned to the input prompts. In Fig. 5 top example, our diagram correctly shows the earth in four phases revolving around the sun and in the second example, our diagram plan correctly represents the life cycle of a butterfly and the generated diagram captures the circular flow of the diagram plan as well most aspects of the life cycle. Stable Diffusion v1.4 either over- or under-generates objects in the image (e.g., too many earths in the first example and missing egg/larva/pupa stages in Fig. 5 bottom example), and AutomaTikZ fails to generate proper layouts and objects. Although our generated diagram plans are generally correct, however, sometimes DiagramGLIGEN can fail to properly follow all aspects (e.g., the egg is misdrawn and the larva/pupa are swapped in Fig. 5 bottom example). As noted in Sec. 5.2, once a better backbone becomes available, our DiagramGLIGEN can produce better diagrams following the diagram plans.
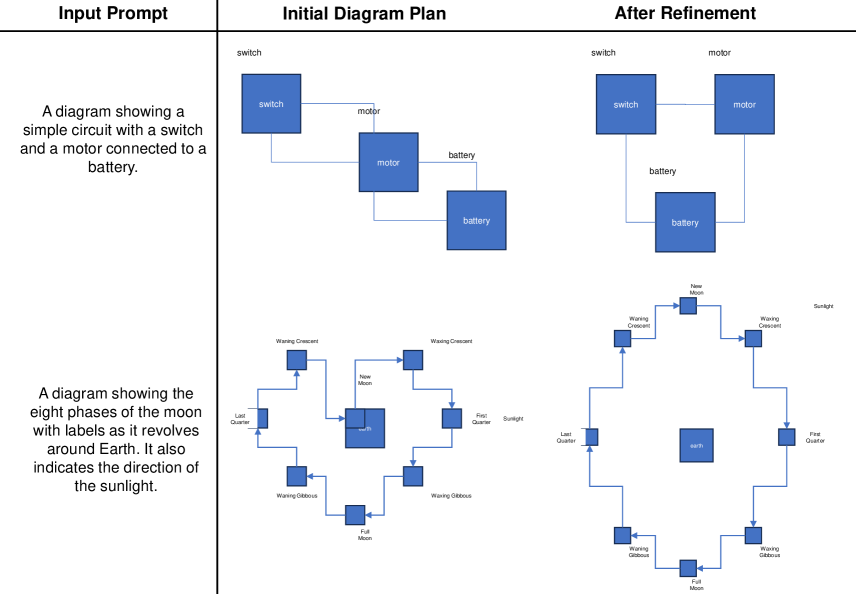
Diagram plan refinement.
In Fig. 6, we show how our diagram refinement step (see Sec. 3.1) improves the diagram plans. In the top example, the switch is not connected to the battery, thus does not affect the circuit. After refinement, the connections are corrected so the switch is now also connected to the circuit and the layouts are adjusted to have a more straightforward flow. In the bottom example, the moon phase of ‘New Moon’ is too low and overlaps with the ‘Earth’ object. After refinement, there is no more overlap.
5.4 Analysis: Open-Domain, Open-Platform, Human-in-the-Loop, GPT-4Vision Planner
Open-domain diagram generation.
Our main diagram generation experiments are conducted on diverse domains such as astronomy, biology, and engineering which are included in the LLM planner’s in-context examples. However, given that the in-context examples do not encompass all diagram domains, we experiment with generating diagrams in areas not covered by our LLM in-context examples, such as geology and botany to assess whether our DiagrammerGPT maintains its ability to produce more accurate diagrams in previously unseen domains.
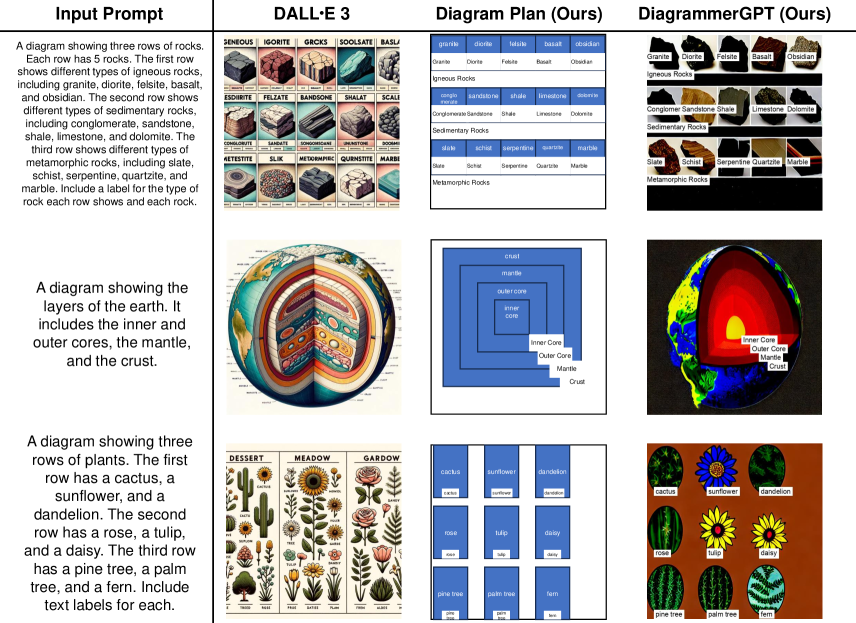
In Fig. 7, we demonstrate that our planner LLM can extend its capabilities to domains beyond the three specific areas (astronomy, biology, and engineering) for which we have in-context examples. As shown in the figure, our planner LLM generates fairly accurate layouts. While our DiagramGLIGEN struggles in some cases, it is able to strongly adhere to the diagram plan. As mentioned in Sec. 5.2, once a stronger layout-guided image generation model than GLIGEN with Stable Diffusion v1.4 backbone is available, our DiagrammerGPT can produce higher quality results. In Fig. 7, we also compare the recently released DALL-E 3 [28] model. We find that DALL-E 3 generally produces images with good aesthetic style but tends to generate diagrams with redundant and crowded objects (e.g., excessive unnecessary text descriptions in the rock and Earth examples, and an overabundance of plants in the third example). It also continues to struggle with creating accurate diagrams that adhere to a prompt (e.g., generating incorrect layers in the earth example and generating three columns of plants instead of three rows in the plant example). The DALL-E 3 system card [28] also notes that DALL-E 3 tends to generate scientifically inaccurate information in diagrams.
Vector graphic diagram generation in different platforms.
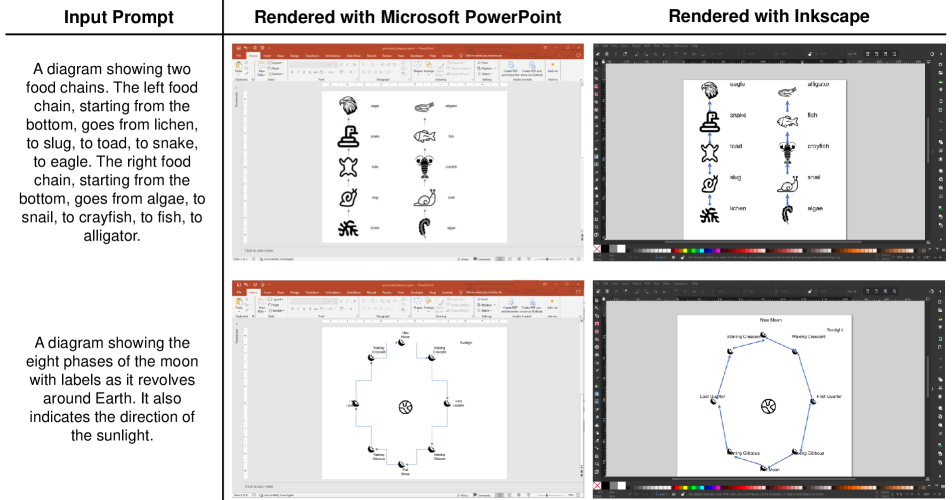
Although our primary focus is on a pixel-level diagram generation pipeline with DiagramGLIGEN, our diagram plans can also facilitate the creation of vector graphic diagrams. These diagrams afford users significant flexibility for further edits and personalization of their diagram layouts, such as changing colors, fonts, and object positions, or altering the diagram size without degrading quality (see subsequent paragraph). To achieve this, we render our diagram plans in PowerPoint via VBA language444https://learn.microsoft.com/en-us/office/vba/api/overview/powerpoint and in Inkscape555https://inkscape.org via a Python scripting extension.666 https://github.com/spakin/SimpInkScr While we experiment with these two platforms, our diagram plans can be flexibly exported to any platform that supports script integration. In both platforms, we integrate features for text and arrows/lines to delineate object text labels and relationships respectively. We represent objects using icons, which are retrieved via the Noun Project Icons API based on corresponding text descriptions.777https://thenounproject.com/api/
Fig. 8 presents examples of vector graphic diagrams. Both examples deliver promising results by effectively conveying the crucial information and layouts described in the input text prompts. However, they also exhibit certain limitations: (1) inconsistency in icon styles: e.g., the eagle and snake icons are rendered in different drawing styles in the example from the top of Fig. 8; (2) limited icon retrieval capability: occasionally, the retrieval model outputs incorrect icons, or suitable icons corresponding to the text description do not exist in the database, e.g., the moon icons in the bottom example of Fig. 8 are all identical; the diagram could be enhanced if the icon retrieval module supplied more detailed icons representing different phases of the moon. As the diagrams are now editable via these platforms, these limitations can be addressed by end-users editing the diagram to their specific liking (see paragraph below).
Human-in-the-loop diagram plan editing.
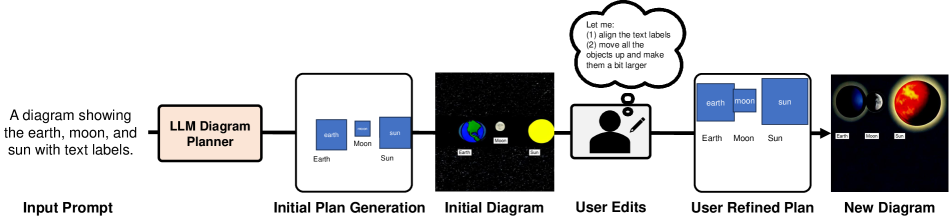
With the diagram plans being rendered in vector graphic platforms, as mentioned above, our DiagrammerGPT can provide an editable diagram plan, allowing for human-in-the-loop editing. As illustrated in Fig. 9, our framework first generates an initial diagram plan along with the rendered image. Users can then review the generated layouts/diagrams and make adjustments based on their needs/wants (e.g., move the objects, add/remove objects, adjust object sizes, etc.). With the human-refined diagram plan, users can either keep it in vector format and use icons (as mentioned in the previous paragraph) or give it back to DiagramGLIGEN and then create pixel-level diagrams, resulting in diagrams/layouts that are better suited to end-users requirements.
GPT-4 vs. GPT-4Vision for diagram plan creation and refinement.
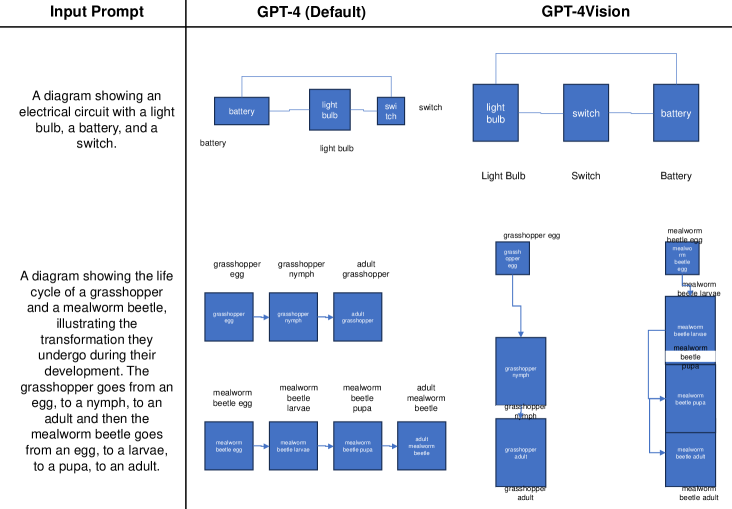
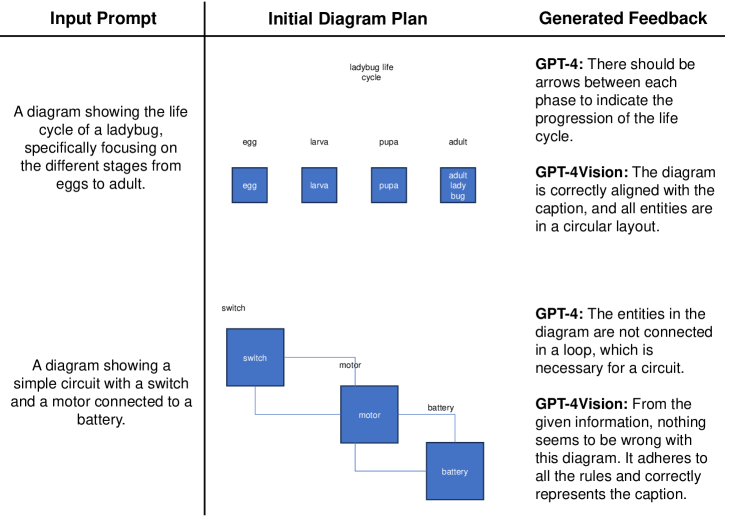
As described in Sec. 3.2, our DiagrammerGPT employs a text-only GPT-4 model for diagram planning and refinement. To explore whether a multimodal language model can offer improvements over text-only GPT-4, we experiment with using the recently introduced GPT-4Vision (GPT-4V) model [30] as the planner and auditor LLM during the diagram generation and refinements steps. As the GPT-4V model does not provide API access yet, we conduct a small-scale qualitative study via the ChatGPT web UI. In our experiments, for the diagram plan creation stage (see Sec. 3.1), GPT-4V does not provide improvements over text-only GPT-4. In Fig. 10, we present a comparison between the diagram plans generated by GPT-4 and GPT-4V. GPT-4V does not produce diagram plans that are better than text-only GPT-4, suggesting that our text-only representation is robust enough until better or fine-tuned versions of GPT-4V become available for diagrams. Similarly, during the diagram refinement step (see Sec. 3.1), we observed that GPT-4V tends to overestimate correctness when compared to text-only GPT-4, further indicating the strength of our text representation. Fig. 11 shows two examples comparing the models.While text-only GPT-4 is not perfect, it can identify some errors, whereas GPT-4V says the diagram does not need improvement.
5.5 Ablation Studies
We show ablation studies on our design choices with DiagramGLIGEN: the number of denoising steps with layout guidance and whether to only update the gated self-attention layers parameters.
Number of denoising steps with layout guidance.
The number of denoising steps with layout guidance (i.e., with the gated self-attention layer activated in each transformer block of the diffusion UNet), denoted as , is a crucial hyper-parameter in DiagramGLIGEN. A larger value indicates stronger layout control. Table 4 presents an ablation study using varying values. A smaller value enhances object generation, while a larger value improves count performance. This observation aligns with intuition: rigorous layout control more effectively prevents the generation of extraneous objects in the background but may detract from the visual realism of the generated objects, which is also observed in [21, 23]. We set the default value for as 10 steps, as it ensures a good balance of accuracy for objects and counts while achieving optimal performance in depicting object relationships.
Fine-tuning: all layers vs. layout layers.
In Table 5, we present an ablation study comparing the fine-tuning of only the layout control layers in DiagramGLIGEN with fine-tuning of the entire model, including the Stable Diffusion backbone. Full fine-tuning enhances performance and improves the visual quality of the diagrams. Therefore, we employ the fully fine-tuned version as our default model for all subsequent experiments.
| # Layout guidance steps | VPEval | |||
|---|---|---|---|---|
| Object | Count | Text | Relationships | |
| steps | 87.7 | 51.9 | 34.6 | 75.4 |
| steps (default) | 87.0 | 54.4 | 33.4 | 79.3 |
| steps | 82.1 | 58.2 | 34.4 | 77.1 |
| Updated parameters | VPEval | Captioning | CLIPScore |
|---|---|---|---|
| Overall | BERTScore | Img-Txt | |
| GatedSA Layers only | 62.8 | 89.0 | 31.0 |
| All Layers (default) | 65.1 | 90.1 | 32.9 |
6 Conclusion
In this work, we propose DiagrammerGPT, a novel two-stage text-to-diagram generation framework that leverages the knowledge of LLMs for planning and refining the overall diagram plans. In the first stage, our DiagrammerGPT first generates a ‘diagram plan’ using a planner LLM, which is then improved via ‘feedback’ rounds with an auditor LLM. In the second stage, we introduce DiagramGLIGEN, a diagram generator (trained on our new AI2D-Caption dataset), paired with a text label rendering module in order to generate the diagram following the diagram plan. We demonstrate that our DiagrammerGPT framework archives more semantically accurate layouts in diagram generation than baseline models in both quantitative and qualitative analysis. In addition, we provide comprehensive human error analysis, ablation studies, and analysis about open-domain diagram generation, vector graphic diagram generation in different platforms, human-in-the-loop diagram plan editing, and multimodal planner/auditor LLMs. We hope our work inspires future research on leveraging the capabilities of LLM and layout-guided image generation models for automatic diagram generation tasks.
Acknowledgement
This work was supported by NSF-AI Engage Institute DRL211263, ARO W911NF2110220, DARPA MCS N66001-19-2-4031, ONR N00014-23-1-2356, DARPA ECOLE Program No. #HR00112390060, and Accelerate Foundation Models Research program. The views, opinions, and/or findings contained in this article are those of the authors and not of the funding agency.
References
- [1] J. AI. Easyocr: Ready-to-use ocr with 80+ supported languages and all popular writing scripts including latin, chinese, arabic, devanagari, cyrillic and etc., 2023.
- [2] J. Belouadi, A. Lauscher, and S. Eger. Automatikz: Text-guided synthesis of scientific vector graphics with tikz. ArXiv, abs/2307.01952, 2023.
- [3] T. B. Brown, B. Mann, N. Ryder, M. Subbiah, J. Kaplan, P. Dhariwal, A. Neelakantan, P. Shyam, G. Sastry, A. Askell, S. Agarwal, A. Herbert-Voss, G. Krueger, T. Henighan, R. Child, A. Ramesh, D. M. Ziegler, J. Wu, C. Winter, C. Hesse, M. Chen, E. Sigler, M. Litwin, S. Gray, B. Chess, J. Clark, C. Berner, S. McCandlish, A. Radford, I. Sutskever, and D. Amodei. Language Models are Few-Shot Learners. In NeurIPS, 2020.
- [4] H. Chang, H. Zhang, J. Barber, A. Maschinot, J. Lezama, L. Jiang, M.-H. Yang, K. Murphy, W. T. Freeman, M. Rubinstein, Y. Li, and D. Krishnan. Muse: Text-To-Image Generation via Masked Generative Transformers. In ICML, 2023.
- [5] J. Chen, Y. Huang, T. Lv, L. Cui, Q. Chen, and F. Wei. Textdiffuser: Diffusion models as text painters. ArXiv, abs/2305.10855, 2023.
- [6] X. Chen, M. Lin, N. Schärli, and D. Zhou. Teaching large language models to self-debug. ArXiv, abs/2304.05128, 2023.
- [7] W.-L. Chiang, Z. Li, Z. Lin, Y. Sheng, Z. Wu, H. Zhang, L. Zheng, S. Zhuang, Y. Zhuang, J. E. Gonzalez, I. Stoica, and E. P. Xing. Vicuna: An open-source chatbot impressing gpt-4 with 90%* chatgpt quality, March 2023.
- [8] J. Cho, A. Zala, and M. Bansal. Dall-eval: Probing the reasoning skills and social biases of text-to-image generation models. In ICCV, 2023.
- [9] J. Cho, A. Zala, and M. Bansal. Visual programming for text-to-image generation and evaluation. In NeurIPS, 2023.
- [10] A. Chowdhery, S. Narang, J. Devlin, M. Bosma, G. Mishra, A. Roberts, P. Barham, H. W. Chung, C. Sutton, S. Gehrmann, P. Schuh, K. Shi, S. Tsvyashchenko, J. Maynez, A. Rao, P. Barnes, Y. Tay, N. M. Shazeer, V. Prabhakaran, E. Reif, N. Du, B. C. Hutchinson, R. Pope, J. Bradbury, J. Austin, M. Isard, G. Gur-Ari, P. Yin, T. Duke, A. Levskaya, S. Ghemawat, S. Dev, H. Michalewski, X. García, V. Misra, K. Robinson, L. Fedus, D. Zhou, D. Ippolito, D. Luan, H. Lim, B. Zoph, A. Spiridonov, R. Sepassi, D. Dohan, S. Agrawal, M. Omernick, A. M. Dai, T. S. Pillai, M. Pellat, A. Lewkowycz, E. Moreira, R. Child, O. Polozov, K. Lee, Z. Zhou, X. Wang, B. Saeta, M. Díaz, O. Firat, M. Catasta, J. Wei, K. S. Meier-Hellstern, D. Eck, J. Dean, S. Petrov, and N. Fiedel. Palm: Scaling language modeling with pathways. ArXiv, abs/2204.02311, 2022.
- [11] H. W. Chung, L. Hou, S. Longpre, B. Zoph, Y. Tay, W. Fedus, E. Li, X. Wang, M. Dehghani, S. Brahma, A. Webson, S. S. Gu, Z. Dai, M. Suzgun, X. Chen, A. Chowdhery, D. Valter, S. Narang, G. Mishra, A. W. Yu, V. Zhao, Y. Huang, A. M. Dai, H. Yu, S. Petrov, E. H. hsin Chi, J. Dean, J. Devlin, A. Roberts, D. Zhou, Q. V. Le, and J. Wei. Scaling instruction-finetuned language models. ArXiv, abs/2210.11416, 2022.
- [12] X. Dai, J. Hou, C.-Y. Ma, S. Tsai, J. Wang, R. Wang, P. Zhang, S. Vandenhende, X. Wang, A. Dubey, M. Yu, A. Kadian, F. Radenovic, D. Mahajan, K. Li, Y. Zhao, V. Petrovic, M. K. Singh, S. Motwani, Y. Wen, Y. Song, R. Sumbaly, V. Ramanathan, Z. He, P. Vajda, and D. Parikh. Emu: Enhancing image generation models using photogenic needles in a haystack, 2023.
- [13] W. Feng, W. Zhu, T.-j. Fu, V. Jampani, A. Akula, X. He, S. Basu, X. E. Wang, and W. Y. Wang. Layoutgpt: Compositional visual planning and generation with large language models. NeurIPS, 2023.
- [14] I. Goodfellow, J. Pouget-Abadie, M. Mirza, B. Xu, D. Warde-Farley, S. Ozair, A. Courville, and Y. Bengio. Generative adversarial networks. Advances in Neural Information Processing Systems, 3, 06 2014.
- [15] J. Hessel, A. Holtzman, M. Forbes, R. L. Bras, and Y. Choi. CLIPScore: a reference-free evaluation metric for image captioning. In EMNLP, 2021.
- [16] T. Hinz, S. Heinrich, and S. Wermter. Semantic Object Accuracy for Generative Text-to-Image Synthesis. IEEE Transactions on Pattern Analysis and Machine Intelligence, pages 1–1, 2020.
- [17] S. Hong, D. Yang, J. Choi, and H. Lee. Inferring Semantic Layout for Hierarchical Text-to-Image Synthesis. In CVPR, 2018.
- [18] A. Johnson, K. Butcher, G. Ozogul, and M. Reisslein. Introductory circuit analysis learning from abstract and contextualized circuit representations: Effects of diagram labels. Education, IEEE Transactions on, 57:160–168, 08 2014.
- [19] A. Kembhavi, M. Salvato, E. Kolve, M. Seo, H. Hajishirzi, and A. Farhadi. A diagram is worth a dozen images. In B. Leibe, J. Matas, N. Sebe, and M. Welling, editors, ECCV, pages 235–251, 2016.
- [20] J. Li, D. Li, S. Savarese, and S. C. H. Hoi. Blip-2: Bootstrapping language-image pre-training with frozen image encoders and large language models. In ICML, volume abs/2301.12597, 2023.
- [21] Y. Li, H. Liu, Q. Wu, F. Mu, J. Yang, J. Gao, C. Li, and Y. J. Lee. Gligen: Open-set grounded text-to-image generation. In CVPR, pages 22511–22521, 2023.
- [22] L. Lian, B. Li, A. Yala, and T. Darrell. Llm-grounded diffusion: Enhancing prompt understanding of text-to-image diffusion models with large language models. arXiv preprint arXiv:2305.13655, 2023.
- [23] H. Lin, A. Zala, J. Cho, and M. Bansal. Videodirectorgpt: Consistent multi-scene video generation via llm-guided planning. arXiv preprint arXiv:2309.15091, 2023.
- [24] H. Liu, C. Li, Y. Li, and Y. J. Lee. Improved baselines with visual instruction tuning, 2023.
- [25] R. Liu, D. Garrette, C. Saharia, W. Chan, A. Roberts, S. Narang, I. Blok, R. Mical, M. Norouzi, and N. Constant. Character-aware models improve visual text rendering. In Proceedings of the 61st Annual Meeting of the Association for Computational Linguistics (Volume 1: Long Papers), pages 16270–16297, Toronto, Canada, July 2023. Association for Computational Linguistics.
- [26] A. Madaan, N. Tandon, P. Gupta, S. Hallinan, L. Gao, S. Wiegreffe, U. Alon, N. Dziri, S. Prabhumoye, Y. Yang, S. Welleck, B. P. Majumder, S. Gupta, A. Yazdanbakhsh, and P. Clark. Self-refine: Iterative refinement with self-feedback. ArXiv, abs/2303.17651, 2023.
- [27] N. Miao, Y. W. Teh, and T. Rainforth. Selfcheck: Using llms to zero-shot check their own step-by-step reasoning. ArXiv, abs/2308.00436, 2023.
- [28] OpenAI. Dall-e 3 system card, 2023.
- [29] OpenAI. Gpt-4 technical report. ArXiv, abs/2303.08774, 2023.
- [30] OpenAI. Gpt-4v(ision) system card, 2023.
- [31] A. Radford, J. W. Kim, C. Hallacy, A. Ramesh, G. Goh, S. Agarwal, G. Sastry, A. Askell, P. Mishkin, J. Clark, G. Krueger, and I. Sutskever. Learning transferable visual models from natural language supervision. In ICML, 2021.
- [32] A. Ramesh, P. Dhariwal, A. Nichol, C. Chu, and M. Chen. Hierarchical Text-Conditional Image Generation with CLIP Latents, 2022.
- [33] R. Rombach, A. Blattmann, D. Lorenz, P. Esser, and B. Ommer. High-resolution image synthesis with latent diffusion models. 2022 IEEE/CVF Conference on Computer Vision and Pattern Recognition (CVPR), pages 10674–10685, 2021.
- [34] C. Saharia, W. Chan, S. Saxena, L. Li, J. Whang, E. Denton, S. K. S. Ghasemipour, B. K. Ayan, S. S. Mahdavi, R. G. Lopes, T. Salimans, J. Ho, D. J. Fleet, and M. Norouzi. Photorealistic Text-to-Image Diffusion Models with Deep Language Understanding. In NeurIPS, 2022.
- [35] T. Tantau. pgf – a portable graphic format for tex, 2007.
- [36] H. Touvron, T. Lavril, G. Izacard, X. Martinet, M.-A. Lachaux, T. Lacroix, B. Rozière, N. Goyal, E. Hambro, F. Azhar, A. Rodriguez, A. Joulin, E. Grave, and G. Lample. Llama: Open and efficient foundation language models. ArXiv, abs/2302.13971, 2023.
- [37] H. Touvron, L. Martin, K. R. Stone, P. Albert, A. Almahairi, Y. Babaei, N. Bashlykov, S. Batra, P. Bhargava, S. Bhosale, D. M. Bikel, L. Blecher, C. C. Ferrer, M. Chen, G. Cucurull, D. Esiobu, J. Fernandes, J. Fu, W. Fu, B. Fuller, C. Gao, V. Goswami, N. Goyal, A. S. Hartshorn, S. Hosseini, R. Hou, H. Inan, M. Kardas, V. Kerkez, M. Khabsa, I. M. Kloumann, A. V. Korenev, P. S. Koura, M.-A. Lachaux, T. Lavril, J. Lee, D. Liskovich, Y. Lu, Y. Mao, X. Martinet, T. Mihaylov, P. Mishra, I. Molybog, Y. Nie, A. Poulton, J. Reizenstein, R. Rungta, K. Saladi, A. Schelten, R. Silva, E. M. Smith, R. Subramanian, X. Tan, B. Tang, R. Taylor, A. Williams, J. X. Kuan, P. Xu, Z. Yan, I. Zarov, Y. Zhang, A. Fan, M. Kambadur, S. Narang, A. Rodriguez, R. Stojnic, S. Edunov, and T. Scialom. Llama 2: Open foundation and fine-tuned chat models. ArXiv, abs/2307.09288, 2023.
- [38] R. Vedantam, C. L. Zitnick, and D. Parikh. Cider: Consensus-based image description evaluation. 2015 IEEE Conference on Computer Vision and Pattern Recognition (CVPR), pages 4566–4575, 2014.
- [39] J. Yu, Y. Xu, J. Y. Koh, T. Luong, G. Baid, Z. Wang, V. Vasudevan, A. Ku, Y. Yang, B. K. Ayan, B. Hutchinson, W. Han, Z. Parekh, X. Li, H. Zhang, J. Baldridge, and Y. Wu. Scaling Autoregressive Models for Content-Rich Text-to-Image Generation. Transactions on Machine Learning Research, 2022.
- [40] T. Zhang, V. Kishore, F. Wu, K. Q. Weinberger, and Y. Artzi. BERTScore: Evaluating text generation with BERT. In Proceedings of the International Conference on Learning Representations, 2020.
Appendix
In this appendix, we provide LLM prompt templates and diagram plans used in the diagram planning stage (Appendix A), additional AI2D-Caption collection details, (Appendix B), human evaluation setup details (Appendix C), LLM API costs (Appendix D), and limitations (Appendix E).
Appendix A LLM Prompt Templates and Diagram Plans
Prompt templates.
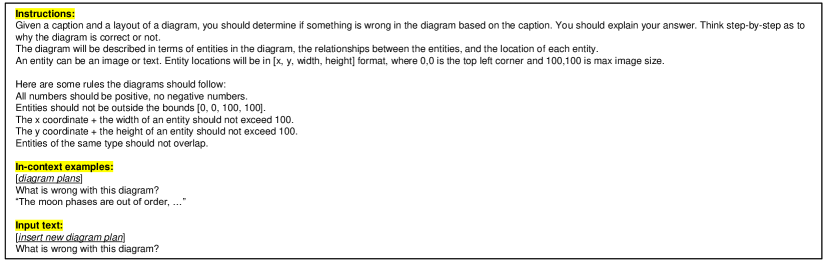
In Fig. 13 and Fig. 14, we show the prompt templates for the planner LLM and auditor LLM, respectively. For both LLMs we provide 10 in-context examples followed by the inputs. For the planner LLM, we give it the caption and the topic of the caption (e.g., astronomy, biology, etc.). For the auditor LLM, we give the diagram plan generated by the planner and ask if there are any issues.
Full diagram plan example.
Fig. 12 shows an example of a fully generated diagram plan by our LLM planner for the prompt “A diagram showing the life cycle of a butterfly, going from an egg to larva to pupa to an adult butterfly and repeating.” This diagram plan corresponds to the second example in Fig. 5.
Required Entities:
egg image (I0)
larva image (I1)
pupa image (I2)
adult butterfly image (I3)
“egg” text label (T0)
“larva” text label (T1)
“pupa” text label (T2)
“adult butterfly” text label (T3)
Entity Relationships:
I3 has an arrow to I0
T3 labels I3
I1 has an arrow to I2
T0 labels I0
I0 has an arrow to I1
T2 labels I2
I2 has an arrow to I3
T1 labels I1
Entity Locations:
I0 is located at [24, 50, 14, 14]
I1 is located at [50, 74, 14, 14]
I2 is located at [74, 50, 14, 14]
I3 is located at [50, 24, 14, 14]
T0 is located at [20, 44, 10, 4]
T1 is located at [44, 80, 10, 4]
T2 is located at [80, 44, 10, 4]
T3 is located at [44, 20, 10, 4]
Appendix B AI2D-Caption Collection Details
To create the AI2D-Caption dataset described in Sec. 4.1, we employ LLaVA 1.5 [24], a state-of-the-art multimodal language model, to generate captions and bounding box region descriptions in AI2D diagrams. To generate captions for each AI2D diagrams, we present the diagram to LLaVA 1.5 and prompt it with the question “What is this diagram showing?”. To collect region descriptions of the bounding boxes in AI2D, we first overlay the bounding box annotations of each object on the diagram, by assigning each box a label (i.e., box 1 would get label “B1”, box 2 would get label “B2”, etc..). Then we provide this annotated image to LLaVA 1.5 and ask the model to describe each box’s content (e.g., “what is the object labeled by ‘B1”’?).
Appendix C Human Evaluation Setup Details
We employ crowd-workers from Amazon Mechanical Turk (AMT) for our human preference study. To ensure high-quality annotations, we set the following requirements for the workers: they must possess an AMT Masters qualification, have completed more than 1000 HITs, maintain an approval rating above 95%, and come from the United States, Great Britain, Australia, or Canada, given that our task is in English. We pay workers $0.06 to compare two diagrams (roughly $14-15/hr).
Appendix D LLM API Costs
The average input token length for the planner stands at 4.6K, while the average output token length is 0.5K. Generating a diagram plan using GPT-4 costs $0.17 USD.
Appendix E Limitations
Our framework can benefit many applications, such as educational settings, presentation/paper creation, and human-in-the-loop diagram generation/modification). However, akin to other text-to-diagram/text-to-image generation frameworks, our framework can also make some errors and be utilized for potentially harmful purposes (e.g., creating false information or misleading diagrams), and thus should be used with caution in real-world applications (with human supervision, e.g., as described in Sec. 5.4 human-in-the-loop diagram plan editing). Also, generating a diagram plan using the strongest LLM APIs can be costly, similar to other recent LLM-based frameworks. We hope that advances in quantization/distillation and open-source models will continue to lower the inference cost of LLMs. Lastly, DiagramGLIGEN is based on the pretrained weights of GLIGEN and Stable Diffusion v1.4. Therefore, we face similar limitations to these models, including deviations related to the distribution of training datasets, imperfect generation quality, and only understanding the English corpus.