Chemical Analysis of the Brightest Star of the Cetus II Ultra-Faint Dwarf Galaxy Candidate111This paper includes data gathered with the 6.5m Magellan Telescopes located at Las Campanas Observatory, Chile.
Abstract
We present a detailed chemical abundance analysis of the brightest star in the ultra-faint dwarf (UFD) galaxy candidate Cetus II from high-resolution Magellan/MIKE spectra. For this star, DES J011740.53-173053, abundances or upper limits of 18 elements from Carbon to Europium are derived. Its chemical abundances generally follow those of other UFD galaxy stars, with a slight enhancement of the -elements (Mg, Si, and Ca) and low neutron-capture element (Sr, Ba, Eu) abundances supporting the classification of Cetus II as a likely UFD. The star exhibits lower Sc, Ti, and V abundances than Milky Way (MW) halo stars with similar metallicity. This signature is consistent with yields from a supernova (SN) originating from a star with a mass of 11.2 M⊙. In addition, the star has a Potassium abundance of which is somewhat higher than the K abundances of MW halo stars with similar metallicity, a signature which is also present in a number of UFD galaxies. A comparison including globular clusters (GC) and stellar stream stars suggests that high K is a specific characteristic for some UFD galaxy stars and can thus be used to help classify objects as UFD galaxies.
DES-2023-0757 \reportnumFERMILAB-PUB-23-373-PPD
1 Introduction
Stars maintain in their atmospheres a fingerprint of the chemical composition of their birth environment and thereby also contain information about the stellar generations that were present before them. They can therefore be used to study chemical enrichment, which is a useful probe to characterize the nature of the stellar environment. Variations in chemical abundances across different stellar associations can give insight into properties such as different timescales for chemical enrichment and variations in stellar initial mass functions.
In recent years, photometric surveys such as the Dark Energy Survey and Pan-STARRS (DES Collaboration, 2005; Bechtol et al., 2015; Koposov et al., 2015; Drlica-Wagner et al., 2015; Laevens et al., 2015) have detected a large number of stellar overdensities around the Milky Way (MW). In the process of characterizing these systems, chemical abundance analysis has proven to be a valuable tool to discern the physical nature of the associations and sometimes reveal unusual chemical abundance patterns. Although further observations of a few of these overdensities have determined that they are not genuine physical objects (Cantu et al., 2021), nearly all of the overdensities have been found to be either star clusters or ultra-faint dwarf (UFD) galaxies (Laevens et al., 2014; Luque et al., 2018; Simon, 2019).
Star clusters can be sorted into different categories: stellar associations, open clusters, or GCs (Trumpler, 1930; Krumholz et al., 2019). Each of these types of systems has distinguishing features in the abundances of their member stars that can be used to identify the type of cluster. Open clusters are homogeneous in the abundances of all elements, while GCs are not fully homogeneous (Krumholz et al., 2019). GCs also are known to display specific anti-correlations between certain elements such as Mg-Al and Na-O (Carretta et al., 2010; Mucciarelli et al., 2018). Hence, studying the chemical enrichment of star clusters can tell us useful information about the nature of these objects and aid in their classification.
UFD galaxies are low mass, low luminosity, dark matter dominated galaxies (Simon & Geha, 2007). The current stellar population of UFD galaxies is very old (10 Gyr) and metal-poor (, Simon 2019), with abundances reflecting the elements created by the first generation of stars. Studying the abundances of stars in UFD galaxies, therefore, provides a window to study the nucleosynthetic processes of the early Universe. Furthermore, with the UFD galaxies being small, isolated systems, they reflect the chemical signatures of few nucleosynthetic events (Ji et al., 2016c; Hansen et al., 2020, 2017; Marshall et al., 2019).
Previous studies of stellar abundances in UFD galaxies have found generally similar abundance patterns from system to system (Frebel & Norris, 2015), with most of the stars exhibiting a slight enhancement of the -elements (Mg, Si, Ca) (Simon, 2019; Frebel et al., 2010; Lai et al., 2011), as seen for metal-poor stars in the MW halo (e.g., McWilliam, 1998; Cayrel et al., 2004), reflecting enrichment by core-collapse SN. In addition, and specific to UFD galaxies, most systems also display very low neutron-capture element abundances (e.g., Ji et al., 2019). With the increase in the number of systems being discovered and analysed, more variation in the abundances has begun to appear. Examples of systems with unusual abundance patterns include Reticulum II, where of stars analysed show enhancement in neutron-capture elements likely due to a neutron star merger event occurring early in the history of the galaxy (Ji et al., 2022, 2016; Roederer et al., 2016), and Grus II, where all three stars analysed have a high ratio compared to other UFD galaxies, pointing to a top heavy initial mass function governing the early star formation in this galaxy (Hansen et al., 2020).
In this paper, we present a detailed chemical abundance analysis of the brightest star of the Cetus II (Cet II) UFD galaxy candidate, DES J011740.53-173053.1 (hereafter J0117). Cet II was discovered as a stellar overdensity in the Dark Energy Survey, having a heliocentric distance of 30 kpc (Drlica-Wagner et al., 2015). At the time of discovery, Cet II was the faintest and smallest candidate UFD galaxy system detected, making it difficult to determine the velocity and metallicity dispersion. The brightest member was, therefore, a prime target for high-resolution follow-up aimed at abundance analysis. As described above, both UFD galaxies and star clusters have distinct chemical features that can be used to classify the system. Hence a detailed chemical analysis is the natural next step in the efforts to characterize the Cet II system.
2 Observations
Based on medium-resolution spectroscopy of the Cet II field obtained with the Magellan/IMACS spectrograph (Dressler et al., 2011) in 2016, we identified a set of likely Cet II member stars centered at a velocity of km s-1. Subsequently, Pace & Li (2019) and Pace et al. (2022) showed that these stars also share a common proper motion, confirming that they are associated with Cet II. Surprisingly, given the low stellar mass of Cet II, one of the member stars is located on the upper red giant branch at an apparent magnitude of , mag brighter than any other Cet II stars. This bright star, J0117, was then an obvious target for high-resolution spectroscopy to investigate the chemical abundances in Cet II.
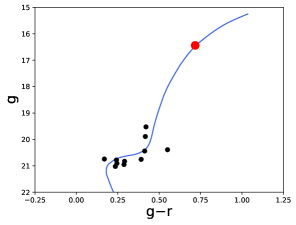
High-resolution spectral data was obtained for J0117 with the MIKE echelle spectrograph at Las Campanas Observatory in Chile (Bernstein et al., 2003) in August and November 2017. A color-magnitude diagram of Cet II member stars (Pace et al., 2022) is shown in Figure 1. J0117 is marked with a red dot and is notably brighter than the other currently known members.
Right ascension, declination, and dereddened DES magnitudes for J0117 are listed in Table 1, along with Heliocentric Julian Date (HJD), exposure times, signal-to-noise ratio per pixel (S/N), and heliocentric radial velocities for the spectra. The spectra were obtained using a 0.7” slit with 2x2 pixel binning and cover a wavelength range of 3350-5000 Å in the blue and 4900-9500 Å in the red, with resolutions (=) of 35,000 at blue wavelengths and at red wavelengths, respectively. The data from each observing run were reduced using the CarPy MIKE pipeline (Kelson et al., 2000; Kelson, 2003), and the spectra from the two runs were subsequently co-added. The heliocentric radial velocity of the star was determined by cross-correlation with a spectrum of the bright, metal-poor red giant HD122563 ( = 26.17 km s-1; Gaia Collaboration et al. 2021). Thirty-six echelle orders were used for the correlation in each spectrum, yielding mean radial velocities of 81.38 km s-1 and 81.89 km s-1 for the two spectra. Since there is no appreciable variation in the radial velocities between the two spectra, this star is likely not a short-period binary.
| ID | RA | Dec | HJD | Exp Time | S/N @ 4500Å | ||||||
|---|---|---|---|---|---|---|---|---|---|---|---|
| (mag) | (mag) | (mag) | (mag) | sec | km s-1 | ||||||
| J0117 | 01:17:40.9 | 17:30:54.5 | 16.443 | 15.716 | 15.818 | 16.014 | 2457988.70127 | 2x1800 | 15 | 81.38 0.52 | |
| 2458059.49903 | 5x1800 | 21 | 81.89 0.51 |
Note. — HJD values at beginning of exposure
| Species | EW | ref | ||||||
|---|---|---|---|---|---|---|---|---|
| (Å) | (eV) | (mÅ) | (mÅ) | |||||
| Na I | 5889.95 | 0.00 | 0.11 | 197.33 | 2.83 | 4.04 | 1 | |
| Na I | 5895.92 | 0.00 | 0.19 | 171.34 | 2.89 | 3.99 | 1 | |
| Mg I | 4167.27 | 4.35 | 0.74 | 84.82 | 6.00 | 5.80 | 1 | |
| Mg I | 4702.99 | 4.33 | 0.44 | 95.81 | 2.96 | 5.54 | 1 | |
| Mg I | 5172.68 | 2.71 | 0.36 | 248.53 | 6.18 | 5.47 | 2 |
References. — (1) Kramida et al. (2018); (2) Pehlivan Rhodin et al. (2017); (3) Yu & Derevianko (2018); (4) Lawler & Dakin (1989), using hfs from Kurucz & Bell (1995); (5) Lawler et al. (2013); (6) = Wood et al. (2013); (7) Pickering et al. (2001), with corrections given in Pickering et al. (2002); (8) Lawler et al. (2014) for values and HFS; (9) Wood et al. (2014a) for values and HFS, when available; (10) Sobeck et al. (2007); (11) Lawler et al. (2017); (12) Den Hartog et al. (2011) for both value and hfs; (13) O’Brian et al. (1991); (14) Den Hartog et al. (2014); (15) Belmonte et al. (2017); (16) Ruffoni et al. (2014); (17) Den Hartog et al. (2019); (18) Meléndez & Barbuy (2009); (19) Lawler et al. (2015) for values and HFS; (20) Wood et al. (2014b); (21) Roederer & Lawler (2012); (22) Kramida et al. (2018), using HFS/IS from McWilliam (1998) when available.
Note. — The complete version of this Table is available online only. A short version is shown here to illustrate its form and content.
3 Stellar Parameters and Abundance Analysis
Stellar parameters and abundances were derived from equivalent width (EW) measurements and spectral synthesis using the program Spectroscopy Made Hard(er) (SMHR 222https://github.com/andycasey/smhr), which runs the 2017 version of the radiative transfer code MOOG 333https://github.com/alexji/moog17scat (Sneden, 1973; Sobeck et al., 2011) assuming local thermodynamical equilibrium (LTE). One dimensional (1D) -enhanced ([/Fe]= +0.4) ATLAS model atmospheres (Castelli & Kurucz, 2003) were used as input, with line lists generated from linemake which include hyperfine structure and isotopic shifts where applicable 444https://github.com/vmplacco/linemake (Placco et al., 2021) and Solar abundances were taken from Asplund et al. (2009). For the derivation of Ba, we used the -process isotopic ratio from Sneden et al. (2008).
The stellar parameters effective temperature (), surface gravity (), metallicity (), and microturbulence () were determined spectroscopically using EW measurements of 95 Fe I and 7 Fe II lines (see Table 2). The EWs of the Fe I and Fe II lines were measured by fitting Gaussian profiles to the absorption features in the continuum-normalized spectra. Using these measurements, was derived from the excitation equilibrium of the Fe I lines and then corrected for the offset between spectroscopic and photometric temperature scales using the method outlined in Frebel et al. (2013). Next, was determined from the ionization balance between the Fe I and Fe II lines, and was determined by removing any trend in line abundances with reduced equivalent width for the Fe I lines. Final stellar parameters are listed in Table 3. For comparison, a photometric temperature of 4592 69 K for the star was also derived by converting the de-reddened DES , , , and colors to , , , and colors (Drlica-Wagner et al., 2018, R. Lupton 2005555http://www.sdss3.org/dr8/algorithms/sdssUBVRITransform.php) and using the color-temperature relations from Casagrande et al. (2010). The photometric temperature is in good agreement with the corrected spectroscopic temperature. Following Frebel et al. (2013), we adopt a 150 K systematic uncertainty for , corresponding to an uncertainty of 0.3 dex in , 0.2 km s-1 in , and 0.18 dex in . The statistical uncertainties on , and were derived by varying each parameter to match the standard deviation of Fe I lines as listed in Table 3. Once the stellar parameters were determined, elemental abundances were derived from EW measurements or spectral synthesis. EWs were used for lines that are not blended, while spectral synthesis was used for blended lines and/or lines that are affected by isotopic and/or hyperfine splitting. Atomic data, wavelength, excitation potential, and oscillator strength for individual lines used for the abundance determination are listed in Table 2. The table also lists the measured EWs, uncertainties on these, and the corresponding abundances for the lines used. Final weighted mean abundances and associated uncertainties were determined following the method outlined in Ji et al. (2020). This method uses a mean that is weighted by the S/N of the individual lines to calculate the final abundances and fully propagates statistical and systematic stellar parameter uncertainties for individual line measurements, including stellar parameter covariances, to determine the uncertainty.
| (K) | (cgs) | (km s-1) | ||
|---|---|---|---|---|
| Value | 4727 | 1.40 | 1.89 | 2.09 |
| Statistical uncertainties | 41 | 0.07 | 0.07 | 0.17 |
| Systematic uncertainties | 150 | 0.3 | 0.2 | 0.12 |
| El. | N | ||||||||||
|---|---|---|---|---|---|---|---|---|---|---|---|
| CH | 4 | 5.85 | 2.61 | 0.18 | 0.31 | 0.18 | 0.29 | 0.08 | 0.01 | 0.10 | 0.10 |
| Na I | 2 | 4.02 | 2.12 | 0.26 | 0.17 | 0.25 | 0.26 | 0.08 | 0.14 | 0.03 | 0.00 |
| Mg I | 4 | 5.69 | 1.93 | 0.17 | 0.36 | 0.18 | 0.15 | 0.07 | 0.07 | 0.00 | 0.18 |
| Al I | 2 | 3.79 | 2.63 | 0.42 | 0.33 | 0.41 | 0.25 | 0.11 | 0.11 | 0.01 | 0.46 |
| Si I | 3 | 5.86 | 1.71 | 0.24 | 0.59 | 0.24 | 0.18 | 0.03 | 0.06 | 0.00 | 0.28 |
| K I | 2 | 3.50 | 1.49 | 0.26 | 0.81 | 0.25 | 0.19 | 0.03 | 0.09 | 0.02 | 0.09 |
| Ca I | 20 | 4.38 | 2.03 | 0.10 | 0.23 | 0.11 | 0.15 | 0.03 | 0.06 | 0.01 | 0.11 |
| Sc II | 6 | 0.61 | 2.61 | 0.19 | 0.31 | 0.19 | 0.04 | 0.09 | 0.07 | 0.03 | 0.10 |
| Ti I | 14 | 2.64 | 2.52 | 0.23 | 0.23 | 0.22 | 0.25 | 0.03 | 0.05 | 0.02 | 0.23 |
| Ti II | 23 | 2.93 | 2.23 | 0.17 | 0.06 | 0.18 | 0.06 | 0.10 | 0.11 | 0.04 | 0.28 |
| V I | 2 | 1.64 | 2.30 | 0.19 | 0.01 | 0.18 | 0.17 | 0.02 | 0.01 | 0.04 | 0.00 |
| V II | 3 | 1.98 | 1.93 | 0.17 | 0.37 | 0.18 | 0.02 | 0.12 | 0.02 | 0.03 | 0.00 |
| Cr I | 9 | 3.13 | 2.59 | 0.14 | 0.30 | 0.14 | 0.24 | 0.03 | 0.08 | 0.02 | 0.08 |
| Cr II | 2 | 3.29 | 2.36 | 0.12 | 0.07 | 0.13 | 0.03 | 0.11 | 0.02 | 0.02 | 0.00 |
| Mn I | 5 | 2.97 | 2.48 | 0.23 | 0.18 | 0.22 | 0.20 | 0.02 | 0.08 | 0.04 | 0.10 |
| Fe I | 95 | 5.21 | 2.29 | 0.08 | 0.07 | 0.01 | 0.04 | 0.01 | 0.24 | ||
| Fe II | 7 | 5.39 | 2.22 | 0.15 | 0.01 | 0.12 | 0.01 | 0.03 | 0.10 | ||
| Co I | 4 | 2.73 | 2.37 | 0.32 | 0.07 | 0.31 | 0.25 | 0.00 | 0.11 | 0.04 | 0.00 |
| Ni I | 12 | 4.12 | 2.19 | 0.13 | 0.09 | 0.13 | 0.17 | 0.01 | 0.04 | 0.01 | 0.17 |
| Zn I | 1 | 2.27 | 2.29 | 0.15 | 0.01 | 0.15 | 0.06 | 0.07 | 0.02 | 0.02 | 0.00 |
| Sr II | 1 | 1.52 | 4.39 | 0.43 | 2.10 | 0.43 | 0.07 | 0.12 | 0.18 | 0.01 | 0.00 |
| Ba II | 1 | 2.34 | 4.52 | 0.39 | 2.23 | 0.39 | 0.09 | 0.10 | 0.01 | 0.09 | 0.10 |
| Eu II | 1 | 1.92 | 2.44 | 0.33 |
4 Results
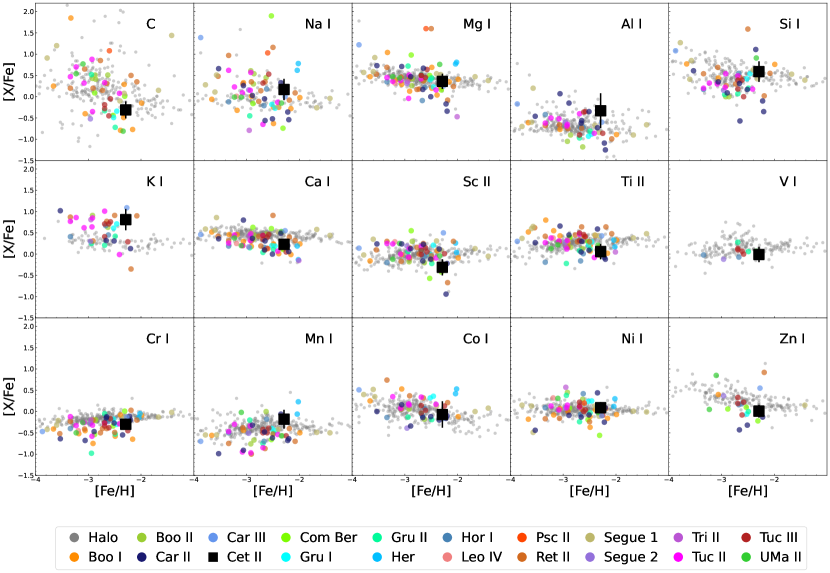
Abundances or upper limits have been derived for 18 elements from C to Eu in J0117. The LTE abundances and upper limits, along with the systematic abundance uncertainty () and uncertainties arising from stellar parameter uncertainties (, , , and ), are presented in Table 3, where N is the number of lines for the given species. In Figure 2 and 3, we present a subset of elemental abundances for J0117 compared to abundances for stars in UFD galaxies (colored points) and metal-poor halo stars (grey points) (Roederer et al., 2014). Data from the UFD galaxies are taken from: Boötes I (Feltzing et al., 2009; Frebel et al., 2016; Gilmore et al., 2013; Ishigaki et al., 2014; Norris et al., 2010; Waller et al., 2022), Boötes II (Ji et al., 2016), Carina II (Ji et al., 2020a), Carina III (Ji et al., 2020a), Coma Berenices (Frebel et al., 2010; Waller et al., 2022), Grus I (Ji et al., 2019), Grus II (Hansen et al., 2020), Hercules (Koch et al., 2008), Horologium I (Marshall et al. in prep.), Leo IV (Simon et al., 2010), Pisces II (Spite et al., 2018), Reticulum II (Ji et al., 2016b, 2019; Hayes et al., 2023), Segue 1 (Frebel et al., 2014; Norris et al., 2010), Segue 2 (Roederer & Kirby, 2014), Triangulum II (Ji et al., 2019), Tucana II (Ji et al., 2016c; Chiti et al., 2018, 2023), Tucana III (Hansen et al., 2017; Marshall et al., 2019), and Ursa Major II (Frebel et al., 2010).
4.1 Alpha elements
We derive abundances for the -elements Mg, Si, and Ca from equivalent widths. We find a Mg I abundance of from four Mg I absorption features, a Si I abundance of using three Si I lines, and a Ca I abundance of from 20 Ca I lines. J0117 shows a general enhancement in -elements as a result of enrichment by core-collapse SN, following the trend seen in metal-poor MW halo and other UFD galaxy stars (Frebel et al., 2010; Lai et al., 2011; Simon, 2019).
4.2 Carbon and odd-Z elements
Abundances for C, Na, Al, K, and Sc were derived from EW and spectral synthesis analysis. A of was determined from the CH G-band in regions around 4310 Å and 4230 Å via spectral synthesis. The C and O abundances are coupled through the CO molecule, thus, a knowledge of the O abundance of the star is needed to derive the C abundance. As we could not derive an O abundance for the star, we assumed a standard -enhanced O abundance of for the spectral synthesis of CH, since UFDs are known to be -enhanced and J0117 is -enhanced. The C abundance of a star is also altered as the star evolves. Using the tool from Placco et al. (2014), a carbon correction of = 0.57 dex was determined, resulting in an original C abundance of the star of . A Na I abundance of and an Al I abundance of were derived from EW analysis of the Na D resonance lines and two Al lines, respectively. EW analysis of the two K lines at 7664 and 7698 Å was used to derive a K I abundance of . From spectral synthesis of six Sc II lines, we derive a Sc II abundance of .
As can be seen in Figure 2, the C and Na abundances for J0117 follow those of other UFD galaxies and metal-poor MW halo stars. The Al abundance for J0117 may be slightly higher than what is seen in other UFD galaxies, and metal-poor MW halo stars, but the uncertainty of is high. J0117 has an elevated K abundance compared to the average K abundances found in MW halo stars. In addition, J0117 exhibits a lower Sc abundance than what is found in most UFD galaxies and metal-poor MW halo stars.
4.3 Iron peak elements
EW analysis was used to derive abundances for the iron peak elements Ti, Cr, Ni, and Zn and spectral synthesis for the elements V, Mn, and Co. We identify 14 Ti I and 23 Ti II lines in the spectrum and find abundances of and . V I and V II abundances were determined to be and from two and three lines respectively and Cr I and Cr II to be and from nine and two lines respectively. There is a slight discrepancy between the abundances we derive from the neutral and ionized lines of the elements mentioned above, which may be due to the 1D LTE nature of the analysis. However, for most of the elements, the neutral and ionized abundances agree within uncertainties. Finally, we derive Ni I and Zn I abundances of and using 12 Ni lines and one Zn line. Comparing these abundances to those of other UFD galaxy and MW halo stars (see Figure 2) reveals the Cet II star to have relatively low Ti and V abundances, while the remainder of the iron peak element abundances for this star are similar to other UFD galaxy and metal-poor MW halo stars.
4.4 Neutron-capture elements
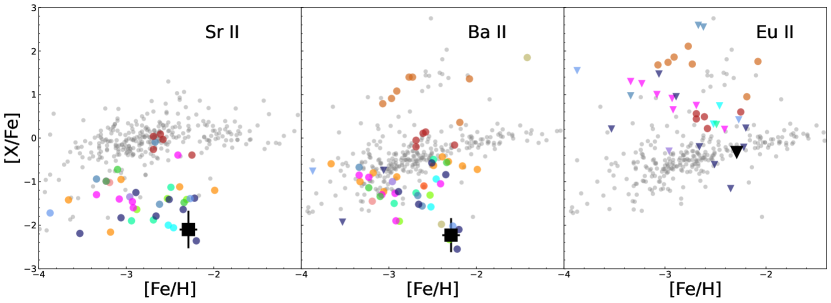
Absorption features from the two neutron-capture elements Sr and Ba were identified in the spectrum, and using spectral synthesis, we derive abundances for these elements of and . The synthesis of the Sr 4077 Å and Ba 4554 Å lines are shown in Figure 3. The Sr abundance derived for J0117 is low and similar to what is found in most other UFD galaxies, and the Ba abundance is lower than the majority of other UFD galaxy stars, see Figure 3. No Eu could be detected in the spectrum, so we derive a 3 upper limit of from the 4129 Å line, plotted as a downwards pointing triangle in Figure 3.
![[Uncaptioned image]](/html/2310.12090/assets/x4.png)
5 Discussion
5.1 Nature of Cetus II
The nature of the Cet II overdensity is still debated in the literature. The DES discovery paper (Drlica-Wagner et al., 2015) and a more recent paper from the DES based on analysis of more extensive photometry (Drlica-Wagner et al., 2020) both classify it as a probable UFD galaxy, while Conn et al. (2018), who presented GMOS-S photometry of the system, suggested it is more likely a part of the Sagittarius (Sgr) tidal stream. However, the proper motion of the Cet II system, (Pace & Li, 2019; Pace et al., 2022) does not agree with the proper motion of the Sgr stream (Vasiliev et al., 2021) and therefore rules out an association with the Sgr stream. As well as this, the velocity measured for J0117 does not agree with the velocity of the Sgr stream (Vasiliev et al., 2021) which further confirms that they are not associated. This will be explored more in forthcoming work (Simon et al. in prep.).
The size of Cet II (17pc) (Drlica-Wagner et al., 2015) lies in an ambiguous region in the size-luminosity plane where the star cluster and UFD populations overlap (Willman & Strader, 2012). As discussed in Willman & Strader (2012), the most effective classification for these systems is a velocity dispersion followed by a metallicity dispersion. These have not yet been measured for Cet II.
In this paper, we have derived the abundances of one star, J0117, in Cet II, and the general pattern of this star is similar to other UFD galaxy stars (see Figure 2) and hence compatible with a UFD galaxy classification of Cet II. This is particularly supported by the very low abundance of the neutron-capture elements Sr and Ba, which have been found to be characteristic of UFD galaxies and can be used to classify a system (Ji et al., 2019), in particular, this abundance feature distinguishes UFD galaxy stars from GC stars. Furthermore, we suggest that a high K abundance is another potential UFD abundance signature, which will be explored further in Section 5.2.2. No abundance analysis exists for Sgr stream stars at metallicities similar to J0117; however, there have been abundance analyses for stars in the Sgr dwarf spheroidal galaxy (dSph) at similar metallicities to J0117. The Sgr dSph stars show abundance signatures that we do not find in J0117, including higher neutron capture element abundances (,, Hansen et al. 2018; Reichert et al. 2020). Thus, the chemical abundances of Cet II do not support an association with the Sgr dSph. For the remainder of the discussion, we will adopt the classification of Cet II as a UFD galaxy.
5.2 Abundance pattern of J0117
With its low metallicity, slight enhancement of the -elements, and low abundances of neutron-capture elements, J0117 generally follows the same abundance trends seen in the majority of UFD galaxy stars. However, the derived abundances for some elements stand out and warrant further discussion.
5.2.1 Low Sc, Ti, and V abundances
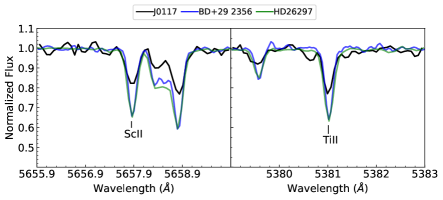
One specific feature of J0117 is that the , , and ratios are and dex lower, respectively, in this star than the average of what is seen in most other UFD galaxy stars and metal-poor MW halo stars (see Figure 2). We plot the 5657 Å Sc II and 5381 Å Ti II lines in the spectrum of J0117 (black) compared to spectra of stars HD 26297 (green) and BD+29 2356 (blue) (I. Roederer private comm.), in Figure 5. HD 26297 and BD+29 2356 were chosen because they have similar model atmosphere parameters to J0117 but higher Sc and Ti abundances. However, it should be noted that there is a difference in which amplifies the intrinsic difference in and . The parameters for each star and abundances for each line are listed in Table 5. It is clear from Figure 5 that the absorption features of Sc and Ti are weaker in the spectrum of J0117, thus supporting the lower abundances derived for these elements in this star.
| ID | Model | (Sc II) | (Ti II) | |||
|---|---|---|---|---|---|---|
| (K) | (cgs) | (km s-1) | ||||
| HD 26297 | 4400 | 1.10 | 1.75 | -1.72 | 1.57 | 3.67 |
| BD +29 2356 | 4710 | 1.75 | 1.50 | -1.62 | 1.65 | 3.61 |
| J0117 | 4727 | 1.40 | 1.89 | -2.09 | 0.63 | 3.00 |
Note. — Abundances for BD +29 2356 and HD 26297 are taken from Roederer et al. (2014).
The Sc, Ti, and V abundances for metal-poor stars have been investigated by Sneden et al. (2016); Cowan et al. (2020), and Ou et al. (2020), who all found that the abundances of these three elements are positively correlated in metal-poor stars (), indicating that these three elements have linked nucleosynthetic origins. While the main focus of Cowan et al. (2020) is the analysis of UV spectra taken with the Hubble Space Telescope of three metal-poor stars, they also investigated the correlation among Sc, Ti, and V abundances derived in several large spectroscopic studies (e.g., Cayrel et al., 2004; Cohen et al., 2004, 2008; Barklem et al., 2005; Lai et al., 2008; Yong et al., 2013; Roederer et al., 2014), and found that the abundances reported in these studies also show correlations between the three elements.
Ti and V are produced via explosive Si- and O- burning in core-collapse SN (Woosley & Weaver, 1995; Sneden et al., 2016), with models producing similar V/Ti ratios for both the Si and O SN ejecta components (e.g., Pignatari et al., 2016). Sneden et al. (2016) suggested that the correlation of the Ti and V abundances in metal-poor stars points to co-production of these elements and that their abundances can be used to explore properties of the progenitor and its explosion, such as mass and explosion energy. The case of Sc is a bit more complicated. Although it can be produced in the same explosive Si- and O-burning layers (Woosley & Weaver, 1995), it is more efficiently produced via neutrino feedback or during -rich freeze-out conditions (Woosley & Weaver, 1995; Fröhlich et al., 2006). This fact led Sneden et al. (2016) to argue that, although a correlation is seen, the Sc/Ti and Sc/V ratios are less useful diagnostics than V/Ti ratios of the properties of the progenitor star. Generally, theoretical SN models often underproduce all three elements compared to the abundances derived from metal-poor stars (Kobayashi et al., 2020, and references therein). However, it was suggested by both Cowan et al. (2020) and Ou et al. (2020) that more energetic SN, like hypernovae, might contribute to the abundances of these elements.
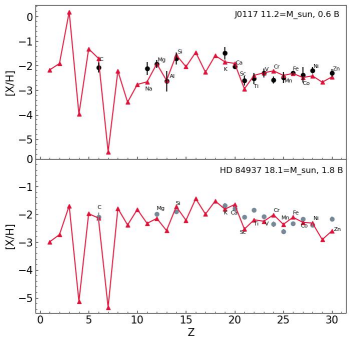
Contrary to the star analyzed in Sneden et al. (2016) and the three stars presented in Cowan et al. (2020), which all display higher than normal Sc, Ti, and V abundances, J0117 exhibits lower than average abundances for these elements. Since the chemistry of these stars is a direct fingerprint of the nucleosynthesis process of the first massive (Population III) stars to form in the galaxies, they can be used to constrain properties such as mass range, rotation, and explosion energies of the Pop III stars. To investigate the signature of J0117, we used the STARFIT tool666https://starfit.org/ to match SN yields from Heger & Woosley (2010) to the abundances of J0117. The STARFIT code calculates a statistic using the derived abundances and upper limits to determine the best-fit SN yields. For J0117, we obtained models with , which returned models in a narrow range of progenitor masses, M⊙=10.6-13.6. The best fit (= 1.12) was achieved with a progenitor mass of 11.2 M⊙ and a modest explosion energy of 0.6 B 777B=1 Bethe = erg. Figure 6 shows the abundances for J0117 and best-fit model yields. This model provides a good fit to most elements, with only a few discrepancies. It should be noted that it is unlikely that this star was polluted by a singular Pop III SN, but this tool gives an idea of the most dominant source of metals. To demonstrate the range of masses that can come from these abundances, we also derived the best-fit yields for the star from Sneden et al. (2016), HD 84937. HD 84937 is used for comparison because it has high Sc, Ti, and V abundances compared to the average halo stars and thus represents the high end of the abundance distribution, with J0117 representing the low end. Abundances for the light elements were taken from Spite et al. (2017), who adopted similar stellar parameters for HD 84937 as Sneden et al. (2016). For HD 84937, the best fit was achieved with a progenitor mass of 18.1 M⊙ and explosion energy of 1.8 B. This demonstrates how the abundances for these elements can be used to gain information about the progenitor masses and explosion energies as well as how these parameters can vary with different abundances. Furthermore, the progenitor mass found for the Cet II star is also somewhat lower than what has been found for stars in other UFD galaxies (Hansen et al., 2020), pointing to a wide range of progenitor masses existing in UFD galaxies.
Another possibility to explain the low Sc and V abundances that we see is pollution from Type Ia SN. As seen in Bravo et al. (2019), the production of Sc and V in Type Ia SN is metallicity dependent and decreases with decreasing metallicity. Hence, it is possible that the low Sc and V abundances are a result of increased Fe injection from Type Ia SN with low Sc and V production. However, the -element abundance ratios in J0117 are slightly enhanced and compatible with core-collapse SN production and don’t suggest extra Fe injection from Type Ia SN.
5.2.2 High K abundance
Another peculiar feature of J0117 is the somewhat high abundance of 0.81 derived for this star. But, as can be seen in Figure 2, J0117 is not a complete outlier. High K has been found in several other UFD galaxy stars. In fact, in Figure 2, it can be seen that stars in UFD galaxies generally have higher ratios than MW halo stars at similar metallicity. However, K is known to suffer from non-local thermodynamic equilibrium (NLTE) effects (de La Reza & Mueller, 1975). We, therefore, corrected the K abundance derived for J0117 and the K abundances of the UFD galaxy literature sample following the study of Reggiani et al. (2019) and got a abundance of for J0117. The NLTE-corrected K abundances for J0117 and other UFD galaxy stars, along with NLTE-corrected K abundances of halo stars (Roederer et al., 2014), are shown in the middle panel of Figure 7, while the LTE abundances are shown in the panel on the left. It can be seen that the offset between a subset of the UFD galaxies and the halo stars remains after the correction is applied. Ivanova & Shimanskiĭ (2000) also looked at the NLTE corrections for K and provided corrections slightly larger than Reggiani et al. (2019). However, even with these corrections, the offset between the MW halo stars and a subset of the UFD galaxies remains.
Apart from the NLTE effects, the K lines also have hyperfine structure. However, this is very weak and, therefore, generally not included in the abundance analysis. But for completeness, we derived K abundances from the two lines used above via spectral synthesis, including hyperfine structure. As expected, the effect on the abundances was minimal (¡0.1). Hence, for compatibility with the literature data, the discussion below is based on our K abundance derived from the EW analysis.
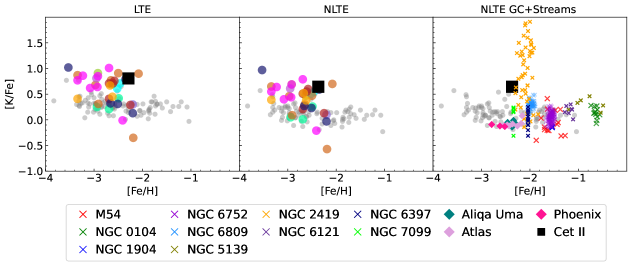
Although the abundances of J0117 are compatible with Cet II being a UFD galaxy, we searched the literature for K abundances in GCs to explore if this abundance signature is unique to stars in UFD galaxies or can be found in other types of small stellar systems. The results of this exercise are plotted in the right panel of Figure 7, where the GC NLTE-corrected K abundances for stars in ten GCs (M54 (Carretta, 2022), NGC 2419 (Mucciarelli et al., 2012), NGC 104, NGC 6809 (Mucciarelli et al., 2017), NGC 6752 (Carretta et al., 2007), NGC 1904, NGC 5139, NGC 6121, NGC 6397, NGC 7099 (Carretta et al., 2013)) are marked with crosses. As can be seen, for most GCs, the K abundances overlap with the halo stars, suggesting that the high K abundances seen in UFD galaxy stars may be a unique abundance signature of these systems. The exception is NGC 2419, in which stars with a wide range of K abundances are found, including K-rich () stars. However, the K-rich stars in this cluster are all Mg-poor ( ¡ 0) (Cohen & Kirby, 2012; Mucciarelli et al., 2012), thus making them distinguishable from the UFD galaxy stars, which usually exhibit a small enhancement in Mg (J0117, for example, has ). Although we find K abundances in a number of GCs, most have metallicities higher than the UFD galaxy stars with K abundances, hampering a direct comparison. However, in recent years a number of stellar streams have been detected that are thought to be the remnants of more metal-poor GCs accreted by the MW, such as the Phoenix, Aliqa Uma, and ATLAS streams (Li et al., 2019; Wan et al., 2020; Casey et al., 2021; Li et al., 2022). Ji et al. (2020) derived K abundances for stars in the three GC streams listed above. These abundances are plotted as diamonds in Figure 7. Similar to the present-day GCs, the stream stars also have K abundances overlapping with the MW halo stars. Hence, high K abundances seem to be a characteristic abundance signature for at least some UFD galaxies.
The nucleosynthetic origin of the high K abundances seen in UFD galaxy stars is yet unknown. K is created through hydrostatic oxygen shell burning and explosive oxygen burning with yields depending on the progenitor mass (Woosley & Weaver, 1995). Recently, models have shown that K production is increased when rotation is introduced (Prantzos et al., 2018). Hence, the high K abundances in UFD galaxy stars could suggest that some of these stars were enriched by massive rotating stars. The models also show low Sc production in massive rotating stars (Prantzos et al., 2018), which is in agreement with the Sc in J0117 (). However, it is not a good fit for the other UFD stars that do not have low Sc.
Since the high K abundances are mainly seen in the UFD galaxy stars, it is possible that this signature is tied to the slow chemical evolution of these systems. Although unlikely given the overall abundance signature of J0117, the K could also come from a nucleosynthesis source with a time-delayed contribution, like Type Ia SN. One candidate could be Ca-rich transients (Kasliwal et al., 2012), the lightcurves of which Polin et al. (2021) recently found to match models of sub-Chandrasekhar Type Ia SNe with low mass progenitors. However, more modeling is needed to establish if these events can contribute to the K abundances of UFD galaxy stars.
6 Summary
We have performed a detailed chemical abundance analysis of J0117, the brightest star of the Cet II UFD galaxy candidate. Our analysis shows that this star is a metal-poor, -enhanced (-elements ) star with low abundances of the neutron-capture elements ( and ), following the trends seen for chemical analysis of other UFD galaxy stars. Thus, although there is still debate on the classification of this system, the results of this chemical analysis suggest Cet II is a UFD galaxy. Further observations and chemical analysis of more stars in this system will help to fully determine the nature of Cet II. The analysis revealed that the star exhibits slightly lower , , and abundances compared to other UFD galaxy and MW halo stars at similar metallicities. It has been suggested that the abundances for , , and can be used as a diagnostic for progenitor mass; we thus compared the abundances of J0117 with the Heger & Woosley (2010) SNe yields and determined a best-fit with a progenitor mass of 11.2M⊙, somewhat lower than the progenitor masses found for stars in other UFD galaxies (Hansen et al., 2020). Finally, we derive a K abundance of for J0117, which, even after it has been corrected for NLTE effects, is somewhat higher than the K abundances derived for MW halo stars at similar metallicities. We note that a number of UFD galaxies have high K abundances compared to the MW halo stars, and by including K abundances for stars in GCs and streams in our comparison, we find that this is a unique signature of some UFD galaxy stars.
References
- Asplund et al. (2009) Asplund, M., Grevesse, N., Sauval, A. J., et al. 2009, ARA&A, 47, 481. doi:10.1146/annurev.astro.46.060407.145222
- Astropy Collaboration et al. (2013) Astropy Collaboration, Robitaille, T. P., Tollerud, E. J., et al. 2013, A&A, 558, A33
- Astropy Collaboration et al. (2018) Astropy Collaboration, Price-Whelan, A. M., Sipőcz, B. M., et al. 2018, AJ, 156, 123
- Barklem et al. (2005) Barklem, P. S., Christlieb, N., Beers, T. C., et al. 2005, A&A, 439, 129. doi:10.1051/0004-6361:20052967
- Bechtol et al. (2015) Bechtol, K., Drlica-Wagner, A., Balbinot, E., et al. 2015, ApJ, 807, 50. doi:10.1088/0004-637X/807/1/50
- Belmonte et al. (2017) Belmonte, M. T., Pickering, J. C., Ruffoni, M. P., et al. 2017, ApJ, 848, 125. doi:10.3847/1538-4357/aa8cd3
- Bernstein et al. (2003) Bernstein, R., Shectman, S. A., Gunnels, S. M., et al. 2003, Proc. SPIE, 4841, 1694. doi:10.1117/12.461502
- Bravo et al. (2019) Bravo, E., Badenes, C., & Martínez-Rodríguez, H. 2019, MNRAS, 482, 4346. doi:10.1093/mnras/sty2951
- Cantu et al. (2021) Cantu, S. A., Pace, A. B., Marshall, J., et al. 2021, ApJ, 916, 81. doi:10.3847/1538-4357/ac0443
- Carretta (2022) Carretta, E. 2022, A&A, 666, A177. doi:10.1051/0004-6361/202244613
- Carretta et al. (2013) Carretta, E., Gratton, R. G., Bragaglia, A., et al. 2013, ApJ, 769, 40. doi:10.1088/0004-637X/769/1/40
- Carretta et al. (2010) Carretta, E., Bragaglia, A., Gratton, R. G., et al. 2010, A&A, 516, A55. doi:10.1051/0004-6361/200913451
- Carretta et al. (2007) Carretta, E., Bragaglia, A., Gratton, R. G., et al. 2007, VizieR Online Data Catalog, J/A+A/464/927
- Casagrande et al. (2010) Casagrande, L., Ramírez, I., Meléndez, J., et al. 2010, A&A, 512, A54
- Casey et al. (2021) Casey, A. R., Ji, A. P., Hansen, T. T., et al. 2021, ApJ, 921, 67. doi:10.3847/1538-4357/ac1346
- Casey (2014) Casey, A. R. 2014, Ph.D. Thesis. doi:10.5281/zenodo.49493
- Castelli & Kurucz (2003) Castelli, F., & Kurucz, R. L. 2003, in IAU Symp. 210, Modelling of Stellar Atmospheres(Cambridge: Cambridge Univ. Press),A20.
- Cayrel et al. (2004) Cayrel, R., Depagne, E., Spite, M., et al. 2004, A&A, 416, 1117. doi:10.1051/0004-6361:20034074
- Conn et al. (2018) Conn, B. C., Jerjen, H., Kim, D., et al. 2018, ApJ, 857, 70. doi:10.3847/1538-4357/aab61c
- Cohen & Kirby (2012) Cohen, J. G. & Kirby, E. N. 2012, ApJ, 760, 86. doi:10.1088/0004-637X/760/1/86
- Cohen et al. (2008) Cohen, J. G., Christlieb, N., McWilliam, A., et al. 2008, ApJ, 672, 320. doi:10.1086/523638
- Cohen et al. (2004) Cohen, J. G., Christlieb, N., McWilliam, A., et al. 2004, ApJ, 612, 1107. doi:10.1086/422576
- Cowan et al. (2020) Cowan, J. J., Sneden, C., Roederer, I. U., et al. 2020, ApJ, 890, 119. doi:10.3847/1538-4357/ab6aa9
- Chiti et al. (2023) Chiti, A., Frebel, A., Ji, A. P., et al. 2023, AJ, 165, 55. doi:10.3847/1538-3881/aca416
- Chiti et al. (2018) Chiti, A., Frebel, A., Ji, A. P., et al. 2018, ApJ, 857, 74
- de La Reza & Mueller (1975) de La Reza, R. & Mueller, E. A. 1975, Sol. Phys., 43, 15. doi:10.1007/BF00155138
- DES Collaboration (2005) The Dark Energy Survey Collaboration 2005, astro-ph/0510346. doi:10.48550/arXiv.astro-ph/0510346
- Den Hartog et al. (2019) Den Hartog, E. A., Lawler, J. E., Sneden, C., et al. 2019, ApJS, 243, 33. doi:10.3847/1538-4365/ab322e
- Den Hartog et al. (2014) Den Hartog, E. A., Ruffoni, M. P., Lawler, J. E., et al. 2014, ApJS, 215, 23. doi:10.1088/0067-0049/215/2/23
- Den Hartog et al. (2011) Den Hartog, E. A., Lawler, J. E., Sobeck, J. S., et al. 2011, ApJS, 194, 35. doi:10.1088/0067-0049/194/2/35
- Dotter et al. (2008) Dotter, A., Chaboyer, B., Jevremović, D., et al. 2008, ApJS, 178, 89. doi:10.1086/589654
- Dressler et al. (2011) Dressler, A., Bigelow, B., Hare, T., et al. 2011, PASP, 123, 288. doi:10.1086/658908
- Drlica-Wagner et al. (2020) Drlica-Wagner, A., Bechtol, K., Mau, S., et al. 2020, ApJ, 893, 47. doi:10.3847/1538-4357/ab7eb9
- Drlica-Wagner et al. (2018) Drlica-Wagner, A., Sevilla-Noarbe, I., Rykoff, E. S., et al. 2018, ApJS, 235, 33
- Drlica-Wagner et al. (2015) Drlica-Wagner, A., Bechtol, K., Rykoff, E. S., et al. 2015, ApJ, 813, 109
- Gaia Collaboration et al. (2021) Gaia Collaboration, Brown, A. G. A., Vallenari, A., et al. 2021, A&A, 649, A1. doi:10.1051/0004-6361/202039657
- Gaia Collaboration (2018) Gaia Collaboration 2018, VizieR Online Data Catalog, I/345
- Feltzing et al. (2009) Feltzing, S., Eriksson, K., Kleyna, J., et al. 2009, A&A, 508, L1
- Frebel et al. (2016) Frebel, A., Norris, J. E., Gilmore, G., et al. 2016, ApJ, 826, 110
- Frebel & Norris (2015) Frebel, A. & Norris, J. E. 2015, ARA&A, 53, 631. doi:10.1146/annurev-astro-082214-122423
- Frebel et al. (2014) Frebel, A., Simon, J. D., & Kirby, E. N. 2014, ApJ, 786, 74
- Frebel et al. (2010) Frebel, A., Simon, J. D., Geha, M., et al. 2010, ApJ, 708, 560
- Frebel et al. (2013) Frebel, A., Casey, A. R., Jacobson, H. R., et al. 2013, ApJ, 769, 57. doi:10.1088/0004-637X/769/1/57
- Fröhlich et al. (2006) Fröhlich, C., Hauser, P., Liebendörfer, M., et al. 2006, ApJ, 637, 415. doi:10.1086/498224
- Gilmore et al. (2013) Gilmore, G., Norris, J. E., Monaco, L., et al. 2013, ApJ, 763, 61
- Hasselquist et al. (2019) Hasselquist, S., Carlin, J. L., Holtzman, J. A., et al. 2019, ApJ, 872, 58. doi:10.3847/1538-4357/aafdac
- Hansen et al. (2018) Hansen, C. J., El-Souri, M., Monaco, L., et al. 2018, ApJ, 855, 83. doi:10.3847/1538-4357/aa978f
- Hansen et al. (2017) Hansen, T. T., Simon, J. D., Marshall, J. L., et al. 2017, ApJ, 838, 44
- Hansen et al. (2020) Hansen, T. T., Marshall, J. L., Simon, J. D., et al. 2020, ApJ, 897, 183. doi:10.3847/1538-4357/ab9643
- Hayes et al. (2023) Hayes, C. R., Venn, K. A., Waller, F., et al. 2023, arXiv:2306.04804. doi:10.48550/arXiv.2306.04804
- Heger & Woosley (2010) Heger, A. & Woosley, S. E. 2010, ApJ, 724, 341. doi:10.1088/0004-637X/724/1/341
- Hunter (2007) Hunter, J. D. 2007, Computing in Science and Engineering, 9, 90
- Ishigaki et al. (2014) Ishigaki, M. N., Aoki, W., Arimoto, N., et al. 2014, A&A, 562, A146
- Ivanova & Shimanskiĭ (2000) Ivanova, D. V. & Shimanskiĭ, V. V. 2000, Astronomy Reports, 44, 376. doi:10.1134/1.163861
- Ji et al. (2022) Ji, A. P., Simon, J. D., Roederer, I. U., et al. 2022, arXiv:2207.03499. doi:10.48550/arXiv.2207.03499
- Ji et al. (2020) Ji, A. P., Li, T. S., Hansen, T. T., et al. 2020, AJ, 160, 181. doi:10.3847/1538-3881/abacb6
- Ji et al. (2020a) Ji, A. P., Li, T. S., Simon, J. D., et al. 2020, ApJ, 889, 27. doi:10.3847/1538-4357/ab6213
- Ji et al. (2019) Ji, A. P., Simon, J. D., Frebel, A., et al. 2019, ApJ, 870, 83. doi:10.3847/1538-4357/aaf3bb
- Ji et al. (2016c) Ji, A. P., Frebel, A., Simon, J. D., et al. 2016, ApJ, 817, 41
- Ji et al. (2016b) Ji, A. P., Frebel, A., Simon, J. D., et al. 2016, ApJ, 830, 93
- Ji et al. (2016) Ji, A. P., Frebel, A., Chiti, A., et al. 2016, Nature, 531, 610. doi:10.1038/nature17425
- Ji et al. (2016) Ji, A. P., Frebel, A., Ezzeddine, R., et al. 2016, ApJ, 832, L3
- Kasliwal et al. (2012) Kasliwal, M. M., Kulkarni, S. R., Gal-Yam, A., et al. 2012, ApJ, 755, 161. doi:10.1088/0004-637X/755/2/161
- Kelson et al. (2000) Kelson, D. D., Illingworth, G. D., van Dokkum, P. G., et al. 2000, ApJ, 531, 159
- Kelson (2003) Kelson, D. D. 2003, PASP, 115, 688. doi:10.1086/375502
- Kobayashi et al. (2020) Kobayashi, C., Karakas, A. I., & Lugaro, M. 2020, ApJ, 900, 179. doi:10.3847/1538-4357/abae65
- Koch et al. (2008) Koch, A., McWilliam, A., Grebel, E. K., et al. 2008, ApJ, 688, L13
- Koposov et al. (2015) Koposov, S. E., Belokurov, V., Torrealba, G., et al. 2015, ApJ, 805, 130. doi:10.1088/0004-637X/805/2/130
- Kramida et al. (2018) Kramida, A., Ralchenko, Y., Nave, G., et al. 2018, APS Division of Atomic, Molecular and Optical Physics Meeting Abstracts
- Krumholz et al. (2019) Krumholz, M. R., McKee, C. F., & Bland-Hawthorn, J. 2019, ARA&A, 57, 227. doi:10.1146/annurev-astro-091918-104430
- Kurucz & Bell (1995) Kurucz, R. L. & Bell, B. 1995, Kurucz CD-ROM, Cambridge, MA: Smithsonian Astrophysical Observatory, —c1995, April 15, 1995
- Laevens et al. (2014) Laevens, B. P. M., Martin, N. F., Sesar, B., et al. 2014, ApJ, 786, L3. doi:10.1088/2041-8205/786/1/L3
- Laevens et al. (2015) Laevens, B. P. M., Martin, N. F., Bernard, E. J., et al. 2015, ApJ, 813, 44. doi:10.1088/0004-637X/813/1/44
- Lai et al. (2011) Lai, D. K., Lee, Y. S., Bolte, M., et al. 2011, ApJ, 738, 51. doi:10.1088/0004-637X/738/1/51
- Lai et al. (2008) Lai, D. K., Bolte, M., Johnson, J. A., et al. 2008, ApJ, 681, 1524. doi:10.1086/588811
- Lawler & Dakin (1989) Lawler, J. E. & Dakin, J. T. 1989, Journal of the Optical Society of America B Optical Physics, 6, 1457. doi:10.1364/JOSAB.6.001457
- Lawler et al. (2017) Lawler, J. E., Sneden, C., Nave, G., et al. 2017, ApJS, 228, 10. doi:10.3847/1538-4365/228/1/10
- Lawler et al. (2014) Lawler, J. E., Wood, M. P., Den Hartog, E. A., et al. 2014, ApJS, 215, 20. doi:10.1088/0067-0049/215/2/20
- Lawler et al. (2013) Lawler, J. E., Guzman, A., Wood, M. P., et al. 2013, ApJS, 205, 11. doi:10.1088/0067-0049/205/2/11
- Lawler et al. (2015) Lawler, J. E., Sneden, C., & Cowan, J. J. 2015, ApJS, 220, 13. doi:10.1088/0067-0049/220/1/13
- Li et al. (2022) Li, T. S., Ji, A. P., Pace, A. B., et al. 2022, ApJ, 928, 30. doi:10.3847/1538-4357/ac46d3
- Li et al. (2019) Li, T. S., Koposov, S. E., Zucker, D. B., et al. 2019, MNRAS, 490, 3508. doi:10.1093/mnras/stz2731
- Luque et al. (2018) Luque, E., Santiago, B., Pieres, A., et al. 2018, MNRAS, 478, 2006. doi:10.1093/mnras/sty1039
- McWilliam (1998) McWilliam, A. 1998, AJ, 115, 1640. doi:10.1086/300289
- Marshall et al. (2019) Marshall, J. L., Hansen, T., Simon, J. D., et al. 2019, ApJ, 882, 177
- Meléndez & Barbuy (2009) Meléndez, J. & Barbuy, B. 2009, A&A, 497, 611. doi:10.1051/0004-6361/200811508
- Mucciarelli et al. (2012) Mucciarelli, A., Bellazzini, M., Ibata, R., et al. 2012, MNRAS, 426, 2889. doi:10.1111/j.1365-2966.2012.21847.x
- Mucciarelli et al. (2017) Mucciarelli, A., Merle, T., & Bellazzini, M. 2017, VizieR Online Data Catalog, J/A+A/600/A104
- Mucciarelli et al. (2018) Mucciarelli, A., Lapenna, E., Ferraro, F. R., et al. 2018, ApJ, 859, 75. doi:10.3847/1538-4357/aaba80
- Norris et al. (2010) Norris, J. E., Wyse, R. F. G., Gilmore, G., et al. 2010, ApJ, 723, 1632
- O’Brian et al. (1991) O’Brian, T. R., Wickliffe, M. E., Lawler, J. E., et al. 1991, Journal of the Optical Society of America B Optical Physics, 8, 1185. doi:10.1364/JOSAB.8.001185
- Ou et al. (2020) Ou, X., Roederer, I. U., Sneden, C., et al. 2020, ApJ, 900, 106. doi:10.3847/1538-4357/abaa50
- Pace et al. (2022) Pace, A. B., Erkal, D., & Li, T. S. 2022, arXiv:2205.05699
- Pace & Li (2019) Pace, A. B. & Li, T. S. 2019, ApJ, 875, 77. doi:10.3847/1538-4357/ab0aee
- Pehlivan Rhodin et al. (2017) Pehlivan Rhodin, A., Hartman, H., Nilsson, H., et al. 2017, A&A, 598, A102. doi:10.1051/0004-6361/201629849
- Pickering et al. (2002) Pickering, J. C., Thorne, A. P., & Perez, R. 2002, ApJS, 138, 247. doi:10.1086/323910
- Pickering et al. (2001) Pickering, J. C., Thorne, A. P., & Perez, R. 2001, ApJS, 132, 403. doi:10.1086/318958
- Pignatari et al. (2016) Pignatari, M., Herwig, F., Hirschi, R., et al. 2016, ApJS, 225, 24. doi:10.3847/0067-0049/225/2/24
- Placco et al. (2021) Placco, V. M., Sneden, C., Roederer, I. U., et al. 2021, Research Notes of the American Astronomical Society, 5, 92. doi:10.3847/2515-5172/abf651
- Placco et al. (2014) Placco, V. M., Frebel, A., Beers, T. C., et al. 2014, ApJ, 797, 21. doi:10.1088/0004-637X/797/1/21
- Polin et al. (2021) Polin, A., Nugent, P., & Kasen, D. 2021, ApJ, 906, 65. doi:10.3847/1538-4357/abcccc
- Prantzos et al. (2018) Prantzos, N., Abia, C., Limongi, M., et al. 2018, MNRAS, 476, 3432. doi:10.1093/mnras/sty316
- Reichert et al. (2020) Reichert, M., Hansen, C. J., Hanke, M., et al. 2020, A&A, 641, A127. doi:10.1051/0004-6361/201936930
- Reggiani et al. (2019) Reggiani, H., Amarsi, A. M., Lind, K., et al. 2019, A&A, 627, A177. doi:10.1051/0004-6361/201935156
- Roederer et al. (2016) Roederer, I. U., Mateo, M., Bailey, J. I., et al. 2016, AJ, 151, 82. doi:10.3847/0004-6256/151/3/82
- Roederer & Lawler (2012) Roederer, I. U. & Lawler, J. E. 2012, ApJ, 750, 76. doi:10.1088/0004-637X/750/1/76
- Roederer et al. (2014) Roederer, I. U., Preston, G. W., Thompson, I. B., et al. 2014, AJ, 147, 136
- Roederer & Kirby (2014) Roederer, I. U., & Kirby, E. N. 2014, MNRAS, 440, 2665
- Ruffoni et al. (2014) Ruffoni, M. P., Den Hartog, E. A., Lawler, J. E., et al. 2014, MNRAS, 441, 3127. doi:10.1093/mnras/stu780
- Simon & Geha (2007) Simon, J. D. & Geha, M. 2007, ApJ, 670, 313. doi:10.1086/521816
- Simon et al. (2010) Simon, J. D., Frebel, A., McWilliam, A., et al. 2010, ApJ, 716, 446
- Simon (2019) Simon, J. D. 2019, ARA&A, 57, 375. doi:10.1146/annurev-astro-091918-104453
- Sneden (1973) Sneden, C. A. 1973, Ph.D. Thesis, THE UNIVERSITY OF TEXAS AT AUSTIN
- Sneden et al. (2016) Sneden, C., Cowan, J. J., Kobayashi, C., et al. 2016, ApJ, 817, 53. doi:10.3847/0004-637X/817/1/53
- Sneden et al. (2008) Sneden, C., Cowan, J. J., & Gallino, R. 2008, ARA&A, 46, 241. doi:10.1146/annurev.astro.46.060407.145207
- Sobeck et al. (2007) Sobeck, J. S., Lawler, J. E., & Sneden, C. 2007, ApJ, 667, 1267. doi:10.1086/519987
- Sobeck et al. (2011) Sobeck, J. S., Kraft, R. P., Sneden, C., et al. 2011, AJ, 141, 175
- Spite et al. (2018) Spite, M., Spite, F., François, P., et al. 2018, A&A, 617, A56
- Spite et al. (2017) Spite, M., Peterson, R. C., Gallagher, A. J., et al. 2017, A&A, 600, A26. doi:10.1051/0004-6361/201630058
- Trumpler (1930) Trumpler, R. J. 1930, Lick Observatory Bulletin, 420, 154. doi:10.5479/ADS/bib/1930LicOB.14.154T
- Tody (1986) Tody, D. 1986, Proc. SPIE, 733
- Tody (1993) Tody, D. 1993, Astronomical Data Analysis Software and Systems II, 173
- van der Walt et al. (2011) van der Walt, S., Colbert, S. C., & Varoquaux, G. 2011, Computing in Science and Engineering, 13, 22
- Vasiliev et al. (2021) Vasiliev, E., Belokurov, V., & Erkal, D. 2021, MNRAS, 501, 2279. doi:10.1093/mnras/staa3673
- Waller et al. (2022) Waller, F., Venn, K., Sestito, F., et al. 2022, arXiv:2208.07948. doi:10.48550/arXiv.2208.07948
- Wan et al. (2020) Wan, Z., Lewis, G. F., Li, T. S., et al. 2020, Nature, 583, 768. doi:10.1038/s41586-020-2483-6
- Wenger et al. (2000) Wenger, M., Ochsenbein, F., Egret, D., et al. 2000, A&AS, 143, 9. doi:10.1051/aas:2000332
- Willman & Strader (2012) Willman, B. & Strader, J. 2012, AJ, 144, 76. doi:10.1088/0004-6256/144/3/76
- Wood et al. (2013) Wood, M. P., Lawler, J. E., Sneden, C., et al. 2013, ApJS, 208, 27. doi:10.1088/0067-0049/208/2/27
- Wood et al. (2014a) Wood, M. P., Lawler, J. E., Den Hartog, E. A., et al. 2014, ApJS, 214, 18. doi:10.1088/0067-0049/214/2/18
- Wood et al. (2014b) Wood, M. P., Lawler, J. E., Sneden, C., et al. 2014, ApJS, 211, 20. doi:10.1088/0067-0049/211/2/20
- Woosley & Weaver (1995) Woosley, S. E. & Weaver, T. A. 1995, ApJS, 101, 181. doi:10.1086/192237
- Yong et al. (2013) Yong, D., Norris, J. E., Bessell, M. S., et al. 2013, ApJ, 762, 26. doi:10.1088/0004-637X/762/1/26
- Yu & Derevianko (2018) Yu, Y. & Derevianko, A. 2018, Atomic Data and Nuclear Data Tables, 119, 263. doi:10.1016/j.adt.2017.03.002