Exploring Fairness in Pre-trained Visual Transformer based Natural and GAN Generated Image Detection Systems and Understanding the Impact of Image Compression in Fairness
Abstract
It is not only sufficient to construct computational models that can accurately classify or detect fake images from real images taken from a camera, but it is also important to ensure whether these computational models are fair enough or produce biased outcomes that can eventually harm certain social groups or cause serious security threats. Exploring fairness in forensic algorithms is an initial step towards correcting these biases. Since visual transformers are recently being widely used in most image classification based tasks due to their capability to produce high accuracies, this study tries to explore bias in the transformer based image forensic algorithms that classify natural and GAN generated images. By procuring a bias evaluation corpora, this study analyzes bias in gender, racial, affective, and intersectional domains using a wide set of individual and pairwise bias evaluation measures. As the generalizability of the algorithms against image compression is an important factor to be considered in forensic tasks, this study also analyzes the role of image compression on model bias. Hence to study the impact of image compression on model bias, a two phase evaluation setting is followed, where a set of experiments is carried out in the uncompressed evaluation setting and the other in the compressed evaluation setting.
Index Terms:
Digital Image Forensics, Algorithmic Fairness, Vision transformers, GAN images.I Introduction
Fairness studies are recently gaining large interest in the research community since the machine learning based computational models are reported to have bias in their outputs [1]. These biases in the models can impact society by harming or denying opportunities to certain social groups of people [2]. Fairness studies report that these algorithmic biases can originate from training data, model representations, downstream tasks, etc., and accordingly, there are different kinds of algorithmic biases including data bias, model learning bias, downstream task level bais, etc., [3].
Easy availability of image acquiring devices, massive publicly accessible image datasets, rapid progress and a wide variety of generative algorithms and user-friendly easily available apps producing high quality super realistic images have drastically increased the production of fake images all around. Beyond artistic and entertainment purposes, such fake images are also seen to create some critical and harmful societal issues, such as fake images used as evidence for supporting fake news, defamation, generating fake nude photographs, false light portrayals, [4, 5, 6], etc. Hence a lot of studies are reported proposing various methods for distinguishing such fake images from real images taken from a camera, which can help to understand or even to serve as evidence to prove image authenticity [7, 8, 9, 10]. Although there is a lot of research in this area of distinguishing fake and real images, there are only a very few studies that explore algorithmic bias in such image forensics systems [11, 12]. Exploring bias in the image forensics systems is very significant because unfair forensic systems can lead images of certain social groups to be more likely to be predicted as fake images even if they are actually real images. Unfair models may also lead images of certain social groups to be more likely to be predicted as real images even if they are actually fake images creating security concerns. Therefore it is essential to test the fairness of image forensics systems.
Most of the image classification tasks are seen to utilize the recent visual transformer based deep learning classifiers due to their capability to produce very high classification accuracies in a variety of downstream tasks such as object detection/classification, segmentation, image generation, etc., [13]. The area of image forensics also reports many works in the literature, utilizing these visual transformers [14, 15, 16, 17, 10]. Due to the recent widespread use of visual transformers in image forensics, this study tries to explore bias, if any, in the visual transformers for the forensics task of distinguishing natural (or real) and GAN generated (or fake) images.
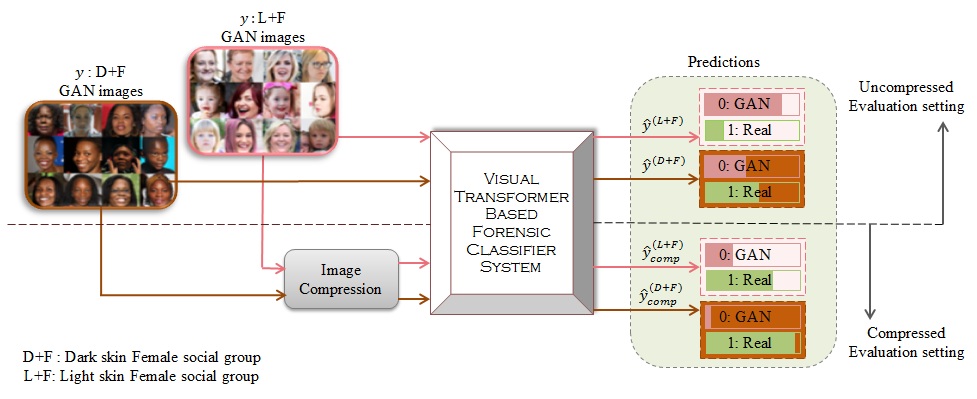
Images shared through social media websites, unlike other post-processing operations, almost always go through compression knowingly or unknowingly [18]. Also, to deceive the forensic models detecting fake images and to spread fake news, the fake images are usually compressed and propagated through social media [19, 4]. Therefore, in the image forensic task of detecting natural and GAN generated images, the generalizability of the forensic algorithms towards post-processing operations, particularly image compression, is a very important factor to be considered. Hence, studies in literature that build high performance fake image detector systems also analyze the generalizability of those models [10]. Most studies report a high accuracy drop for the models in compressed scenarios [9, 10]. In this regard, one of the interests of this study, apart from identifying bias in visual transformers based classification of natural and GAN images, is to explore whether image compression impacts model bias. That is, this study focuses on two research objectives: (1) Do visual transformers produce biased outcomes for the task of distinguishing natural and GAN generated images and, (2) does image compression impact or amplify bias in these classifier models? To study these objectives, this study conducts bias analysis experiments in two evaluation settings, one in the original uncompressed evaluation setting and the other in the compressed setting, using the same set of evaluation measures. This helps to understand and identify any bias in the transformer based models and also to analyze whether the model bias is impacted by image compression. Figure 1 shows the entire architecture of the proposed work, with an example set of input images and prediction scenario to better understand the workflow and how this study conducts the bias exploration. This example only depicts the case of analyzing bias in GAN images111The GAN images in this example is collected from the StyleGAN2 [33] generated images, but the study considers analysis over both the real and GAN class of images.
The major contributions of the proposed work are:
-
•
This work explores bias in the transformer based forensic systems that classify natural and GAN generated images
-
•
The work tries to understand the impact of image compression on model bias by analyzing and comparing the model performances across uncompressed and compressed evaluation settings
-
•
The work procures a bias evaluation corpora to analyze bias in gender, racial, affective, and intersectional domains
-
•
The work conducts extensive bias evaluations in each of the domains using individual and pairwise evaluation measures
The rest of the paper is organized as section II presents a brief survey on the works in literature that specifically analyze bias in image forensic tasks classifying natural and GAN generated images and explains the differences of the proposed study in the context of the works in the literature. Section III discusses in detail the construction of transformer based models for the task of classifying natural and GAN images. Section IV explains in detail the evaluation domains, evaluation corpora, and evaluation measures used for bias analysis experiments. Section V present the results and discussions of both the uncompressed and compressed evaluation settings and finally section VI presents the conclusions and future directions of the work.
II Related work and Our work in context
Many works are seen to be reported in the literature studying fairness in image based research problems, such as in the areas of face recognition [20], image classification [21], medical image processing [22], etc. But comparably only a very few studies explore bias in forensics systems, and amongst those studies, most of them work on videos, i.e., Deep Fake videos. Trinh and Liu [23] explore bias in three deep fake detection models Xception [24], MesoInception-4 [7] and Face X-Ray [8], using gender and race balanced Deep Fake face datasets. Their study observes high racial bias in the predictions of these Deep Fake detection models. They could also observe that one of the most popularly used datasets for training the models for Deep Fake detection, FaceForensics++ [25], is also highly biased towards female Caucasian social groups. Hazirbas et al. [11] proposes a video dataset to analyze the robustness of top-winning five models of DFDC dataset [26] for the domains gender, skin type, age, and lighting. They could observe that all the models are biased against dark skin people and hence find that these five models are not generalizable to all groups of people. Pu et al. [12] explores gender bias in one of the Deep Fake detection models MesoInception-4, in the presence of certain make-up anomalies, using the FaceForensics dataset. Their study is centered on analyzing these models at various prominence levels of the anomaly in the female and male social groups. Their observations are that the model is biased towards both genders, but mostly towards the female group. Xu et al. [27] explores bias in three Deep Fake detection models EfficientNetB0 [28], Xception [24], and Capsule-Forensics-v2 [29], by conducting evaluations on five Deep Fake datasets which are annotated with 47 attributes including non-demographic and demographic attributes. Their observations state that these models are highly unfair towards many of these attributes.
II-A The proposed work in context of the literature
In the context of the previous works in the literature that analyze bias in image forensic algorithms classifying natural and GAN generatead images [23, 11, 12, 27], the proposed work is the first work, to the best knowledge, that explores bias in transformer based image forensic models classifying natural and GAN generated images. Also, the proposed work is the first work, to the best knowledge, to study the role/impact of image compression in model biases. The work tries to unveil any existence of bias in gender, racial, affective, and even intersectional domains using a vast set of individual and pairwise evaluation measures, and sets aside the mitigation of these biases outside the scope of this work, for future studies.
III Classification of natural and GAN generated images
This section discusses the visual transformer based deep learning models that are investigated for fairness in this study, the dataset used to fine-tune these transformer based models, and the construction of classifier models using these visual transformers for the task of classifying natural and GAN generated images.
III-A Visual Transformer based deep learning models
This work tries to identify bias in three popular transformer based deep learning models, viz. Vision Transformer (ViT) [30], Convolutional Vision Transformer (CvT) [31] and Swin transformer [32]. The ViT architecture divides the images into fixed size patches in order. These non overlapping patches are then linearly embedded. These embeddings along with the position embeddings of the patches and a learnable classification token are supplied to the transformer encoder block for classification task [30]. CvT architecture utilizes convolutions within the ViT architecture with an aim to improve the performance of ViT. The major difference includes using a set of transformers with convolutional token embedding, convolutional projection and convolutional transformer block [31]. Swin transformer follows hierarchical architecture based on Shifted WINdow approach [32]. All these transformer based architectures are recently very popular and widely used in many of the image based tasks due to their capability to produce high classification accuracies [13].
III-B Fine-tuning corpora
To build transformer based forensic classifier systems that classify GAN and Real images, each of the pre-trained transformer based models are fine-tuned using a GAN versus Real image dataset that consists of a total of 10,000 images; each class containing 5000 images. The GAN images are collected from the StyleGAN2 image generative algorithm [33] and the Real class of images are collected from the Flickr-Faces-HQ (FFHQ) dataset [34]. The total fine-tuning corpora is split in the ratio 60:20:20 for training, validation and testing respectively.
III-C Natural image versus GAN image classifier model
Natural image versus GAN image classification is formulated as a two class classification task that can classify images under evaluation into either of the two classes GAN or Real. The classifiers are fed with the training data ( indicates ith image in train data) and associated ground truth classes () such that to find a best fitting model . To build the classifier models, the three pre-trained transformer networks are fine-tuned using the task specific GAN versus Real image dataset. To build the ViT based classifier the ViT-Large network that employs a patch size of 16 and pre-trained on the ImageNet-21K [35] image dataset, is used. To build the CvT based classifier the CvT-21 network pre-trained on ImageNet-1k [36] image dataset is used. And, to build the Swin transformer based classifier the Swin-Large network that employs a patch size of 4 and window size of 7 and pre-trained on ImageNet-21K dataset is used. The size of the input image for all the three networks is 224 224. For training, the learning rate is set to , batch size as 4, and 25 epochs. The total number of trainable parameters are 303 M for ViT, 31.2 M for CvT and 194 M for Swin transformer. The fine-tuning experiments of transformers are conducted on on the deep learning workstation equipped with Intel Xeon Silver 4208 CPU at 2.10 GHz, 256 GB RAM, and two GPUs of NVIDIA Quadro RTX 5000 (16GB each), using the libraries Torch (version 1.13.1+cu116), PyTorch Lightning (version 1.9.0), Transformer (version 4.17.0), Tensorflow (version 2.8.0), and Keras (version 2.8.0). Table I shows the test accuracy of the fine-tuned transformer based models in classifying natural and GAN images.
| Model | Total test accuracy | GAN accuracy | Real accuracy |
|---|---|---|---|
| ViT | 91.75 | 94.9 | 88.6 |
| CvT | 99.60 | 99.6 | 99.6 |
| Swin | 99.70 | 99.9 | 99.5 |
IV Bias Analysis in forensic classifier systems


This study tries to identify bias (if any), in the transformer based Natural image versus GAN generated image classifier systems. Fairness analysis is conducted in the gender, racial, affective, and also in the intersectional domains. Gender domain based bias analysis considers the female and male social groups, the racial domain considers the dark skin people and light skin people social groups, the affective domain considers the smiling face and non smiling face groups and intersectional bias analysis considers two domains simultaneously, such as dark skin female, light skin male, etc. Apart from analyzing bias by comparing performances of each social group against the other using individual evaluation measures, this study also performs pairwise analysis of social groups. Bias analysis in this forensic task of classifying natural and GAN generated images using transformer based models is conducted using two categories of evaluation corpora, one consisting of the original uncompressed GAN and Real evaluation corpora and the other is the JPEG compressed version of the same evaluation corpora. That is, in the first phase of bias analysis, the transformer based models are evaluated over the uncompressed evaluation corpora using a set of evaluation measures, and in the second phase of analysis the same evaluation corpora is JPEG compressed with a quality factor of 90 and analyzed using the same evaluation measures. The details of evaluation corpora and evaluation measures are detailed below.
IV-A Evaluation Domains and Evaluation Corpora
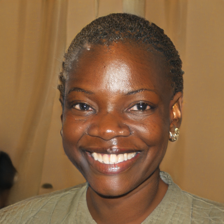
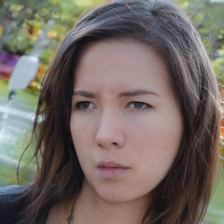
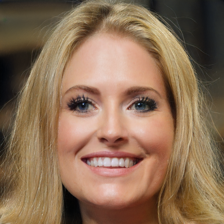
This work procures an evaluation corpora for bias analysis with respect to gender, racial, and affective domains. To procure the evaluation corpora we utilize Natural images from the FFHQ dataset [34] and GAN images from the StyleGAN2 [33] generated images. From both Natural and GAN generated images we collected 1000 female face images and 1000 male face images each for the gender bias analysis, 1000 dark skin and 1000 light skin face images for racial bias analysis, and 1000 smiling and 1000 non smiling face images for affective bias analysis. This also gives chances for intersectional bias analysis with 500 images each in the category of dark skin female, dark skin male, light skin female, and light skin male faces. A sample set of GAN images from the evaluation corpora used in this study is provided in figure 2 (even though the real class of images in the evaluation corpora are collected from the publicly available FFHQ dataset which is properly cited as [34], we avoid portraying the images of real people for showing the examples of each social groups, and only use the sample images from the class GAN).
IV-B Evaluation Measures
Bias analysis in this study focuses on comparing the classification performance of the transformer based models over different social groups (or groups) within the same domain using certain evaluation measures. These analyses are performed to compare social groups within a single domain (e.g. Male vs. Female in gender domain) as well as to compare social groups within intersectional domains (e.g. Dark skin Male vs. Light skin Male). Apart from the measures that evaluate individual social groups, this study also utilizes pairwise evaluation measures to quantify bias associated with a pair of social groups in single domain or intersectional groups in a domain. The measures considering individual social groups in a domain and pairwise measures considering two social groups simultaneously are detailed below.
Individual measures considering a single group within a domain
These measures are defined by the probability of correct and incorrect classifications in a social group within a domain. Social groups over which the individual measures are evaluated include, Female (F) and Male (M) social groups in the gender domain, Dark skin (D) and Light skin (L) social groups in the racial domain, Non-smiling (Ns) and Smiling (S) groups in the affective domain, and Dark skin Female (DF), Dark skin Male (DM), Light skin Female (LF) and Light skin Male (LM) groups in the intersectional domain.
-
•
Total Accuracy [20, 37]: This popular classification measure computes the total classification accuracy of a model over a social group in a domain. Total accuracy gives the percentage of images in a social group that is correctly classified into the natural image category and the GAN generated image category.
(1) where, TP and TN are the number of true positives and true negatives, and FP and FN denote false positives and false negatives, respectively.
-
•
GAN Accuracy: This measure gives the accuracy of the class GAN images, i.e., the number of GAN images correctly classified as GAN images. This measure gives the True Positive Rate (TPR) [37] of the model
(2) -
•
Real Accuracy: This measure gives the accuracy of the class of natural images, i.e., the number of natural images correctly classified as natural images. This measure is the True Negative Rate (TNR) [37] of the model.
(3) - •
-
•
False Negative Rate (FNR) [37]: FNR gives the ratio of GAN images misclassified as Real images, among the total number of GAN images.
(5)
During evaluation, the results obtained for each of these individual measures across the social groups within a domain are correspondingly compared, rather than looking for ideal high classification results.
Pairwise evaluation measures that considers a pair of social groups within a domain
The pairwise evaluations are computed on a pair of social groups and within a domain. indicates the ground truth class of ith image in the social group (for ), and indicates the ground truth class of jth image in the group (for ), where and indicates total number of instances in the social groups and , respectively. Also, and indicate the corresponding prediction classes, and and indicate prediction intensities (confidence scores of prediction), of and , respectively. Pairwise measures are evaluated over the pairs, Female vs. Male (F M) in gender domain, Dark skin vs. Light skin (D L) in racial domain, Non-smiling vs. Smiling (Ns S) in affective domain, and Dark Female vs. Dark Male (D+F D+M), Light Female vs. Light Male (L+F L+M), Dark Female vs. Light Female (D+F L+F), Dark Male vs. Light Male (D+M L+M), Dark Female vs. Light Male (D+F L+M) and Light Female vs. Dark Male (L+F D+M) in the intersectional domain.
-
•
Average Confidence Score (ACS) [38]: This measure is computed using the ratio between average prediction intensities of the two social groups under evaluation.
(6) An ideal unbiased scenario gives ACS = 0 for a pair. Positive values of ACS show that the prediction intensities of the social group are lower than , whereas negative ACS indicates that the prediction intensities of the social group are higher than .
-
•
Demographic Parity (DP) [38, 1]: This is one of the popular measures to quantify bias in a classification model, by analyzing similarity (or dissimilarity) in the classifications of the model for two social groups in a domain.
(7) where, and are the probabilities of the groups and , respectively, for being classified into a class where, in the pair, is the group with higher probability. That is, the measure DP recommends that the probability of predicting a class needs to be similar for both the social groups and within a domain. Hence, an ideal unbiased case is indicated by DP = 1 for a pair, and lower values of DP indicate higher bias. A threshold of 0.80 is commonly used for identifying lower DP values, indicating high model bias [39].
-
•
Equal Opportunity (EO) [1, 39]: This measure is also similar to DP, but EO considers the ground truth in addition to the predicted classes.
(8) where, and indicates the ground truth class of group and . Similar to DP, an ideal unbiased case is indicated by EO = 1 for a pair, and lower values of EO indicate higher bias.
V Results and analysis
In this section, initially the results of bias analysis of each transformer based model over the original uncompressed evaluation corpora are detailed, followed by the evaluation results of the compressed evaluation corpora. In both original (uncompressed) and compressed evaluation settings, for each of the transformer based models, the results of individual and pairwise evaluations are tabulated for the gender, racial, affective, and intersectional domains.
V-A Bais analysis in the uncompressed evaluation setting
V-A1 ViT
The bias evaluation results of the transformer based model ViT using individual and pairwise measures for various domains is shown in table II
| Individual measures based analysis | ||||||||||
|---|---|---|---|---|---|---|---|---|---|---|
| Metric | Gender | Race | Affective | Intersection | ||||||
| F | M | D | L | Ns | S | D+F | D+M | L+F | L+M | |
| Acc | 88.20 | 92.65 | 92.50 | 88.35 | 92.70 | 89.75 | 90.70 | 94.30 | 85.70 | 91.00 |
| Accgan | 93.10 | 92.70 | 91.50 | 94.30 | 93.90 | 95.10 | 89.80 | 93.20 | 96.40 | 92.20 |
| Accreal | 83.30 | 92.60 | 93.50 | 82.40 | 91.50 | 84.40 | 91.60 | 95.40 | 75.00 | 89.80 |
| FPR | 0.167 | 0.074 | 0.065 | 0.176 | 0.085 | 0.156 | 0.084 | 0.046 | 0.250 | 0.102 |
| FNR | 0.069 | 0.073 | 0.085 | 0.057 | 0.061 | 0.049 | 0.102 | 0.068 | 0.036 | 0.078 |
| Pairwise measures based analysis | |||||||||||||||||||||
| Gender | Race | Affect | Intersection | ||||||||||||||||||
| F M | D L | Ns S |
|
|
|
|
|
|
|||||||||||||
| GAN | |||||||||||||||||||||
| ACS | -0.0036 | +0.0173 | +0.0049 | +0.0173 | -0.0232 | +0.0368 | -0.0029 | +0.0145 | -0.0202 | ||||||||||||
| DP | 0.9117 | 0.8758 | 0.9250 | 0.9959 | 0.8435 | 0.7989 | 0.9551 | 0.9590 | 0.7956 | ||||||||||||
| EO | 0.9957 | 0.9703 | 0.9874 | 0.9635 | 0.9564 | 0.9315 | 0.9893 | 0.9740 | 0.9668 | ||||||||||||
| Real | |||||||||||||||||||||
| ACS | +0.0252 | -0.0212 | -0.0200 | +0.0139 | +0.0398 | -0.0368 | -0.0095 | +0.0045 | +0.0489 | ||||||||||||
| DP | 0.9029 | 0.8637 | 0.9150 | 0.9961 | 0.8053 | 0.7721 | 0.9550 | 0.9588 | 0.7691 | ||||||||||||
| EO | 0.8996 | 0.8813 | 0.9224 | 0.9602 | 0.8352 | 0.8188 | 0.9413 | 0.9804 | 0.7862 | ||||||||||||
The top portion of the table II presents the results of individual measures of bias analysis of ViT. In the gender domain, the total model accuracy of ViT over the female group is less than the male group by 4.45 percentage points. This bias in accuracy against the female group in the gender domain is observed to be very high for class Real, i.e. the accuracy of the female group is less than male by 9.3 percentage points, showing high gender bias towards the female social group. Whereas, for the class GAN, the accuracy of the male group is less than the female group only by a very small value of 0.4 percentage points. In the gender domain, the FPR ratio is higher for the female group than the male group. This shows that the Real images of females are highly likely to be misclassified as GAN generated images than the male group (an observation similar to the one reported in [23]). Whereas, FNR does not show a very high difference between both the genders, which shows that GAN images of males have only a very less chance of getting misclassified as Real images.
In the racial domain, the total model accuracy of ViT over light skinned social group is less by 4.15 percentage points than dark skin group. This bias against light skin people is much more evident in the case of class Real, where a difference of 11.1 percentage points indicates high racial bias against light skin people. Whereas, in the case of GAN images, there is bias against dark skin, i.e., the accuracy of the dark skin group is less than the light skin group by 2.8 percentage points. FPR shows a higher value for light skin group than dark skin indicating that the Real images of light skin people are highly likely to be misclassified as GAN images and FNR shows that GAN images of dark skinned people are slightly likely to be misclassified as Real images.
In the affective domain, the total model accuracy of smiling faces is less than non-smiling faces by 2.95 percentage points. A similar pattern is shown in Real image accuracy, where smiling faces have 7.1 percentage points of less accuracy than non-smiling faces. Whereas in the case of GAN images, the accuracy of smiling faces is higher than non-smiling faces by 1.2 percentage points. FPR shows high value for smiling faces indicating that Real images of smiling people are highly likely to be misclassified as GAN. FNR shows slightly higher values for non-smiling faces indicating that GAN images of non-smiling faces have a slight probability of being misclassified as Real images.
From the results of the intersectional domain, it can be observed that the total model accuracies vary across different intersectional groups. A higher accuracy is observed for dark skin male group, and a lower accuracy for light skin female group, a difference of 8.6 percentage points, indicating bias. Whereas for class GAN, a higher accuracy of 96.4 percentage is obtained for light skin female group, which is the highest accuracy obtained across various groups. The lowest accuracy in class GAN is for the dark skin female group, a difference of 6.6 percentage points compared to the highest accuracy group. In class Real the highest accuracy is obtained for dark skin male group and lowest for light skin female group, with a very high difference of 20.4 percentage points between these groups; This shows a very large bias. FPR stands highest for the light skin female group indicating that the Real images of light skin females have a very high probability of being misclassified as GAN images. FNR is highest for the dark skin female group indicating that the GAN images of dark skin females have a very high probability of being misclassified as Real images.
The bottom portion of the table II presents the results of pairwise measures of bias analysis of ViT for both GAN and Real classes. In the gender domain, for class GAN, the negative ACS value for the Female vs. Male pair shows that the prediction intensities of the female group are higher than males. The measure DP has a low value, but since it is not less than the threshold of 0.80 this measure does not report bias in the Female vs. Male pair. EO has a high value and does not report bias in GAN predictions of Female vs. Male pair. For class Real, positive ACS for Female vs. Male pair shows that the prediction intensities of the male group are higher than females. The measures DP and EO have low values. But since DP is not lower than the threshold 0.80, it does not report bias in Real predictions of Female vs. Male pair.
In the racial domain for class GAN, the positive ACS value for Dark skin vs. Light skin pair shows that the prediction intensities of the light skin group are higher than dark skin. The measure DP has a low value, but since it is not less than the threshold of 0.80 this measure does not report bias in this pair. EO has a high value and does not report bias in GAN predictions of this pair. For the class Real, negative ACS for the pair shows that the prediction intensities of the dark skin group are higher than light skin. The measures DP and EO have low values, where DP is not lower than the threshold of 0.80 and hence do not report bias in Real predictions of this pair.
In the affective domain, for class GAN, the positive ACS value for the Non-smiling vs. Smiling pair shows that the prediction intensities of the smiling group are higher than the non-smiling group. The measure DP has a low value, but since it is not less than the threshold of 0.80 this measure does not report bias in this pair. EO has a high value and does not report bias in GAN predictions of this pair. For the class Real, negative ACS for the pair shows that the prediction intensities of the non-smiling group are higher than the smiling group. The measures DP and EO have low values. But since DP is not lower than the threshold of 0.80 and hence do not report bias in Real predictions of this pair.
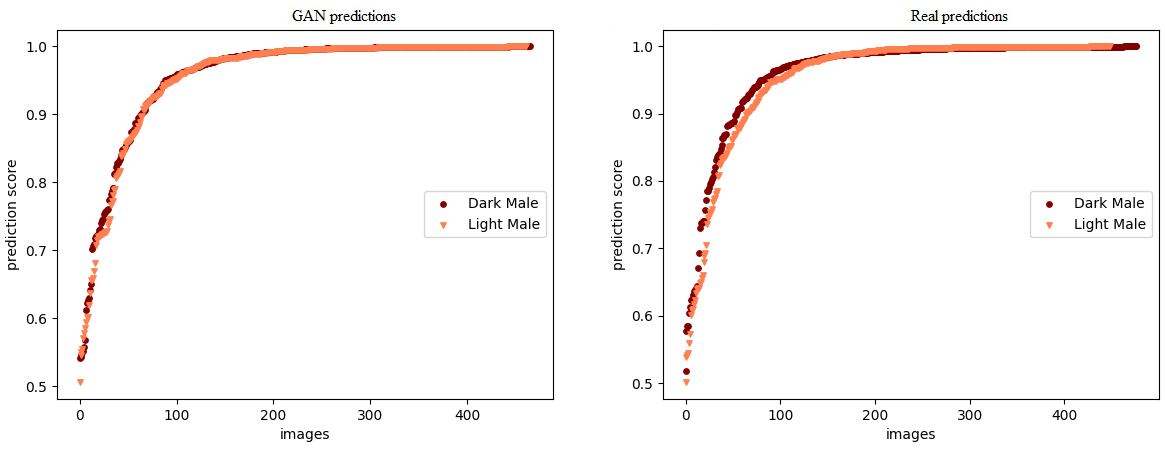
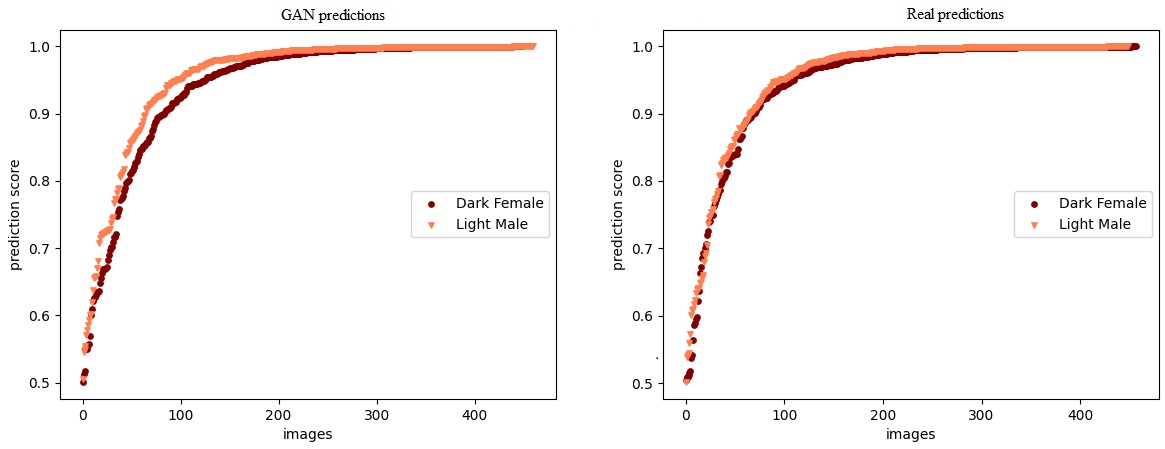
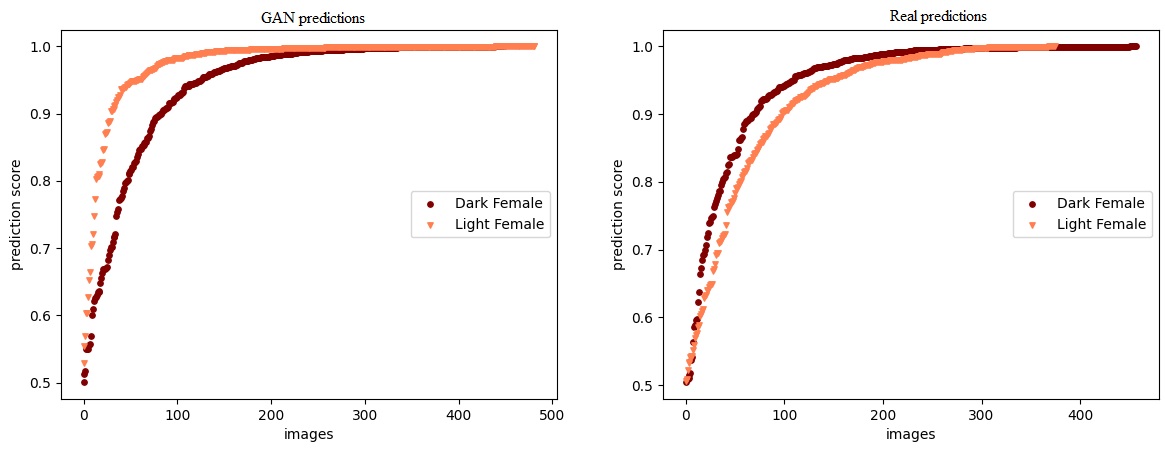
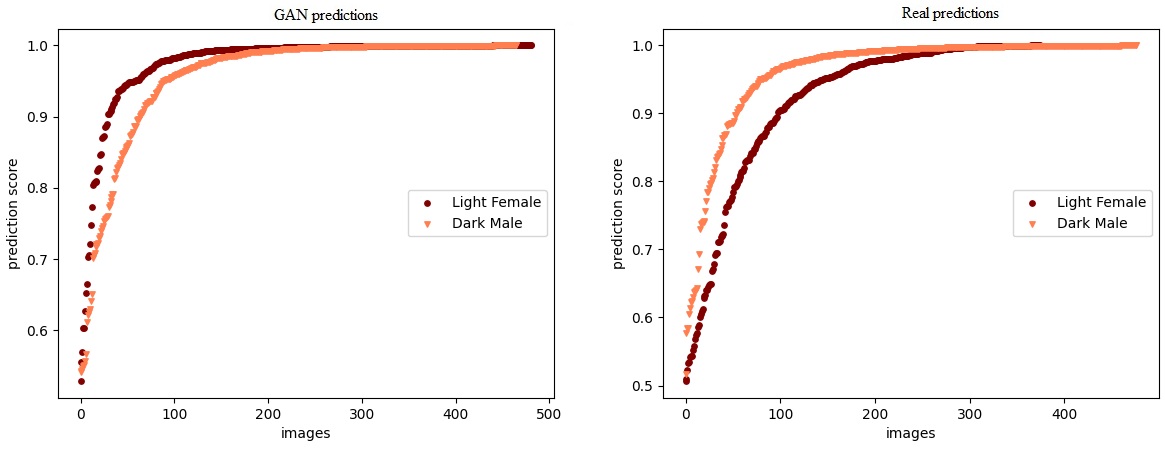
In the intersectional domain, for the class GAN, the measure DP is very low for the pairs involving the light skin female, i.e., {Light skin Female vs. Light skin Male}, {Dark skin Female vs. Light skin Female} and {Light skin Female vs. Dark skin Male}. Particularly for the pairs {Dark skin Female vs. Light skin Female} and {Light skin Female vs. Dark skin Male}, DP is less than the threshold of 0.80 and indicates high bias. Similarly in class Real also, pairs involving the light skin female group show bias with very low values for DP and even EO. That is, there exist bias in the {Light skin Female vs. Light skin Male}, {Dark skin Female vs. Light skin Female} and {Light skin Female vs. Dark skin Male} intersectional pairs. The intensity (confidence) plots of a set of unbiased and biased pairs in the intersectional domain are shown in figs. 3 and 4. The figs. 3a and 3b are the intensity predictions of the unbiassed intersectional pairs {Dark skin Male vs. Light skin Male} and {Light skin Female vs. Light skin Male}, and it can be observed that there is not much difference in prediction intensities within these pairs, for both the classes, GAN and Real. Whereas, in figs. 4a and 4b of the biassed intersectional pairs {Dark skin Female vs. Light skin Female} and {Light skin Female vs. Dark skin Male} there is comparatively much more difference in prediction intensities within these pairs, for both the classes, GAN and Real.
V-A2 CvT
The bias evaluation results of the transformer based model CvT for various domains is shown in table III. From the top portion of the table showing the results of individual measures, it can be observed that the model shows high and similar accuracies for all categories of social groups within each of the domains. The FPR and FNR values are also very low and similar across the social groups within each domain. The bottom portion of the table presents the results of pairwise analysis of CvT for various domains. The measures DP and EO also report very high values, nearly similar to an ideal unbiased scenario. Altogether, the individual and pairwise measures do not show the existence of significant bias in the CvT based transformer model.
| Individual measures based analysis | ||||||||||
|---|---|---|---|---|---|---|---|---|---|---|
| Metric | Gender | Race | Affective | Intersection | ||||||
| F | M | D | L | Ns | S | D+F | D+M | L+F | L+M | |
| Acc | 99.05 | 99.15 | 98.80 | 99.40 | 99.45 | 99.40 | 98.80 | 98.80 | 99.30 | 99.50 |
| Accgan | 98.40 | 98.60 | 98.10 | 98.90 | 99.10 | 99.20 | 98.00 | 98.20 | 98.80 | 99.00 |
| Accreal | 99.70 | 99.70 | 99.50 | 99.90 | 99.80 | 99.60 | 99.60 | 99.40 | 99.80 | 100.0 |
| FPR | 0.003 | 0.003 | 0.005 | 0.001 | 0.002 | 0.004 | 0.004 | 0.006 | 0.002 | 0.000 |
| FNR | 0.016 | 0.014 | 0.019 | 0.011 | 0.009 | 0.008 | 0.020 | 0.018 | 0.012 | 0.010 |
| Pairwise measures based analysis | |||||||||||||||||||||
| Gender | Race | Affect | Intersection | ||||||||||||||||||
| F M | D L | Ns S |
|
|
|
|
|
|
|||||||||||||
| GAN | |||||||||||||||||||||
| ACS | +0.0050 | +0.0151 | -0.0010 | +0.0064 | +0.0036 | +0.0165 | +0.0138 | +0.0200 | -0.0103 | ||||||||||||
| DP | 0.9980 | 0.9960 | 0.9970 | 0.9960 | 1.0000 | 0.9939 | 0.9980 | 0.9939 | 0.9980 | ||||||||||||
| EO | 0.9980 | 0.9919 | 0.9990 | 0.9980 | 0.9980 | 0.9919 | 0.9919 | 0.9899 | 0.9939 | ||||||||||||
| Real | |||||||||||||||||||||
| ACS | -0.0005 | +0.0063 | +0.0012 | -0.0004 | -0.0007 | +0.0064 | +0.0062 | +0.0058 | -0.0068 | ||||||||||||
| DP | 0.9980 | 0.9961 | 0.9970 | 0.9961 | 1.0000 | 0.9941 | 0.9980 | 0.9941 | 0.9980 | ||||||||||||
| EO | 1.0000 | 0.9960 | 0.9980 | 0.9980 | 0.9980 | 0.9980 | 0.9940 | 0.9960 | 0.9960 | ||||||||||||
V-A3 Swin transformer
The bias evaluation results of the Swin transformer based model for various domains is shown in table IV. Similar to the previous model, it can be observed from the top portion of the table with individual measures that, the Swin transformer shows high and similar accuracies for all categories of social groups. The FPR and FNR values are also very low and similar across the social groups within each domain. Bottom portion of the table presents the results of pairwise analysis of the Swin transformer for various domains. The measures DP and EO also shows very high values, nearly similar to an ideal unbiased scenario. Altogether, the individual and pairwise measures do not show any existence of significant bias in the Swin transformer model.
| Individual measures based analysis | ||||||||||
|---|---|---|---|---|---|---|---|---|---|---|
| Metric | Gender | Race | Affective | Intersection | ||||||
| F | M | D | L | Ns | S | D+F | D+M | L+F | L+M | |
| Acc | 99.30 | 99.95 | 99.70 | 99.55 | 99.80 | 99.40 | 99.40 | 100.0 | 99.20 | 99.90 |
| Accgan | 99.40 | 100.0 | 99.60 | 99.80 | 99.80 | 99.60 | 99.20 | 100.0 | 99.60 | 100.0 |
| Accreal | 99.20 | 99.90 | 99.80 | 99.30 | 99.80 | 99.20 | 99.60 | 100.0 | 98.80 | 99.80 |
| FPR | 0.008 | 0.001 | 0.002 | 0.007 | 0.002 | 0.008 | 0.004 | 0.000 | 0.012 | 0.002 |
| FNR | 0.006 | 0.000 | 0.004 | 0.002 | 0.002 | 0.004 | 0.008 | 0.000 | 0.004 | 0.000 |
| Pairwise measures based analysis | |||||||||||||||||||||
| Gender | Race | Affect | Intersection | ||||||||||||||||||
| F M | D L | Ns S |
|
|
|
|
|
|
|||||||||||||
| GAN | |||||||||||||||||||||
| ACS | +0.0026 | +0.0034 | -0.0002 | +0.0059 | -0.0007 | +0.0067 | +0.0002 | +0.0060 | -0.0009 | ||||||||||||
| DP | 0.9990 | 0.9930 | 0.9960 | 0.9960 | 0.9940 | 0.9881 | 0.9980 | 0.9940 | 0.9921 | ||||||||||||
| EO | 0.9940 | 0.9980 | 0.9980 | 0.9920 | 0.9960 | 0.9960 | 1.0000 | 0.9920 | 0.9960 | ||||||||||||
| Real | |||||||||||||||||||||
| ACS | -0.0014 | +0.0010 | +0.0008 | -0.0006 | -0.0022 | +0.0018 | +0.0002 | -0.0004 | -0.0024 | ||||||||||||
| DP | 0.9990 | 0.9930 | 0.9960 | 0.9960 | 0.9940 | 0.9880 | 0.9980 | 0.9940 | 0.9920 | ||||||||||||
| EO | 0.9930 | 0.9950 | 0.9940 | 0.9960 | 0.9900 | 0.9920 | 0.9980 | 0.9980 | 0.9980 | ||||||||||||
V-B Bais analysis in the compressed evaluation setting
V-B1 ViT
| Individual measures based analysis | ||||||||||
|---|---|---|---|---|---|---|---|---|---|---|
| Metric | Gender | Race | Affective | Intersection | ||||||
| F | M | D | L | Ns | S | D+F | D+M | L+F | L+M | |
| Acc | 85.90 | 89.10 | 89.15 | 85.85 | 89.40 | 88.40 | 87.30 | 91.00 | 84.50 | 87.20 |
| Accgan | 86.10 | 84.60 | 82.80 | 87.90 | 86.00 | 89.20 | 80.40 | 85.20 | 91.80 | 84.00 |
| Accreal | 85.70 | 93.60 | 95.50 | 83.80 | 92.80 | 87.60 | 94.20 | 96.80 | 77.20 | 90.40 |
| FPR | 0.143 | 0.064 | 0.045 | 0.162 | 0.072 | 0.124 | 0.058 | 0.032 | 0.228 | 0.096 |
| FNR | 0.139 | 0.154 | 0.172 | 0.121 | 0.140 | 0.108 | 0.196 | 0.148 | 0.082 | 0.160 |
| Pairwise measures based analysis | |||||||||||||||||||||
| Gender | Race | Affect | Intersection | ||||||||||||||||||
| F M | D L | Ns S |
|
|
|
|
|
|
|||||||||||||
| GAN | |||||||||||||||||||||
| ACS | -0.0068 | +0.0157 | +0.0066 | +0.0212 | -0.0323 | +0.0411 | -0.0113 | +0.0101 | -0.0208 | ||||||||||||
| DP | 0.9064 | 0.8386 | 0.9173 | 0.9751 | 0.8168 | 0.7522 | 0.9444 | 0.9209 | 0.7714 | ||||||||||||
| EO | 0.9826 | 0.9420 | 0.9641 | 0.9437 | 0.9150 | 0.8758 | 0.9859 | 0.9571 | 0.9281 | ||||||||||||
| Real | |||||||||||||||||||||
| ACS | +0.0165 | -0.0121 | -0.0168 | +0.0129 | +0.0216 | -0.0174 | -0.0085 | +0.0045 | 0.0298 | ||||||||||||
| DP | 0.9138 | 0.8509 | 0.9214 | 0.9807 | 0.8026 | 0.7504 | 0.9534 | 0.9350 | 0.7652 | ||||||||||||
| EO | 0.9156 | 0.8775 | 0.944 | 0.9731 | 0.8540 | 0.8195 | 0.9339 | 0.9597 | 0.7975 | ||||||||||||
The results of individual and pairwise measures of bias analysis of the transformer based model ViT for various domains on the JPEG compressed evaluation corpora is shown in table V. Similar to the observations discussed in the study [10], it can be observed that for compressed data the accuracies of the models decreases, and this decrease in accuracy is much higher for the class GAN than the class Real. In this compressed evaluation setting of ViT, it can also be observed that the difference in GAN accuracies (Accgan) between the groups within each of the domains has increased than its previous uncompressed evaluation setting. For example, in the previous uncompressed evaluation setting of ViT, the difference in GAN accuracies between female and male groups within the gender domain is 0.4 percentage points (in table II); But, in this compressed setting, this difference has increased to 1.5 percentage points. Similarly, 2.8 percentage points of difference in racial domain between dark skin and light skin groups in the previous uncompressed evaluation setting have increased to 5.1 percentage points in this compressed setting, and 1.2 percentage points of difference between non-smiling and smiling groups of affective domain have increased to 3.2 percentage points. Similar to the previous uncompressed setting, here also in the class GAN of intersectional domain, light skin females obtains the highest accuracy and dark skin female group obtains the lowest accuracy, but the difference in accuracies (Accgan) between these groups increases to 11.4 percentage points compared to the difference of 6.6 percentage points in the previous uncompressed setting. Similarly in this compressed setting also, the FPR ratio is higher for the female group than the male group indicating that the Real images of females are highly likely to be misclassified as GAN generated images than the male group. Whereas, FNR shows similar values for both genders, and shows that GAN images of males have only a very insignificant chance of getting misclassified as Real images. Altogether, the individual measures show that in the class GAN, the gender bias against the male group (lower accuracy for male than female), racial bias against dark skin, affective bias against non-smiling group, and intersectional biases, has increased in the compressed evaluation setting the the previous uncompressed evaluation setting.
Bottom portion of the table V presents the results of pairwise measures of bias analysis of the transformer based model ViT for various domains on the JPEG compressed evaluation corpora. The tabulated results of pairwise analysis show that, in this compressed setting, for class GAN there is a decrease in DP and EO values when compared to its previous uncompressed evaluation setting. For example, the DP of {Dark skin vs. Light skin} for class GAN has decreased from 0.8758 (in previous uncompressed evaluation setting, table II) to 0.8386 (in current compressed evaluation setting, table V), DP of {Dark skin Female vs Light skin Female} has decreased from 0.7989 to 0.7522, etc. Thus, the pairwise evaluations on ViT also shows that the bias in class GAN is higher in the compressed evaluation setting than the uncompressed evaluation setting. This indicates that bias in class GAN gets amplified with compression.
V-B2 CvT
The results of individual and pairwise measures of bias analysis of the transformer based model CvT for various domains on the JPEG compressed evaluation corpora is shown in table VI. The top portionof the table shows results of individual measures. Similar to ViT, compression decreases the accuracies of the CvT model, particularly the class GAN accuracy (Accgan), whereas class Real (Accreal) maintains its high accuracy. But compared to the model ViT, the drop in the accuracies for class GAN of the CvT model is massively very high. Also, this accuracy decay in CvT is not similar across different social groups within a domain, indicating high bias.
| Individual measures based analysis | ||||||||||
|---|---|---|---|---|---|---|---|---|---|---|
| Metric | Gender | Race | Affective | Intersection | ||||||
| F | M | D | L | Ns | S | D+F | D+M | L+F | L+M | |
| Acc | 51.65 | 51.15 | 51.05 | 51.75 | 51.70 | 52.05 | 50.80 | 51.30 | 52.50 | 51.00 |
| Accgan | 34.00 | 23.00 | 22.00 | 35.00 | 34.00 | 42.00 | 1.80 | 2.60 | 5.00 | 2.00 |
| Accreal | 99.90 | 100.0 | 99.90 | 100.0 | 100.0 | 99.90 | 99.80 | 100.0 | 100.0 | 100.0 |
| FPR | 0.001 | 0.000 | 0.001 | 0.000 | 0.000 | 0.001 | 0.002 | 0.000 | 0.000 | 0.000 |
| FNR | 0.966 | 0.977 | 0.978 | 0.965 | 0.966 | 0.958 | 0.982 | 0.974 | 0.950 | 0.980 |
| Pairwise measures based analysis | |||||||||||||||||||||
| Gender | Race | Affect | Intersection | ||||||||||||||||||
| F M | D L | Ns S |
|
|
|
|
|
|
|||||||||||||
| GAN | |||||||||||||||||||||
| ACS | -0.0267 | +0.0591 | -0.0331 | -0.0886 | +0.0432 | -0.0012 | +0.1200 | +0.0420 | -0.0872 | ||||||||||||
| DP | 0.6571 | 0.6571 | 0.7907 | 0.7692 | 0.3999 | 0.3999 | 0.7692 | 1.0000 | 0.5199 | ||||||||||||
| EO | 0.6765 | 0.6280 | 0.8095 | 0.6923 | 0.3999 | 0.3599 | 0.7692 | 0.8999 | 0.5199 | ||||||||||||
| Real | |||||||||||||||||||||
| ACS | +0.0027 | -0.0021 | -0.0027 | +0.0024 | +0.0029 | -0.0024 | -0.0019 | +0.0005 | 0.0048 | ||||||||||||
| DP | 0.9939 | 0.9939 | 0.9954 | 0.9970 | 0.9849 | 0.9849 | 0.9970 | 1.0000 | 0.9878 | ||||||||||||
| EO | 0.9990 | 0.9990 | 0.9990 | 0.9980 | 1.0000 | 0.9980 | 1.0000 | 0.9980 | 1.0000 | ||||||||||||
Bottom portion of the table presents the results of pairwise analysis of CvT for various domains on the JPEG compressed evaluation corpora. From this table, it can be understood that, for the class GAN of the CvT model, the ideal unbiased scenario which was seen in the previous uncompressed evaluation setting of CvT (in table III) has been completely overturned to a very largely biased scenario due to compression. This is because the drop in GAN accuracies are not similar for various groups within a domain (except for the dark skin female vs. light skin male pairs). Whereas, it can be observed that the class Real of the CvT still maintains the ideal unbiased scenario as in the previous uncompressed evaluation setting.
V-B3 Swin transformer
The results of individual and pairwise measures of bias analysis of the Swin transformer based model on the JPEG compressed evaluation corpora is shown in table VII. The top portion of the table shows the results of individual measures. In this model also the GAN accuracy (Accgan) decreases due to compression, thereby decreasing the total model accuracy. Contrary to the previous uncompressed setting of Swin transformer where similar and high accuracies are obtained for all the social groups within each domain, this compressed evaluation setting has eventually brought up differences in GAN accuracies across social groups within each of the domains. That is, the GAN accuracy of the male group is less than the female group by 2.5 percentage points in the gender domain, the dark skin group is less than the light skin group by 4.9 percentage points in the racial domain, and the non-smiling group is less than smiling group by 3.2 percentage points in the affective domain. In the intersectional domain, the highest GAN accuracy is obtained for the light skin female group and lowest for the dark skin female group, a very high accuracy difference of 16.4 percentage points is observed between these two intersectional groups for class GAN. Thus these accuracy differences, indicate high bias in the compressed setting for the class GAN of Swin transformer.
| Individual measures based analysis | ||||||||||
|---|---|---|---|---|---|---|---|---|---|---|
| Metric | Gender | Race | Affective | Intersection | ||||||
| F | M | D | L | Ns | S | D+F | D+M | L+F | L+M | |
| Acc | 83.10 | 82.45 | 81.95 | 83.60 | 84.39 | 85.70 | 79.60 | 84.30 | 86.60 | 80.60 |
| Accgan | 68.20 | 65.70 | 64.50 | 69.40 | 69.60 | 72.80 | 60.00 | 69.00 | 76.40 | 62.40 |
| Accreal | 98.00 | 99.20 | 99.40 | 97.80 | 99.20 | 98.60 | 99.20 | 99.60 | 96.80 | 98.80 |
| FPR | 0.020 | 0.008 | 0.006 | 0.022 | 0.008 | 0.014 | 0.008 | 0.004 | 0.032 | 0.012 |
| FNR | 0.318 | 0.343 | 0.355 | 0.306 | 0.304 | 0.272 | 0.40 | 0.310 | 0.236 | 0.376 |
| Pairwise measures based analysis | |||||||||||||||||||||
| Gender | Race | Affect | Intersection | ||||||||||||||||||
| F M | D L | Ns S |
|
|
|
|
|
|
|||||||||||||
| GAN | |||||||||||||||||||||
| ACS | -0.0008 | -0.0028 | -0.0020 | +0.0242 | -0.0254 | +0.0213 | -0.0284 | -0.0035 | 0.0029 | ||||||||||||
| DP | 0.9473 | 0.9092 | 0.9488 | 0.8761 | 0.7989 | 0.7638 | 0.9164 | 0.9559 | 0.8718 | ||||||||||||
| EO | 0.9633 | 0.9294 | 0.9560 | 0.8695 | 0.8167 | 0.7853 | 0.9043 | 0.9615 | 0.9031 | ||||||||||||
| Real | |||||||||||||||||||||
| ACS | +0.0025 | -0.0057 | -0.0016 | -0.0006 | +0.0057 | -0.0089 | -0.0026 | -0.0032 | 0.0083 | ||||||||||||
| DP | 0.9723 | 0.9518 | 0.9707 | 0.9382 | 0.8826 | 0.8649 | 0.9574 | 0.9798 | 0.9218 | ||||||||||||
| EO | 0.9879 | 0.9839 | 0.9940 | 0.9959 | 0.9797 | 0.9758 | 0.9919 | 0.9959 | 0.9718 | ||||||||||||
Bottom portion of the table presents the results of pairwise analysis of the Swin transformer on the JPEG compressed evaluation corpora. Compared to the previous uncompressed setting of Swin transformer (in table IV) that reports nearly an ideal unbiased scenario, in this compressed setting the DP and EO measures decrease highly for the class GAN indicating an increase in bias in the class GAN. A very high bias for class GAN can be observed particularly in the pairs, light skin female vs. light skin male and dark skin female vs. light skin female.
Altogether, the evaluation results shows that in uncompressed evaluation settings, the evaluation corpora and measures could identify bias in the transformer based model ViT, such as bias in pairs involving light skin female groups e.g., bias in light skin female vs. dark skin male, dark skin female vs. light skin female, etc. Also, the bias analysis in ViT shows that Real images of light skin females have a very high probability of being misclassified as GAN images and GAN images of dark skin females have a very high probability of being misclassified as Real images. Whereas the uncompressed setting could not identify any bias in the CvT and the Swin transformer based models. Whereas, the compressed evaluation setting is able to identify high bias in all three transformer based models, particularly in the class GAN. In the compressed evaluation setting, bias is identified in the intersectional domain for ViT and Swin transformer, and bias is identified in gender, race, affect, and intersectional domains for CvT. That is, the model bias is observed to be impacted by image compression. Moreover, the model bias identified in the uncompressed setting is observed to be amplified in the compressed setting, particularly for the class GAN.
ViT and Swin transformer based models chosen for this study are pre-trained on the ImageNet-21K dataset [35]. As already stated above, more than the uncompressed evaluation settings, these models show a higher bias in their corresponding compressed evaluation settings. On the other hand, the model CvT is pre-trained on the ImageNet-1k dataset [36]. But unlike ViT and Swin transformer, CvT has comparatively a very high transition from an ideal unbiased scenario in the uncompressed evaluation setting to a very largely biased model in the compressed evaluation setting. Where, it can also be assumed that the pre-training corpora may be one of the factors inducing bias in these models.
VI Conclusion
This study explored bias in image forensic algorithms that classify natural and GAN generated images by utilizing the visual transformers viz., ViT, CvT and Swin transformer. The study focused on identifying any existence of bias in the gender, racial, affective, and even intersectional domains, and hence an evaluation corpora consisting of social groups belonging to these domains is procured for the study. Individual and pairwise measures are used for the bias evaluations. The study also examined the role of image compression on model bias, by conducting two sets of evaluation experiments, one set of experiments on the original uncompressed evaluation corpora and the other on the compressed version of the same evaluation corpora, where both these experiments rely on same evaluation measures. This helped to identify the bias of the transformer based models in both the uncompressed and compressed evaluation settings, and also study the impact of image compression on the model bias. The study could unveil bias existences in the transformer based models for the task of distinguishing natural and GAN generated images. The study could also observe that image compression impacts model biases, and particularly compression amplifies the biases of the class of GAN generated images. To help towards the future research, all relevant materials of this study including the source codes will be made publicly available at https://github.com/manjaryp/ImageForgeryFairness and https://dcs.uoc.ac.in/cida/projects/dif/Imageforgeryfairness.html along with the publication.
In the future, there are plans to extend this work to analyze various factors that cause or originate these biases. The evaluation corpora can also be expanded and annotated to explore bias in many other domains. Also, there is a large scope for mitigation of these biases from the models to develop fair forensic systems that one can trust when deployed in the real world.
References
- [1] H. Tian, T. Zhu, W. Liu, and W. Zhou, “Image fairness in deep learning: problems, models, and challenges,” Neural Computing and Applications, vol. 34, no. 15, pp. 12 875–12 893, 2022.
- [2] E. Ntoutsi, P. Fafalios, U. Gadiraju, V. Iosifidis, W. Nejdl, M.-E. Vidal, S. Ruggieri, F. Turini, S. Papadopoulos, E. Krasanakis, I. Kompatsiaris, K. Kinder-Kurlanda, C. Wagner, F. Karimi, M. Fernandez, H. Alani, B. Berendt, T. Kruegel, C. Heinze, K. Broelemann, G. Kasneci, T. Tiropanis, and S. Staab, “Bias in data-driven artificial intelligence systems—an introductory survey,” WIREs Data Mining and Knowledge Discovery, vol. 10, no. 3, p. e1356, 2020. [Online]. Available: https://wires.onlinelibrary.wiley.com/doi/abs/10.1002/widm.1356
- [3] Anoop K., Manjary P. Gangan, Deepak P., and Lajish V. L., “Towards an enhanced understanding of bias in pre-trained neural language models: A survey with special emphasis on affective bias,” in Responsible Data Science. Singapore: Springer Nature, 2022, pp. 13–45.
- [4] Anoop K, Manjary P Gangan, Deepak P, and Lajish VL, “Leveraging heterogeneous data for fake news detection,” in Linking and Mining Heterogeneous and Multi-view Data. Cham: Springer International Publishing, 2019, pp. 229–264. [Online]. Available: https://doi.org/10.1007/978-3-030-01872-6_10
- [5] S. Karnouskos, “Artificial intelligence in digital media: The era of deepfakes,” IEEE Transactions on Technology and Society, vol. 1, no. 3, pp. 138–147, 2020.
- [6] J. Kietzmann, L. W. Lee, I. P. McCarthy, and T. C. Kietzmann, “Deepfakes: Trick or treat?” Business Horizons, vol. 63, no. 2, pp. 135–146, 2020, aRTIFICIAL INTELLIGENCE AND MACHINE LEARNING. [Online]. Available: https://www.sciencedirect.com/science/article/pii/S0007681319301600
- [7] D. Afchar, V. Nozick, J. Yamagishi, and I. Echizen, “Mesonet: a compact facial video forgery detection network,” in 2018 IEEE International Workshop on Information Forensics and Security (WIFS). IEEE, 2018, pp. 1–7.
- [8] L. Li, J. Bao, T. Zhang, H. Yang, D. Chen, F. Wen, and B. Guo, “Face x-ray for more general face forgery detection,” in Proceedings of the IEEE/CVF Conference on Computer Vision and Pattern Recognition (CVPR), June 2020.
- [9] Manjary P. Gangan, Anoop K., and Lajish V. L., “Distinguishing natural and computer generated images using multi-colorspace fused efficientnet,” Journal of Information Security and Applications, vol. 68, p. 103261, 2022. [Online]. Available: https://www.sciencedirect.com/science/article/pii/S2214212622001247
- [10] Manjary P. Gangan, Anoop Kadan, and Lajish V L, “A robust approach towards distinguishing natural and computer generated images using multi-colorspace fused and enriched vision transformer,” 2023.
- [11] C. Hazirbas, J. Bitton, B. Dolhansky, J. Pan, A. Gordo, and C. C. Ferrer, “Towards measuring fairness in ai: The casual conversations dataset,” IEEE Transactions on Biometrics, Behavior, and Identity Science, vol. 4, no. 3, pp. 324–332, 2022.
- [12] M. Pu, M. Y. Kuan, N. T. Lim, C. Y. Chong, and M. K. Lim, “Fairness evaluation in deepfake detection models using metamorphic testing,” in Proceedings of the 7th International Workshop on Metamorphic Testing, ser. MET ’22. New York, NY, USA: Association for Computing Machinery, 2023, p. 7–14. [Online]. Available: https://doi.org/10.1145/3524846.3527337
- [13] S. Khan, M. Naseer, M. Hayat, S. W. Zamir, F. S. Khan, and M. Shah, “Transformers in vision: A survey,” ACM Comput. Surv., vol. 54, no. 10s, sep 2022. [Online]. Available: https://doi.org/10.1145/3505244
- [14] D. Wodajo and S. Atnafu, “Deepfake video detection using convolutional vision transformer,” arXiv preprint arXiv:2102.11126, 2021.
- [15] D. A. Coccomini, N. Messina, C. Gennaro, and F. Falchi, “Combining efficientnet and vision transformers for video deepfake detection,” in Image Analysis and Processing – ICIAP 2022. Cham: Springer International Publishing, 2022, pp. 219–229. [Online]. Available: https://doi.org/10.1007/978-3-031-06433-3_19
- [16] J. Wang, Z. Wu, W. Ouyang, X. Han, J. Chen, Y.-G. Jiang, and S.-N. Li, “M2tr: Multi-modal multi-scale transformers for deepfake detection,” in Proceedings of the 2022 International Conference on Multimedia Retrieval, ser. ICMR ’22. New York, NY, USA: Association for Computing Machinery, 2022, p. 615–623. [Online]. Available: https://doi.org/10.1145/3512527.3531415
- [17] D. A. Coccomini, R. Caldelli, F. Falchi, C. Gennaro, and G. Amato, “Cross-forgery analysis of vision transformers and cnns for deepfake image detection,” in Proceedings of the 1st International Workshop on Multimedia AI against Disinformation, ser. MAD ’22. New York, NY, USA: Association for Computing Machinery, 2022, p. 52–58. [Online]. Available: https://doi.org/10.1145/3512732.3533582
- [18] T. Chuman, K. Iida, and H. Kiya, “Image manipulation on social media for encryption-then-compression systems,” in 2017 Asia-Pacific Signal and Information Processing Association Annual Summit and Conference (APSIPA ASC), 2017, pp. 858–863. [Online]. Available: https://ieeexplore.ieee.org/document/8282153
- [19] J. Wu and W. Sun, “Towards multi-operation image anti-forensics with generative adversarial networks,” Computers & Security, vol. 100, p. 102083, 2021. [Online]. Available: https://www.sciencedirect.com/science/article/pii/S0167404820303564
- [20] J. Buolamwini and T. Gebru, “Gender shades: Intersectional accuracy disparities in commercial gender classification,” in Proceedings of the 1st Conference on Fairness, Accountability and Transparency, ser. Proceedings of Machine Learning Research, vol. 81. PMLR, 23–24 Feb 2018, pp. 77–91. [Online]. Available: https://proceedings.mlr.press/v81/buolamwini18a.html
- [21] N. Schaaf, O. de Mitri, H. B. Kim, A. Windberger, and M. F. Huber, “Towards measuring bias in image classification,” in Artificial Neural Networks and Machine Learning – ICANN 2021. Cham: Springer International Publishing, 2021, pp. 433–445.
- [22] J. S. H. Baxter and P. Jannin, “Bias in machine learning for computer-assisted surgery and medical image processing,” Computer Assisted Surgery, vol. 27, no. 1, pp. 1–3, 2022. [Online]. Available: https://doi.org/10.1080/24699322.2021.2013619
- [23] L. Trinh and Y. Liu, “An examination of fairness of ai models for deepfake detection,” in Proceedings of the Thirtieth International Joint Conference on Artificial Intelligence, IJCAI-21, Z.-H. Zhou, Ed. International Joint Conferences on Artificial Intelligence Organization, 8 2021, pp. 567–574, main Track. [Online]. Available: https://doi.org/10.24963/ijcai.2021/79
- [24] F. Chollet, “Xception: Deep learning with depthwise separable convolutions,” in Proceedings of the IEEE conference on computer vision and pattern recognition, 2017, pp. 1251–1258.
- [25] A. Rossler, D. Cozzolino, L. Verdoliva, C. Riess, J. Thies, and M. Niessner, “Faceforensics++: Learning to detect manipulated facial images,” in Proceedings of the IEEE/CVF International Conference on Computer Vision (ICCV), October 2019.
- [26] B. Dolhansky, J. Bitton, B. Pflaum, J. Lu, R. Howes, M. Wang, and C. C. Ferrer, “The deepfake detection challenge (dfdc) dataset,” arXiv preprint arXiv:2006.07397, 2020.
- [27] Y. Xu, P. Terhörst, K. Raja, and M. Pedersen, “A comprehensive analysis of ai biases in deepfake detection with massively annotated databases,” 2023.
- [28] M. Tan and Q. Le, “EfficientNet: Rethinking model scaling for convolutional neural networks,” in Proceedings of the 36th International Conference on Machine Learning, ser. Proceedings of Machine Learning Research, vol. 97. PMLR, 09–15 Jun 2019, pp. 6105–6114. [Online]. Available: https://proceedings.mlr.press/v97/tan19a.html
- [29] H. H. Nguyen, J. Yamagishi, and I. Echizen, “Use of a capsule network to detect fake images and videos,” arXiv preprint arXiv:1910.12467, 2019.
- [30] A. Dosovitskiy, L. Beyer, A. Kolesnikov, D. Weissenborn, X. Zhai, T. Unterthiner, M. Dehghani, M. Minderer, G. Heigold, S. Gelly, J. Uszkoreit, and N. Houlsby, “An Image is Worth 16x16 Words: Transformers for Image Recognition at Scale,” in International Conference on Learning Representations, 2021. [Online]. Available: https://openreview.net/forum?id=YicbFdNTTy
- [31] H. Wu, B. Xiao, N. Codella, M. Liu, X. Dai, L. Yuan, and L. Zhang, “Cvt: Introducing convolutions to vision transformers,” in Proceedings of the IEEE/CVF International Conference on Computer Vision (ICCV), October 2021, pp. 22–31.
- [32] Z. Liu, Y. Lin, Y. Cao, H. Hu, Y. Wei, Z. Zhang, S. Lin, and B. Guo, “Swin transformer: Hierarchical vision transformer using shifted windows,” in Proceedings of the IEEE/CVF International Conference on Computer Vision (ICCV), October 2021, pp. 10 012–10 022.
- [33] T. Karras, S. Laine, M. Aittala, J. Hellsten, J. Lehtinen, and T. Aila, “Analyzing and Improving the Image Quality of StyleGAN,” in 2020 IEEE/CVF Conference on Computer Vision and Pattern Recognition (CVPR), 2020, pp. 8110–8119.
- [34] T. Karras, S. Laine, and T. Aila, “A style-based generator architecture for generative adversarial networks,” in 2019 IEEE/CVF Conference on Computer Vision and Pattern Recognition (CVPR), 2019, pp. 4401–4410. [Online]. Available: https://ieeexplore.ieee.org/document/8953766
- [35] T. Ridnik, E. Ben-Baruch, A. Noy, and L. Zelnik-Manor, “Imagenet-21k Pretraining for the Masses,” 2021. [Online]. Available: https://openreview.net/forum?id=Zkj_VcZ6ol
- [36] O. Russakovsky, J. Deng, H. Su, J. Krause, S. Satheesh, S. Ma, Z. Huang, A. Karpathy, A. Khosla, M. Bernstein et al., “Imagenet large scale visual recognition challenge,” International journal of computer vision, vol. 115, no. 3, pp. 211–252, 2015.
- [37] J. Dressel and H. Farid, “The accuracy, fairness, and limits of predicting recidivism,” Science Advances, vol. 4, no. 1, p. eaao5580, 2018. [Online]. Available: https://www.science.org/doi/abs/10.1126/sciadv.aao5580
- [38] Anoop Kadan, Deepak P., Sahely Bhadra, Manjary P. Gangan, and Lajish V. L., “Blacks is to anger as whites is to joy? understanding latent affective bias in large pre-trained neural language models,” 2023. [Online]. Available: https://doi.org/10.48550/arXiv.2301.09003
- [39] M. Hardt, E. Price, E. Price, and N. Srebro, “Equality of opportunity in supervised learning,” in Advances in Neural Information Processing Systems, D. Lee, M. Sugiyama, U. Luxburg, I. Guyon, and R. Garnett, Eds., vol. 29. Curran Associates, Inc., 2016. [Online]. Available: https://proceedings.neurips.cc/paper_files/paper/2016/file/9d2682367c3935defcb1f9e247a97c0d-Paper.pdf