[orcid=0000-0002-4970-7782]
[1]
Conceptualization of this study, Investigation, Project administration, Writing
1]organization=P.N. Lebedev Physical Institute of the Russian Academy of Sciences, addressline=Leninsky prospekt, 53, city=Moscow, postcode=119991, country=Russia
[1]Corresponding author
Fingerprints of Mott-Hubbard physics in optical spectra of antiferromagnetic LaTiO3
Abstract
Magnetic properties of Mott-Hubbard insulators are determined by superexchange interactions mediated by the high-spin (HS) and low-spin (LS) intersite – charge excitations, which can be associated with the HS- and LS-Hubbard subbands in optical experiments. To explore the Mott-Hubbard physics in orthorhombic LaTiO3 crystal exhibiting the G-type antiferromagnetic order at the Néel temperature = 146 K, we present a comprehensive spectroscopic ellipsometry study in the spectral range 0.5–5.6 eV at temperatures 10 K T 300 K. We found that the complex dielectric function spectra of LaTiO3 crystal are almost featureless, nearly isotropic, and weakly temperature dependent in the range of – optical transitions. Nonetheless, analyzing the difference spectra below the , we have identified the LS-state excitations at 3.7 and 5.15 eV and estimated values of the on-site Coulomb repulsion 4.2 eV and Hund’s exchange constant 0.5 eV, which define the energy of the HS-state excitation at 2.7 eV. In addition, we discovered that the pronounced lowest-energy 1.3 eV optical band displays the critical intensity behavior and anomalous broadening with decreasing temperature below the . The discovered properties indicate that the 1.3 eV band in LaTiO3 can be associated with a Mott-Hubbard exciton.
keywords:
Mott-Hubbard insulator LaTiO3 \sepHigh-spin and low-spin excitations \sepSpectroscopic ellipsometry \sepComplex dielectric function spectra \sepOptical conductivity \sepMott-Hubbard excitonhighlights
Using 0.5-5.6 eV spectroscopic ellipsometry, the dielectric functions of LaTiO3 crystal with the Néel temperature = 146 K were investigated at 10 T 300 K.
The dielectric functions of LaTiO3 crystal are featurless and nearly isotropic below 4.5 eV, displaying weak temperature dependence.
The low-spin excitations to doubly degenerate and states at 3.7 eV and to state at 5.15 eV are identified in the difference spectra below the .
The parameters of on-site Coulomb repulsion 4.2 eV and Hund’s exchange constant 0.5 eV are estimated.
The pronounced low-energy band at 1.3 eV shows critical intensity behavior and anomalous broadening below the , peculiar of a Mott-Hubbard exciton.
1 Introduction
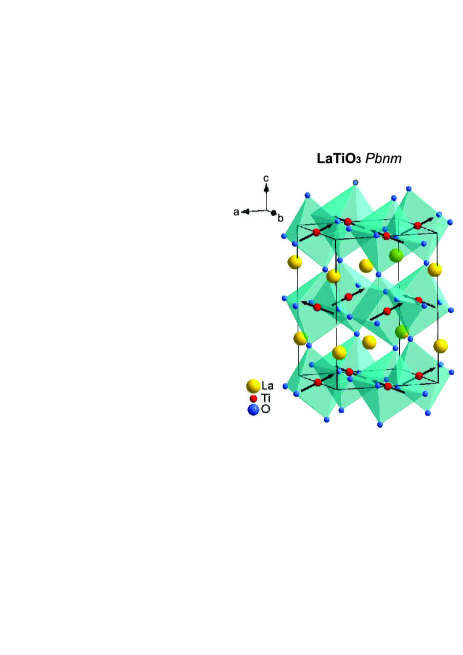
Transition metal oxides demonstrate a rich variety of electronic, lattice, and magnetic properties, including colossal magnetoresistance (CMR) and high-temperature superconductivity (HTSC) [1, 2, 3, 4, 5, 6, 7, 8, 9, 10, 11, 12, 13, 14, 15]. Among these, rare-earth () TiO3 titanates that crystallize in the orthorhombically distorted perovskite structure (of symmetry) are Mott-Hubbard insulators in which spin, charge, and orbital degrees of freedom are intrinsically entangled. In particular, TiO3 titanates amuse by the paradigm where the antiferromagnetic (AFM) G-type ground state for = La,…, and Sm with the magnetic moment aligned parallel to the axis (see schematic presentation in Fig. 1) turns to the ferromagnetic (FM) ground state for = Gd,…,Yb, and Y with the magnetic moment preferentially aligned parallel to the axis. For the TiO3 series, the most exemplary cases are provided by the end-point members, LaTiO3 and YTiO3: LaTiO3 is an AFM with the Néel temperature = 150 K [16] and YTiO3 is a FM with a comparatively low Curie temperature of 30 K [17].
The magnetic properties of Mott-Hubbard insulators are determined by the electronic superexchange (SE) interactions [5, 6], including both spin and orbital degrees of freedom, which are associated with the low-energy virtual charge excitations between two neighboring transition metal ions occurring via oxygen ligand orbitals, . The high-spin (HS) and low-spin (LS) contributions to the SE follow from the multiplet structure of the excited transition metal ion [18] which, in turn, depends on the parameters of the on-site Coulomb repulsion and Hund’s exchange constant [19, 20]. In LaMnO3, a representative famous compound of CMR manganites, strong electron-lattice Jahn-Teller (JT) instability for the Mn3+ ion removes the twofold orbital degeneracy on behalf of the MnO6 octahedra distortions [21, 22, 23, 24, 25, 26, 27]. It was demonstrated by our comprehensive spectroscopic ellipsometry study of LaMnO3 that the energies of optical excitations by the electrons and variation of the associated optical spectral weight (SW) of the Hubbard subbands around the Néel temperature =140 K provide an important information on the spin-orbital physics and even magnetic exchange constants in this compound [10, 11].
In TiO3 crystals, the ground state of the Ti3+ ion can be regarded as one electron in three orbitals, where the threefold degeneracy can partially be removed by the JT mechanism [28, 29] or totally removed by the crystal-field (CF) effect driven by – O covalency [30, 31]. The excited states for the Ti2+ ion are generated by the intersite electron transitions. It seems that optical SW of these transitions must vanish, however, a direct electric-dipole-allowed optical excitation is expected to occur via an oxygen -band excited state, which is strongly dipole-allowed. In early optical measurements of LaTiO3 and YTiO3, the optical conductivity at low photon energies was found to be very similar, the only difference was interpreted as the rigid shift of the Mott gap to low photon energies in LaTiO3 [32]. However, the – excitations associated with different Hubbard subbands were not separated from each other because of the practically featureless low-energy spectra. The spectral location of the intersite – excitations, as well as the associated optical SW, can be monitored in the optical response due to the onset of long-range spin-spin correlations around the associated magnetic transition temperatures. In our prior spectroscopic ellipsometry study of LaMnO3 tracing the optical SW redistribution around the =140 K, we were able to identify the HS- and LS-state transitions for the Mn2+ ion, as well as to estimate the parameters of the effective on-site Coulomb repulsion and Hund’s exchange constant [10, 11]. Following the same approach in our subsequent optical experiments carried out on a well characterized YTiO3 single crystal with = 30 K (amongst the highest values reported for YTiO3 [17]), we were able to resolve a weak absorption feature around 2.85 eV which revealed an SW increase with decreasing temperature below [12]. Therefore, the latter was assigned to a HS () transition, where the electron is transferred with a parallel spin to an unoccupied orbital on the neighboring Ti site resulting in the redistribution of the optical SW due to FM ordering below . However, as to our knowledge, the – excitations associated with different Hubbard subbands, as well as the optical SW redistribution between them induced by the G-type AFM spin ordering at =150 K in LaTiO3 crystals, were not investigated so far.
Moreover, an interesting physics to be explored in LaTiO3 titanate is concerned with a Mott-Hubbard exciton (MHE). Recent optical studies monitoring changes in the associated SW revealed the evidence of an MHE in LaVO3 vanadate, where the lowest-energy peak at 1.8 eV was attributed to an excitonic resonance (see Ref. [33] and references therein) certifying that the excitonic SW is strongly influenced by the presence of spin and orbital order. In addition, the optical bands arising above the absorption edge were considered as reasonable candidates for an MHE in some TiO3 titanates [34]. In particular, the lowest-energy optical band appears in YTiO3 at 1.9 eV, being notably shifted from the HS state to lower photon energies [12]. However, the contribution from polaronic and polaron-excitonic optical bands cannot be excluded at these energies [34, 35, 36, 37]. Indeed, the modeling of polaron-related features in complex oxides such as CMR materials revealed that the total lattice relaxation energy (electronic plus ionic) for a hole self-trapped at the O site in LaMnO3 is estimated to be quite large: about 2.4 eV [35, 36]. Moreover, the above theoretical analysis suggests that the band near 2.3 eV is rather associated with the presence of self-trapped O- holes in the nonstoichiometric transition metal oxide compound. In addition, the indirect – optical transitions and/or weakly dipole-allowed CT transitions [38] could contribute at low photon energies.
At present, fundamental questions relevant to the physics of an MHE in Mott insulators remain unanswered. In particular, the theoretical investigation of the line shapes of the exciton bandwidth in a Mott-Hubbard insulator presented in the studies [39, 40, 41, 42] can serve as a key experimental probe of the origin of the low-energy optical bands in LaTiO3 and YTiO3. An intrinsic broadening of the MHE bandwidth is predicted within an extended Hubbard model induced by the presence of an AFM spin order. This effect arises from limitations put on the migration of -state holes by means of electron exchange. In the purely FM spin configuration, all potential walks are allowed, therefore, the exciton bandwidth can be quite narrow even for a broad -hole band. By contrast, in the AF phase the hole propagation is maximally limited and, hence, the zone-center exciton can significantly be shifted and broadened into a wide band [39]. We believe that direct optical measurements comparing line shapes of the low-energy optical bands above and below or could shed light on their origin in LaTiO3 and YTiO3.
2 Materials and Methods
The LaTiO3 single crystals were grown by the standard solid-state reaction, and the final stage of growing was performed in a floating-zone image furnace (for more details see Ref. [16]). Special concern was given to the stoichiometry represented by an excess of oxygen in the LaTiO3+δ formula. The stoichiometry of the grown crystals was finally attested by determining the Néel temperature in a SQUID magnetometer. For the nearly stoichiometric LaTiO3 samples, = 146 K was obtained [16] among the highest values reported so far for LaTiO3. The grown crystals exhibited mosaic patterns due to twinning. The specific pattern and the size of the twin domains depend on local conditions determined by mechanical stresses and temperature gradients experienced during the crystal growth. Assuming the cubic perovskite structure, the as grown LaTiO3 single crystal was first aligned along the orthorhombic -axis direction using x-ray Laue patterns. Then the crystal was cut parallel to the plane formed by the cubic 110 direction and the orthorhombic axis. As a result, we were able to prepare the plane of the grown LaTiO3 crystal. For optical measurements, the -plane crystal surface was polished to optical grade. The ellipsometry measurements in the photon energy range 0.5–5.6 eV were performed using a home-built ellipsometer of a rotating-analyzer type. The sample was fixed on the cold finger of a helium flow ultrahigh vacuum cryostat, which was preliminary evacuated to a base pressure of 5 10-9 Torr at room temperature.
3 Results and Discussion
Optical spectra of a LaTiO3 crystal in the investigated spectral range can have main contributions from (i) strong dipole-allowed – charge-transfer (CT) transitions from the O() states in the valence band into the empty Ti() states in the conduction band, (ii) intrasite crystal-field (CF) – transitions, and (iii) intersite – transitions (progenitors of SE interactions). In addition, above the absorption edge one can anticipate contributions from polaron-excitonic bands [35, 34], as well as from the indirect – transitions. Many theoretical calculations [35, 43, 44, 45] agree that the optical band at 5.5 eV, which is well pronounced in the optical spectra of manganites [10, 11] and titanates [12, 32], is associated with the strongly dipole-allowed – CT transition (i). The intrasite CF – transitions (ii) are associated with the electronic energies of a ion in a crystal, which are determined by the spin-orbital coupling and the energy due to the CF of the ligands [46]. Here, the gap between two cubic terms = is predominant and can roughly be estimated as 2 0.5 eV [47, 48, 49]. In addition, fine splitting occurs under trigonal CF and spin-orbit perturbations and the associated energy splittings can be recognized in infrared experiments (see Ref. [46] and references therein). Among the four excitations (iii) there are the HS state at energy and three LS states (those for the direct electric-dipole transition with spin flip), the doubly degenerate and states at energy , and the state at energy [20], which are determined by the values of the effective (screened) Coulomb interaction on the Ti ions and Hund’s exchange . According to the theoretical predictions [20], in the AF phase of LaTiO3, all three Hubbard subbands should be evident in the optical spectra, the highest SW is associated with the doubly degenerate and states, and the SW of the HS state is expected to be relatively weak.
| , eV | , eV | Neff | |
| 0.66(0.59) | 0.25(0.37) | 0.22(0.34) | |
| 0.84(0.77) | 0.30(0.38) | 0.16(0.25) | |
| 1.34(1.30) | 1.20(1.31) | 1.53(1.54) | 0.120 |
| 1.89(1.84) | 1.07(1.12) | 0.27(0.29) | |
| 2.24(2.18) | 1.31(1.34) | 0.10(0.11) | |
| 2.76(2.73) | 1.48(1.56) | 0.25(0.26) | 0.083 |
| 3.10(3.11) | 3.15(2.98) | 0.19(0.21) | |
| 3.12(3.11) | 0.46(0.58) | 0.02(0.03) | |
| 3.59(3.59) | 0.89(0.99) | 0.13(0.13) | 0.073 |
| 4.89(4.84) | 0.72(0.74) | 0.34(0.33) | |
| 5.19(5.15) | 0.65(0.63) | 0.13(0.10) | 0.153 |
| 5.25(5.19) | 0.63(0.66) | 0.11(0.13) | |
| 5.25(5.50) | 0.65(0.67) | 0.20(0.20) |
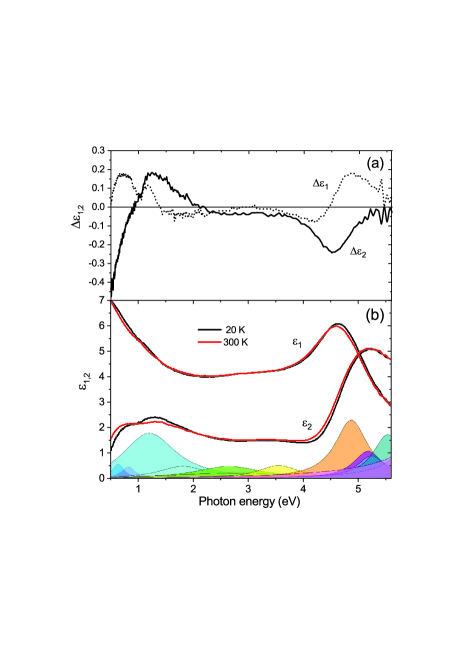
Figure 2(a,b) shows representative low- (20 K) and high- (300 K) temperature spectra of the real and imaginary parts of the complex dielectric function, + i, as well as the corresponding difference spectra, and . In contrast to the YTiO3 crystal, which exhibits a noticeable anisotropy for the -plane and -axis response [12], the complex dielectric function spectra of LaTiO3 crystal are almost isotropic on the plane. In virtue of the Mott-Hubbard nature of the optical gap in LaTiO3 and YTiO3, the absorption edge in these compounds is assumed to be of a – origin. However, the assignment of the low-energy optical transitions in these compounds has not been clarified yet. Both YTiO3 and LaTiO3 exhibit the dielectric function spectra dominated by a pronounced lowest-energy optical band, which appears at 1.9 eV (2.1 eV) in the -axis (-axis) response in YTiO3 [12], being, however, significantly shifted to a lower energy of 1.3 eV in LaTiO3. The optical bands at higher energies form practically plain background for the intense optical band peaking at 5.2–5.7 eV, which can be associated with the strongly dipole-allowed O() – Ti() CT transitions (i). From the dielectric function spectra presented in Fig. 2(b) one can see that their temperature changes are rather weak in the whole investigated temperature range from 300 to 20 K. The most pronounced temperature changes are associated with the low-energy band situated above the absorption edge at 1.3 eV. We note that, in contrast to the nearly temperature-independent peak intensity of the 1.9 eV optical band in YTiO3 crystal [12], the peak intensity of the low-energy 1.3 eV band notably increases in LaTiO3 with decreasing temperature (see Fig. 2 and Fig. 12 of Ref. [12]). The details of the temperature dependence of the 1.3 eV band will be further discussed.
To distinguish contributions from the separate optical bands, we applied the classical dispersion analysis in which the complex dielectric function is represented by a sum of Lorentz oscillators
| (1) |
due to contributions from different interband optical transitions, where the parameters , , and specify the energy maximum, full width at half maximum (FWHM), and oscillator strength of the individual th oscillator, respectively, and is the dielectric function core contribution. In the classical dispersion analysis of the complex dielectric function, we input a minimal set of Lorenzians, which were fitted in the Kramers-Kronig consistent way to ensure the most reliable and stable parameters. The parameters , , and of Lorentz bands obtained in the fitting of the low- and high-temperature complex dielectric function spectra presented in Fig. 2(b) are given in Table 1. As an illustration, the Lorentzian bands for the 20 K complex dielectric function spectra are clearly displayed in Fig. 2(b). The results of the dispersion analysis of the dielectric function spectra listed in Table 1 indicate that the wide-range temperature changes can predominantly be associated with ordinary lattice anharmonicity effects leading to narrowing of optical bands with decreasing temperature. The narrowing effect is clearly illustrated by the main optical band at around 5 eV, which leads to a minimum in the difference spectra at 4.5 eV, as can be seen from Fig. 2(a,b).
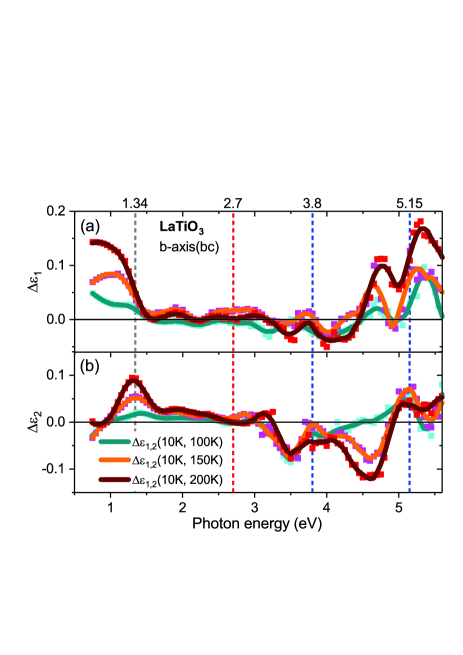
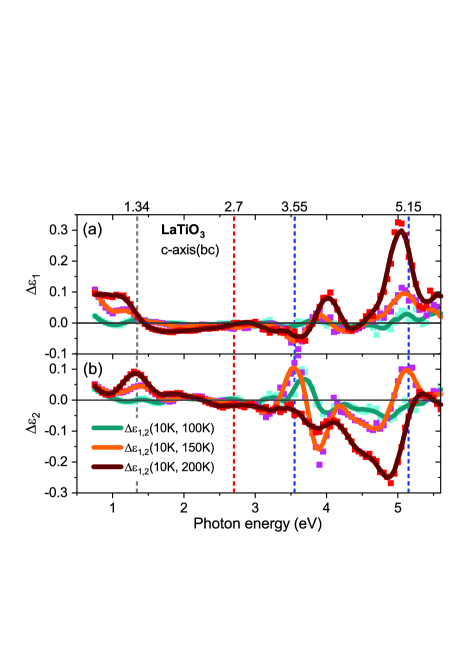
Meantime, our ellipsometry measurements allowed us to resolve much weaker temperature effects in the dielectric function spectra of LaTiO3, which can be associated with a long-range spin ordering and redistribution of the optical SW around the = 146 K. Figures 3 and 4 demonstrate the difference spectra of the real and imaginary parts of the dielectric function, and , between 10 K and 100, 150, and 200 K, obtained for the - and -axis response, respectively. From Fig. 4 one can see that in the range of intersite – transitions the -axis difference spectra show resonance features at 3.8 and 5.15 eV, where the highest intensity corresponds to the difference between 10 K (for AFM ordered spins) and 150 K (for fluctuating spins right above the ) accompanied with antiresonance features. At similar energies of 3.6 and 5.15 eV, the resonance features are present in the -axis difference spectra (see Fig. 4). For comparison, the spectra between 10 and 200 K display the pronounced deepening around 4.5 eV with increasing temperature from 150 to 200 K certifying an appreciable contribution from lattice anharmonicity effects (as it was discussed in the context of the data presented in Fig. 2), which leads to smoothing of the – features associated with spin-spin correlations in the difference spectra.
The discovered optical bands at 3.7 0.1 eV and 5.15 0.1 eV, which exhibit an increase in the with decreasing temperature below the , can be associated with the LS transitions (iii) to two degenerate and states at energy and state at energy , where the electron is transferred to the orbitals on the neighboring Ti site with an antiparallel spin. Then, from the system of equations, = 3.7 and = 5.15 eV, we can estimate the parameters = 4.2 0.1 eV and = 0.5 0.1 eV. The obtained value is well consistent with the effective on-site electron correlation energy 4 eV estimated from the photoemission spectroscopy study in LaTiO3 by Higuchi et al. [50]. In addition, there is a good agreement for the values resulting for the Ti oxides from x-ray emission spectroscopy and optical studies [12, 51], and theoretical values [52]. The obtained value is close to the free-ion value for the Hund’s exchange coupling constant of 0.59 eV [1]. Taking the obtained values of the parameters and , we can propose the position of the HS transition with energy at 2.7 0.1 eV. According to the theory predictions, the HS-state transition associated with FM spin correlations is expected to be relatively weakly pronounced for G-type AFM ordering accomplished in LaTiO3 [20]. Indeed, we cannot see any clear evidence for the temperature dependence of the HS-state transition around 2.7 eV (which is seemingly hidden within the experimental noise) in the difference spectra in Figs. 3 and 4. In YTiO3, the values of = 4.5 0.2 eV and = 0.55 0.1 eV obtained from our previous ellipsometry study [12] are similar to those obtained for LaTiO3. However, in contrast to LaTiO3, we observed that in YTiO3 the optical band at 2.85 eV exhibited an increase in the imaginary part of the dielectric function between 15 and 55 K associated with FM spin ordering below the Curie temperature = 30 K. Instead in YTiO3, the LS-state transitions are appeared to be weakly pronounced making the assignment of the higher-energy LS-state transitions more difficult (see more details in Ref. [12]). In addition, we can recognize fingerpints of the HS-state transition in the - and -axis response represented by the minima in the at around 3.5 and 3.9 eV, respectively (see Figs. 3 and 4). These transitions can seemingly be associated with the excitation, being shifted from the HS-state transitions by the CF gap of about 0.8 -1.2 eV. We note that the reduced value of the CF gap in LaTiO3 can seemingly be associated with the – O covalence effects [30, 31, 15].
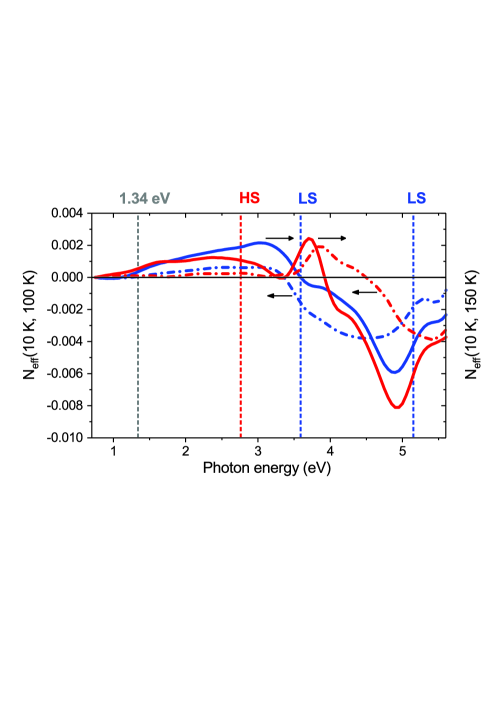
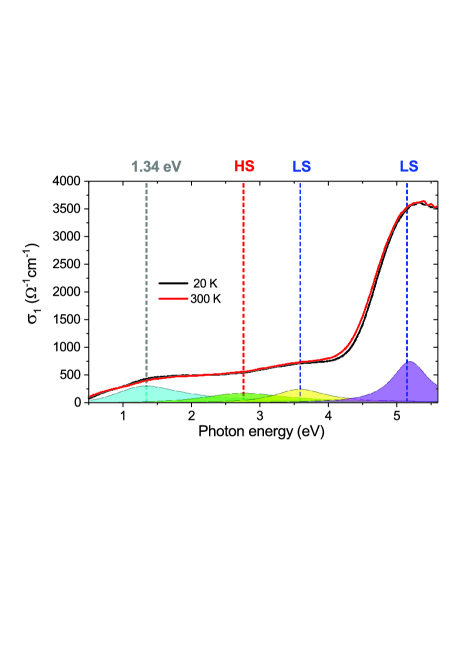
Figure 5 shows the optical conductivity spectra = at temperatures of 20 and 300 K obtained from the ellipsometry data presented in Fig. 2(b). In consistency with the prior work [32], the optical conductivity spectra show a smooth evolution of optical absorption with the onset at low photon energies below 0.5 eV. According to our dispersion analysis for = 20 K, the HS- (at 2.8 eV) and LS- (at 3.6, and 5.2 eV) Hubbard subbands are clearly displayed, and the lowest-energy optical band peaking at 1.3 eV is presented in addition. An important characteristic of optical bands is the associated optical SW, which can be estimated for the separate Lorentz oscillator as SW = = . The normalized SW values can be expressed in the effective number of electronic charge carriers = SW, where = = 1.71022 cm-3 is the density of Ti atoms and is the free electron mass. The associated values for the 2.8 eV HS-state of 0.08 and for the 3.6 eV LS-state of 0.07 (see Table 1) are very similar to those of 0.07 and 0.05, respectively, obtained from our previous optical study of YTiO3 (see Table I of Ref. [12]). However, we would like to note that the low temperature values for the lowest-energy band are notably different, being about 0.12 and 0.21 in LaTiO3 and YTiO3 crystals, respectively.
Figure 6 demonstrates the SW changes (10 K, 100 K) and (10 K, 150 K) in the - and -axis response associated with the difference dielectric function spectra presented in Figs. 3 and 4. The optical SW redistribution presented in Fig. 6 indicates the transfer of the SW from above 3.5 -4.5 eV to lower photon energies as the temperature is lowered. Here, in the overall SW balance, not only the HS- and LS-Hubbard subbands are involved, but also the lowest-energy 1.3 eV band and the HS-type transition peaking at 3.5 and 3.9 eV in the - and -axis, respectively, of the origin. One can notice that the SW decrease around the HS-state transition with decreasing temperature in the axis implies the presence of FM correlations, which can be associated with the weak FM moment available along the axis.
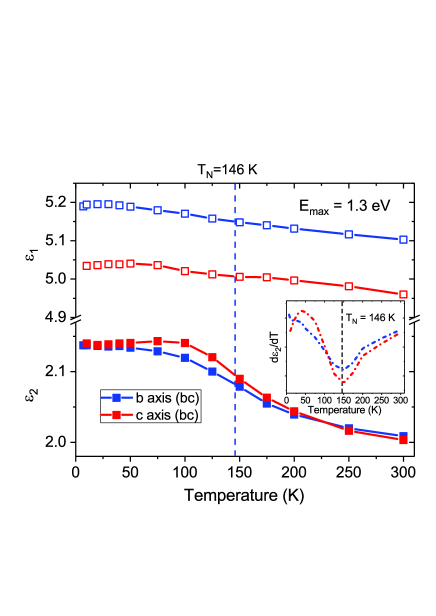
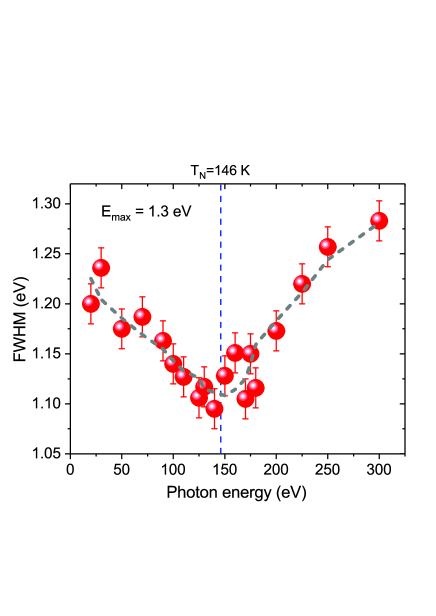
Another interesting issue is associated with the nature of the lowest-energy optical band peaking at 1.3 eV. First, in contrast to the nearly temperature-independent peak intensity of the 1.9 eV optical band in YTiO3 crystal [12], the peak intensity of the 1.3 eV low-energy band notably increases in LaTiO3 with decreasing temperature (see Figs. 3, 4, and 7). Moreover, the derivative shows a minimum near the AFM transition temperature = 146 K (see inset of Fig. 7). Second, from the results of the dispersion analysis of the temperature-dependent complex dielectric function spectra, we discovered that the FWHM of the 1.3 eV band in LaTiO3 shows a narrowing caused by decreasing lattice anharmonicity effects with decreasing temperature from 300 K followed by the broadening below the Néel temperature = 146 K (see Fig. 8). The broadening is theoretically predicted [39] for a MHE, where the hole migration becomes limited in the presence of the AFM spin order. In addition, the spectral position of the lowest-energy band at 1.3 eV is essentially shifted to lower photon energies in AFM LaTiO3 compared to that at 1.9 eV in FM YTiO3. This can be consistent well with the theoretical predictions reported by Doniach et al. [39]. Indeed, an intrinsic broadening of the exciton bandwidth in a Mott-Hubbard insulator is predicted within an extended Hubbard model (in the strong repulsion limit ) induced by the presence of spin order [39]. This phenomenon arises from restrictions put on the propagation of -state holes by electron exchange. The only limitation for the migration of an exciton through the crystal arises through the repulsion exerting on the hole, the electron following the hole does not take part in the spin dynamics, and the exciton propagation is determined solely by the hole propagation. The theory of hole migration determined by the hole tunneling parameter was studied in the standard Hubbard model () by using the moment method [40, 41, 42]. The th moment of the spectral density is estimated being weighted over the sum of allowed walks on steps on the lattice accompanied by the electron spin rearrangement. The suitable walks include (i) removal of an electron from the chosen site generating a hole, (ii) moving the hole by exchanging with neighboring electrons carrying their spin, and (iii) in steps replacing the initially excited electron (with its spin) in the hole at some other site. As a result, the final spin configuration matches the initial one. The initial configuration is definite in the magnetically ordered phase (AFM) or can be purely random in the paramagnetic (PM) state. The spectral density moments are susceptible to the initial spin arrangement (AF or PM). Thus, a one step walk must involve a spin flip and, therefore, it is excluded in the AF phase but can occur with a probability in the PM phase. The line shapes have been presented in the study by Doniach e͡t al. [39]. In the purely FM spin configuration, all potential walks are allowed and, therefore, the exciton bandwidth can be quite narrow even for a broad -hole band. By contrast, in the AF phase the hole propagation is maximally limited and, as a result, the zone-center exciton could be significantly shifted and broadened into a wide band.
4 Conclusion
The presented spectroscopic ellipsometry study reveals that the intrinsic low-energy complex dielectric function spectra of the LaTiO3 crystal are almost featureless, nearly isotropic, and weakly temperature dependent. Even so, a comprehensive investigation of the difference in the dielectric function spectra with decreasing temperature below the AFM transition temperature = 146 K, in combination with a classical dispersion analysis allowed us to identify the intersite electronic transitions associated with the LS electron excitations with spin flip: the doubly degenerate and states at 3.7 0.1 eV and the state at 5.15 0.1 eV, as well as to estimate the parameters of the effective on-site Coulomb repulsion = 4.2 0.1 eV and Hund’s exchange constant = 0.5 0.1 eV. The intersite – transitions appear in the optical response of LaTiO3 and YTiO3 below the onset of the strongly dipole-allowed – transition at 5.2 eV at similar energies. However, the HS transition at 2.7 0.1 eV is de facto silent in the AFM phase of LaTiO3, in contrast, it is weakly displayed at 2.85 eV in the FM phase of YTiO3 below the = 30 K [12]. In addition, in the optical response of LaTiO3 the pronounced lowest-energy band is present, whose origin, as to our knowledge, remained unclear. The spectral position of the lowest-energy band appearing in LaTiO3 at 1.3 eV is notably shifted to lower photon energies from that in YTiO3 appearing at 1.9-2.1 eV, and the associated optical SWs are also very different. In addition, the 1.3 eV optical band in LaTiO3 displays the critical intensity behavior and broadening with decreasing temperature below the . The observed broadening with decreasing temperature is highly unusual and leads to an increase in the optical SW, which can be associated with the kinetic energy enhancement in the course of the partial delocalization process caused by the onset of the AFM order in LaTiO3 crystal. The observed properties of the lowest-energy band in LaTiO3 and YTiO3 are well consistent with the theoretical predictions reported for a Mott-Hubbard exciton affected by the AFM or FM spin order in Mott-Hubbard insulators by Doniach et al. [39]. Therefore, the lowest-energy optical bands in LaTiO3 at 1.3 eV and in YTiO3 at 1.9-2.1 eV can be associated with a Mott-Hubbard exciton. Alternatively, the lowest-energy bands can possibly be associated with the polaronic or polaron-excitonic origin. However, the modeling of polaron-related features in complex oxides such as CMR materials revealed that the characteristic energies are around 2.4 eV [35, 36, 37]. To clarify this issue, an additional theoretical study exploring the associated energies in LaTiO3 and YTiO3 crystals can be useful.
Acknowledgement
The author acknowledges Dr. T. Lorentz and Max-Planck Society for making available LaTiO3 single crystal used in the spectroscopic ellipsometry measurements.
Declaration of competing interest
The author declares that she has no known competing financial interests or personal relationships that could have appeared to influence the work reported in this paper.
References
- [1] J. S. Griffith, The Theory of Transition-Metal Ions, Cambridge University Press, 1961.
- [2] Y. Tokura, Rep. Prog. Phys. 69 (2006) 797.
- [3] E. Dagotto, Science 309 (2005) 257.
- [4] S. Tajima, Rep. Prog. Phys. 79 (2016) 094001.
- [5] P.W. Anderson, Phys. Rev. 115 (1959) 2.
- [6] K.I. Kugel, D.I. Khomskii, Usp. Fiz. Nauk 136 (1982) 621 [Sov. Phys. Usp. 25 (1982) 231].
- [7] B. Keimer, D. Casa, A. Ivanov, J.W. Lynn, M.V. Zimmermann, J.P. Hill, D. Gibbs, Y. Taguchi, and Y. Tokura, Phys. Rev. Lett. 85 (2000) 3946.
- [8] C. Bernhard, T. Holden, A.V. Boris, N.N. Kovaleva, A.V. Pimenov, J. Humlicek, C. Ulrich, C.T. Lin, J.L. Tallon, Phys. Rev. B 69 (2004) 052502.
- [9] W. Knafo, C. Meingast, A.V. Boris, P. Popovich, N.N. Kovaleva, P. Yordanov, A. Maljuk, R.K. Kremer, H.V. Lohneysen, B. Keimer,Phys. Rev. B 79 (2009) 054431.
- [10] N.N. Kovaleva, A.V. Boris, C. Bernhard, A. Kulakov, A. Pimenov, A.M. Balbashov, G. Khaliullin, B. Keimer, Phys. Rev. Lett. 93 (2004) 147204.
- [11] N.N. Kovaleva, A.M. Oleś, A.M. Balbashov, A. Maljuk, D.N. Argyriou, G. Khaliullin, B. Keimer, Phys. Rev. B 81 (2010) 235130.
- [12] N.N. Kovaleva, A.V. Boris, P. Yordanov, A. Maljuk, E. Brücher, J. Strempfer, M. Konuma, I. Zegkinoglou, C. Bernhard, A.M. Stoneham, B. Keimer, Phys. Rev. B 76 (2007) 155125.
- [13] Kovaleva N N, Kugel K I, Potucek Z, Kusmartseva O E, Goryachev N S, Bryknar Z, Demikhov E I, Trepakov V A, Dejneka A, Kusmartsev F V and Stoneham A M 2016 122 890
- [14] N.N. Kovaleva, O.E. Kusmartseva, A. Maljuk, Phys. Lett. A 430 (2022) 127985.
- [15] N.N. Kovaleva, Phys. Lett. A 479 (2023) 128942.
- [16] M. Cwik, T. Lorenz, J. Baier, R. Müller, G. André, F. Bourée, F. Lichtenberg, A. Freimuth, R. Schmitz, E. Müller-Hartmann, M. Braden, Phys. Rev. B 68 (2003) 060401.
- [17] J.D. Garret, J.E. Greedan, D.A. MacLean, Mater. Res. Bull. 16 (1981) 145.
- [18] S. Sugano, Y. Tanabe, H. Kamimura, Multiplets of Transition-Metal Ions in Crystals, Academic Press, 1970.
- [19] L.F. Feiner, A.M. Oleś, Phys. Rev. B 59 (1999) 3295.
- [20] A. Oleś, G. Khaliullin, P. Horsh P., L.F. Feiner, Phys. Rev. B 72 (2005) 214431.
- [21] H.A. Jahn, E. Teller, Proc. R. Soc. London A 161 (1937) 220.
- [22] U. Öpik, M.H.L. Pryce, Proc. R. Soc. A 238 (1957) 425.
- [23] A.M. Stoneham, Theory of Defects in Solids, Clarendon Press, 1975.
- [24] I.B. Bersuker, B.G. Vekhter, I.I. Ogurtsov, Sov. Phys. Usp. 18 (1975) 569.
- [25] M.D. Kaplan, B.G. Vekhter, Cooperative Phenomena in Jahn-Teller crystals, Plenum Press, 1995.
- [26] I.B. Bersuker, The Jahn-Teller Effect, Cambridge Univ. Press, 2006.
- [27] N.N. Kovaleva, O.E. Kusmartseva, K.I. Kugel, A.A. Maksimov, D. Nuzhnyy, A.M. Balbashov, E.I. Demikhov, A. Dejneka, V.A. Trepakov, F.V. Kusmartsev, A.M. Stoneham, J. Phys.: Condens. Matter 25 (2013) 155602.
- [28] M. Mochizuki, M. Imada, J. Phys. Soc. Japan 70 (2001) 1777.
- [29] M. Mochizuki, M. Imada, Phys. Rev. Lett. 91 (2003) 167203.
- [30] E. Pavarini, S. Biermann, A. Poteryaev, A.I. Lichtenstein, A. Georges, O.K. Andersen, Phys. Rev. Lett. 92 (2004) 176403.
- [31] E. Pavarini, A. Yamasaki, J. Nuss, O.K. Andersen, New J. Phys. 7 (2005) 188.
- [32] T. Arima, Y. Tokura, J.B. Torrance, Phys. Rev. B 48 (1993) 17006.
- [33] D.J. Lovinger, M. Brahlek, P. Kissin, D.M. Kennes, A.J. Millis, R. Engel-Herbert, R.D. Averitt, Phys. Rev. B 102 (2020) 115143.
- [34] A. Gössling, R. Schmitz, H. Roth, M.W. Haverkort, T. Lorenz, J.A. Mydosh, E. Müller-Hartmann, M. Grüninger, Phys. Rev. B 78 (2008) 075122.
- [35] N.N. Kovaleva, J.L. Gavartin, A.L. Shluger, A.V. Boris, A.M. Stoneham, J. Exp. Theor. Phys. 94 (2002) 178.
- [36] N.N. Kovaleva, J.L. Gavartin, A.L. Shluger, A.V. Boris, A.M. Stoneham, Physica B: Condens. Matter 312 (2002) 734.
- [37] N.N. Kovaleva, J.L. Gavartin, A.V. Boris, A.M. Stoneham, Physica B: Condens. Matter 312 (2002) 737.
- [38] A.V. Zenkov, Phys. stat. sol.(b) 241 (2004) 2508.
- [39] S. Doniach, B.J. Roulet, M.E. Fisher, Phys. Rev. Lett. 27 (1971) 262.
- [40] W.F. Brinkman, T.M. Rice, Phys. Rev. B 2 (1970) 1324.
- [41] Y. Nagaoka, Solid State Commun. 3 (1965) 409.
- [42] Y.Nagaoka, Phys. Rev. 147 (1966) 392.
- [43] I. Solovyev, N. Hamada, K. Terakura, Phys. Rev. B 53 (1996) 7158.
- [44] S. Bouarab, A. Vega, M.A. Khan, Phys. Rev. B 54 (1996) 11271.
- [45] O.V. Krasovska, V.N. Antonov, E.E. Krasovskii, W. Schattke, Phys. stat. sol.(b) 243 (2006) 1885.
- [46] R.M. Macfarlane, J.Y. Wong, M.D. Sturge, Phys. Rev. 166 (1968) 250.
- [47] D.S. McClure, J. Chem. Phys. 36 (1962) 2757.
- [48] F. Iga, M. Tsubota, M. Sawada, H.B. Huang, S. Kura, M. Takemura, K. Yaji, M. Nagira, A. Kimura, T. Jo, T. Takabatake, H. Namatame, M. Taniguchi, Phys. Rev. Lett. 93 (2004) 257207.
- [49] T. Higuchi, T, Tsukamoto, M. Watanabe, M.M. Grush, T.A. Callcott, R.C. Perera, D.L. Ederer, Y. Tokura, Y. Harada, Y. Tezuka, S. Shin, Phys. Rev. B 60 (1999) 7711.
- [50] T. Higuchi, D. Baba, T. Takeuchi, T. Tsukamoto, Y. Taguchi, Y. Tokura, A. Chainani, S. Shin, Phys. Rev. B 68 (2003) 104420-1.
- [51] A.E. Bocquet, T.Mizokawa,K. Morikawa, A. Fujimori, S.R. Barman, K. Maiti, D.D. Sarma, Y. Tokura, and M. Onoda, Phys. Rev. B 53 (1996) 1161.
- [52] F. Aryasetiawan, K. Karlsson, O. Jepsen, U. Schönberger, Phys. Rev. B 74 (2006) 125106.