Winds and Disk Turbulence Exert Equal Torques on Thick Magnetically Arrested Disks
Abstract
The conventional accretion disk lore is that magnetized turbulence is the principal angular momentum transport process that drives accretion. However, when dynamically important magnetic fields thread an accretion disk, they can produce mass and angular momentum outflows that also drive accretion. Yet, the relative importance of turbulent and wind-driven angular momentum transport is still poorly understood. To probe this question, we analyze a long-duration () simulation of a rapidly rotating () black hole (BH) feeding from a thick (), adiabatic, magnetically arrested disk (MAD), whose dynamically-important magnetic field regulates mass inflow and drives both uncollimated and collimated outflows (e.g., “winds” and “jets”, respectively). By carefully disentangling the various angular momentum transport processes occurring within the system, we demonstrate the novel result that both disk winds and disk turbulence extract roughly equal amounts of angular momentum from the disk. We find cumulative angular momentum and mass accretion outflow rates of and , respectively. This result suggests that understanding both turbulent and laminar stresses is key to understanding the evolution of systems where geometrically thick MADs can occur, such as the hard state of X-ray binaries, low-luminosity active galactic nuclei, some tidal disruption events, and possibly gamma ray bursts.
1 Introduction
Black holes (BHs) are responsible for some of the most energetic phenomena in the universe. This includes active galactic nuclei (Merloni et al., 2003; Blandford et al., 2019), gamma-ray bursts, tidal disruptions events, and X-ray binaries (Mirabel & Rodríguez, 1999; Corbel et al., 2000; Gallo et al., 2003, 2005). The emission generated by these systems is often accompanied by outflows such as jets that are relativistic, highly collimated, and BH powered (Blandford & Znajek, 1977), or winds that are non-relativistic, higher in gas density, and accretion disk powered (Blandford & Payne, 1982). An accretion disk is an essential component of the central engine that powers these outflows. While the radiative signature of the disk may vary from system to system, the inferred accretion rate is often highly correlated with the jet emission (Corbel et al., 2003; Markoff et al., 2003; Corbel et al., 2013; Zamaninasab et al., 2014). This correlation links accretion and ejection as interdependent dynamical processes. The key feature that links these processes is usually thought to be a magnetic field threading the accretion disk.
While not all systems launch jets, winds appear to be ubiquitous (Ponti et al., 2012; Cicone et al., 2014; Tetarenko et al., 2018; Mata Sánchez et al., 2023). The source of the wind, along with its connection to the jet and the accretion flow, remains debated. In particular, it is unclear whether radiative or magnetic forces are primarily responsible for driving these winds (Chakravorty et al., 2016; Ponti et al., 2016; Tomaru et al., 2019; Fukumura et al., 2021; Waters et al., 2021; Tomaru et al., 2023; Chakravorty et al., 2023).
A key piece of the puzzle is angular momentum transport, as angular momentum needs to be removed from the disk for it to accrete into the central black hole. In fact, angular momentum transport can determine both the radiative signature and the secular evolution of the accretion disk. Accretion is thought to be driven by three different mechanisms: (a) via turbulent (magnetic and/or hydrodynamic) small-scale torques, often thought to be due to the magnetorotational instability (MRI; Balbus & Hawley, 1991), and usually modeled with an -parameter viscosity prescription (Shakura & Sunyaev, 1973); (b) via large-scale poloidal magnetic fields anchored to the disk (Blandford & Payne, 1982; Wardle & Koenigl, 1993; Ferreira & Pelletier, 1995); or, (c) via non-axisymmetric features such as spiral waves, eccentricity, or warps (e.g., Kaaz et al., 2023; Liska et al., 2023). In this work, we will focus on the first two mechanisms.
Disk turbulence and wind outflows have historically been studied separately. However, they coexist in global simulations. Furthermore, steady-state accretion-ejection solutions require effective or non-ideal magnetic resistivity, which can be neatly provided by MRI-driven turbulence within the accretion disk (Ferreira & Pelletier, 1993). Linear modes of MRI can saturate into non-linear accretion ejection structures (Lesur et al., 2013). Conversely, the linear modes of the MRI can emerge naturally in non-linear accretion ejection solutions (Jacquemin-Ide et al., 2019). Hence, both mechanisms – MRI and MHD wind launching – might be more deeply linked than previously thought.
We note that both turbulent and large-scale outflow torques have distinct impacts on the secular evolution of the accretion disk. On the one hand, MRI-driven turbulence will lead to viscous spreading, elongating the depletion time scale. On the other hand, outflow torques also eject mass, which can lead to an increased mass loss rate from the accretion disk. The ratio of the torques is thus an important parameter in secular evolution models (Tabone et al., 2022). Furthermore, the evolution of the magnetic field structure behaves differently for both torques. Turbulent torques tend to diffuse the magnetic field outwards (Lubow et al., 1994), while large-scale torques advect the magnetic field inwards (Rothstein & Lovelace, 2008).
When accretion disks become fully saturated with large-scale, poloidal magnetic fields that obstruct gas infall, we refer to them as “magnetically arrested” disks (MADs). The MAD is a robustly defined steady-state in GRMHD simulations (Narayan et al., 2003; Igumenshchev et al., 2003; Tchekhovskoy et al., 2011). MADs are the natural end state of a system with a large reservoir of poloidal magnetic flux (e.g., field lines pointed in the radial and polar directions). Even when the initial magnetic flux is insufficient to lead to a MAD, the disk can eventually become a MAD if the mass accretion rate drops in time (Tchekhovskoy et al., 2014; Tchekhovskoy & Giannios, 2015; Christie et al., 2019; Jacquemin-Ide et al., 2021; Gottlieb et al., 2023). Furthermore, they are typically associated with so-called “radiatively-inefficient” or “advection-dominated” accretion flows and, if the host BH is spinning, are accompanied by powerful relativistic jets. There is a growing acceptance that many accretion disks in nature may be strongly magnetized, as this would address a variety of issues in both accretion theory and phenomenology. For instance, the classical Shakura & Sunyaev (1973) disk is thermally unstable in its inner, radiation-pressure dominated regions (Lightman & Eardley, 1974; Shakura & Sunyaev, 1976; Piran, 1978) and, in the case of supermassive black hole (SMBH) disks, is unstable to star formation in its outer regions; however, magnetically supported disks are both thermally stable (Begelman & Pringle, 2007; Sądowski, 2016) and stable to star formation (Gaburov et al., 2012). Additionally, observations of rapid, months-to-years long variability in active galactic nuclei (AGN) are incompatible with turbulent transport mechanisms in thin disks (Matt et al., 2003; Lawrence, 2018), but they may be enabled by magnetized disks which have systematically larger aspect ratios (Dexter & Begelman, 2019) and strong outflows, both enabling rapid inflow. Recent Event Horizon Telescope (EHT) observations of both M87 (Akiyama, 2019) and Sgr A* (EHT Collaboration et al., 2022) have also bolstered the expectation that many low-luminosity AGN in the universe harbor MADs, as in both cases the observed horizon-scale disks are consistent with synthetic observations produced via ray-traced MAD simulations.
We also note that it has been recently called into question whether the MRI drives turbulence in MADs or if the MRI is quenched by the strong magnetic field and instead another instability, such as the magnetic interchange or Rayleigh-Taylor instability, drives turbulence (Spruit et al., 1995; Lubow & Spruit, 1995; Kaisig et al., 1992; Marshall et al., 2018; Mishra et al., 2019). For instance, McKinney et al. (2012) and White et al. (2019) both found that in MADs, the wavelength of the marginally stable MRI mode is larger than the density scale height of the disk, suggesting that MADs are stable to MRI-driven turbulence. We note, however, that this analysis only considers the unstratified axisymmetric MRI, and not the non-axisymmetric MRI. The non-axisymmetric MRI survives to much higher magnetic field strengths (Begelman et al., 2022; Fragile & Sądowski, 2017) and could drive turbulence in MADs.
In this paper, we characterize the angular momentum transport within a geometrically thick, MAD. We analyze the angular and radial dependence of angular momentum transport by decomposing the system into three regions: the disk, winds, and jets. We take inventory of the angular momentum transport processes by separating turbulent and laminar components of both the hydrodynamic ("Reynolds") and magnetic ("Maxwell") stresses. In Section 2, we describe our simulation set up and diagnostics. In Section 3, we establish the angular and radial dependence of angular momentum transport in the system, and in Section 4 we present our conclusions.
2 Approach
2.1 Computational Method and Simulation Setup
We use the H-AMR code (Liska et al., 2022b), which evolves the equations of ideal general-relativistic magnetetohydrodynamics (GRMHD) on a spherical polar grid in modified Kerr-Schild coordinates (Gammie et al., 2003) using the piecewise parabolic method for spatial reconstruction (Colella & Woodward, 1984) and second order time-stepping. H-AMR uses various computational speed-ups, including both static and adaptive mesh refinement (SMR and AMR respectively), local adaptive timestepping, and acceleration by graphical processing units (GPUs). We adopt dimensionless units , where is the mass of the BH, such that the gravitational radius .
In this paper, we study a long duration (out to ) simulation originally presented in Liska et al. (2020). We consider a rapidly rotating BH of dimensionless spin at the center of an equilibrium Chakrabarti (1985) torus with a sub-Keplerian angular momentum profile, (where is the radius of the relativistic von Zeipel cylinder, which is asymptotically the cylindrical radius), with inner edge located at and a pressure maximum at . The torus outer edge, which is determined by our angular momentum distribution, lies at . We use a polytropic equation of state with adiabatic index , which results in a torus scale height that ranges from at to at .
The outer edge of the grid is located at and the inner edge is sufficiently far below the event horizon such that our inner boundary is causally disconnected from the BH exterior. The grid is uniformly spaced in , , and , for the ranges , , and . We use transmissive boundary conditions (BCs) at the poles, periodic BCs in the -direction, and absorbing BCs at the inner and outer radial boundaries. We select a base resolution of with four levels of static mesh refinement in . Meaning, the resolution reaches cells at the mid-plane and decreases at higher latitudes until it reaches cells near the pole. This results in a total of over 1 billion cells and 70-90 cells per disc scale height (taking ).
Within the torus, we initialize a toroidal magnetic field with a (nearly) uniform plasma , where and are the fluid-frame gas and magnetic pressures, respectively. Via dynamo action, the initially toroidal magnetic field evolves into a large-scale poloidal magnetic field at and soon thereafter pushes the disk into the MAD regime (see Liska et al., 2020, and references therein for a full discussion).
2.2 Energy-Momentum Tensor Decompositions
One of the main goals of this work is to take inventory of the angular momentum transport mechanisms in MADs. To measure the angular momentum flux, we use the mixed stress-energy-momentum tensor,
| (1) |
where is the gas density, is the internal energy, and is the gas pressure, each measured in the fluid-frame. is the contravariant magnetic field four-vector (such that , is the contravariant four-velocity and is the Kronecker delta. We will also use the relativistic enthalpy, . In our decomposition, we separate the first term in Eq. (1), which represents hydrodynamic stresses (except for a small contribution from the magnetic pressure),
| (2) |
and the third term, which represents magnetic stresses,
| (3) |
Since we only are concerned with off-diagonal terms () of in this work, the second term in Eq. (1) is always zero and we will not consider it further. We average our stresses in space and time using the following procedure. First, we perform Reynolds decompositions for the various terms. If a stress equals the product , then we define the Reynolds decomposition as,
where we have defined our averages over space and time as,
| (4) |
Here, quantities of the form represent the laminar, large-scale behavior of the flow, while quantities of the form represent the turbulent, small-scale behavior of the flow. Our time averages are taken over the period . When calculating the turbulent term, we first calculate on the entire data set, then iterate through each time step to find the difference between the instantaneous data and the averaged data (i.e., ).
We perform our Reynold’s decomposition on Eqs. (2) and (3) to derive the laminar and turbulent components of the hydrodynamic and magnetic stresses, respectively. The decomposition of Eq. (2) is,
| (5) |
| (6) |
3 Results
To study the steady-state angular momentum transport mechanisms in our accretion disk, we time- and average all quantities in our simulation for with a cadence of , providing a total of 4001 snapshots. This corresponds to Keplerian orbits at and orbits at . The time-averaged mass accretion rate is constant up to , indicating that the system has reached steady-state out to to this distance, which we set as the outer radius of our analysis. At this late-time in the simulation, the accretion disk has also reached the MAD state with, on average, constant accretion rate and magnetic flux on the event horizon (for a detailed description of the MAD state, see Tchekhovskoy et al., 2011).
3.1 Instantaneous Features of the Accretion Flow
Time- and averages are necessary to understand the long-term behavior of MADs. This, however, smooths over many interesting transient structures in the accretion flow which we would first like to highlight.
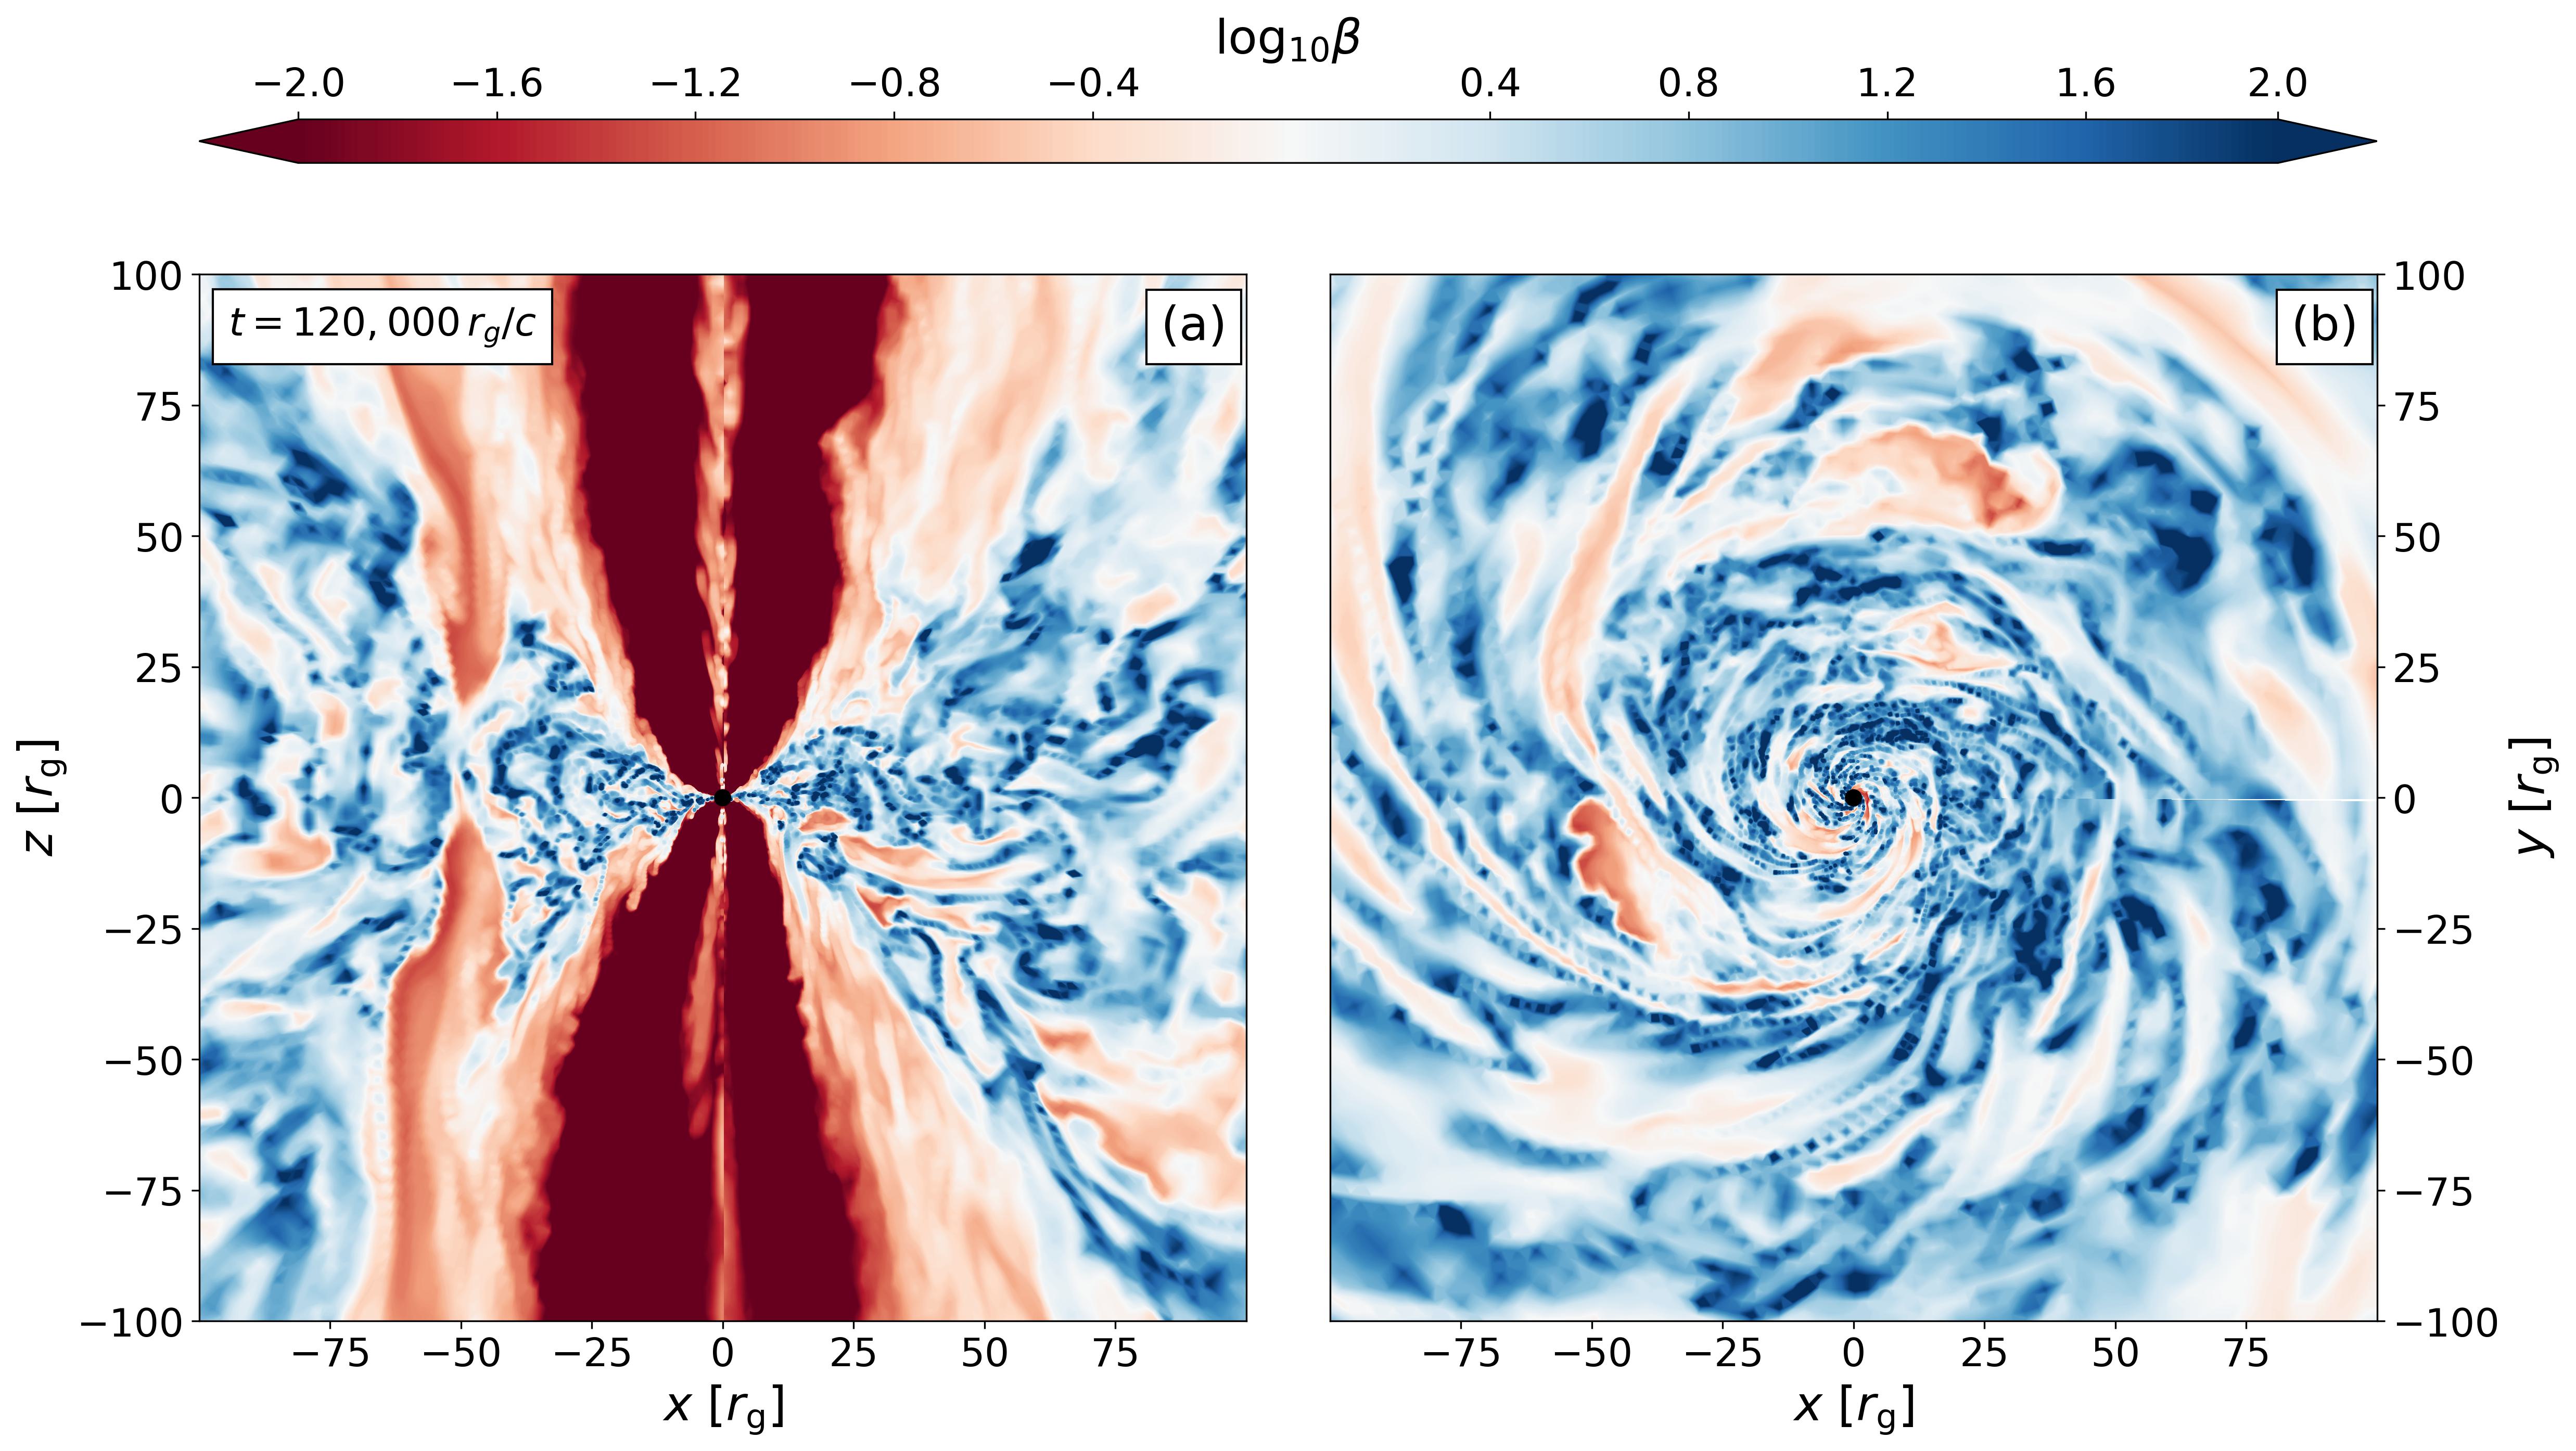
Figure 1 depicts the turbulent nature of the accretion disk by plotting the plasma of the fluid at . In Figure 1(a), we show a slice of plasma in the - plane. Within the equatorial accretion disk, we see bundles of gas dominated (blue) and magnetic pressure dominated (red) regions. These regions are turbulent and irregular except for one large-scale vertically extended structure at . This is a magnetic flux eruption event, which is a standard feature of MADs (Tchekhovskoy et al., 2011). Magnetic flux eruptions travel radially outwards through the accretion disk and can be identified as large-scale magnetic flux bundles characterized by the relatively smaller values of . Chatterjee & Narayan (2022) suggest that these flux eruption events provide an important form of angular momentum transport in MADs.
In Figure 1(b), we show an equatorial slice through the system. We now observe both small-scale turbulence and highly magnetized spiral modes, which is a standard feature of MADs and arises from the magnetic interchange instability (Spruit et al., 1995; Lubow & Spruit, 1995; Kaisig et al., 1992; Marshall et al., 2018; Mishra et al., 2019). Indeed, we see the projection of the magnetic flux eruption event in Figure 1(a) at , .
3.2 Structure of the Angular Momentum Flow
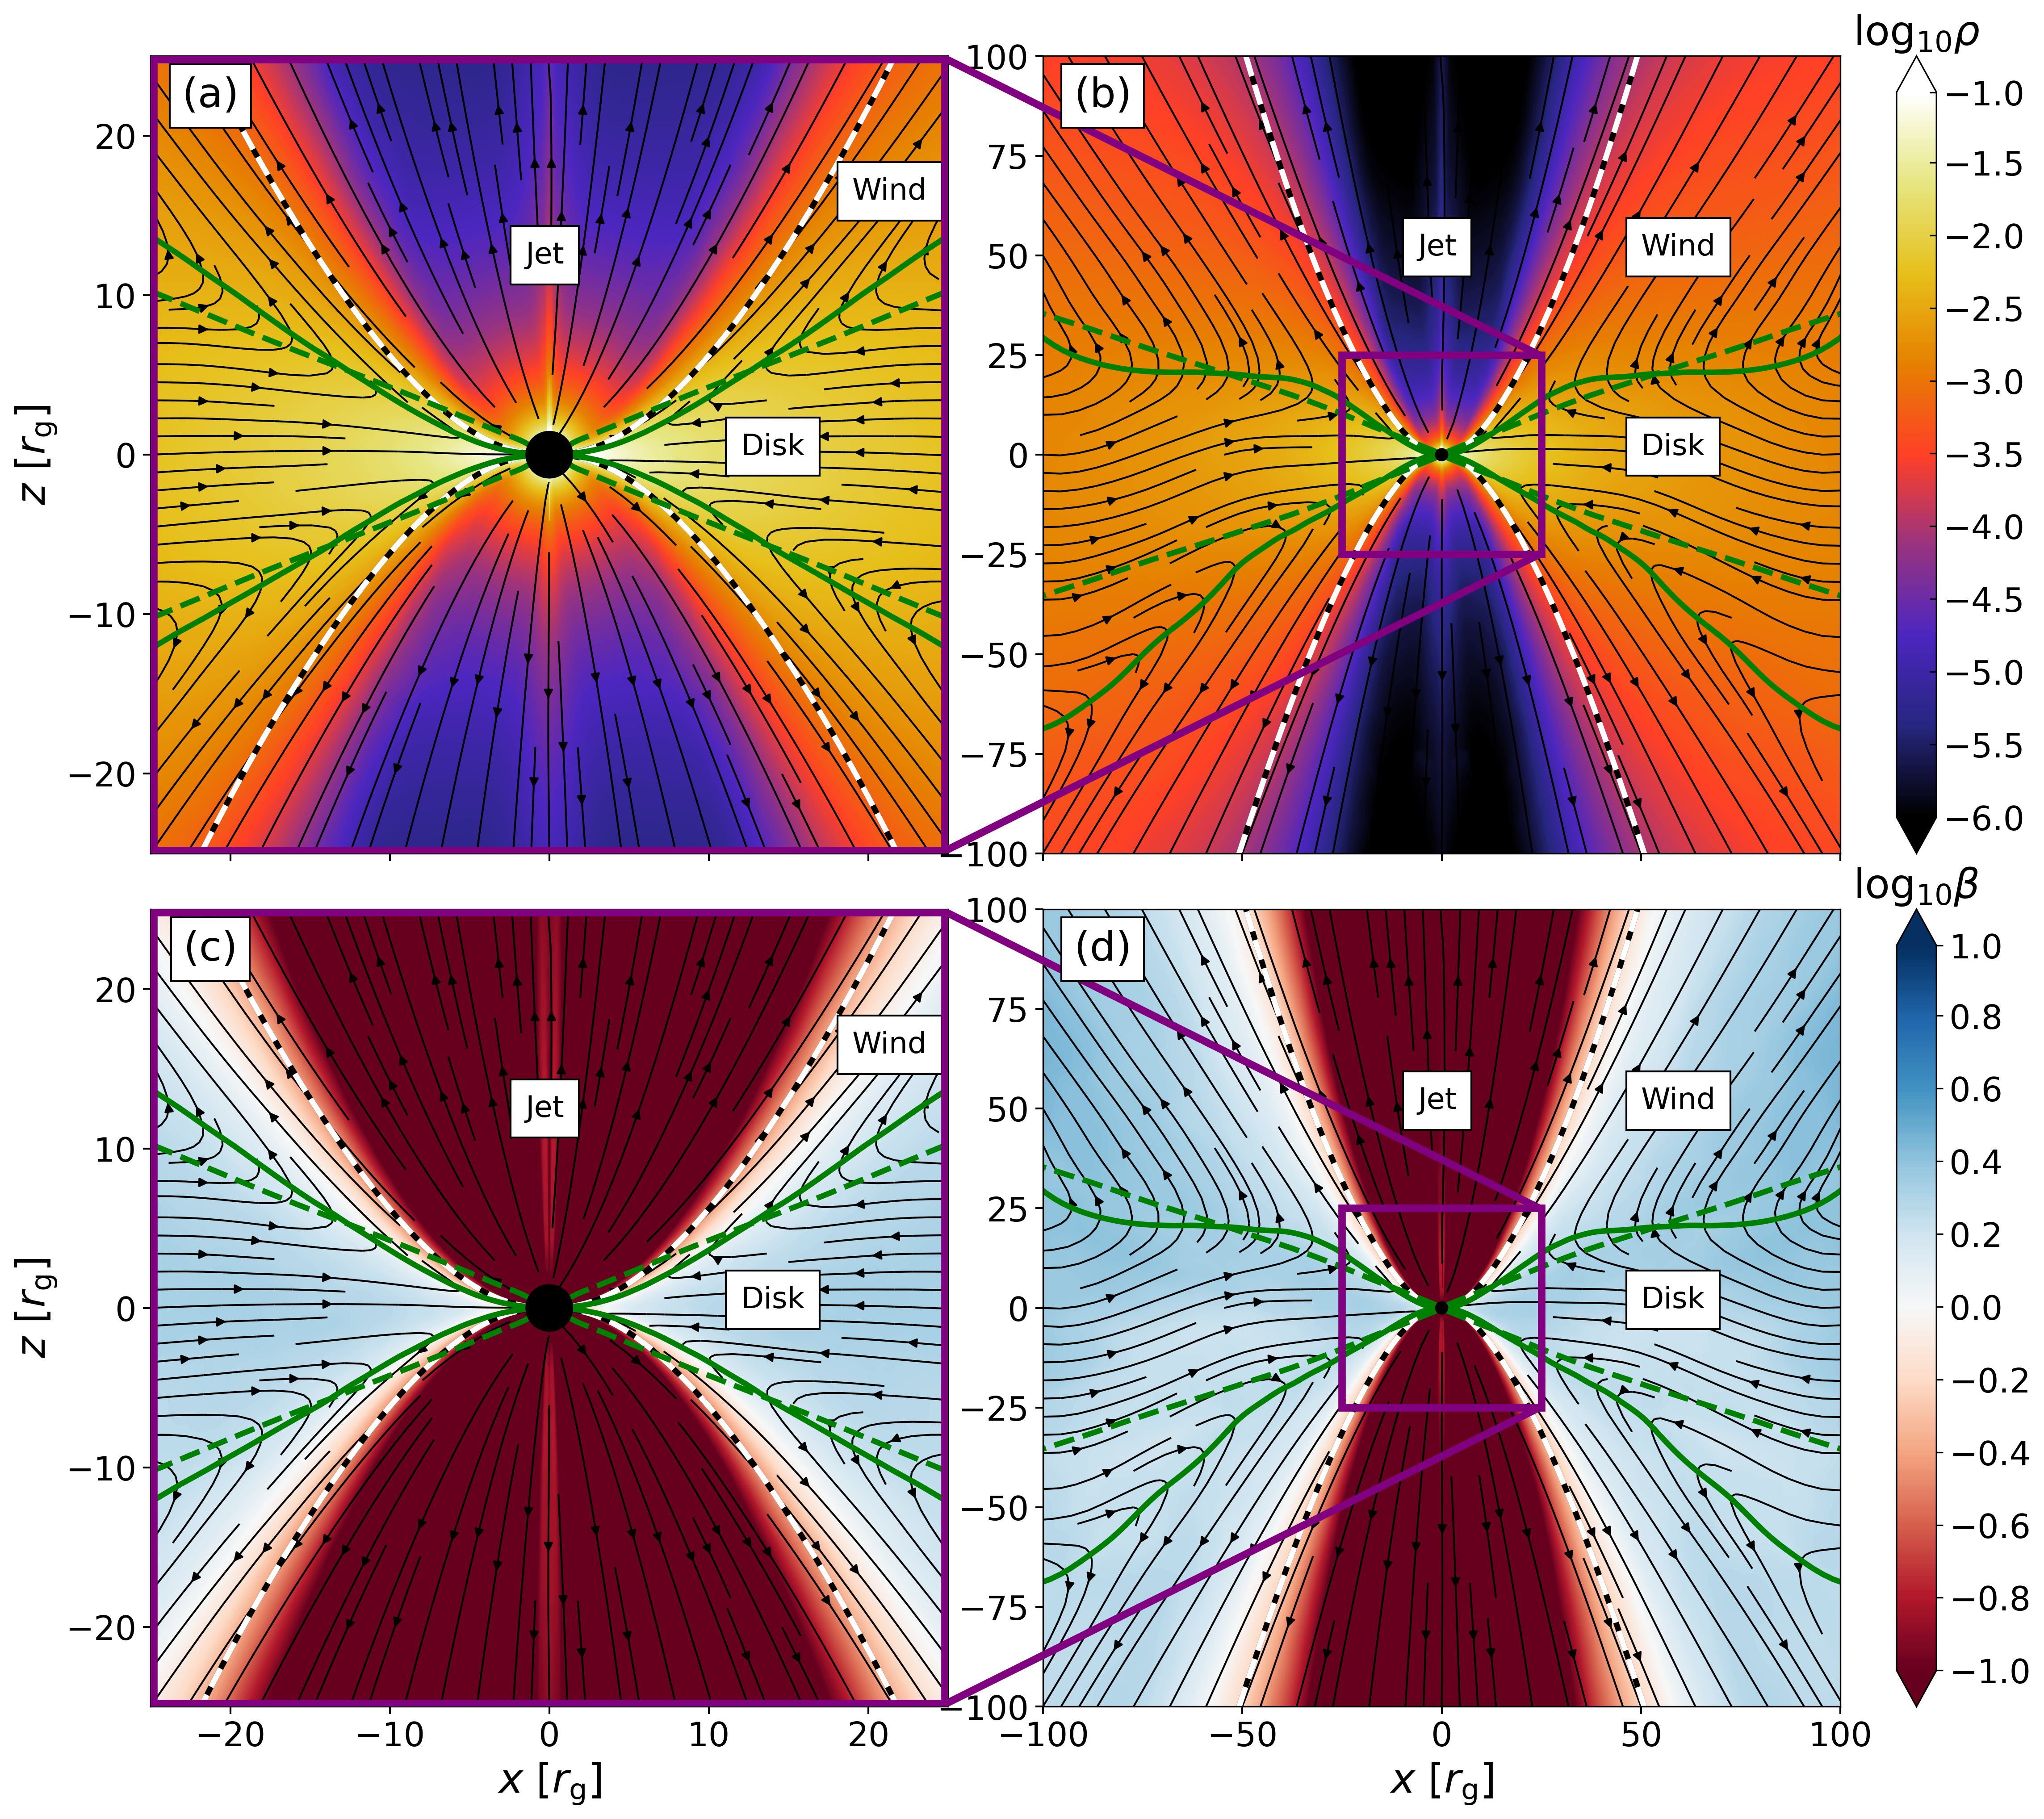
In this section, we study the angular momentum flow in three regions of our system: the accretion disk, disk winds, and jets. We define each region using our time-averaged, axisymmetrized data. Then, we plot these definitions in Figure 2, which show - slices of the flow that we - and time-averaged from to where the accretion flow has reached a quasi-steady state.
Figure 2 (a) and (b) show the gas density and panels (c) and (d) show the plasma . At the origin of each panel [] we have plotted the BH event horizon. The left column (Figure 2a, c) zooms in on the right column (Figure 2b, d), from to . We plot streamlines over the density and plasma contours to show the flow of the angular momentum flux, as defined by the four-vector projected onto the Cartesian basis vectors and . We use these streamlines to define the three regions of our system: jets, winds, and the accretion disk.
The jet regions exist at the poles of the BH and form an hourglass shape (at and extending vertically in ). Here, the magnetic pressure increases to over times the gas pressure (e.g., )111We note that the value of in the jet region is limited by our prescribed ceiling for the magnetization of the flow, ¡20. as the jet is magnetically launched and angular momentum is extracted from the BH through the Blandford-Znajek (‘BZ’, Blandford & Znajek, 1977) mechanism. For each of the two jets, we define their boundaries as the last radially outward angular momentum streamline (counting from the pole) to originate from the black hole event horizon. Figure 2 shows the jet boundaries with black-white dashed lines. We adopt this robust definition as it conserves the radial, time-averaged, angular momentum flux within the jet.
We define all other radially outward angular momentum flux streamlines (), which are anchored to the disk as part of the winds. We define the disk-wind boundary by the set of “turn around points” of the angular momentum streamlines, e.g. where the radial angular momentum flux vanishes (). We show this boundary in Figure 2 with solid green lines. This is a somewhat novel way of describing the vertical extent of the accretion disk. In the innermost regions of the disk, , the wind is squeezed between the jet and the disk and subtends smaller solid angle as compared to at larger radii (e.g. ).
We define the accretion disk as the region where angular momentum streamlines have a negative radial component (). The disk resides roughly within , where the gas density peaks at but is not significantly denser than the wind region.
The typical definition for the disk thickness is set by the temperature of the accretion disk and does not vary in vertical height (as a ratio of the distance from the BH),
| (9) |
where is the sound speed, and , and is the four-velocity of the fluid. We plot this definition in Figure 2 with dashed green lines. We can see that it under predicts the disk thickness for and over predicts it for compared to our streamline-based definition. Furthermore, this definition assumes vertical hydrostatic equilbrium, which is not satisfied near the BH as the disk is squeezed vertically between the two jets. Thus, we opt for our definition instead as it is specifically constructed to separate regions of angular momentum inflow and outflow.
Figures 2 (b) and (d) show that the angular momentum flow becomes asymmetric across the mid-plane for large radii ( ). While this may seem surprising, this asymmetry is not unprecedented, as in totally-energy conserving MADs the turbulent eddies have length scales which are since . These eddies can disrupt the current sheet at the midplane of the disk and cause asymmetries over long timescales (e.g., Tchekhovskoy, 2015; Chatterjee & Narayan, 2022).
3.3 Vertical Structure of Outflows: Disk vs Winds
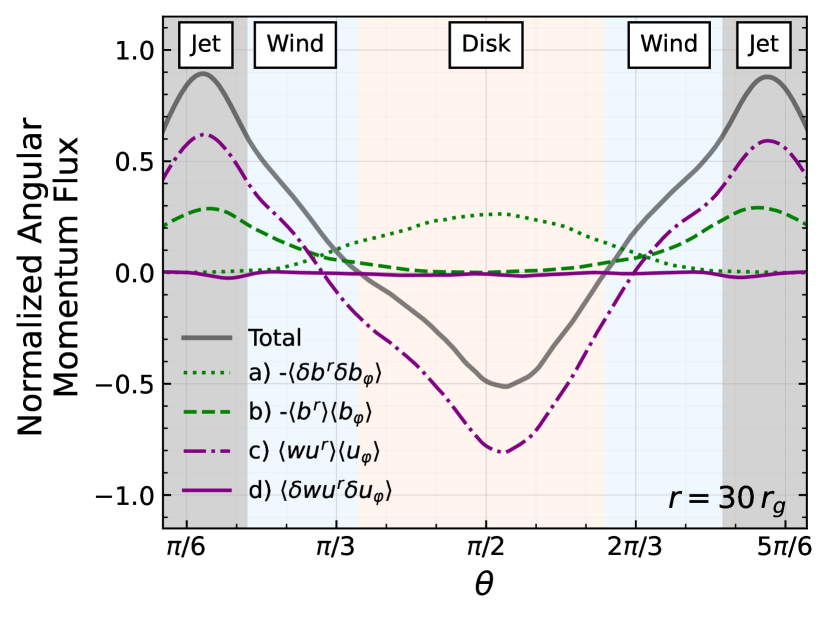
In this section, we discuss the vertical profile of angular momentum transport in our simulation. Here, we use the Reynolds decomposition of the stress-energy tensor (given by Eqs. 5-8). Figure 3 shows the terms contributing to the radial angular momentum transport as a function of at . Positive values indicate radially outward flow. We have normalized the y-axis to the average angular momentum flux onto a sphere at ,
| (10) |
Here, the factor of results from a trivial integral over the axisymmetrized fluxes. The streamlines in Figure 2 show the total angular momentum flux which is also given by the solid gray line in Figure 3. It is directed outwards in the wind regions and inward in the accretion disk. The advective transport (; Eq. 6) is radially outward in the winds and inward in the accretion disk. The Reynolds stresses (; Eq 5) are negligible in comparison to the other modes of transport. We breakdown the radial angular momentum transport driven by Maxwell stresses (Eqs. 7 and 8) into turbulent, , and laminar, , components. Within the disk, the turbulent Maxwell stresses dominate the outward angular momentum transport. As we cross into the wind regions, the large-scale magnetically driven angular momentum transport begins to dominate (e.g., Blandford & Payne, 1982). This is consistent with other simulations of highly magnetized disks (Jacquemin-Ide et al., 2021; Scepi et al., 2023).
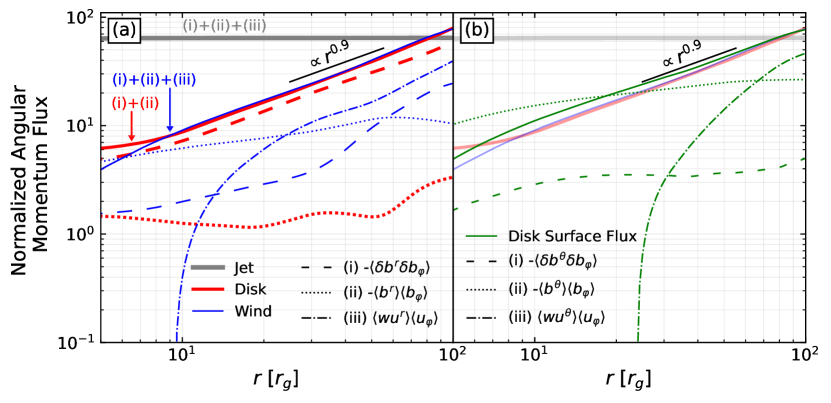
In Figure 4(a), we present the radially outward transport of angular momentum within the three regions – the jets, the winds, and the disk – as a function of radius. We decompose the radial angular momentum fluxes in the wind and disk regions into their turbulent and laminar Maxwell and Reynolds stress components (see Eq. 11). Then, we integrate over the radially-oriented surfaces of the disk and the wind regions, respectively:
| (11) |
where and are the minimum and maximum boundaries of the disk or wind regions, respectively. We ignore the turbulent Reynolds stress as it is insignificant compared to the other stresses (see Figure 3). On the -axis, we plot radius out to , and on the -axis we plot the normalized angular momentum flux. We normalize the flux to the angular momentum flux through the sphere at (Eq. 10).
The grey horizontal line shows that the total angular momentum flux within the jet is constant , which is by construction. The solid blue and red lines describe the total angular momentum fluxes in the wind and the disk regions, respectively. The transport of angular momentum in the wind and by the disk stresses are in equipartition at all radii. Furthermore, we see that the total angular momenta transported by the disk and wind regions both follow the same power-law in radius, . It is unclear what physical processes result in this power-law dependence. We will link this power-law to the mass ejection rate in Section 3.4.
We plot the various mechanisms of angular momentum transport within each region with the dashed (turbulent Maxwell stress; ), dotted (large-scale Maxwell stress; ), and dash-dotted (advective flow; ) lines. We break down the radially outward angular momentum flux within the disk into the turbulent Maxwell and large-scale Maxwell stresses. We do not include the inward radial advective term within the disk fluxes as it describes the net radially inward accretion due to outward, vertical or radial, angular momentum transport processes. We see that the turbulent Maxwell stress () closely follows the total angular momentum extracted and is the dominant mode of angular momentum transport within the disk. The large-scale Maxwell stress () is highly subdominant within the disk, which is as expected because the disk is turbulent.
We break down the angular momentum transport within the winds into the turbulent Maxwell, large-scale Maxwell, and advective terms. For , the large-scale Maxwell stresses are the dominant mechanism for radially outward angular momentum transport. For , the advective term dominates. The transition between these transport mechanisms could be due to the acceleration of the wind by the magnetic forces, effectively redistributing the angular momentum transport from magnetic to advective. The advective component could also be driven by different forces, such as an enthalpy gradient which would be naturally present in our hot, total energy conserving, MAD. Below, we try to disentangle those two possibilities by looking at the angular momentum fluxes through the disk surface.
At distances the turbulent Maxwell angular momentum flux exceeds the large-scale Maxwell angular momentum flux. However, at these radii and beyond we only sample orbits in our averages, and the disk might not have achieved quasi-steady state at such large radii. This may not be enough time to average over all variability timescales so our averages at these radii must be taken with a grain of salt.
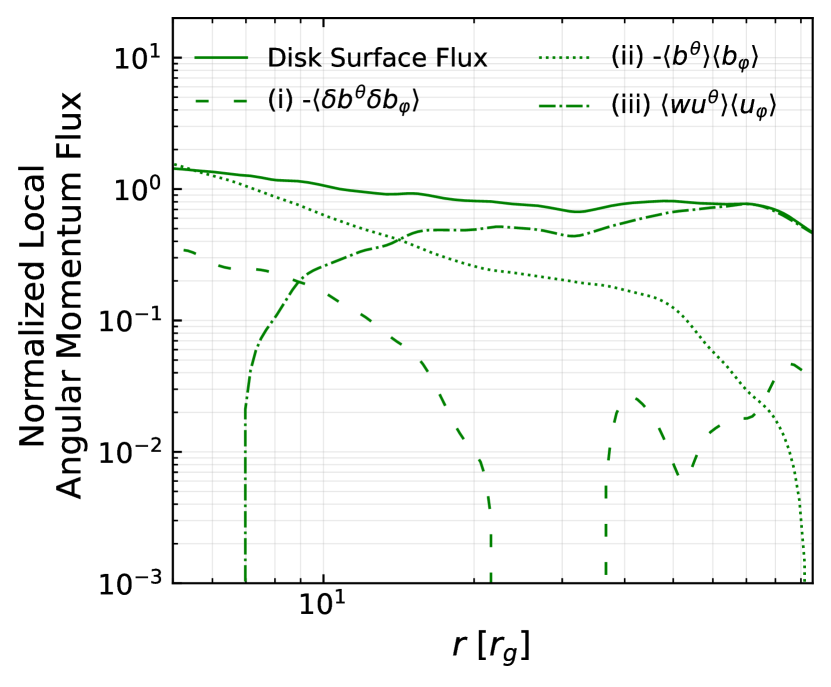
In Figure 4 (b), we show the cumulative integral in of the angular momentum flux through the disk-wind boundary and its decomposition, analogous to panel (a). Namely, here we decompose the angular momentum flux in the direction, , rather than . Our specific steps are as follows: we perform our decomposition and averaging procedure outlined in Section 2.2, we find the values of our decomposed on both north and south disk-wind boundaries, and cumulatively integrate them in radius. We then sum up the result from the top and the bottom surfaces of the disk:
| (12) | ||||
where is the cumulative angular momentum flux through the surface of the accretion disk, and are the bottom and top disk-wind boundaries (solid green lines in Fig. 2), and is the event horizon of the black hole. As in Equations 10 and 11, the factor of arises from a trivial integral over the axisymmetrized fluxes.The flux through the top of the accretion disk is in the negative direction, therefore we place a negative sign in front of the term to find the net flow of angular momentum out of the accretion disk.
By definition, no angular momentum crosses the wind-jet boundary on average, and the divergence theorem tells us that in steady state this integral, Eq. 12 evaluated at radius , equals the surface integral of over the wind region at the same radius. Indeed, Fig. 4(b) shows that the total disk surface flux (solid green line) is almost equal to the wind flux (light solid blue line) and follows the same radial scaling. The slight discrepancy between the two is likely due to the wind-jet boundary close to the BH. Close to the BH, the wind and disk are squeezed by the strong magnetic field attached to the BH. In the inner regions, the winds becomes a thin vertical sheath that could be easily contaminated by the angular momentum being extracted from the BH. This discrepancy may be further exacerbated by the density floors applied to the low density regions at the base of the jet, close to the BH. This artificially adds mass, and therefore momentum, to the inner jet and wind regions. We see this uptick in the total mass accretion rate of the system, which we depict with a thick, solid black line in Figure 5. Nonetheless, we stress that the agreement between the radial wind flux and the vertical disk suface flux is remarkable.
We decompose the angular momentum flux into its components at the disk surface (as detailed in Figure 4b) and show that the large-scale Maxwell torques, , dominate the angular momentum transport for , beyond which the advective term, , takes over222The advective torque is negative (not shown) very close to the black hole, . We believe that this is because the wind is unable to escape at very small radii due to it and the disk being squeezed by the strong magnetic field attached to the BH.. To make these comparisons between flux components, we compare the gradient of each component as that describes the instantaneous strength of each flux at a radius (see Fig. 6, Appendix A). Note that the large-scale Maxwell torques remain dominant up to a similar radius when compared to panel (a).
In panel (b), we show that the advective torque, , becomes dynamically important in the outer regions of the accretion disk, . The advective torque is related to the vertical gradient of angular momentum and should be negligible for negligible vertical gradients of (see 4th term of Eq. 17 of Zhu & Stone (2018)). However, radiatively inefficient accretion disks, like the one modeled here, can have sharp vertical angular momentum gradients related to their high thermal pressure. These sharp gradients can then lead to an efficient advective torque, , because gas that gets displaced in the direction will carry its angular momentum into a lower angular momentum region. This is in contrast with Scepi et al. (2023), who find that this term is always negligible even for their thicker disks.
It is clear that both the advective () and the laminar magnetic () torques contribute to the total surface angular momentum transport. Hence, the winds in geometrically thick MADs should be understood as magneto-thermal (Casse & Ferreira, 2000) and not purely driven by the Blandford & Payne (1982) mechanism. This is not surprising as the thermal energy of a geometrically thick MAD is considerable.
Furthermore, Scepi et al. (2023) also find that the large scale vertical torque, , always dominates the angular momentum transport. We find that this is only true in the inner regions of the accretion disk, . There is a range of radii, , where the turbulent, radial, Maxwell torque within the accretion disk, (Figure 2a), is in equipartition with the total vertical torque at the disk surface. Lastly, we note that the vertical turbulent Maxwell term, is subdominant throughout.
In panel (b) of Figure 4, we plotted the cumulative integral of the surface fluxes along the disk-wind boundaries. This was done to properly conserve angular momentum fluxes through our Gaussian surfaces. However, it can make it difficult to assess the radial dependence of the various terms contributing to by eye. To remedy this, we have included Figure 6 in Appendix A, where we depict as a function of radius. This shows that the advective surface flux () locally dominates the vertical angular momentum transport for , even though they only become globally dominant for (see Fig. 4b). We refer the reader to Appendix A for further discussion.
3.4 Inflow Rates
In this section, we assess how efficiently our system can drive mass inflow. To do this, we compare the measured mass accretion rate in the winds (), the disk (), and the system as a whole () to what classical viscosity theory predicts (Shakura & Sunyaev, 1973; Pringle, 1981). The prescription predicts the following mass accretion rate,
| (13) |
Here, is the vertical scale height of the accretion disk and is the orbital frequency of the gas, which we have measured in frame of the the zero angular momentum observer (ZAMO; see, e.g., definitions in Takahashi, 2007). This frame is chosen to eliminate rotation due to frame-dragging by the central BH. is the gas pressure in the disk. We evaluate the quantities and using density-weighted averages of solid angle, i.e. for instance .
We can also define a mass ejection index to quantify the radial dependence of the mass accretion rate:
| (14) |
where is the mass accretion rate within the disk and is the radial coordinate.
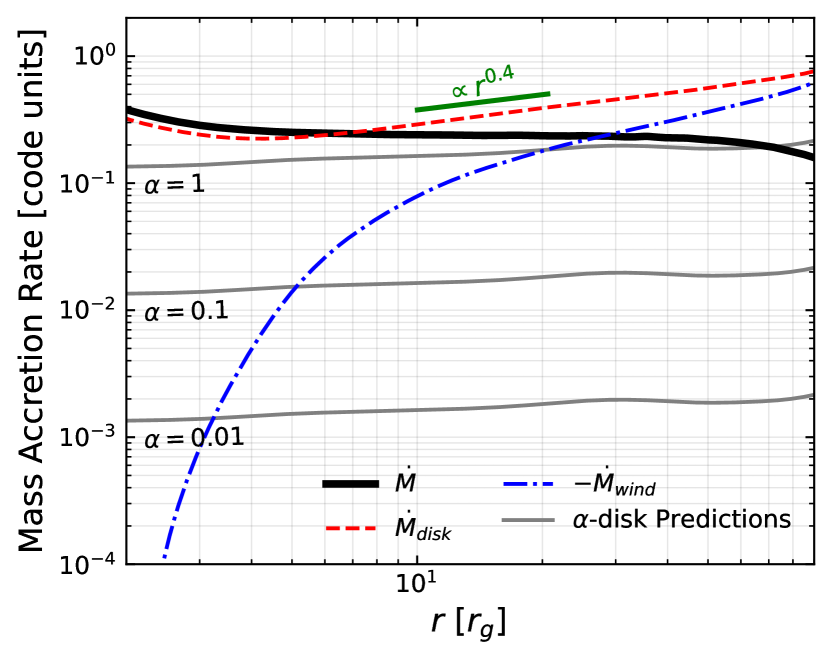
We then use Eq. (13) to compute for a range of values, , and show the resulting radial profiles of in Figure 5 with the solid, grey lines. This allows us to compare our simulated mass accretion rate, shown with the thick black line, with the prediction of the disk. First, we see that the total, time-averaged, mass accretion rate (thick solid black line) is roughly constant out to with a deviation of . This is despite the asymmetries in the accretion flow in Figure 2, which suggests that the system has reached inflow equilibrium out to that radius. We also note that the uptick in at is due to the density floors, which add mass in the jets. We then separate the mass flux into the wind and disk components using the definitions of Section 3.2.
The mass accretion rates in the winds (dash-dotted blue line) and disk (dashed red line), however, are not constant because the disk is losing gas to the wind. This results in a roughly radial dependence of the accretion rate in the disk. Due to mass conservation, the wind should exhibit the same power law. This power-law is altered at small radii, however, due to the boundary condition on the accretion rate in each region: the disk accretion rate must approach the black hole accretion rate, while the wind accretion rate must approach zero. Put otherwise, in the inner regions () the wind region carries almost no mass (see Fig. 2). In the outer regions () the wind ejection rate recovers roughly the same power law as the accretion rate (see Fig. 4).
If the system is in statistical steady state, the radial mass ejection power law should be related to the angular momentum power law we measured in Section 3.2:
| (15) |
where is the angular momentum accretion rate and is the averaged velocity. If we assume Keplerian orbits in the accretion disk, we know that . Therefore, we can use our radial dependence in Figure 4 to recover the radial dependence of the mass accretion rate we measure in Figure 5. Indeed, we see that in Fig. 4 and confirm that in Fig. 5, as expected. The coherence of the angular momentum and mass flux power laws is correctly predicted by self-similar theory (Ferreira & Pelletier, 1995; Ferreira, 1997; Jacquemin-Ide et al., 2019). The measured power law for the accretion rate, , is consistent with a heavily mass loaded outflow and is in the upper bound of what can be achieved with self-similar models (Jacquemin-Ide et al., 2019). The value we measure is in contrast with Scepi et al. (2023), who measure , but is consistent with McKinney et al. (2012), who measure .
We can see from Fig. 5 that the effective value of is at but decreases towards unity with radius. The overall magnitude of is high, but not surprising. Wind transport, which cannot be captured by the formalism, is significant and in equipartition with turbulent transport, suggesting that our effective could be limited to . Additionally, both shearing box MRI simulations (Salvesen et al., 2016) and global MAD simulations (Scepi et al., 2023) suggest that the turbulent is . Throughout our disk we measure (see Fig. 1), which is consistent with an order-unity effective (McKinney et al., 2012).
4 Summary
In this work, we have studied the time- and -averaged angular momentum transport processes occurring in a high-resolution, GRMHD simulation of a thick (), magnetically arrested disk around a rapidly rotating () black hole, performed using the GPU-accelerated code H-AMR. Here, the MAD state has been self-consistently reached by initializing our disk with a toroidal magnetic field which develops dynamically important poloidal fields via a magnetic dynamo (Jacquemin-Ide et al. 2023, in prep). We have focused in particular on the quasi-steady-state, late-time behavior of the flow, by time-averaging its properties from , during which the - and time-averaged mass accretion rate remains nearly constant out to (Fig. 5). We find that:
-
1.
On long timescales, the angular momentum streamlines can be used to neatly divide the azimuthally- and time-averaged flow into three regions: the jet, wind, and disk regions. We define the jet-wind boundary by iterating through the total angular momentum flux streamlines from the pole to the last (time- and -averaged) streamline anchored to the event horizon; all streamlines beyond this boundary are anchored to the disk. Thus, on average, the jet transports angular momentum that it extracted from the BH via the Blandford-Znajek mechanism. As we move from the jet-wind boundary to lower latitudes, we first reach areas where the net angular momentum flux flows radially outwards; we label these regions as the wind. As we get closer to the equator, we reach regions where the total angular momentum flux flows inwards; we label these regions as the disk. We then define the disk-wind boundaries as the set of “turn-around” points in our time- and -averaged streamlines of the total angular momentum flux. We determine these boundaries separately for the northern and southern hemispheres of our system, as the system can show long-term asymmetries about the equator. We label the delineated regions in Figure 2. Correctly separating these regions is essential for studying angular momentum transport mechanisms in systems where outflows are dynamically important. We also emphasize that this definition for the disk-wind boundary differs from the location of the disk scale height.
-
2.
By examining each term in the Reynolds-decomposed stress-energy tensor, we find that magnetic torques are the dominant angular momentum transport in the system at We find that within the wind, advection of gas and laminar magnetic torques generally dominate (Fig. 3). When we calculate the stress orthogonal to the disk-wind boundary (right panel of Fig. 4), we find similar behavior: the laminar magnetic torque dominates for , which accelerates the gas causing the advective transport to dominate for . Although, the picture might be more complicated further away from the BH (see section 3.2 and Appendix A). Since both magnetic and advective torques contribute to the angular momentum transport generated by the winds we qualify them as magneto-thermal. Within the disk, we can see that it is the turbulent Maxwell stress that dominates the transport at all radii (left panel of Fig. 4), presumably excited by some combination of the magnetorotational and magnetic interchange instabilities.
-
3.
We compare the overall strength of angular momentum transport in the wind versus the disk and find that they transport equal amounts of angular momentum away from the black hole. In Fig. 4, we can see that the laminar transport of angular momentum via the winds is remarkably close to equipartition with the turbulent transport of angular momentum occurring within the disk. Both follow near-linear () radial profiles, corresponding to a mass accretion rate radial profile , and specific angular momentum profile, .
-
4.
We contextualize the radial angular momentum transport behavior within the classical -viscosity paradigm and confirm the mass accretion rate profile of . The overall rate of angular momentum transport is high, which would correspond to an effective of (Fig. 5). Additionally, we compare our measured mass accretion rate profile with other works, establishing agreement with McKinney et al. (2012), who measure , and disagreement with Scepi et al. (2023), who measure . Scepi et al. (2023) use the expected logarithmic derivative of the accretion rate to estimate the disk ejection index (Eq. 14), while we measure the ejection index directly from the slope of the and (see Figs. 4 and 5 and Eq. 15). Our measurement is likely more robust as it relies on the consistency of our two measurements, one using and the other .
Many of the accreting black holes that we observe are thought to harbor MADs, motivating us to study them more closely. This is especially true in light of the recent EHT observations of the accreting supermassive black holes in M87 (Akiyama, 2019) and Sgr A* (EHT Collaboration et al., 2022), which appear to be most in agreement with simulated MADs as compared to other accretion disk models. In fact, most low luminosity AGN are thought to be powered by MADs, suggesting that the MAD state may be the most common accretion configuration for SMBHs (Zamaninasab et al., 2014; Nemmen & Tchekhovskoy, 2015; Tchekhovskoy, 2015).
Our non-radiative simulations are best suited to describe the hard state of X-ray binaries, which are thought to harbor strongly magnetized, radiatively-inefficient accretion flows (Remillard & McClintock, 2006). Observations of blue-shifted absorption lines indicate that winds are present (Ponti et al., 2016). Disk winds from X-ray binaries in the hard state can be modeled as Blandford & Payne (1982) accelerated outflows with field lines anchored in the accretion disk (Ferreira & Pelletier, 1995). Chakravorty et al. (2016) computed the absorption lines from such outflow models and compared them to observations of X-ray binary disk winds, finding heavily mass loaded winds that correspond to a mass ejection index (note that is used as the mass ejection index in Chakravorty et al., 2016). More recent works constrain the mass ejection index of X-ray binaries to (Fukumura et al., 2021; Chakravorty et al., 2023). The slope we measure in our simulation, , falls within the observed range. However, directly comparing the outflows in our simulations with the ones in observed X-ray binaries would require radiative transfer post-processing, which we leave for future work.
Since our simulations include no radiative cooling, our results most directly apply to black holes accreting at rates far below333Black holes accreting far above the Eddington rate also cool inefficiently, and thus may resemble polytropic models such as ours. But, at the very least, their equation of state will alter from to , and the presence of radiatively-driven outflows can alter the angular momentum transport mechanisms. the Eddington limit, such as the hard state of X-ray binaries or low-luminosity AGN.
However, in many systems that may potentially harbor MADs, such as the one in our simulations, radiative effects are essential. For example, changing-look AGN feature rapid, months to years long variability for which strong magnetic fields have sometimes been invoked to explain (e.g., Dexter & Begelman, 2018). However, they appear at Eddington ratios of , where we usually expect efficiently cooling, geometrically thin disks. Additionally, ultrafast outflows (UFOs), which can reach velocities up to , have also been observed in similarly subcritical AGN (e.g., Parker et al., 2017; Tombesi et al., 2014), which may be the result of magnetically-driven winds. For Eddington ratios where the inner disk is radiation pressure dominated (), classical -disks are thermally unstable, yet both AGN and XRBs show little evidence of thermal instability at these accretion rates. This discrepancy may be alleviated in the presence of dynamically important magnetic fields (Jiang et al., 2013; Sądowski, 2016). In all of these cases, it is important to study MADs with simulations that have some prescription for radiative cooling (Scepi et al., 2023) or, better yet, including radiation transport (Liska et al., 2022a, 2023).
We also note that there is some discrepancy with our results and other recent works. For instance, Scepi et al. (2023) found that when their disk is not significantly cooled (thermal aspect ratio of ), laminar magnetic torques, dominate angular momentum transport. Furthermore, they found that the vertical advective wind torque, , is negligible. In contrast, we find that the total vertical laminar torque, at the disk-wind boundary is in equipartition with the turbulent magnetic field angular momentum transport, , within the accretion disk (Fig. 4). We explain this tension by noting that Scepi et al. (2023) measure the ratio of the torques in the inner regions of the disk (), while we can measure the ratio of torques farther away, . In the inner regions we find a similar trend to Scepi et al. (2023), the laminar polar wind torque, , is a factor of 2 larger than the turbulent angular momentum torque, (see their Fig. 10). Our results show that turbulent diagnostics need to be evaluated sufficiently far from the BH, , so that they reach their asymptotic properties.
In Chatterjee & Narayan (2022), the authors argued that magnetic flux eruptions are a dominant mode of angular momentum transport in their MAD simulations. One major difference between the simulations, however, is that they modeled non-spinning, and therefore jet-less, BHs, while our BH is rapidly rotating. The importance of magnetic flux eruptions in angular momentum transport in MADs around spinning, jetted BHs is yet to be studied closely. While we did not notice enhanced angular momentum transport during flux eruption events, we also focused on the time- and -averaged angular momentum transport rather than any time-dependent mechanisms. Furthermore, the wind region is vertically squeezed close to the BH (; see Figure 2) by the jet, suggesting that the pressure at the jet-wind boundary may have a strong effect on the properties of the wind outflows. It is not immediately obvious that the transport of angular momentum by winds should be the same in both jetted and jet-less BHs. This would indicate that MADs harbored by spinning versus spinless (and, therefore, jetless) may have different wind properties and merits dedicated comparison. Clearly, these discrepancies motivate further studies of angular momentum transport in MADs.
Effective -models are a simplified, yet powerful method of modeling secular behavior in astrophysical disks (Shakura & Sunyaev, 1976; Dubus et al., 2001). However, large scale vertical torques (advective or magnetic), which are dynamically important in our simulations and in those of Scepi et al. (2023), are difficult to model accurately with an -viscosity. Unlike turbulent torques, vertical laminar torques do not induce viscous spreading of the disk as they do not lead to dissipation but act only as a sink term for angular momentum. Hence, laminar and turbulent torques lead to distinct disk behaviors on long time scales (Scepi et al., 2020; Tabone et al., 2022). Furthermore, disk winds also remove significant matter from the accretion disk (see Fig. 5), completely changing their long term impact on disk dynamics when compared to simple -models. Additionally, it has become clear that the angular momentum loss via disk winds is also dynamically important for the orbital evolution of binaries that overflow their Roche lobes, like low-mass X-ray binaries (Gallegos-Garcia et al., 2023). The ubiquity of winds in astrophysical disks necessitates updating to disk models to include disk wind torques, as they are essential to understanding the long term evolution of accretion disks.
Appendix A Local Surface Angular Momentum Flux
In panel (b) of Figure 4, we presented each term contributing to the integrated angular momentum flux – – leaving the disk-wind boundary (see Equation 12). This calculation results in a cumulative integral as a function of radius. This can make it difficult to, by eye, assess the local radial dependence of the various terms contributing to . To remedy this, we have presented Figure 6, which is analogous to panel (b) of Figure 4, except we show . This quantity depicts the local vertical angular momentum escaping the surface of the disk per unit width of the boundary .
It is insightful to compare the advective surface flux () between Figures 4b and 6. In particular, we saw in Figure 4 that the advective surface flux became the dominant contributor to the - integrated flux at . In Figure 6b, we can see that this term actually begins to dominate the laminar magnetic surface stress () at . This indicates that the outflows are not purely magnetically driven and are instead driven by a combination of magnetic and pressure forces. This is perhaps unsurprising, as thermal pressure is dynamically important when the flow is adiabatic and the sound speed is approximately virial, as is the case here.
References
- Akiyama (2019) Akiyama, K. 2019, The Astrophysical Journal Letters
- Balbus & Hawley (1991) Balbus, S. A., & Hawley, J. F. 1991, The Astrophysical Journal, 376, 214, doi: 10.1086/170270
- Begelman & Pringle (2007) Begelman, M. C., & Pringle, J. E. 2007, MNRAS, 375, 1070, doi: 10.1111/j.1365-2966.2006.11372.x
- Begelman et al. (2022) Begelman, M. C., Scepi, N., & Dexter, J. 2022, MNRAS, 511, 2040, doi: 10.1093/mnras/stab3790
- Blandford et al. (2019) Blandford, R., Meier, D., & Readhead, A. 2019, Annual Review of Astronomy and Astrophysics, 57, 467, doi: 10.1146/annurev-astro-081817-051948
- Blandford & Payne (1982) Blandford, R. D., & Payne, D. G. 1982, Monthly Notices of the Royal Astronomical Society, 199, 883–903, doi: 10.1093/mnras/199.4.883
- Blandford & Znajek (1977) Blandford, R. D., & Znajek, R. L. 1977, Monthly Notices of the Royal Astronomical Society, 179, 433–456, doi: 10.1093/mnras/179.3.433
- Casse & Ferreira (2000) Casse, F., & Ferreira, J. 2000, Astronomy and Astrophysics, 353, 1115. http://adsabs.harvard.edu/abs/2000A%26A...353.1115C
- Chakrabarti (1985) Chakrabarti, S. K. 1985, ApJ, 288, 1, doi: 10.1086/162755
- Chakravorty et al. (2016) Chakravorty, S., Petrucci, P.-O., Ferreira, J., et al. 2016, Astronomische Nachrichten, 337, 429, doi: 10.1002/asna.201612325
- Chakravorty et al. (2023) Chakravorty, S., Petrucci, P.-O., Datta, S. R., et al. 2023, Monthly Notices of the Royal Astronomical Society, 518, 1335, doi: 10.1093/mnras/stac2835
- Chatterjee & Narayan (2022) Chatterjee, K., & Narayan, R. 2022, ApJ, 941, 30, doi: 10.3847/1538-4357/ac9d97
- Christie et al. (2019) Christie, I. M., Lalakos, A., Tchekhovskoy, A., et al. 2019, Monthly Notices of the Royal Astronomical Society, 490, 4811, doi: 10.1093/mnras/stz2552
- Cicone et al. (2014) Cicone, C., Maiolino, R., Sturm, E., et al. 2014, Astronomy and Astrophysics, 562, A21, doi: 10.1051/0004-6361/201322464
- Colella & Woodward (1984) Colella, P., & Woodward, P. R. 1984, Journal of Computational Physics, 54, 174–201, doi: 10.1016/0021-9991(84)90143-8
- Corbel et al. (2013) Corbel, S., Coriat, M., Brocksopp, C., et al. 2013, Monthly Notices of the Royal Astronomical Society, 428, 2500, doi: 10.1093/mnras/sts215
- Corbel et al. (2000) Corbel, S., Fender, R. P., Tzioumis, A. K., et al. 2000, Astronomy and Astrophysics, 359, 251. http://adsabs.harvard.edu/abs/2000A%26A...359..251C
- Corbel et al. (2003) Corbel, S., Nowak, M. A., Fender, R. P., Tzioumis, A. K., & Markoff, S. 2003, Astronomy and Astrophysics, 400, 1007, doi: 10.1051/0004-6361:20030090
- Dexter & Begelman (2018) Dexter, J., & Begelman, M. C. 2018, Monthly Notices of the Royal Astronomical Society: Letters, 483, doi: 10.1093/mnrasl/sly213
- Dexter & Begelman (2019) Dexter, J., & Begelman, M. C. 2019, MNRAS, 483, L17, doi: 10.1093/mnrasl/sly213
- Dubus et al. (2001) Dubus, G., Hameury, J.-M., & Lasota, J.-P. 2001, Astronomy and Astrophysics, v.373, p.251-271 (2001), 373, 251, doi: 10.1051/0004-6361:20010632
- EHT Collaboration et al. (2022) EHT Collaboration, E. H. T., Akiyama, K., Alberdi, A., et al. 2022, The Astrophysical Journal Letters, 930, L16, doi: 10.3847/2041-8213/ac6672
- Ferreira (1997) Ferreira, J. 1997, Astronomy and Astrophysics, 319, 340. http://adsabs.harvard.edu/abs/1997A%26A...319..340F
- Ferreira & Pelletier (1993) Ferreira, J., & Pelletier, G. 1993, Astronomy and Astrophysics, 276, 625. http://adsabs.harvard.edu/abs/1993A%26A...276..625F
- Ferreira & Pelletier (1995) —. 1995, Astronomy and Astrophysics, 295, 807. http://cdsads.u-strasbg.fr/abs/1995A%26A...295..807F
- Fragile & Sądowski (2017) Fragile, P. C., & Sądowski, A. 2017, Monthly Notices of the Royal Astronomical Society, 467, 1838, doi: 10.1093/mnras/stx274
- Fukumura et al. (2021) Fukumura, K., Kazanas, D., Shrader, C., et al. 2021, The Astrophysical Journal, 912, 86, doi: 10.3847/1538-4357/abedaf
- Gaburov et al. (2012) Gaburov, E., Johansen, A., & Levin, Y. 2012, ApJ, 758, 103, doi: 10.1088/0004-637X/758/2/103
- Gallegos-Garcia et al. (2023) Gallegos-Garcia, M., Jacquemin-Ide, J., & Kalogera, V. 2023, Angular Momentum Loss During Stable Mass Transfer onto a Compact object: the Effect of Mass Loss via Accretion Disk Winds, doi: 10.48550/arXiv.2308.13146
- Gallo et al. (2005) Gallo, E., Fender, R., & Kaiser, C. 2005, Interacting Binaries: Accretion, Evolution, and Outcomes, 797, 189, doi: 10.1063/1.2130232
- Gallo et al. (2003) Gallo, E., Fender, R. P., & Pooley, G. G. 2003, Monthly Notices of the Royal Astronomical Society, 344, 60, doi: 10.1046/j.1365-8711.2003.06791.x
- Gammie et al. (2003) Gammie, C. F., McKinney, J. C., & Toth, G. 2003, The Astrophysical Journal, 589, 444–457, doi: 10.1086/374594
- Gottlieb et al. (2023) Gottlieb, O., Issa, D., Jacquemin-Ide, J., et al. 2023, The Astrophysical Journal Letters, 954, L21, doi: 10.3847/2041-8213/aceeff
- Igumenshchev et al. (2003) Igumenshchev, I. V., Narayan, R., & Abramowicz, M. A. 2003, ApJ, 592, 1042, doi: 10.1086/375769
- Jacquemin-Ide et al. (2019) Jacquemin-Ide, J., Ferreira, J., & Lesur, G. 2019, Monthly Notices of the Royal Astronomical Society, 490, 3112, doi: 10.1093/mnras/stz2749
- Jacquemin-Ide et al. (2021) Jacquemin-Ide, J., Lesur, G., & Ferreira, J. 2021, Astronomy & Astrophysics, 647, doi: 10.1051/0004-6361/202039322
- Jiang et al. (2013) Jiang, Y.-F., Stone, J. M., & Davis, S. W. 2013, The Astrophysical Journal, 778, 65, doi: 10.1088/0004-637X/778/1/65
- Kaaz et al. (2023) Kaaz, N., Liska, M. T. P., Jacquemin-Ide, J., et al. 2023, ApJ, 955, 72, doi: 10.3847/1538-4357/ace051
- Kaisig et al. (1992) Kaisig, M., Tajima, T., & Lovelace, R. V. E. 1992, The Astrophysical Journal, 386, 83, doi: 10.1086/170994
- Lawrence (2018) Lawrence, A. 2018, Nature Astronomy, 2, 102, doi: 10.1038/s41550-017-0372-1
- Lesur et al. (2013) Lesur, G., Ferreira, J., & Ogilvie, G. I. 2013, Astronomy and Astrophysics, 550, A61, doi: 10.1051/0004-6361/201220395
- Lightman & Eardley (1974) Lightman, A. P., & Eardley, D. M. 1974, ApJ, 187, L1, doi: 10.1086/181377
- Liska et al. (2020) Liska, M., Tchekhovskoy, A., & Quataert, E. 2020, Monthly Notices of the Royal Astronomical Society, 494, 3656–3662, doi: 10.1093/mnras/staa955
- Liska et al. (2023) Liska, M. T. P., Kaaz, N., Musoke, G., Tchekhovskoy, A., & Porth, O. 2023, ApJ, 944, L48, doi: 10.3847/2041-8213/acb6f4
- Liska et al. (2022a) Liska, M. T. P., Musoke, G., Tchekhovskoy, A., Porth, O., & Beloborodov, A. M. 2022a, The Astrophysical Journal Letters, 935, L1, doi: 10.3847/2041-8213/ac84db
- Liska et al. (2022b) Liska, M. T. P., Chatterjee, K., Issa, D., et al. 2022b, The Astrophysical Journal Supplement Series, 263, 26, doi: 10.3847/1538-4365/ac9966
- Lubow et al. (1994) Lubow, S. H., Papaloizou, J. C. B., & Pringle, J. E. 1994, Monthly Notices of the Royal Astronomical Society, 267, 235, doi: 10.1093/mnras/267.2.235
- Lubow & Spruit (1995) Lubow, S. H., & Spruit, H. C. 1995, The Astrophysical Journal, 445, 337, doi: 10.1086/175698
- Markoff et al. (2003) Markoff, S., Nowak, M., Corbel, S., Fender, R., & Falcke, H. 2003, Astronomy and Astrophysics, 397, 645, doi: 10.1051/0004-6361:20021497
- Marshall et al. (2018) Marshall, M. D., Avara, M. J., & McKinney, J. C. 2018, Monthly Notices of the Royal Astronomical Society, 478, 1837, doi: 10.1093/mnras/sty1184
- Mata Sánchez et al. (2023) Mata Sánchez, D., Muñoz-Darias, T., Casares, J., Huertas-Company, M., & Panizo-Espinar, G. 2023, Monthly Notices of the Royal Astronomical Society, 524, 338, doi: 10.1093/mnras/stad1895
- Matt et al. (2003) Matt, G., Guainazzi, M., & Maiolino, R. 2003, MNRAS, 342, 422, doi: 10.1046/j.1365-8711.2003.06539.x
- McKinney et al. (2012) McKinney, J. C., Tchekhovskoy, A., & Blandford, R. D. 2012, Monthly Notices of the Royal Astronomical Society, 423, 3083, doi: 10.1111/j.1365-2966.2012.21074.x
- Merloni et al. (2003) Merloni, A., Heinz, S., & di Matteo, T. 2003, Monthly Notices of the Royal Astronomical Society, 345, 1057, doi: 10.1046/j.1365-2966.2003.07017.x
- Mirabel & Rodríguez (1999) Mirabel, I. F., & Rodríguez, L. F. 1999, Annual Review of Astronomy and Astrophysics, 37, 409, doi: 10.1146/annurev.astro.37.1.409
- Mishra et al. (2019) Mishra, B., Begelman, M. C., Armitage, P. J., & Simon, J. B. 2019, Monthly Notices of the Royal Astronomical Society, 492, 1855–1868, doi: 10.1093/mnras/stz3572
- Narayan et al. (2003) Narayan, R., Igumenshchev, I. V., & Abramowicz, M. A. 2003, Publications of the Astronomical Society of Japan, 55, L69–L72, doi: 10.1093/pasj/55.6.L69
- Nemmen & Tchekhovskoy (2015) Nemmen, R. S., & Tchekhovskoy, A. 2015, Monthly Notices of the Royal Astronomical Society, 449, 316, doi: 10.1093/mnras/stv260
- Parker et al. (2017) Parker, M. L., Pinto, C., Fabian, A. C., et al. 2017, Nature, 543, 83, doi: 10.1038/nature21385
- Piran (1978) Piran, T. 1978, ApJ, 221, 652, doi: 10.1086/156069
- Ponti et al. (2016) Ponti, G., Bianchi, S., Muñoz-Darias, T., et al. 2016, Astronomische Nachrichten, 337, 512, doi: 10.1002/asna.201612339
- Ponti et al. (2012) Ponti, G., Fender, R. P., Begelman, M. C., et al. 2012, Monthly Notices of the Royal Astronomical Society, 422, L11, doi: 10.1111/j.1745-3933.2012.01224.x
- Pringle (1981) Pringle, J. E. 1981, Annual Review of Astronomy and Astrophysics, 19, 137, doi: 10.1146/annurev.aa.19.090181.001033
- Remillard & McClintock (2006) Remillard, R. A., & McClintock, J. E. 2006, Annual Review of Astronomy and Astrophysics, 44, 49, doi: 10.1146/annurev.astro.44.051905.092532
- Rothstein & Lovelace (2008) Rothstein, D. M., & Lovelace, R. V. E. 2008, The Astrophysical Journal, 677, 1221, doi: 10.1086/529128
- Salvesen et al. (2016) Salvesen, G., Simon, J. B., Armitage, P. J., & Begelman, M. C. 2016, MNRAS, 457, 857, doi: 10.1093/mnras/stw029
- Scepi et al. (2023) Scepi, N., Begelman, M. C., & Dexter, J. 2023, arXiv e-prints, arXiv:2302.10226, doi: 10.48550/arXiv.2302.10226
- Scepi et al. (2020) Scepi, N., Lesur, G., Dubus, G., & Jacquemin-Ide, J. 2020, Astronomy and Astrophysics, 641, A133, doi: 10.1051/0004-6361/202037903
- Shakura & Sunyaev (1973) Shakura, N. I., & Sunyaev, R. A. 1973, Symposium - International Astronomical Union, 55, 155–164, doi: 10.1017/S007418090010035X
- Shakura & Sunyaev (1976) —. 1976, MNRAS, 175, 613, doi: 10.1093/mnras/175.3.613
- Spruit et al. (1995) Spruit, H. C., Stehle, R., & Papaloizou, J. C. B. 1995, Monthly Notices of the Royal Astronomical Society, 275, 1223–1231, doi: 10.1093/mnras/275.4.1223
- Sądowski (2016) Sądowski, A. 2016, Monthly Notices of the Royal Astronomical Society, 459, 4397, doi: 10.1093/mnras/stw913
- Tabone et al. (2022) Tabone, B., Rosotti, G. P., Cridland, A. J., Armitage, P. J., & Lodato, G. 2022, Monthly Notices of the Royal Astronomical Society, 512, 2290, doi: 10.1093/mnras/stab3442
- Takahashi (2007) Takahashi, R. 2007, MNRAS, 382, 1041, doi: 10.1111/j.1365-2966.2007.12030.x
- Tchekhovskoy (2015) Tchekhovskoy, A. 2015, in The Formation and Disruption of Black Hole Jets, ed. I. Contopoulos, D. Gabuzda, & N. Kylafis, Astrophysics and Space Science Library (Cham: Springer International Publishing), 45–82, doi: 10.1007/978-3-319-10356-3_3
- Tchekhovskoy & Giannios (2015) Tchekhovskoy, A., & Giannios, D. 2015, Monthly Notices of the Royal Astronomical Society, 447, 327, doi: 10.1093/mnras/stu2229
- Tchekhovskoy et al. (2014) Tchekhovskoy, A., Metzger, B. D., Giannios, D., & Kelley, L. Z. 2014, Monthly Notices of the Royal Astronomical Society, 437, 2744, doi: 10.1093/mnras/stt2085
- Tchekhovskoy et al. (2011) Tchekhovskoy, A., Narayan, R., & McKinney, J. C. 2011, Monthly Notices of the Royal Astronomical Society: Letters, 418, L79, doi: 10.1111/j.1745-3933.2011.01147.x
- Tetarenko et al. (2018) Tetarenko, B. E., Lasota, J.-P., Heinke, C. O., Dubus, G., & Sivakoff, G. R. 2018, Nature, 554, 69, doi: 10.1038/nature25159
- Tomaru et al. (2023) Tomaru, R., Done, C., & Mao, J. 2023, Monthly Notices of the Royal Astronomical Society, 518, 1789, doi: 10.1093/mnras/stac3210
- Tomaru et al. (2019) Tomaru, R., Done, C., Ohsuga, K., Nomura, M., & Takahashi, T. 2019, Monthly Notices of the Royal Astronomical Society, 490, 3098, doi: 10.1093/mnras/stz2738
- Tombesi et al. (2014) Tombesi, F., Tazaki, F., Mushotzky, R. F., et al. 2014, Monthly Notices of the Royal Astronomical Society, 443, 2154, doi: 10.1093/mnras/stu1297
- Wardle & Koenigl (1993) Wardle, M., & Koenigl, A. 1993, The Astrophysical Journal, 410, 218, doi: 10.1086/172739
- Waters et al. (2021) Waters, T., Proga, D., & Dannen, R. 2021, The Astrophysical Journal, 914, 62, doi: 10.3847/1538-4357/abfbe6
- White et al. (2019) White, C. J., Stone, J. M., & Quataert, E. 2019, The Astrophysical Journal, 874, 168, doi: 10.3847/1538-4357/ab0c0c
- Zamaninasab et al. (2014) Zamaninasab, M., Clausen-Brown, E., Savolainen, T., & Tchekhovskoy, A. 2014, Nature, 510, 126, doi: 10.1038/nature13399
- Zhu & Stone (2018) Zhu, Z., & Stone, J. M. 2018, The Astrophysical Journal, 857, 34, doi: 10.3847/1538-4357/aaafc9