Dealing with broad-band X-ray spectra of faint AGN: a case study
Abstract
In this work we analyse 3 average-luminosity hard X-ray selected AGN: ESO 506-G27, IGR J19039+3344 and NGC 7465. They have simultaneous Swift/XRT and NuSTAR data never published before and have been poorly studied at X-ray energies. These sources make for interesting targets both from a methodological and scientific point of view. Scientifically, they are of interest since they are possibly heavily absorbed objects, belong to a peculiar class and are variable both in flux and in spectral shape. Methodologically, because it is an interesting exercise to understand how existing spectral models can be applied to faint sources and how the use of NuSTAR data alone and then simultaneous and/or average data impacts on the spectral parameters determination. In this work we demonstrate that simultaneous data are not sufficient if their statistical quality is poor. Moreover, we show that also the use of time-averaged data when dealing with faint AGN does not always provide confident results as for brighter AGN. Regardless of the poor data quality employed in our analysis, we are able to provide insights into the spectral characteristics of each source. We analyse in detail for the first time the iron line complex of ESO 506-G27, finding not only the presence of the iron K and K lines, but also of the iron K edge around 7 keV in the NuSTAR data. We also highlight changes in the absorption properties of IGR J19039+3344 and confirm NGC 7465 to be an unabsorbed type 1 LINER.
keywords:
galaxies: active - galaxies: Seyfert - X-rays: galaxies1 Introduction
To study the X-ray spectral properties of Active Galactic Nuclei (AGN), broad-band studies are essential. The low energy part of the spectrum is important to estimate the absorption intrinsic to the source (neutral or ionised, simple or complex) and to detect the presence of a soft excess. On the other hand, high energy data are fundamental to measure the underlying power-law continuum, in particular the temperature of the corona, by means of the high energy cut-off, as well as the reflection hump around 30 keV (see e.g. Malizia et al. 2020).
A wider energy band has been made available with the advent of the NuSTAR mission (Harrison et al., 2013); however, even if the energy coverage is quite broad (3-78 keV), it is not sufficient to properly measure the soft excess and intrinsic absorption on the low energy part of the spectrum, as well as the high energy cut-off when it is located above a 100 keV. In the last few years, several broad-band studies on bright AGN have been published, either by using NuSTAR data alone (e.g. Akylas & Georgantopoulos 2021) or in combination with data from soft X-ray observatories, such as Swift/XRT and XMM-Newton, as well as with higher energy data from either Swift/BAT or INTEGRAL/IBIS. We point out that both Swift/BAT and INTEGRAL/IBIS provide time-averaged spectra over long exposure times, to allow a good signal to noise ratio. These spectra can then be combined with single snapshot observations, with the risk of incurring in problematic issues related to source spectral and flux variability. Despite the introduction of cross-calibration constants to account for flux variability and/or mismatches in the instruments calibration, some level of uncertainty still remains as spectral variability cannot be ruled out a priori (Lubiński et al., 2010; Fedorova & Zhdanov, 2016; Ricci et al., 2017; Molina et al., 2019).
For bright (10-11erg cm-2 s-1) sources belonging to the INTEGRAL complete sample, for which simultaneous Swift/XRT and NuSTAR were available, Molina et al. (2019) confirmed the results obtained on the same objects but using non-simultaneous data by Malizia et al. (2014). In the case of average luminosity AGN (i.e. the large majority of the population) and in particular for absorbed objects with spectral complexities (soft excess, warm absorber, iron line complex), this is not always the case, as it is more difficult to characterise their spectral properties; this could be due to a number of reasons, including the non-simultaneity of the data and/or their low statistical quality.
The INTEGRAL/IBIS and Swift/BAT AGN catalogues (e.g. Malizia et al. 2023; Oh et al. 2018) list a considerable number of faint and less well-studied sources, which present some challenges in their analysis, given that their spectra are quite often characterised by data of poor statistical quality.
In this work we analyse a set of 3 average-luminosity AGN: ESO 506-G27, IGR J19039+3344 and NGC 7465. They have been extracted from the INTEGRAL AGN catalogues (Malizia et al., 2012; Malizia et al., 2020) and are also detected by BAT (Oh et al., 2018); all of them have simultaneous Swift/XRT and NuSTAR data never published before. All three sources have been poorly studied at X-ray energies, particularly they lack in-depth analyses of broad-band spectra, except for a study by Ricci et al. (2017), who used average Swift/BAT spectra in combination with non simultaneous soft X-ray data. These sources make for interesting targets both from a methodological and from a purely scientific point of view. Scientifically, they are of interest since they are possibly heavily absorbed objects, belong to a peculiar class of AGN (NGC 7465) and are variable both in flux and in spectral shape on timescales of months to years. Methodologically, because it is an interesting exercise to understand how existing spectral models can be applied to faint sources and how the use of NuSTAR data alone and then simultaneous and/or average data impacts on the spectral parameters determination.
The methodology we apply in our study is the following: we first fit single NuSTAR observations on their own; then we consider simultaneous XRT/NuSTAR observations; finally, we analyse average XRT plus INTEGRAL/IBIS spectra. A comparison between the results of the different fitting procedures and the limited works available in the literature provides an insight into the various procedures adopted as well as their limitations/improvements. As a byproduct of our analysis, we are also able to provide interesting scientific insights on each source, despite the constraints imposed by data quality.
2 Source selection and Data Reduction
The source selected for this analysis are the type 2 active galaxies ESO 506-G27 and IGR J19039+3994 plus NGC 7465, which has an ambiguous classification between a Seyfert 2 (Koss et al., 2022) and a low-ionization nuclear emission-line region AGN (LINER, e.g. Ferruit et al. 2000). Guainazzi et al. (2005) measured a high column density (NH51023cm-2) thus justifying the type 2 classification, but Ramos Almeida et al. (2009) classified it as a type 1 LINER, based on the presence of broad lines in near infra-red spectra.
They have been extracted from INTEGRAL AGN catalogues (Malizia et al., 2012; Malizia et al., 2020) and have therefore been firmly detected above 20 keV. In Table 1 we report the main information for each object (coordinates, source redshift, optical classification, Galactic column density, observation details); in the last three columns of Table 1 we also include the cleaned exposures and significance of detection as well as the 2-10 keV NuSTAR observed fluxes relative to the simultaneous observations (see section 3.2). It is worth noting that all three sources are detected by NuSTAR up to 70 keV (see figures relative to the spectral fits). The three sources have been selected as the target of the present analysis since they are potentially peculiar sources: they are quite faint in the X-rays and show interesting absorption properties. Besides, they are all variable, either in flux or in spectral shape and their soft X-ray data are of low statistical quality, as well as the NuSTAR ones, which are also below average quality, and have low exposure times. Therefore the three AGN selected for our scientific/methodological study make for ideal key targets. Here we report never published before NuSTAR observations, together with simultaneous soft X-ray data obtained from the XRT telescope on board the Neil Geherels Swift Observatory; we also analysed a 2006 XMM observation of ESO 506-G27 for the purpose of better characterise the soft part of the spectrum. Time-averaged spectra from Swift/XRT combined with INTEGRAL/IBIS data are analysed and compare with simultaneous spectra.
XRT data reduction was performed using the standard data pipeline package (XRTPIPELINE v. 0.13.2) so to produce screened event files (see e.g. Landi et al. 2010). Source events were extracted within a circular region with a radius of 20 pixels (1 pixel corresponding to 2.36 arcsec) centred on the source position, while background events were extracted from a source-free region close to the X-ray source of interest. The spectra were obtained from the corresponding event files using the XSELECT v.2.4c software, then binned appropriately using grppha. We used version v.014 of the response matrices and created individual ancillary response files using the task xrtmkarf v.0.6.3.
NuSTAR data (from both focal plane detectors, FPMA and FPMB) were reduced using the nustardas_04May21_v2.1.1 and CALDB version 20220118. For our sources, spectral extraction and the subsequent production of response and ancillary files was performed using the nuproducts task with an extraction radius chosen depending on the source brightness; to maximise the signal-to-noise ratio, background spectra were extracted from circular regions of typically 50′′–70′′ radius in source-free areas of the detectors. When fitting NuSTAR data a multiplicative cross-calibration constant has always been taken into account and found to be close to one in each case, as expected. All our spectra are background subtracted.
For obtaining the high energy data, we used the INTEGRAL IBIS Off-line Scientific Analysis pipeline (OSA 11.2), which produces spectra, response and ancillary matrices.
Archival data for all three sources where obtained either through the HEASARC database111https://heasarc.gsfc.nasa.gov/docs/archive.html or through the XMM Science Archive222https://www.cosmos.esa.int/web/xmm-newton/xsa.
| Name | RA | Dec | z | Class | N | Telescope | Obs. ID | Date | Exposure | significance† | F2-10 |
|---|---|---|---|---|---|---|---|---|---|---|---|
| 1022cm-2 | ksec | erg cm-2s-2 | |||||||||
| ESO 506-G27 | 12 38 54.59 | -27 18 28.01 | 0.02502 | Sey 2 | 0.0534 | XRT | 00035173002 | 15 June 2005 | 7.5 | ||
| XRT | 00035173003 | 15 Aug. 2005 | 2.26 | ||||||||
| XRT | 00035173004 | 15 Aug. 2005 | 11.5 | ||||||||
| XRT | 00088765001 | 12 Oct. 2018 | 1.8 | ||||||||
| XRT | 00088765002 | 26 June 2019 | 2.16 | 4.23 | |||||||
| NuSTAR | 60469006002 | 26 June 2019 | 18.7 | 42.34 | 2.4310-12 | ||||||
| XMM | 0312191801 | 24 Jan. 2006 | 7.3 | ||||||||
| IBIS | – | – | 227 | 9.3 | |||||||
| IGR J19039+3344 | 19 03 49.14 | +33 50 41.11 | 0.0150 | Sey 2 | 0.074 | XRT | 00090184001 | 26 May 2009 | 10.3 | ||
| XRT | 00081412001 | 27 Aug. 2019 | 6.0 | 5.10 | |||||||
| XRT | 00081412002 | 3 July 2022 | 4.2 | ||||||||
| XRT | 00081412003 | 3 July 2022 | 1.4 | ||||||||
| NuSTAR | 60161704002 | 27 Aug. 2019 | 23.5 | 23.19 | 9.6710-13 | ||||||
| NGC 7465 | 23 02 00.96 | +15 57 53.24 | 0.00736 | LINER | 0.0517 | XRT | 00011341001 | 9 May 2019 | 1.5 | ||
| XRT | 00081295001 | 9 Jan. 2020 | 1.6 | 33.37 | |||||||
| XRT | 00081295002 | 10 Jan. 2020 | 4.8 | ||||||||
| NuSTAR | 60160815002 | 09 Jan. 2020 | 20.9 | 75.44 | 1.3210-11 | ||||||
| IBIS | – | – | 1253 | 4.0 | |||||||
| : we report the detection significance only for simultaneous observations, while for the total sensitivity achieved when summing the X-ray data used in the time-averaged fits see text. | |||||||||||
| Note: IBIS spectra are time-averaged over the whole duration of the mission. | |||||||||||
| Note: in bold are highlighted the strictly simultaneous observations. | |||||||||||
| Note: 2-10 keV fluxes refer to NuSTAR FPMA data. | |||||||||||
3 Broad-band spectral analysis
| NH | EFe | EW | Eedge | Fe Abund. | Ecut | R | (d.o.f.) | ||
| 1022 cm-2 | keV | eV | keV | keV | |||||
| phabs*[po+zvfeabs*(po+zga)] | |||||||||
| NuSTAR | 57.78 | 1.73 | 6.350.05 | 482 | 7.110.10 | 1.70 | – | – | 340.09 (355) |
| phabs*[po+zvfeabs*(pexrav+zga)] | |||||||||
| NuSTAR | 62.36 | 2.04 | 6.350.05 | 467 | 7.10 | 1.35 | 37 | NC | 336.75 (353) |
| XRT+NuSTAR (sim) | 49.52 | 2.04 fixed | 6.35 | 419 | 7.17 | 1.51 | 145 | 0.86 | 351.98 (359) |
| NH | EFe | EW | Ecut | R | (d.o.f.) | |||
| 1022 cm-2 | keV | eV | keV | |||||
| phabs*[po+phabs*(po+zga)] | ||||||||
| NuSTAR | 85.26 | 1.45 | 1.67 | 6.020.11 | 491 | – | – | 101.30 (126) |
| phabs*[po+phabs*(pexrav+zga)] | ||||||||
| NuSTAR | 73.99 | 0.65 | 1.67 | 6.02 | 471 | 14 | NC | 99.09 (125) |
| XRT+NuSTAR (sim) | 53.18 | 0.83 | 1.61 | 6.02 | 390 | 68 | 0.67 | 110.72(132) |
| NH | EFe | EW | Ecut | R | c | (d.o.f.) | ||
| 1022 cm-2 | keV | eV | keV | |||||
| phabs*phabs*(po+zga) | ||||||||
| NuSTAR | 0.97 | 1.67 | 6.47 | 146 | – | – | – | 416.24 (446) |
| phabs*phabs*(pexrav+zga) | ||||||||
| NuSTAR | 2.12 | 1.81 | 6.470.09 | 126 | 60 | 1.05 | – | 404.48 (444) |
| XRT+NuSTAR (sim) | 0.58 | 1.80 | 6.48 | 127 | 119 | 1.05 | 1.14 | 423.17 (462) |
| AVERAGE (XRT+IBIS) | 0.43 | 1.50 | 6.4 fixed | 452 | 42 | 2 | 0.90 | 61.30 (60) |
The first step of our study consists in analysing the source spectra by fitting NuSTAR data (from both focal plane detectors) on their own. Several works in the literature (see for instance Akylas & Georgantopoulos 2021, Kang et al. 2020 and Kang & Wang 2022) use this approach, preferring NuSTAR data over broad-band data obtained from different telescopes and fitted together. NuSTAR is able to cover a quite wide energy range which, especially when dealing with faint sources, can be helpful for the determination of the main continuum shape and to highlight some spectral features.
Subsequent steps in our analysis consist in adding soft energy data from simultaneous XRT observations to the NuSTAR ones, widening the energy coverage with the intent of better determining the spectral features, above all those arising at softer energies, such as the soft excess and intrinsic absorption. Lastly, we consider time-averaged spectra obtained by combining all available Swift/XRT observations together with high energy data from INTEGRAL/IBIS with the aim of putting tighter constraints on the high energy cut-off and to compare the results of these fits with those obtained with simultaneous data.
The source spectra were generally binned using grppha in an appropriate way so that statistic could be applied. This is always the case for NGC 7465 data (both XRT and NuSTAR), while for the other two sources this is true for NuSTAR spectra but not for XRT single observations, which have very poor statistics, and data were binned with a lower count value. We have verified that the results obtained using XRT spectra binned with a minimum of 20 counts per bin do not change the values of the spectral parameters in the broad-band analysis, therefore, although the Cash statistics should be adopted in these cases, we nonetheless use the statistic in the combined XRT/NuSTAR fits of ESO 506-G27 and IGR J19039+3344.
Spectral analysis was conducted with XSPEC v.12.12.0 (Arnaud, 1996), employing the statistics; uncertainties are listed at the 90% confidence level (=2.71 for one parameter of interest) and abundances were all set to Solar with the exception of iron for ESO 506-G27 (see text for details).
3.1 NuSTAR data
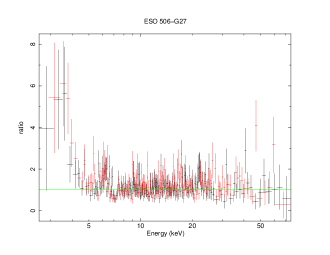
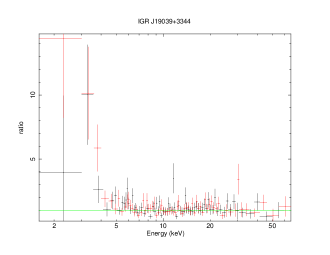
We initially fitted NuSTAR data employing a simple power law, absorbed by Galactic (Ben Bekhti et al., 2016) and intrinsic column densities. A Gaussian component to model the iron line, with its width fixed at 10 eV, was also added since residuals are evident around 6 keV in all sources. The iron line is required in the spectra of all three sources at more than 99% confidence level, as determined by employing the test on our fit results. From these simple fits, it is evident that both ESO 506-G27 and IGR J19039+3344 show residuals in the low energy part of their spectra (see Fig. 1 and Fig. 2), indicative of the presence of a soft excess, extending up to almost 5 keV. The presence of this component is further confirmed by the flattening of the continuum shape (1.5 for ESO 506-G27 and 1.2 for IGR J19039+3344) when the component is not taken into account.
We therefore fitted the spectra of ESO 506-G27 and IGR J19039+3344 adding a second power-law to our fits to approximately model this component, since NuSTAR data do not cover the energy range below 3 keV where most of the soft excess emission is found. The addition of a second, soft power-law component to model the soft excess yields an improvement of more than 99.99% for both sources, with ESO 506-G27 having a =30.47 for 2 degrees of freedom (d.o.f.) and IGR J19039+3344 having =20.74 (for 2 d.o.f.). The ESO 506-G27 data are well fitted by tying the two power-law photon indices (the one describing the soft excess and the one relative to the primary continuum), as was commonly done to take into account the scattering component in highly obscured AGN when dealing with low statistical quality data of highly (i.e. Malaguti et al. 1997). In the case of IGR J19039+3344, the best fit is obtained by leaving the two photon indices independent of one other; this gives a value of the soft power-law photon index which is unexpectedly harder than the continuum one. This could be due to the low statistics at softer energies of our data and as we already highlighted before, this is but an approximation of the soft excess component.
We point out that in the case of ESO 506-G27, inspection of the residuals suggests that more components are needed to model the iron line, in particular an absorption feature at around 7 keV seems to be present (see Fig. 1) likely an iron K edge given its energy. We therefore modified the model accordingly (see Table 2), by adding the zvfeabs component in XSPEC, which describes a redshifted photoelectric absorption, where all abundances are tied and set equal to Solar, except for iron. The model therefore gives as an output the absorbing column density NH as well as the Fe K edge energy. The introduction of this component yields an improvement of more than 99.99%, with a =21.17 (for 2 d.o.f.).
The baseline models used are phabs*[po+zvfeabs*(po+zga)] for ESO 506-G27, phabs*[po+phabs*(po+zga)] for IGR J19039+3344 and phabs*phabs*(po+zga) for NGC 7465.
Results of these preliminary fits are reported in the first rows of Tables 2, 3 and 4. As can be seen from the fits for ESO 506-G27 and IGR J19039+3344, after modifying the model to account for the soft excess component, we obtained photon indices which are closer to the canonical one.
Next, NuSTAR spectra have been fitted by substituting in the baseline models the simple absorbed power-law with an exponentially cut-off power-law reflected from neutral material (the pexrav model in XSPEC, Magdziarz & Zdziarski 1995) in order to investigate the high energy cut-off and the reflection component.
The use of the pexrav model yields an improvement in the fit of more than 99% only in the case of NGC 7465 (=11.76, for 2 d.o.f.), whereas for ESO 506-G27 and IGR J19039+3344 the introduction of the pexrav model does not yield any improvement. We point out that, despite the pexrav being a phenomenological model, when the statistics are not particularly good (as is our case), this is the best model to fit the high energy data; the use of complex, more physical models can lead to an over-fitting of the data, resulting in an incorrect estimate of the spectral parameters, as we will demonstrate in section 3.3.
In all three sources, the high energy cut-off is not constrained and we could at most find only lower limits on the parameter; it is worth noting that these lower limits are quite low with respect to what generally found in other studies (e.g. Malizia et al. 2016, Molina et al. 2019, Akylas & Georgantopoulos 2021). The reflection fraction is constrained only in NGC 7465 (see Table 4), while for the other two sources we could not place any constraint on the parameter.
3.2 Simultaneous broad-band spectral analysis
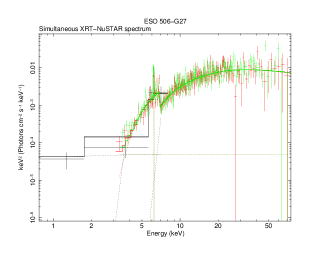
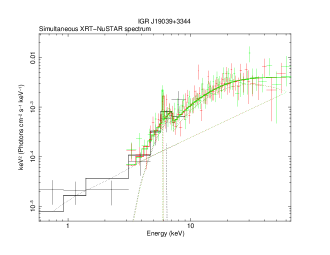
Next we took advantage of the available simultaneous Swift/XRT data covering the soft energy band and fitted the spectra over the wider 0.5-78 keV energy range. For each source, we employed the baseline models with the pexrav instead of the simple power-law and in all fits we added cross-calibration constants to account for mismatches in instrument calibration. However, in the case of ESO 506-G27 and IGR J19039+3344, the cross-calibration constants between XRT and NuSTAR had to be fixed to unity; this choice is mainly motivated by the fact that the Swift/XRT data of ESO 506-G27 and IGR J19039+3344 are of poor statistical quality (see the detection significance reported in Table 1) and their addition to the NuSTAR data does not allow a better determination of the main continuum parameters, leading to cross-calibration constants not consistent with 1. Indeed, when adding low quality data (XRT) to medium-to-good quality data (NuSTAR) the goodness of the fit can be diminished, and in such cases the only way to obtain acceptable fits is to fix the constants to one. In this way, for the simultaneous data of both sources, we obtain spectral parameters consistent with those measured with NuSTAR alone. Besides, this is a reasonable choice since the spectra are strictly simultaneous and therefore the cross-calibration constants are expected to be consistent with 1. This, however, does not hold for NGC 7465, which has better quality soft X-ray data than the other two sources; in this case, the cross-calibration constant (for simplicity we report only the one between XRT and the NuSTAR FPMA detector) is left as a free parameter and its value is consistent (within errors) with unity, as expected in the case of data taken simultaneously (see third row of Table 4). We point out that in the ESO 506-G27 fit, we had to fix the main continuum power law photon index to the one obtained by analysing NuSTAR data on their own in order for the fit to reach convergence. This again is an issue due to the low quality XRT data as well as to the source spectral complexity.
In general, for all sources the column densities obtained from the combined XRT/NuSTAR spectra are compatible with those obtained by fitting NuSTAR data on their own, suggesting that the addition of poor quality data to average-quality ones does not impact the fit results. Indeed, in the case of NGC 7465 the absorption is better constrained than in the single NuSTAR fits, and this is likely due to the fact that the XRT data of NGC 7465 are of better quality than those of the other two sources (see Table 1).
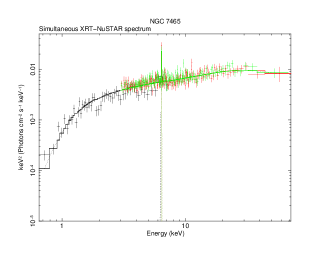
As can be seen from Tables 2, 3 and 4, errors on the high energy cut-off could be estimated for NGC 7465 and IGR J19039+3344, although in the latter case they are quite large and asymmetrical, implying that the parameter is not properly constrained. The reflection fraction is again constrained only in the case of NGC 7465, with the other two sources having only lower limits on the parameter. In Figures 3, 4 and 5 we show the unfolded spectra of the simultaneous XRT/NuSTAR data.
3.3 Testing the borus02 model
Here we tested our simultaneous XRT/NuSTAR data against a more recent and physically motivated model, i.e. the borus02 model (Baloković et al., 2018), which is not particularly more complex than pexrav in its simplest formulation but which accounts for a torus geometry, rather than the slab configuration assumed by the pexrav. This model includes self-consistent iron line fluorescent emission lines and assumes the X-ray source to be at the geometric centre of the AGN, emitting a spectrum that can be described as a phenomenological cutoff power-law, surrounded by cold and neutral gas. This model also calculates the torus intrinsic column density, its covering factor and opening angle, as well as the line-of-sight column density. We have used the borus02 model in its simplest formulation, due to the poor quality of our data; in XSPEC terminology, the model we employ is c1*phabs[atable(borus02_v170323a.fits)+ zphabs*cabs*cutoffpl+c2*cutoffpl+po],
where the simple power-law approximates the soft excess when needed. We also accounted for a scattered component represented in the model by the cutoff power-law multiplied by the constant c2 (i.e. the fraction of the scattered continuum), while c1 is the cross-calibration constant between instruments.
| Source | N | Ecut | LogN | cftor | cos | c | (d.o.f.) | ||
|---|---|---|---|---|---|---|---|---|---|
| 1022 cm-2 | keV | ||||||||
| ESO 506-G27 | 92.23 | 2.02 | NC | 22.75 | 0.60 | 0.33 | 0.62 fixed | 1 fixed | 352.16 (357) |
| IGR J19039+3344 | 163.26 | 1.93 | NC | NC | 0.70 | 0.42 | 0.83 fixed | 1 fixed | 117.19 (130) |
| NGC 7465 | 0.56 | 1.74 | 28 | 23.77 | 0.43 | 0.41 | – | 1.13 | 425.06 (460) |
As can be seen from Table 5, the values we obtained for the line-of-sight column density are compatible with the values found using our baseline model, although for ESO 506-G27 and for IGR J19039+3344 they tend to be a bit higher, but still compatible within errors. As far as the main continuum is concerned, the photon indices calculated through the borus02 model are steeper than those obtained with the pexrav model, although the associated errors are quite large and therefore we can assume them to be compatible. The high energy cut-off is not constrained in any of the sources and we also found that the scattered component is negligible in all sources, therefore we cannot make any guesses if reflection is present or not using this model (for simplicity, we do not report the values of in the table). However, the borus02 model is mainly devised to model the torus in highly absorbed AGN, but also the torus parameters in our fits do not give useful information on this structure, confirming our claim that modelling medium-to-low quality data with phenomenological models is the best approach.
3.4 Time-averaged spectra
The last step in our analysis consists in modelling the time-averaged spectra over an even broader energy range, covering the whole 0.5-110 keV band. To do so, we have employed spectra obtained by summing all the available XRT observations and fitted them together with INTEGRAL/IBIS spectra. In order to validate the use of time-averaged spectra, we first checked whether the three sources analysed here are effected by flux and/or spectral variability by analysing each soft X-ray spectrum available. Comparing the single XRT pointings listed in Table 1, we found ESO 506-G27 and NGC 7465 do not show evidence of changes in their spectral shape, but only in their flux over several observations spanning a time lapse of a few years. We are therefore confident in using the summed XRT spectra, thus also boosting the statistics of our data. The same reasoning however cannot be applied to IGR J19039+3344 (see discussion in section 4.2), in which there is evidence of dramatic changes not only in its flux, but also in its absorbing column density properties, and therefore spectral characteristics. For this reason, the source is excluded from this final step of the analysis.
The time-averaged spectrum of ESO 506-G27 was obtained by summing all available XRT observations (3 taken in 2005, and one each in 2018 and 2019, see Table 1), thus reaching an exposure of more than 24 ksec (with a detection significance of more than 19), and then combining it with the INTEGRAL/IBIS spectrum. Having a better soft X-ray spectrum, we were able to apply a more appropriate model to fit the soft energy data, employing the model const*phabs*zxipcf(pexrav+zga+zga) which will also be used to fit the XMM data (see section 4.1). The zxipcf model represents a partial covering absorption component due to partially ionized material, and its main parameters are the column density (in units of 1022 cm-2) and the ionisation of the absorbing medium. We point out that the addition of a second Gaussian line to model the Fe K is required at 95% confidence level according to the test, while no evidence of the Fe K edge seems to be present. A cross-calibration constant to account for both flux variations and instrumental mismatches has also been added and is found to be compatible with unity; results of the fit are reported in Table 6. Also in this case, we are not able to put constraints on the high energy cut-off, despite the wider energy range covered by the IBIS data. We found a lower limit on the high energy cut-off of 93 keV which is consistent with what generally found in the literature (Malizia et al., 2014; Molina et al., 2019). Unsurprisingly, no constraint at all is found on the reflection parameter, given the lack of spectral coverage between 10 and 25 keV. As far as the other spectral parameters are concerned, we found an agreement within their errors.
| const*phabs*zxipcf*(pexrav+zga+zga) | |
|---|---|
| NH | (41.42)1022cm-2 |
| Log | 0.99 |
| cf | 0.998 |
| 1.85 | |
| EFe (k) | 6.450.05 keV |
| EW | 694 eV |
| EFe (k) | 6.86 keV |
| EW | 329 eV |
| Ecut | 93 keV |
| R | NC |
| c | 0.68 |
| (d.o.f.) | 16.59 (21) |
In the case of NGC 7465, the XRT time-averaged spectrum was obtained by summing the three available observations (one taken in 2019 and two in 2020, achieving a detection significance of 37) and fit them together with the INTEGRAL/IBIS spectrum. We employed the baseline model adding again a cross-calibration constant to account for differences in fluxes and between instruments. Results are reported in the last row of Table 4; the iron line energy has been fixed to the canonical value of 6.4 keV in order for the fit to reach convergence. Only a marginal agreement has been found between the time-averaged fit and the simultaneous one. Again, in this fit the cross-calibration constant is consistent with being 1. The photon index is flatter than the one found in the simultaneous XRT/NuSTAR fit (both with pexrav and borus02) and only marginally consistent (within errors). The time-averaged spectrum provides a better constraint on the high energy cut-off, albeit its value is lower than the one obtained when using simultaneous data; on the other hand, the reflection fraction has only an upper limit on its value.
Overall, for sources which are quite faint and do not have good quality broad-band data, both at soft and hard X-ray energies, the use of time-averaged spectra does not improve the constraints on the fit parameters.
4 Results on individual sources
In the following, we discuss individual sources, highlighting the main scientific results and comparing them with the few pieces of information found in the literature.
4.1 ESO 506-G27
ESO 506-G27 was first identified as a high energy emitting source by Tueller et al. (2005), who also proposed that the object might be a heavily absorbed AGN with an NH estimated to be around 1023 cm-2, characterised by flux variability on timescales of months. Morelli et al. (2006) and Landi et al. (2007) afterwards proved the source to be indeed a Seyfert 2 galaxy. Analysing the 2005 XRT observations, Landi et al. (2007) confirmed that the source underwent a 20% flux change over timescales of months, but they could not properly determine the continuum spectral shape, due to the poor quality of the XRT data. Using flux ratio diagnostics, Landi et al. (2007) place the source on the threshold between Compton-Thin and Compton-Thick AGN (an AGN is classified as Compton-thick if its column density exceeds 1024cm-2); in fact, while the LX/L[OIII] indicates a Compton-Thick nature, the LX/LIR and LX/LHX implies that the source is Compton-Thin, making ESO 506-G27 a borderline object. Further evidence against a Compton-Thick nature for ESO 506-G27 comes from its variability and from the equivalent width of its iron line, which is below the expected value of 1 keV. Winter et al. (2008) analysed Swift/XRT and XMM-Newton data taken in 2005 and 2006 respectively in conjunction with a time-averaged Swift/BAT spectrum; they confirmed that ESO 506-G27 is indeed heavily absorbed, with an estimated column density of 71023cm-2 and found to be characterised by the presence of a soft excess. These authors also argued that the flat photon index and the relatively large iron line equivalent width could be indicative of a Compton-Thick object, although the column density is hardly high enough to classify the source as such. Besides, Winter et al. (2008) do not account for the possibility of the presence of an iron line complex, therefore resulting in a misleading measurement of the line equivalent width. Further confirmation of the presence of a strong soft excess component and of a high absorbing column density came from following studies conducted by employing Suzaku data (e.g. Winter et al. 2009 and Fukazawa et al. 2011). More recently also Ricci et al. (2017), using broad-band (again XMM and Swift/BAT) data, confirmed these findings and furthermore characterised the source by modelling its spectrum with an ionised absorber; they also place constraints on both the high energy cut-off (152 keV) and on the reflection fraction (R=0.11). However also these authors do not investigate the iron line complex.
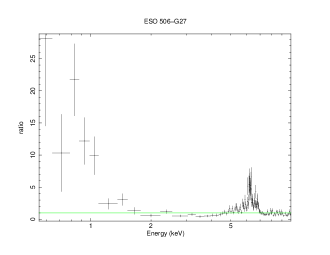
All these observational pieces of evidence are barely compatible with what we find in our analysis. We re-analysed the 2006 XMM-Newton observation of ESO 506-G27 which has not been studied in detail before, since it is the best available data set in the soft X-ray range. XMM-Newton observed the source on the 24th of January, 2006 for a net total exposure of 12 ksec; here we analysed EPIC-pn data only from this snapshot observation. EPIC-pn (Turner et al., 2001) data were reprocessed using the XMM-Newton Standard Analysis Software (SAS) version 20.0.0 and employing the latest available calibration files. Only patterns corresponding to single and double events (PATTERN4) were taken into account and the standard selection filter FLAG=0 was applied. The EPIC-pn nominal exposure was filtered for periods of high background, resulting in a cleaned exposure of 7 ksec. Source counts were extracted from a circular region of 32.5 arcsec radius centred on the source, while the background spectrum was extracted from two circular regions of 20 arcsec radius each in source-free areas. The ancillary response matrix (ARF) and the detector response matrix (RMF) were generated using the XMM-SAS tasks arfgen and rmfgen and spectral channels were rebinned in order to achieve a minimum of 20 counts per bin. When fitting the spectrum with a simple power-law, soft X-ray features clearly emerge, such as an intrinsic absorption component, a soft excess below 2 keV and the Fe line complex around 6 keV (see Fig. 6). We approximate the soft part of the spectrum using a partial covering absorption model in which a partially ionized material component is also included (i.e. zxipcf in XSPEC) and introduce the k and k iron lines. Our final best fit model is phabs*zxipcf*(po+zga+zga) (see also section 3.4), which fits the data quite well, with a of 96.49 for 99 d.o.f. (see Fig. 7). We found that the source is absorbed by a mildly ionised medium with a column density of (61.36)1022cm-2 and ionisation parameter Log=1.21, that covers almost completely the central nucleus (cf=0.997); we confirm flux variability, since the source had a 2-10 keV flux of 410-12 erg cm-2 s-1, twice the value measured by NuSTAR 13 years later. We point out that the column density we find with this model is consistent with what we find when fitting NuSTAR data on their own, but it is only marginally consistent with the values measured in the simultaneous XRT/NuSTAR dataset. The photon index is 1.50, compatible within errors with what found employing in the simultaneous XRT/NuSTAR data (see section 3.2). In the region of the iron line complex, both the Fe K and K lines are detected at more than 99% confidence level according to the test, with energies of 6.400.02 keV (EW=389 eV) and 6.86 keV (EW=112 eV) respectively. All line widths are narrow and fixed to 10 eV. Given that NuSTAR data hint at the presence of an Fe K edge, we tried to introduce this component to the XMM data as well, by adding an absorption edge (zedge in XSPEC) at around 7 keV. The addition of this component does not yield any improvement in the fit, since the resulting is unchanged with respect to the model that does not include the edge.
As a further test, we applied the same model used for NuSTAR data to the XMM spectrum, i.e. phabs*[po+zvfeabs*(po+zga+zga)]. We remind that in this model, the soft excess component is roughly approximated by a power-law, even though XMM data suggest that it is indeed more complex. We find a fit that is statistically equally acceptable ( of 101.75 for 99 d.o.f.); in this fit we find an iron abundance slightly lower than the one found for NuSTAR data, whereas the column density is compatible within errors. Since we cannot distinguish between these two scenarios, a simultaneous, high-quality XMM and NuSTAR observation would be ideal to solve this ambiguity.

Our analysis confirms that ESO 506-G27 is heavily absorbed and possibly characterised by the presence of a mildly ionised medium. The presence of Fe K edge detected in NuSTAR data cannot be neither rejected nor confirmed by employing XMM data, when applying the same model. We therefore need more data to verify the significance of this feature and investigate its true nature However we cannot exclude a change in the intrinsic properties of the source, a likely occurrence in the 13-year span between observations; this issue will unfortunately remain open until further and better observations of this source are performed. It is interesting to note that despite the use of the XMM spectrum in combination with Swift/BAT data, Ricci et al. (2017) do not characterise better the iron line region complex of this source; nevertheless our and their broad-band fist are compatible, within the respective uncertainties, although our analysis is unable to put strong constraints on both reflection and cut-off energy unlike Ricci et al. (2017). To overcome this limitation and confirm previous results, we also fit the XMM data together with INTEGRAL/IBIS data, keeping in mind the source flux variability, accounted for by the introduction of a cross-calibration constant.
When employing XMM and IBIS data together, much in a similar way as done by Ricci et al. (2017) with XMM and Swift/BAT data, we find a photon index of 1.58, but only a lower limit on the high energy cut-off at 65 keV and no constraint at all on the reflection; the cross-calibration constant is 0.65.
Ideally, it would have been reasonable to also fit XMM and NuSTAR data together, given that they represent the best set of data available. However, since we cannot exclude a change in the source physical properties between the 2006 XMM observation and the 2019 NuSTAR one, we do not attempt such a fit.
4.2 IGR J19039+3344
IGR J19039+3344 was first detected above 14 keV by Cusumano et al. (2010) (under the name 2PBC J1903.7+3349) and then listed again in the Swift/BAT 70-month catalogue (Baumgartner et al., 2013). The source was classified as a Seyfert 2 galaxy by Parisi et al. (2014) and subsequently listed in the 14-year INTEGRAL/IBIS survey catalogue by Krivonos et al. (2017).
IGR J19039+3344 is poorly studied in the X-rays, with only a non-simultaneous broad-band spectral analysis available in the literature, based on a Swift/XRT observation taken in 2009 combined with the average 70-month Swift/BAT spectrum (Ricci et al., 2017). This analysis found the source to be absorbed (log NH=22.87), with a primary power-law continuum with =1.8 whose cut-off energy could not be constrained (Ecut64 keV) and a possibly weak reflection component (R0.5); no soft excess component was detected. A part from the 2009 observation, Swift/XRT observed the source twice more in 2019 (the observation analysed in this work) and recently in 2022; no other soft X-ray observations are available in the archives.
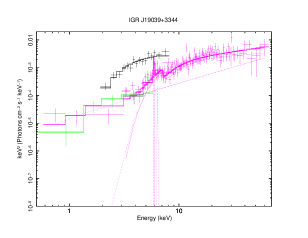
Our simultaneous broad-band spectral analysis of the 2019 observations provides marginally consistent results with Ricci et al. (2017) likely due to different source states as explained later; given the low statistical quality of the data, neither Ricci et al. (2017) nor our analysis could properly determine the primary continuum shape. However, we find evidence of the onset of strong soft excess component, a marginal agreement on the cut-off energy and a discrepancy on the reflection parameter. We find a column density a factor of 5 higher (LogNH = 23.7) than the one measured in the 2009 observation, while the source 2-10 keV flux is a factor of 6 dimmer. These changes are even more evident when comparing single Swift/XRT snapshots (see Fig. 8): the 2009 observation has a column density of (6.35)1022cm-2 and a 2-10 keV flux of 4.410-12erg cm-2 s-1 (in agreement with Ricci et al. 2017), the 2019 has NH=(33.3)1022cm-2 and a 2-10 keV flux of 810-13erg cm-2 s-1, while the 2022 observations has NH=(0.84)1022cm-2 with a 2-10 keV flux of 2.8710-13erg cm-2 s-1, indicating spectral and flux changes in the source at least at lower energies. All fluxes are observed ones and not corrected for absorption.
Given this variability behaviour, combining data not strictly simultaneous is always risky: although Ricci et al. (2017) data relied on a XRT spectrum of higher quality than ours due to the higher flux state of the source, they are combined to a Swift/BAT spectrum averaged over many years and possibly over different flux/spectral states; as such, their results must be taken with some caution. Our XRT/NuSTAR data, on the other hand, are simultaneous, but taken during a low flux/high column density state, which combined with the short exposures produced a lower quality spectrum especially at low energies. As a consequence, our data do not allow a proper characterisation of the source broad-band spectral parameters, although we note that the column density value is now more in line with the estimated iron line EW.
Surely the most interesting result on IGR J19039+3344 is its spectral/flux change observed over timescales of years. The observed change in obscuration candidates the source to be a new changing look AGN Ricci & Trakhtenbrot (2022).
Changes in the line of sight absorption in the X-rays are quite a rare phenomenon to observe (therefore difficult to probe) and are more likely to be found in samples of flux-variable AGN. The reason behind these changes is still a matter of debate, but the most widely accepted explanation for changing obscuration events is related to column density variability due to clouds moving in and out the line-of-sight. Indeed, in the most widely accepted scenario, the torus is not considered anymore as uniform structure, but is rather assumed to be cloudy and/or patchy; therefore variability in the column density can be explained in terms of different geometry/distribution of the clouds intercepted by the line-of-sight. However these type of changes are generally rapid, as the region involved is a small area around the nucleus. Given the large timescale of the variability observed in IGR J19039+3344, alternative scenarios are also possible, such as changes in the ionisation state of the gas, associated with an increase or decrease of the source luminosity, the presence of powerful outflows or even the switch off/on of nuclear activity. In our case, we observed flux variability as well as absorption changes, more specifically the higher X-ray luminosity seen in 2009 could have lead to an enhancement in the ionisation state of the obscuring material, making it more transparent to X-ray radiation and therefore less obscured. The source in 2019 then returned to a lower ionisation/higher absorption state. However this hypothesis of changes in the ionisation properties does not explain the variation seen from the 2019 to the 2022 observations, when the flux was low as was the column density, although in this case the low statistical quality of the XRT data could have played a role. Clearly IGR J19039+3344 deserves a long term monitoring at X-ray energies to confirm its changing look nature and provide more insight into the true origin of its changing obscuration properties.
4.3 NGC 7465
NGC 7465 is a LINER known to be a high energy emitter (see e.g. Malaguti et al. 1994) and was listed in several INTEGRAL/IBIS and Swift/BAT catalogues. In the X-rays the source has been studied by Guainazzi et al. (2005), who used Chandra data and found the source to be characterised by a flat photon index of 0.7. These authors model the source with two layers of neutral material partially covering the central source, with NH 51023 cm-2 (covering 15% of the central source) and 21022 cm-2 (covering 85% of the central source), but opted to fix the photon index to 2. These results are not fully compatible with what found in our analysis, but this could be due to the fact that Guainazzi et al. (2005) made use only of narrow band data, while we took advantage of a broad-band spectrum. More recently, the source has been re-analysed by Ricci et al. (2017), employing Chandra and Swift/BAT data; they found the column density to be 31021 cm-2, a quite flat photon index (1.2) and a cut-off energy at 53 keV. In our simultaneous broad-band analysis, we found an intrinsic column density comparable with the one reported by Ricci et al. (2017) but a canonical value of the photon index (=1.80), exponentially declining at around 100-200 keV, plus a reflection component and associated iron line. The lower cut-off energy measured by both Chandra/BAT but also in our XRT/IBIS joint fit is likely due to the flat spectral index; given the typical AGN behaviour of the source we are more inclined to believe that the true spectral shape is that measured by the simultaneous broad-band XRT/NuSTAR dataset. According to Ricci et al. (2018), a high energy cutoff much above 50 keV is also expected given the source low Eddington ratio (Log= -2.28, Koss et al. 2022).
Interestingly the X-ray absorption that we measure is below that estimated on the basis of ALMA data; this is typical of type 1 unabsorbed AGN and expected if the X-ray absorption is dominated by a dust-free gas disk component at sub-pc scales. All these pieces of evidence suggest that NGC 7465 is a type 1 LINER, as proposed by Ramos Almeida et al. (2009).
5 Discussion and Conclusion
In this paper we analysed for the first time broad-band X-ray data of three faint hard X-ray selected AGN. These three sources (ESO 506-G27, IGR J19039+3344 and NGC 7465) have been used as a case study to test the best way to analyse X-ray broad-band, low quality data, in order to determine their spectral characteristics. The combination of the sources being faint and their low statistical quality data make their analysis challenging and does not allow to reach conclusive results on their intrinsic properties. This is an important issue since a large majority of hard X-ray selected AGN have a comparable brightness and have only low quality X-ray data available in the archives. Most of them (mainly sources listed in Swift-BAT catalogues and also detected by INTEGRAL/IBIS) have indeed been simultaneously observed by Swift-XRT and NuSTAR with short pointings and detected at a low significance level.
In the following we summarise and discuss the key findings of our study,
both from a methodological and scientific point of view.
Methodological results.
-
-
Firstly, we have shown that in case of average luminosity AGN with poor quality X-ray spectra, NuSTAR data on their own are sufficient and useful to estimate the underlying continuum emission.
-
-
Adding to NuSTAR spectra, data covering the soft X-ray band is preferable, since they provide a better understanding of the physical processes at work. In particular, simultaneous data are ideal to avoid variability issues, especially in spectral shape.
-
-
In the case of faint sources, such as in the case of ESO 506-G27 and IGR J19039+3344 (see section 3.2), adding low quality Swift/XRT data to average quality NuSTAR data does not however provide better results; moreover the cross-calibration constants had to be fixed to unity, in order to achieve convergence in the fit.
-
-
Time-averaged spectra, obtained by summing single snapshot observations or resulting from long exposures taken by hard X-ray observatories (i.e. Swift/BAT and /or INTEGRAL/IBIS), are also a useful tool if one wants to have data spanning over an even wider energy range. This is essential if features characterising AGN spectra from the soft (absorption) to the hard X-ray domain (high energy cut-off) are to be investigated and they might also offer a more general picture of the sources nature.
-
-
However, we have shown in the present work that when the sources are quite faint, even time-averaged spectra are not sufficient to constrain the high energy cut-off.
-
-
As far as spectral modelling is concerned, when the statistics are low, the use of complex models does not necessarily imply a better description of the data. Indeed, only in the case of NGC 7465, which is the source with the best available data, the use of a more complex model, albeit phenomenological (i.e. pexrav), improves the fit. We also point out that when dealing with low-statistics spectra, the use of complex models can lead to an "over modelling" of the data, providing misleading results.
-
-
As a further test, we have demonstrated that fitting our data the more recent and physically-motivated models such as the borus02 does not allow a better determination of the main spectral parameter. Indeed, important parameters such as the high energy cut-off is not constrained in any of the sources as well as the scattered component which is negligible and not even lower limits could be found. Also the torus parameters are not well constrained in all three sources, but the line-of-sight column density is consistent with what found using our baseline model.
Scientific results
-
-
ESO 506-G27. Our analysis confirms that this is a heavily absorbed AGN, although not Compton-Thick in nature, characterised by a strong soft excess sufficiently well-described by a mildly ionised medium surrounding the central source. This result was obtained thanks archival XMM-data, which however are not fully consistent with more recent XRT/NuSTAR results. We report for the first time, the presence of the Fe k line which is detected both in the XMM observation and in the XRT time-averaged spectrum; the feature is not detected in the NuSTAR data, likely because of the inability of the detectors to separate the K and K components. On the other hand, NuSTAR data show an absorption feature at 7 keV possibly due to the iron K edge. This feature deserves a more in-depth study given the fact that it is not detected in the XMM data, suggesting spectral variability. Despite using broad-band XMM/IBIS data covering the 0.5-110 keV range, we were not able to constrain the high energy cut-off and the reflection fraction, in contrast with previous works (e.g. Ricci et al. 2017).
-
-
IGR J19039+3344. This is a very peculiar source, as shown by our analysis that highlights a dramatic change in its absorption properties over a 10-year span, a phenomenon which is quite rare to observe. The source went from being mildly absorbed in 2009 to be heavily absorbed in 2019, as found in our simultaneous Swift-XRT/NuSTAR fit, and then to unabsorbed (NH1022cm-2) in 2022. Changes in observed fluxes have been reported in the analysed observations. Moreover, we find evidence of a further change in its spectral characteristics, with the onset of a strong soft excess component in the 2019 observation. Our simultaneous broad-band spectral analysis is marginally consistent with the results in Ricci et al. (2017), particularly regarding the high energy cut-off, whereas there is a discrepancy in the values of the reflection fraction. Neither Ricci et al. (2017) nor our analysis could properly determine the primary continuum shape, since we are dealing with data of very low statistical quality.
-
-
NGC 7465. Our analysis confirms that this source is a type 1 LINER, as proposed in previous studies, given its low absorbing column density of the order of 0.61022 cm-2, contrary to a previous study by Guainazzi et al. (2005) where the NH was found to be greater than 1023 cm-2. Our simultaneous broad-band spectral analysis found the source to have a photon index around 1.8, with a cut-off energy located above 100 keV and a mild reflection component around 1. These results are only partly in agreement with Ricci et al. (2017); in particular, these authors found a much flatter photon index that might be the cause of the low value of the high energy cut-off (around 50 keV). However, given that the source has a low Eddington ratio and therefore the high energy cut- off is expected to be at energies way above 50 keV (as is the case for our simultaneous fit), we are inclined to believe that the true shape of the emission continuum of NGC 7465 is the one given by the XRT/NuSTAR simultaneous fit.
We have shown in our analysis, that having simultaneous data is not sufficient to have a clear and complete picture of AGN, if these are faint and if the available data are of poor quality. Indeed, we have demonstrated that when dealing with spectra with low statistics, not only complex, more physically motivated models cannot be safely used, but also that phenomenological models cannot properly constrain the spectral parameters. We also point out that, depending on which dataset is used (either simultaneous or time-averaged), results can be very different, not only with what is found in the literature, but also with each other; in this way, one cannot be sure of the robustness of the spectral results obtained. In conclusion to properly characterise the spectra of faint AGN, deeper and better data are absolutely essential, and this can only be achieved through dedicated observational campaigns.
Acknowledgements
The authors acknowledge financial support from ASI under contract n. 2019-35-HH.0. This research has made use of data and/or software provided by the High Energy Astrophysics Science Archive Research Center (HEASARC), which is a service of the Astrophysics Science Division at NASA/GSFC. The authors wish to thank the anonymous referee for useful comments that helped improve the paper.
Data Availability
The data underlying this work are available in the article. Data not specifically appearing in the article like some X-ray images and hard X-ray spectra will be shared on reasonable request by the corresponding author.
References
- Akylas & Georgantopoulos (2021) Akylas A., Georgantopoulos I., 2021, A&A, 655, A60
- Arnaud (1996) Arnaud K. A., 1996, in G. H. Jacoby & J. Barnes ed., Astronomical Society of the Pacific Conference Series Vol. 101, Astronomical Data Analysis Software and Systems V. p. 17
- Baloković et al. (2018) Baloković M., et al., 2018, ApJ, 854, 42
- Baumgartner et al. (2013) Baumgartner W. H., Tueller J., Markwardt C. B., Skinner G. K., Barthelmy S., Mushotzky R. F., Evans P. A., Gehrels N., 2013, ApJS, 207, 19
- Ben Bekhti et al. (2016) Ben Bekhti N., et al., 2016, A&A, 594, A116
- Cusumano et al. (2010) Cusumano G., et al., 2010, A&A, 510, A48
- Fedorova & Zhdanov (2016) Fedorova E. V., Zhdanov V. I., 2016, Kinematics and Physics of Celestial Bodies, 32, 172
- Ferruit et al. (2000) Ferruit P., Wilson A. S., Mulchaey J., 2000, ApJS, 128, 139
- Fukazawa et al. (2011) Fukazawa Y., et al., 2011, ApJ, 727, 19
- Guainazzi et al. (2005) Guainazzi M., Matt G., Perola G. C., 2005, A&A, 444, 119
- Harrison et al. (2013) Harrison F. A., et al., 2013, ApJ, 770, 103
- Kang & Wang (2022) Kang J.-L., Wang J.-X., 2022, ApJ, 929, 141
- Kang et al. (2020) Kang J., Wang J., Kang W., 2020, ApJ, 901, 111
- Koss et al. (2022) Koss M. J., et al., 2022, ApJS, 261, 1
- Krivonos et al. (2017) Krivonos R. A., Tsygankov S. S., Mereminskiy I. A., Lutovinov A. A., Sazonov S. Y., Sunyaev R. A., 2017, MNRAS, 470, 512
- Landi et al. (2007) Landi R., de Rosa A., Dean A. J., Bassani L., Ubertini P., Bird A. J., 2007, MNRAS, 380, 926
- Landi et al. (2010) Landi R., Bassani L., Malizia A., Stephen J. B., Bazzano A., Fiocchi M., Bird A. J., 2010, MNRAS, 403, 945
- Lubiński et al. (2010) Lubiński P., Zdziarski A. A., Walter R., Paltani S., Beckmann V., Soldi S., Ferrigno C., Courvoisier T. J. L., 2010, MNRAS, 408, 1851
- Magdziarz & Zdziarski (1995) Magdziarz P., Zdziarski A. A., 1995, Monthly Notices of the Royal Astronomical Society, 273, 837
- Malaguti et al. (1994) Malaguti G., Bassani L., Caroli E., 1994, ApJS, 94, 517
- Malaguti et al. (1997) Malaguti G., Bassani L., Di Cocco G., Palumbo G., 1997, Nuovo Cimento C Geophysics Space Physics C, 20C, 739
- Malizia et al. (2012) Malizia A., Bassani L., Bazzano A., Bird A. J., Masetti N., Panessa F., Stephen J. B., Ubertini P., 2012, MNRAS, 426, 1750
- Malizia et al. (2014) Malizia A., Molina M., Bassani L., Stephen J. B., Bazzano A., Ubertini P., Bird A. J., 2014, ApJ, 782, L25
- Malizia et al. (2016) Malizia A., Landi R., Molina M., Bassani L., Bazzano A., Bird A. J., Ubertini P., 2016, Monthly Notices of the Royal Astronomical Society, 460, 19
- Malizia et al. (2020) Malizia A., Sazonov S., Bassani L., Pian E., Beckmann V., Molina M., Mereminskiy I., Belanger G., 2020, New Astron. Rev., 90, 101545
- Malizia et al. (2023) Malizia A., et al., 2023, A&A, 671, A152
- Molina et al. (2019) Molina M., Malizia A., Bassani L., Ursini F., Bazzano A., Ubertini P., 2019, MNRAS, 484, 2735
- Morelli et al. (2006) Morelli L., Masetti N., Bassani L., Landi R., Malizia A., Bird A. J., Ubertini P., Galaz G., 2006, The Astronomer’s Telegram, 785, 1
- Oh et al. (2018) Oh K., et al., 2018, ApJS, 235, 4
- Parisi et al. (2014) Parisi P., et al., 2014, A&A, 561, A67
- Ramos Almeida et al. (2009) Ramos Almeida C., et al., 2009, ApJ, 702, 1127
- Ricci & Trakhtenbrot (2022) Ricci C., Trakhtenbrot B., 2022, arXiv e-prints, p. arXiv:2211.05132
- Ricci et al. (2017) Ricci C., et al., 2017, The Astrophysical Journal Supplement Series, 233, 17
- Ricci et al. (2018) Ricci C., et al., 2018, Monthly Notices of the Royal Astronomical Society, 480, 1819
- Tueller et al. (2005) Tueller J., et al., 2005, The Astronomer’s Telegram, 669, 1
- Turner et al. (2001) Turner M. J. L., et al., 2001, A&A, 365, L110
- Winter et al. (2008) Winter L. M., Mushotzky R. F., Tueller J., Markwardt C., 2008, ApJ, 674, 686
- Winter et al. (2009) Winter L. M., Mushotzky R. F., Reynolds C. S., Tueller J., 2009, ApJ, 690, 1322