Elucidating the Role of Filament Turnover in Cortical Flow
using Simulations and Representation Learning
Abstract
Cell polarization relies on long-range cortical flows, which are driven by active stresses and resisted by the cytoskeletal network. While the general mechanisms that contribute to cortical flows are known, a quantitative understanding of the factors that tune flow speeds has remained lacking. Here, we combine physical simulation, representation learning, and theory to elucidate the role of actin turnover in cortical flows. We show how turnover tunes the actin density and filament curvature and use representation learning to demonstrate that these quantities are sufficient to predict cortical flow speeds. We extend a recent theory for contractility to account for filament curvature in addition to the nonuniform distribution of crosslinkers along actin filaments due to turnover. We obtain formulas that can be used to fit data from simulations and microscopy experiments. Our work provides insights into the mechanisms of contractility that contribute to cortical flows and how they can be controlled quantitatively.
I Introduction
The cortex is a protein network that is associated with the inner face of the plasma membrane of most animal cells [1, 2, 3]. Within the cortex, assemblies of non-muscle myosin II motors generate tension by pulling on actin filaments. This tension determines cell shape and cell-cell interactions, and its gradients can give rise to long-range flows that transport proteins for cell polarization [4, 5], migration [6], and division [7]. These dynamics are regulated by the network architecture [8, 9, 10, 11] and actin filament assembly and disassembly (turnover) [12, 13, 14, 15, 11, 16].
From an active fluids perspective, the emergence of long-range cortical flow can be attributed to the buildup of localized active stress, which works against the viscous resistance of the network [11]. Experiments that reconstitute actin networks in vitro [15] and simulations [13] showed that actin turnover tunes the viscosity by fluidizing the network. The contractility underlying the active stresses also depends on actin turnover, as well as actin density [14, 11, 16]. At the same time, it remains unclear whether actin filament buckling, which has been identified as a mechanism of contractility in mixtures of preformed filaments [17, 18, 19, 9, 20, 10], is a major source of contractility in the presence of actin turnover. While we thus have a qualitative understanding of how network structure and dynamics affect cortical tension and, in turn, flow, a quantitative understanding remains lacking.
One major challenge in interpreting both simulations and experiments of cytoskeletal systems is identifying collective variables that capture the physics. Machine learning in principle holds promise for identifying such variables, and more generally for discovering physical models [21]. Recently, deep neural networks have been used to infer and predict the biophysical dynamics of actomyosin networks [22, 23, 24, 25, 26, 27]. Machine learning can be an ideal tool to assist in discovering and quantitatively characterizing mechanisms of contractility in different contexts. Nevertheless, connecting the information decoded by machine learning from simulations and experiments to physical theories remains challenging.
In this study, we use simulations, representation learning, and theory to investigate the factors that tune long-range cortical flow during anterior-posterior polarity establishment in the early C. elegans embryo [4]. We perform simulations that reproduce experimentally observed trends in cortical flow speed as actin turnover rates vary. Analyzing the simulations with representation learning and dimensional reduction techniques, we identify a latent representation of the contractile flow. We show how this latent representation is consistent with a microscopic model of contractility and motivates its extension. Our work thus provides insights into mechanisms of contractility underlying cortical flow and, more generally, shows how machine learning can be used to guide the development of physical models.
II Simulations reproduce trends in cortical flow speeds as actin turnover rates vary
We focus on exploring how the activity from filament turnover couples to a myosin gradient to control force generation for long-range flow. Previous experimental work revealed how specific actin-binding proteins, such as formin, cofilin, plastin, and profilin shape cortical flows [28, 29, 3]. In particular, profilin blocks the assembly of actin filaments at their pointed ends [30] and promotes elongation at their barbed ends [31]. Recently, some of us investigated how the level of profilin tunes the magnitude of the anterior directed flow through the control of actin treadmilling in C. elegans embryos [32]. These experiments showed that cortical flow speed depends nonmonotonically on profilin expression levels [32].
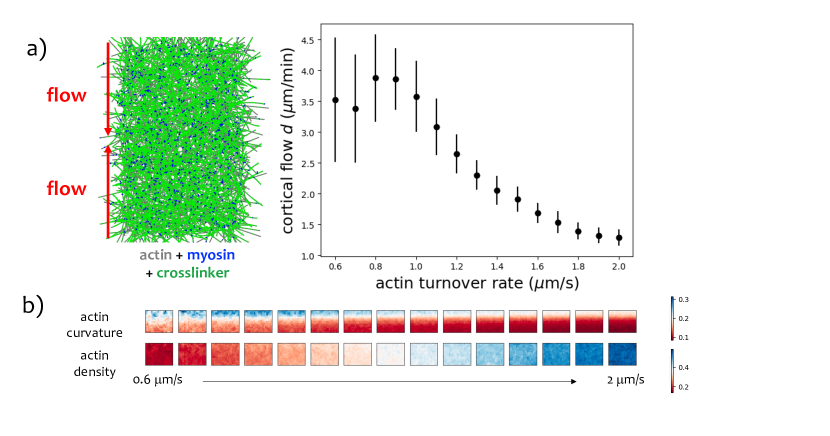
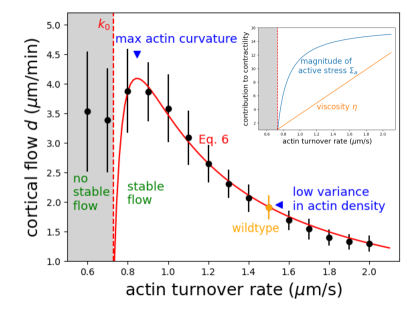
The methods that we employ below can be applied directly to experimental data. However, because the experimental data are limited and their interpretation is subject to assumptions, here we analyze data from agent-based simulations that are parameterized to reproduce the experimental trends quantitatively [32]. The simulations are in two dimensions and include actin filaments, myosin motors, and actin crosslinking proteins [33]. We model filament turnover by allowing filaments to shrink and grow with defined rates [32]. Each nucleated filament grows at a fixed actin assembly rate for an average of 8.5 s before terminating growth, and then the actin filament shrinks from the pointed end with a disassembly rate equal to the assembly rate. Using this protocol, higher assembly/disassembly rates generate longer actin filaments, mimicking the effects of various levels of profilin in experiments. Previously, we found that setting the filament nucleation rate to 121 s-1 and the actin assembly/disassembly rate to 1.5 m/s reproduces the actin densities and average filament lifetimes of wild-type embryos [34, 32]. Given these rates, we tuned the number of crosslinkers to reproduce the inferred bundle size distribution and construct a gradient in myosin to drive cortical flow at experimentally measured speeds for wild-type embryos [32]. We then performed simulations for a range of actin assembly/disassembly rates and obtained flow speeds (Fig. 1a) that are in reasonable quantitative agreement with measured values in embryos in which profilin expression is reduced [32].
III A latent representation reveals the physics of cortical flow
Our goal is to develop a predictive physical model of cortical flow in terms of measurable quantities. As noted above, cortical flows are thought to arise from a balance of active stress and network viscosity, both of which depend on actin density [11, 14, 16]. An additional quantity that can be obtained from video microscopy is filament curvature, a proxy for filament buckling, a mechanism of contractility [19, 10, 18, 9, 20]. To determine if the measurable density and curvature are sufficient to predict cortical flow without presupposing a model, we use these quantities as inputs to a machine learning procedure.
We grid the simulation region into 1 m 1 m boxes and compute the average actin density and filament curvature in each box (Fig. 2 and S1 Methods A). As the assembly/disassembly rate increases, in general, the actin density increases and the curvature decreases (Fig. 1b). The latter trend is a result of an increase in the average filament length, which tends to decrease the average number of motors and crosslinkers per unit length for fixed total numbers of motors and crosslinkers.
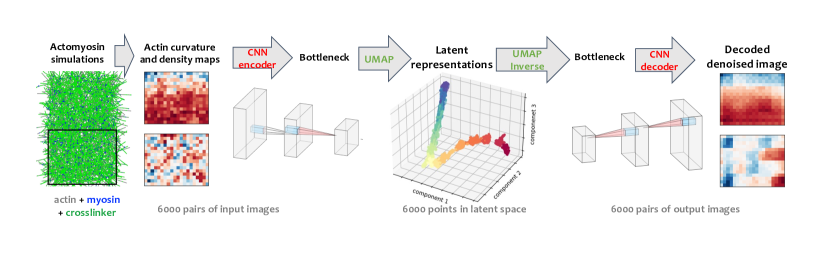
Motivated by recent work [24, 26], we use a convolutional neural network (CNN) to analyze these data. Specifically, we apply the CNN as an autoencoder to extract features and denoise the data. The network architecture and training procedure are described in SI Section S1B. In this approach, we train the network to reconstruct each 640-dimensional input (a stack of two images of filament curvature and density, with each image comprising 16 20 pixels) after passing it through a 40-dimensional bottleneck that defines a latent representation; to visualize this still many-dimensional latent representation, we use Uniform Manifold Approximation and Projection (UMAP) [35] to further compress the information to three dimensions (3D). UMAP should preserve the global topological structure of the input [35]. The procedure is summarized in Fig. 2.
We plot processed simulation data for each assembly/disassembly rate in a different color in Fig. 3. The color clustering suggests that the procedure captures features that vary systematically with the assembly/disassembly rates in actin turnover. Similar clusters are seen when training with only one of the two features (SI Section S2C), consistent with the fact that both features vary with the assembly/disassembly rate of actin turnover. However, the same global topological structure in the latent space is not obtained (SI Section S2C), demonstrating that both actin density and curvature are needed to model flow. Therefore, we focus on interpreting the latent space from training using both actin density and curvature. We find the average of each cluster in the latent space and construct the corresponding representative denoised actin density and curvature maps for further visualization and computation by training a fully connected neural network to invert the UMAP projection (SI Method S1B) (Fig. 3). Images decoded from the latent space (Figure 3B) more clearly reveal trends than simply averaging the input data from each condition (compare Fig. 4 with Fig. S2).
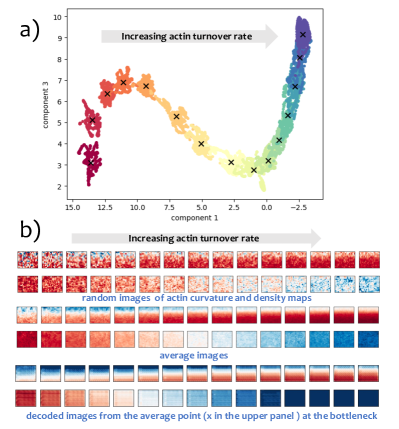
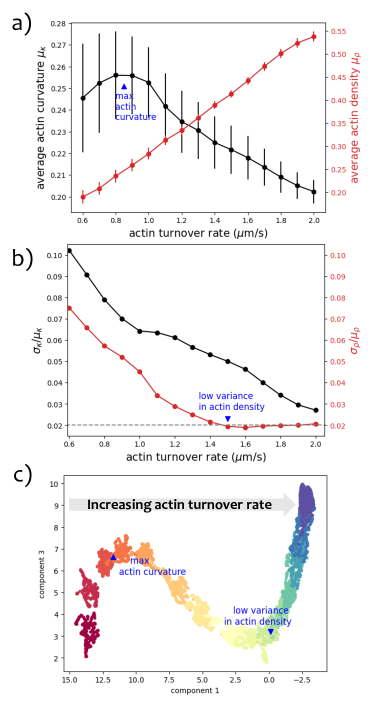
A striking feature of the curve connecting the cluster averages in Fig. 3 is that it has two extrema, near elongation rates 0.85 and 1.5 m/s. To relate these features to physical quantities, we analyze the denoised images. These show that the first extremum is at the actin turnover rate where the filament curvature is maximized (Fig. 4a). The second extremum corresponds to a fast assembly/disassembly rate in actin turnover that produces a high actin density and minimizes the relative variance in actin density. The fact that these assembly/disassembly rates are close to the value that reproduces the density and cortical flow speed of wild-type embryos [34] suggests that there may be selection pressure to maintain network homogeneity. Our interpretation of the extrema aligns with the results of training with each feature by itself: only the first extremum is obtained in the latent representation from training with filament curvature, while only the second extremum is obtained in the latent representation from training with actin density (SI Fig. S3).
Besides the two extrema, one other feature that stands out in the latent representation is that the two clusters at the lowest assembly/disassembly rates are separate from the others. These assembly/disassembly rates produce high variances of actin density and unstable cortical flows (SI S2B), in agreement with experimental observations [32]. The features identified by the machine-learning workflow guide the construction of a physical model of cortical flow, as we now describe.
IV An active fluid model provides insights into the effects of actin turnover on cortical flow
We now show that the features that we demonstrated to be important for predicting flow immediately above, actin density and curvature, are consistent with a minimal physical model for contractility. Following previous work [14, 11, 16], we define the active stress tensor and the viscous stress tensor , where is the velocity field and is the identity tensor. Balancing these stresses and using the divergence of the velocity field as a measure of contractility, we obtain
| (1) |
To understand how actin turnover modulates contractility, we need to relate the magnitudes of the active stress and the viscosity to filament curvature and density. We do so by building on a recent model that accounts for the microscopic dynamics of filaments connected by motors and crosslinkers [36, 16] (SI Section S2E). In addition to the theory in previous work [36, 16],we consider filament curvature and take into account the orientation of filament segments. This gives rise to an additional term in the expression for the active stress.
We now summarize the theory. First, we show that
| (2) |
where denotes the actin density, is the friction force coefficient for crosslinkers (X) and motors (M), is the average concentration of crosslinkers/motors bound to each actin filament. As represents the total concentration of bound crosslinkers/motors in the system, Eq. 2 physically derives from the fact that actin filaments (proportional to ) work against the friction from the crosslinkers and motors that connect them to surrounding filaments ().
Then, we show that the active stress can be decomposed into a component that depends on buckling (i.e., curvature), , and another that depends on actin turnover, :
| (3) |
with
| (4) |
where is a scalar that increases with curvature, and is the magnitude of motor head velocity. Our previous work demonstrates that actin filament assembly rate can tune the composition of crosslinkers bound to actin [37, 38]. Similarly, here, the simulations indicate that actin turnover modulates the distribution of crosslinkers/motors on actin filaments (SI Section S2F): assembly at the barbed end and disassembly at the pointed end biases crosslinkers toward the pointed end (i.e., older segments). is the deviation of the concentration from uniformly distributed, where its sign reports whether the accumulation of crosslinkers is at the barbed or the pointed end. is negative in our system due to the accumulation of crosslinkers toward the pointed ends, and contributes positively to the active stress.
As explained in the SI, the configurations contributing to the stress can also contribute to buckling. Consider for example, two filaments in an antiparallel configuration. The theoretical analysis outlined here (and detailed in the SI) shows that the translational velocity of an actin filament is proportional to the motor head velocity and is directed towards its pointed end. The translational velocity of actin filaments hence drives the sliding of two filaments passing each other. The accumulation of crosslinkers at the pointed end can serve to hinder sliding, leading to buckling.
Substituting these results into Eq. 1, the contractility can be written as
| (5) |
Since the overall concentration of myosin motors is a constant in our simulations, the concentration of myosin motors along filaments (i.e., per unit length) is inversely proportional to the density of filaments . Inspired by the latent representation in Fig. 4c, we include a threshold to account for the limit below which the network loses connectivity and express . We showed in Fig. 4a that the actin density is essentially proportional to the assembly/disassembly speed in actin turnover, . Inserting these expressions into Eq. 5, we can write the flow rate in Eq. 1 as
| (6) |
, and are independent fitting parameters. Our simulations, together with the latent representation, show that assembly/disassembly rates below 0.8 m/s in actin turnover induce irregular flow (Fig. S4). Since the theoretical framework in Eq. 6 accounts for forces exerted by motors on a fully connected network, we fit it to the steady flows for assembly/disassembly rates above the 0.8 m/s threshold. In this range of assembly/disassembly rates, the model describes the dependence of flow on the actin turnover perfectly (Fig. 5). The fitting indicates that the contribution to contractility from active stress initially increases and then plateaus at high assembly/disassembly rates in actin turnover (inset of Fig. 5). In contrast, viscosity contribution exhibits a linear increase. The interplay between these two contributions gives rise to the non-monotonic trend.
The maximum contractility
| (7) |
occurs at an assembly/disassembly rate of
| (8) |
We thus see that the maximum flow rate is controlled by a difference between , which reflects the curvature, and , which reflects the non-uniform distribution of crosslinkers along the filaments and also enhances the buckling of actins when (see discussion above). In the theory, can vary in the range [–1/, 1/], where is the length of the actin filament, with the sign depending on whether the crosslinkers are in excess at the pointed or barbed ends. In our simulations, the maximized length that actin filaments can reach before disassembly falls within the range of 5 to 17 (SI Section S2F). In contrast to this, actin buckling always contributes positively, with values within the range of [0, 3/], where is a filament segment length over which actin curvature is induced and we set 0.2 m in simulations. We estimate from our simulation that (SI Section S2E). This suggests that both terms are of similar magnitude and to engineer a higher flow rate, one can enhance the degree of actin buckling and/or promote the accumulation of crosslinkers at the pointed end (for ).
V Conclusions
A competition between active stresses and internal resistance to deformations controls long-range cortical flows that polarize animal cells. In this work, we combined physical simulation, representation learning, and theory to understand how contributing microscopic mechanisms tune flow speeds quantitatively. The inputs to the representation learning are spatially resolved maps of the actin density and filament curvature at different assembly/disassembly rates; the representation learning demonstrates that these data are sufficient to predict flow speed and identifies key values of the assembly/disassembly rate that we associate with maximum average curvature and minimum density variance. The former corresponds to the fastest cortical flow. Our machine-learning approach infers that the contractility has a parametric form that depends on the actin density and buckling which are both modulated by actin turnover.
The representation learning guides the extension of a minimal physical model for contractility. The model relates active and viscous stresses to molecular concentrations by explicitly integrating the forces for elemental geometries. Our model and simulations confirm that actin buckling is a dominant mechanism for generating active stress in highly interconnected actomyosin networks with low filament rigidity. Although the relationship between cortical flow and microscopic parameters of the cortex is inherently complex, our findings demonstrate that the coupling between actin density, actin buckling, motor activity, and the non-uniform distribution of crosslinkers along actin filaments recapitulates the effect of actin filament turnover on the rate of cortical flow. The methods developed in this work can be generalized and combined with either experimental imaging or computer simulations to investigate the physics of dynamic contractile networks.
Acknowledgements.
This work was supported by the National Science Foundation through awards MCB-2201235 and PHY-2317138 (the Center for Living Systems at the University of Chicago). S.V. and Y.Q. were supported by the National Institute of General Medical Sciences of the NIH under Award No. R35GM147400.References
- [1] D Bray and JG White. Cortical flow in animal cells. Science, 239(4842):883–888, 1988.
- [2] Priyamvada Chugh and Ewa K Paluch. The actin cortex at a glance. Journal of Cell Science, 131(14):jcs186254, 2018.
- [3] Manasi Kelkar, Pierre Bohec, and Guillaume Charras. Mechanics of the cellular actin cortex: From signalling to shape change. Current opinion in cell biology, 66:69–78, 2020.
- [4] Edwin Munro, Jeremy Nance, and James R Priess. Cortical flows powered by asymmetrical contraction transport PAR proteins to establish and maintain anterior-posterior polarity in the early C. elegans embryo. Developmental Cell, 7(3):413–424, 2004.
- [5] Charles F Lang and Edwin Munro. The PAR proteins: from molecular circuits to dynamic self-stabilizing cell polarity. Development, 144(19):3405–3416, 2017.
- [6] Amayra Hernández-Vega, María Marsal, Philippe-Alexandre Pouille, Sebastien Tosi, Julien Colombelli, Tomás Luque, Daniel Navajas, Ignacio Pagonabarraga, and Enrique Martín-Blanco. Polarized cortical tension drives zebrafish epiboly movements. The EMBO journal, 36(1):25–41, 2017.
- [7] Ana Carvalho, Arshad Desai, and Karen Oegema. Structural memory in the contractile ring makes the duration of cytokinesis independent of cell size. Cell, 137(5):926–937, 2009.
- [8] Michael Mak, Muhammad H Zaman, Roger D Kamm, and Taeyoon Kim. Interplay of active processes modulates tension and drives phase transition in self-renewing, motor-driven cytoskeletal networks. Nature Communications, 7(1):10323, 2016.
- [9] Pierre Ronceray, Chase P Broedersz, and Martin Lenz. Fiber networks amplify active stress. Proceedings of the National Academy of Sciences, 113(11):2827–2832, 2016.
- [10] Samantha Stam, Simon L. Freedman, Shiladitya Banerjee, Kimberly L. Weirich, Aaron R. Dinner, and Margaret L. Gardel. Filament rigidity and connectivity tune the deformation modes of active biopolymer networks. Proceedings of the National Academy of Sciences, 114(47):E10037–E10045, Nov 2017.
- [11] Maya Malik-Garbi, Niv Ierushalmi, Silvia Jansen, Enas Abu-Shah, Bruce L Goode, Alex Mogilner, and Kinneret Keren. Scaling behaviour in steady-state contracting actomyosin networks. Nature Physics, 15(5):509–516, 2019.
- [12] Tetsuya Hiraiwa and Guillaume Salbreux. Role of turnover in active stress generation in a filament network. Physical Review Letters, 116(18):188101, 2016.
- [13] William M McFadden, Patrick M McCall, Margaret L Gardel, and Edwin M Munro. Filament turnover tunes both force generation and dissipation to control long-range flows in a model actomyosin cortex. PLoS computational biology, 13(12):e1005811, 2017.
- [14] Deb Sankar Banerjee, Akankshi Munjal, Thomas Lecuit, and Madan Rao. Actomyosin pulsation and flows in an active elastomer with turnover and network remodeling. Nature Communications, 8(1):1121, 2017.
- [15] Patrick M McCall, Frederick C MacKintosh, David R Kovar, and Margaret L Gardel. Cofilin drives rapid turnover and fluidization of entangled F-actin. Proceedings of the National Academy of Sciences, 116(26):12629–12637, 2019.
- [16] Peter J Foster, Sebastian Fürthauer, and Nikta Fakhri. Active mechanics of sea star oocytes. bioRxiv, pages 2022–04, 2022.
- [17] Tanniemola B Liverpool, M Cristina Marchetti, J-F Joanny, and J Prost. Mechanical response of active gels. Europhysics Letters, 85(1):18007, 2009.
- [18] Michael P Murrell and Margaret L Gardel. F-actin buckling coordinates contractility and severing in a biomimetic actomyosin cortex. Proceedings of the National Academy of Sciences, 109(51):20820–20825, 2012.
- [19] Martin Lenz, Todd Thoresen, Margaret L Gardel, and Aaron R Dinner. Contractile units in disordered actomyosin bundles arise from F-actin buckling. Physical Review Letters, 108(23):238107, 2012.
- [20] Julio M Belmonte, Maria Leptin, and François Nédélec. A theory that predicts behaviors of disordered cytoskeletal networks. Molecular Systems Biology, 13(9):941, 2017.
- [21] Giuseppe Carleo, Ignacio Cirac, Kyle Cranmer, Laurent Daudet, Maria Schuld, Naftali Tishby, Leslie Vogt-Maranto, and Lenka Zdeborová. Machine learning and the physical sciences. Reviews of Modern Physics, 91(4):045002, 2019.
- [22] Yi Liu, Juntao Zhang, Charuku Bharat, and Juan Ren. Cellular actin cytoskeleton morphology identification for mechanical characterization using deep learning. IEEE Access, 10:97408–97418, 2022.
- [23] Chengqing Qu, Robyn Roth, Pongpratch Puapatanakul, Charles Loitman, Dina Hammad, Guy M Genin, Jeffrey H Miner, and Hani Y Suleiman. Three-dimensional visualization of the podocyte actin network using integrated membrane extraction, electron microscopy, and machine learning. Journal of the American Society of Nephrology: JASN, 33(1):155, 2022.
- [24] Jonathan Colen, Ming Han, Rui Zhang, Steven A Redford, Linnea M Lemma, Link Morgan, Paul V Ruijgrok, Raymond Adkins, Zev Bryant, Zvonimir Dogic, et al. Machine learning active-nematic hydrodynamics. Proceedings of the National Academy of Sciences, 118(10):e2016708118, 2021.
- [25] Daichi Yoshida, Kae Akita, and Takumi Higaki. Machine learning and feature analysis of the cortical microtubule organization of arabidopsis cotyledon pavement cells. Protoplasma, 260(3):987–998, 2023.
- [26] Matthew S Schmitt, Jonathan Colen, Stefano Sala, John Devany, Shailaja Seetharaman, Margaret L Gardel, Patrick W Oakes, and Vincenzo Vitelli. Zyxin is all you need: machine learning adherent cell mechanics. arXiv preprint arXiv:2303.00176, 2023.
- [27] Sydney Alderfer, Jiangyu Sun, Lubna Tahtamouni, and Ashok Prasad. Morphological signatures of actin organization in single cells accurately classify genetic perturbations using cnns with transfer learning. Soft Matter, 18(43):8342–8354, 2022.
- [28] Thomas D Pollard, Laurent Blanchoin, and R Dyche Mullins. Molecular mechanisms controlling actin filament dynamics in nonmuscle cells. Annual Review of Biophysics and Biomolecular Structure, 29(1):545–576, 2000.
- [29] Beáta Bugyi and Marie-France Carlier. Control of actin filament treadmilling in cell motility. Annual Review of Biophysics, 39:449–470, 2010.
- [30] Thomas D Pollard and John A Cooper. Quantitative analysis of the effect of acanthamoeba profilin on actin filament nucleation and elongation. Biochemistry, 23(26):6631–6641, 1984.
- [31] Bruce L Goode and Michael J Eck. Mechanism and function of formins in the control of actin assembly. Annual Review of Biochemistry, 76:593–627, 2007.
- [32] Elizabeth White. Uncovering Cellular Structures and Dynamics with Quantitative Image Analysis and Modeling. PhD thesis, The University of Chicago, 2023.
- [33] Francois Nedelec. Cytosim. https://gitlab.com/f-nedelec/cytosim, 2021.
- [34] Younan Li and Edwin Munro. Filament-guided filament assembly provides structural memory of filament alignment during cytokinesis. Developmental Cell, 56(17):2486–2500, 2021.
- [35] Mclnnes Leland, Healy John, Saul Nathaniel, and Großberger Lukas. Umap: uniform manifold approximation and projection. Journal of Open Source Software, 3(29):861, 2018.
- [36] Sebastian Fürthauer, Bezia Lemma, Peter J Foster, Stephanie C Ems-McClung, Che-Hang Yu, Claire E Walczak, Zvonimir Dogic, Daniel J Needleman, and Michael J Shelley. Self-straining of actively crosslinked microtubule networks. Nature Physics, 15(12):1295–1300, 2019.
- [37] Simon L Freedman, Cristian Suarez, Jonathan D Winkelman, David R Kovar, Gregory A Voth, Aaron R Dinner, and Glen M Hocky. Mechanical and kinetic factors drive sorting of F-actin cross-linkers on bundles. Proceedings of the National Academy of Sciences, 116(33):16192–16197, 2019.
- [38] Yuqing Qiu, Michael Nguyen, Glen M. Hocky, Aaron R. Dinner, and Suriyanarayanan Vaikuntanathan. A strong nonequilibrium bound for sorting of cross-linkers on growing biopolymers. Proceedings of the National Academy of Sciences, 118(38), 2021.